is working from home good work or bad work? evidence from
TRANSCRIPT

163AUSTRALIAN JOURNAL OF LABOUR ECONOMICS
Volume 17 • Number 2 • 2014 • pp 163 - 190
Is Working from Home Good Work or Bad Work? Evidence from Australian Employees*
A. M. Dockery and Sherry Bawa,CurtinUniversity
Abstract There is concern that workers are finding it increasingly difficult to balance work and family life and face growing time stress. Working from home is one form of flexibility in working arrangements that may assist workers to juggle work and non-work commitments. However, it may also provide a pathway for greater intrusion of work into family life and for added work-related stress. Data from the Household, Income and Labour Dynamics in Australia Survey indicates that around 17 per cent of Australian employees work some of their usual working hours from home, but there has been no increase in the incidence of employees working from home in the past decade. Overall, the ability to work some hours from home is seen by employees as a positive job attribute that provides flexibility to balance work and non-work commitments. However, working from home is also associated with long hours of work and the evidence provides grounds for concern that working from home does facilitate greater intrusion into non-work domains of life through this channel.
Keywords:Workingfromhome,Telecommuting,Jobquality
JELClassification:J22,J81,J28
Addressforcorrespondence:AssociateProfessorMikeDockery,CurtinBusinessSchool,CurtinUniversity,GPOBoxU1987,PerthWA6845,[email protected]:TheauthorswouldliketoexpresstheirgratitudetoProfessorMarkWooden,whoprovidedextensivesuggestionsonanearlierdraft.ThispaperusesunitrecorddatafromtheHousehold,IncomeandLabourDynamicsinAustralia(HILDA)Survey.TheHILDAProjectwasinitiatedandisfundedbytheAustralianGovernmentDepartmentofSocialServices(DSS)andismanagedby theMelbourne InstituteofAppliedEconomicandSocialResearch (MelbourneInstitute).Thefindings and views reported in this paper, however, are those of the author andshouldnotbeattributedtoeitherDSSortheMelbourneInstitute.*Anearlierversionofthispaperwaspresentedatthe2013/14ALMRWorkshopattheUniversityofMelbourneinFebruary2014.©TheCentreforLabourMarketResearch,2014

164AUSTRALIAN JOURNAL OF LABOUR ECONOMICSVOLUME 17 • NUMBER 2 • 2014
1. Introduction Therehasbeengrowinginterestfrompolicymakersandsocialresearchers,notablywithin theEuropeanUnion, in the issueof thequalityofworkandwhatfeaturesofworkcharacterise‘goodjobs’and‘badjobs’.Acommonperceptionisthatthequalityofworkhasbeendecliningovertimeasworkershavehadtobecomemoreflexible and to give up standard working arrangements and conditions for moreprecariousemployment.
Among key concerns on the job quality agenda are the number of hoursworkedandtheabilityforworkerstobalanceworkandfamilylife.StudiessuggestthatAustraliaandotherdevelopingcountrieshaveobservedagrowingincidenceofnon-standardworkingtimearrangements,inwhichemployeesworkhoursoutsideatypicalMondaytoFridaydaytimeschedule(Krahn,1995;Li,et al.,2014;Stone,2012).This is often seen as a response to demand side (firm) factors associatedwith theemerging‘24/7economy’,globalisationandderegulation,butalsoreflectssupplysidepreferencesofworkers,notablyastheincreasedlabourforceparticipationofwomenleadstogreaterfrictionbetweenworkandfamilycommitments.Arelatedpotentialshiftinworkingpatternsthathasreceivedlessattentionisforemployeestoworksomehoursfromtheirhome.Aswithnon-standardworkhours,sucharesponseinworkpatternscanbeadouble-edgedsword,providingbothincreasedflexibilityforworkerstomanage theirworkandnon-workschedules,butalso increasing thecapacity forworktimeandwork-relatedstresstoimpactuponfamiliesandleisure.Thismayhaveimplicationsforpolicyandforfirms’humanresourcepractices.
Given reports of the increasing importance of such flexible workingarrangements,thereislackofevidenceonwhetherworkingfromhomeisgoodworkor a badwork.Gajendran, et al., (2007) note that reviews of the last two decadesof research have been inconclusive on whether telecommuting is good or bad foremployees.InthecaseofAustralia,onlyonerecentstudywasidentified(WoodenandFok,2013).Concentratingon‘home-workers’(whoworkedthemajorityoftheirhoursathome),thatstudyfoundthatonlyaround5percentofworkerscouldbeclassifiedas‘homeworkers’andthatthetrendinworkingathomeappearedtohaveactuallydeclinedovertheperiod2001-2010.
UsingdatafromtheHousehold,IncomeandLabourDynamicsinAustraliaSurvey,thispaperexplorestheextentofworkundertakenfromthehomebyemployeesinAustralia and key characteristics of thatwork. Following a review providing abackgroundtotheissues,section3looksattheincidenceofemployeesworkingfromhomeinAustralia,howthathaschangedsince2001andwhoaremostlikelytoworkfromhome.Section4presentsevidenceonthefinancialrewardstohoursworkedathome,andinsection5weassesswhetheremployeeswhoworkfromhomeviewtheirjobsanymoreorlessfavourablythanworkerswhodonotworkfromhomeintermsof the ability to balancework and non-work commitments, satisfactionwith hoursworkedandoveralljobsatisfaction.Inthefinalsectionwesummarisetheevidence,concluding there isnostraightforwardanswer to thequestionproposed in the title.Theability towork fromhome isgenerallyapositiveattributeofa job,but it is acautionarytaleandcontextsareimportant.

165A. M. DOCKERY AND SHERRY BAWA
Is Working from Home Good Work or Bad Work? Evidence from Australian Employees
2. Literature review Theissueofthequalityofworkhascapturedtheattentionofpolicymakers,notablyintheEuropeanUnioncountrieswhereimprovingjobqualityhasbecomeanexplicitpolicyobjective(see,Burgess,ConnellandDockery,2013,forarecentreview).Inthetheoreticalworldofperfectlyfunctioninglabourmarketsdifferencesinjobattributesthat impactuponworkerwellbeingmaynotbeanissue:compensatingdifferentials(suchaswagedifferences)wouldexactlyoffsetotherattributesof jobs, so that thevalueworkersplacedonthepecuniaryandnon-pecuniaryaspectsofjobsequatedtoreflectworkerandemployerpreferencesinequilibrium.Intherealworld,however,thereareanumberofreasonstoexpectthatmarketsmaydeliversub-optimaloutcomesandreasonsforjobqualitytobeconsideredanimportantsocialandpolicyissueinadditiontothestandardmarketimperfectionargumentsofasymmetricinformationandbargainingpower.
Importantamongthesearethebalancebetweenworkandfamilylife. Itiswellestablishedthattherearespillovers(externalities)betweenworkandnon-workdomains extending beyondworkers’ ownwellbeing and health to thewellbeing ofotherfamilymembers(Li,et al.,2014).Theconsequencesofsomeworkpatterns,suchasthelong-termeffectsofworkingnightshiftsarenotwellunderstood.Therearegrowingconcernsaboutthephenomenonof‘overwork’(Cassells,GongandDuncan,2011; Schor, 1992; Williams, Pocock and Skinner, 2008) and inequality betweentheunemployed/underemployedand thoseworking longhours,or thedivide in thedistributionofworkbetweenhouseholds.Thereareanumberofreasonstosuspectthatworkersmayseektoworkmorehoursthanisoptimal:theymaysystematicallyoverestimate the utility gained from added income and status and underestimateintrinsicbenefitgainedfromnon-workactivities,suchastimewithfamilyandfriends(Dockery,2012;Frank,1999;Frey,2008,pp.127-137).Finally,thereisconsiderableuncertainty regarding the productivity effects ofwork quality,meaning significantwelfaregainsforbothemployersandemployeesmaybegoingunrealised(Burgess,et al.,2013,pp.12-13).
Itisthereforeimportanttoknowwhattheattributesof‘goodjobs’and‘badjobs’are.Increasedflexibility–orthegrowthofnon-standardworkingarrangementsand schedules–hasbeenhighlightedasbothapositiveandnegative trend in jobquality.Working fromhome is one of these forms offlexibility. Telecommuting,as it is referred to in theUnitedStates, teleworking,as it is referred to inEurope,home-working, working-at-a-distance, off-site workers, or remote workers are alltermsthatareusedtoconveytheideathatworkissomethingyoudo,notsomeplaceyougo(Baruch,2001).Therehasbeenagrowingtrendofprovidingflexibleworkingarrangements at the workplace with an intention to allow workers to continueproductivecontributionstotheworkforcewhilealsoattendingtofamilyandotherresponsibilities (Council of Economic Advisors, 2010), increasing productivity(KurlandandBailey,1999;Bloom,et al.,2013;CouncilofEconomicAdvisors,2010),reduceabsenteeismandturnover,toimproveworkers’health(CouncilofEconomicAdvisors, 2010), to help employees balancework and family demands (Galinsky,et al., 2008), discretion in determining the timing, pace and location at whichrole requirements are met (Greenhaus and Powell, 2006), lowering work-family

166AUSTRALIAN JOURNAL OF LABOUR ECONOMICSVOLUME 17 • NUMBER 2 • 2014
conflict(GajendranandHarrison,2007;ThomasandGanster,1995),increasingjobsatisfaction(Baltes,et al.,1999;Allen,2001)andtoreducetrafficcongestionontheroads/reducecommutetime(KurlandandBailey,1999).
However, thesealternativeworkformsbringbothbenefitsandchallengestoorganisations,individualsandsociety.Criticalamongthesefromthefirmperspectivearetheimpactsonproductivityandcosts,uponwhichthereisonlylimitedevidence(Bloom,et al., 2013;Kurland andBailey, 1999).The following reviewconcentratesonstudiesoftheimpactofworkingfromhomefromtheemployee’sperspective,andrevealsthatthereisnoconsensusonwhetherworkingfromhomeisagoodworkorbadworkforemployees.Whentheworkplace ismovedinto thehomeenvironment,it is argued that there is thedual potential to exacerbate conflict, or tominimize itthroughincreasingworkscheduleflexibility(Doherty,et al.,2000;KurlandandBailey,1999;BostonCollegeCenterforWorkandFamily,2012),toresultinlongerworkinghours(KurlandandBailey,1999),careerstagnationandadverseeffectonemployees’performance(BaruchandNicholson,1997;Bloom,et al.,2013),andfeelingsofsocialisolation(KurlandandBailey,1999;Bloom,et al.,2013;BostonCollegeReport,2012).
Workingfromhomemayhaveimpactsonfamilyfunctioningthroughtimespentonchildren,thequalityofrelationships,thehomeenvironmentandotherfamilyobligations. It impacts upon work life balance when work interferes with familyresponsibilities,when overworking affects employees’ social networking, and theirbalance between work and personal life. Duxbury and Higgins (2002) note thattelecommutingcanincreaseconflictbetweenworkandfamilywhen:employeeswhoworkathomespendagreater,ordisproportionate,percentageoftheirtimeonpaidworkactivities; flexibility gained through telecommuting benefits thework organizationbutnottheemployee’sfamily;commutingservesasabufferbetweentheemployee’shomeandworkdomains,and the lackofacommutedecreases theopportunity foremployeestoreducethetransferofstressfromonedomaintotheother.
IntheUStherehasbeenconsiderablefocuson‘telework’or‘telecommuting’.Gajendran, et al., define telecommuting as ‘…an alternative work arrangement inwhich employees perform tasks elsewhere that are normally done in a primary orcentralworkplace…usingelectronicmediatointeractwithothersinsideandoutsidetheorganization’(2007,p.1525). Althoughworkersmaytelecommutefromplacesother than thehome,andhomeworkneednotnecessarily involveelectronicmedia,Gajendran,et al.,(2007,p.1524)acknowledgetelecommutingasthemostcommonformof ‘flexiblework locations’, and clearly there is considerable commonality inassociatedissues.Telecommutingisarguedtoincreasethepermeabilityofboundariesin life domains and the degree towhich either family orwork encroaches on theotherbecause theyoccupy thesameplaceand,potentially, thesame time,possiblyleading to work–family conflict. Such permeability can also make psychologicaldisengagement from work more difficult, increasing the likelihood of time-basedconflictleadingemployeestoworkafternormalworkhoursandthismaybeespeciallytrueforindividualswhofinditdifficulttoseparateactivitiesbetweenhomeandwork(Gajendran,et al.,2007).
InastudyfortheUK,Felstead,et al.,(2000)providedevidencethatworkingfromhome can significantly raise the probability of being low paid. There is also

167A. M. DOCKERY AND SHERRY BAWA
Is Working from Home Good Work or Bad Work? Evidence from Australian Employees
evidencethatemployeeswhoworkfromhomeworklongerhours.Anestimated42percentofAmericantelecommuterswork50to75hoursperweekandone-halfofEuropeantelecommutersworkmorethantenextrahoursperweek(Doherty,et al.,2000;Pratt,1999;Empirica,1999).AccordingtotheBostonCollegeCenterforWork&Family,46percentoftelecommutersworkedwhileonvacationascomparedto34percentoftraditionalofficeworkers.Inaddition,only24percentoftelecommutersrated theirwork/life balance as ‘good’ or ‘very good’ compared to 26 per cent oftraditionalworkers,and38percentofthoseusingdailyflextime(theabilitytoalterworking hours on a daily basis). These results would imply that telecommutingdoes not necessarily lead to greater feelings ofwork/life balance (BostonCollegeReport,2012).However,thatsamereportfindsthatmanyemployeesseeflexibleworkarrangementssuchastelecommutingasaprivilegeratherthanasawayofworking.
For Australia, Lafferty, et al., (1997) looked at the trends and difficultiesfacing homeworkers and found that increasing numbers of homeworkers are alsobecomingmarginalised,asshownbylow(anddeclining)ratesofunionmembership,high levelsofcasualisationand low levelsofaccess to industrialbenefits.Coupledwiththeexistenceofalargeinformalorillegalhomeworkinglabourforce,theyarguethatthisindicatedthegrowthofasubstantialperipheryofhomeworkers,characterisedby insecurity andpoorpay and conditions.Asnoted above, however,WoodenandFok’s (2013)more recent study does not suggest any increase in the incidence ofhomeworkinginAustraliabetween2001and2010.
3. Australians working from home This section presents descriptive data on the incidence of working from home inAustraliaandtrendsinhomeworkingoverthepastdecade.Afirststepistodecideupon the empirical constructs that appropriately capture the act of ‘working fromhome’ as we conceive of it for the purposes of the research questions posed. Amultivariateanalysisispresentedtoexplorethecharacteristicsofpeopleandjobsthatareassociatedwithworkingfromhome.
Data and definitions ThedatausedinthisstudycomefromtheHousehold,IncomeandLabourDynamicsinAustraliaSurvey. HILDAisahouseholdpanelsurveyinwhichrespondentsaretrackedandinterviewedeachyear.ThepanelwasestablishedthrougharandomsampleofprivatehouseholdsinAustralia,andwithinthosehouseholdsallpersonsaged15andoverareinterviewed.ThebulkofinterviewsareconductedbetweenSeptemberandDecembereachyearand, at the timeof this analysis,data fromelevenwaves,spanning2001to2011,wereavailable.Around13,000individualsfromover7,000householdshaverespondedineachyear,withyear-on-yearattritionratesaveragingbelow10percent(seehttp://www.melbourneinstitute.com/hilda/forfurtherdetails).
HILDAcollectsawealthofdataonrespondents’demographiccharacteristics,theirpersonalandfamilycircumstancesandonthenatureoftheiremployment.Thesample used for analysis is restricted to employed persons aged 15 and over whowereemployees(asopposedtoemployers,self-employedorunpaidfamilyhelpers),reflecting thatourkey interest is in theconsequencesofemploymentarrangements

168AUSTRALIAN JOURNAL OF LABOUR ECONOMICSVOLUME 17 • NUMBER 2 • 2014
madebetweenfirmsandemployees. This results ina total sampleover theelevenwavesof78,383person-yearobservationsonanunbalancedpanelof17,002individualsforwhichworkingfromhomestatuscouldbedetermined.1
Each year persons in paid employmentwere asked the following question:‘Areanyofyourusualworkinghoursworkedatyourhome(thatis,theaddressofyourusualplaceofresidence)?’withtheoptiontorespondeither‘yes’or‘no’.Employeeswho answered in the affirmativewere then asked approximately howmany hourseachweektheyusuallyworkfromhome.Forthosewhoindicatedtheirhoursvaried,theywere prompted instead ‘Howmany hours perweek do youwork at home onaverageoverausualfour-weekperiod?’.Finally,thehomeworkerswereasked‘Arethehoursworkedfromhometheresultofaformalarrangementwithyouremployer?’.2Respondentsarespecificallyinstructedtoincludeanypaidorunpaidovertimeintheirreckoningof‘usualhours’,withanaddednotethatthisincludeshoursworkedbothathomeandattheworkplace.Forpersonswhoheldmultiplejobs,thewordingmadeclearthattheresponsesshouldrelatetotheirmainjob,definedastheonefromwhichtheygetthemostpayeachweek.
Forthepooledobservationsacrossall11wavesfrom2001to2011,16.4percentofemployeesindicatedtheyworkedsomeoftheirusualhoursfromhome.AsWoodenandFok(2013)note,manypeoplewhoreportworkingsomeoftheirusualhoursfromhomealsoreportworkingonlyafewhoursthereeachweek,andquestionwhether these people should really be considered ‘homeworkers’ as such. Theirpreferreddefinitionofhomeworkers is thosewhoworkthemajorityof theirhoursintheirmainjobfromhome.WhileWoodenandFok’s(2013)maininterestwasinmeasuring the number of homeworkers, the focus here is instead upon the degreeto which employees’ work and home lives overlap, and whether this flexibility isgenerallybeneficial to theworker. Sowhileweare interested inallhoursworkedfromhome,wealsotestthesensitivityofthefindingsbyconditioningonthenumberofhoursworkedfromhome.
Amongtheemployeeswhoworksomeoftheirhoursfromhome,almostone-quarter(23percent)reportworkingjustoneortwohoursathomeeachweek,andthemajority(56percent)reportedworkingfivehoursorfewerfromhomeeachweek(seefigure1).Spikesinthedistributionareevidentatfive,eightandtenhours,whichmaybeattributedtoroundinginthecaseoffiveandtenhours,andeighthoursmarkingafullday’swork.Thereforethesensitivityofthefindingstothedefinitionofworkingfrom home is tested by comparing results for thosewhowork any hours at homewithresultsforthosewhoworkeighthoursormoreperweekinthehome(thelatterrepresenting30percentoftheformer).
1 The sample available formultivariate analyses is lower due to non-response for some of thevariables.2ThiswasthesequenceofquestionsforWaves2to11.TheorderandwordingofthesequestionswereslightlydifferentinWave1.InWave1thequestiononwhetheranyhoursareworkedathomewasfollowedbythequestiononwhether thiswastheresultofaformalarrangement,andthenthequestionsonthenumberofhours.Forthosewhoindicatedthenumberofhourstheyworkedfromhomevaried,thefollowupquestionwas‘Thinkingaboutthelastmonth,howmanyhoursonaveragehaveyouworkedfromhomeeachweek?’.

169A. M. DOCKERY AND SHERRY BAWA
Is Working from Home Good Work or Bad Work? Evidence from Australian Employees
Figure 1 - Number of hours worked in the home per week: distribution among employees who work from home
The incidence of working from home In the pooled sample, 16.4 per cent of employees indicated they worked some oftheirusualhoursfromhomeand5.9percentofemployeesworkedeighthoursperweekormorefromhome.3Theproportionofwomenworkinganyhoursfromhomewasmarginallyhigherthanformen(16.7percentversus16.1percent),aswastheproportion doing eight hours or more (6.1 per cent versus 5.7 per cent), and bothdifferencesarestatisticallysignificant(at the5percent level). For thosedoingso,theestimatedaveragehoursworkedinthehomewasquitesubstantialat7.7hoursperweek–essentiallyafullday’swork.Onaverage,menreportworkingmorehoursfromhome(7.9hoursperweek)thanwomen(7.5hours).
Incontrasttotheimpressionpaintedinmuchoftheinternationalliteratureofagrowingintrusionofworkintofamilylife,thedatashownoevidenceofanincreasein the incidence ofworking from home between 2001 and 2011. If anything, theproportionworkinganyhours fromhomehas fallen,while theproportionworkingeight hours ormore fromhomehas remainedflat. This holds for bothmales andfemales,andtheproportionofmenworkingfromhomeseemedtofallfollowingtheglobalfinancialcrisisof2008(seefigure2).Therealsoseemsnoobvioustrendintheaveragehoursworked,thoughaspikeoccursfor2009whenanaverage8.5hoursworkedfromhomeperweekwasreported.Thismayreflectsomeemployeesusuallyworkingonly a fewhours fromhome ceasing towork fromhome at all followingtheGFC.Theabsenceofanyupwardtrendintheincidenceorintensityofworkingfromhomeconcordswithevidencepresented inWoodenandFok(2013),aswouldbeexpectedgiventheanalysesarebasedonthesamedata.WoodenandFok(2013)note that theABSLocationofWorkSurveyalso indicatesadeclining trend in theproportionofAustraliansworkingfromhome.
As expected, there are significant differences in the incidence of homeworkingacrossoccupationsandindustry.Forbothmanagersandprofessionals,the
1816
8
01
Hours worked per week2 3 4 5 6 7 8 9 10 11-15 16-20 21+
2
141210
64Pe
r cen
t of e
mpl
oyee
s
3Allmeansandproportionspresentedinsection3.2arecalculatedusingtheHILDAprovided‘respondingpersonpopulationweight’.

170AUSTRALIAN JOURNAL OF LABOUR ECONOMICSVOLUME 17 • NUMBER 2 • 2014
proportionworkingfromhomeis36percent,whileforallotheroccupationalgroupsitisbelow10percent.Similarly,managersandprofessionalsaremuchmorelikelytoworktheequivalentofafulldayormoreperweekfromhome.Acrossindustriesitisemployeesintheeducationandtrainingsectorwhohavebyfarthegreatesttendencytoworkhoursfromhome(51percent)andwhoarethemostlikelytodoeightormorehoursofworkfromhome.
Figure 2 - Proportion of Australian employees working from home; 2001-2011
Notes:WFH-worksfromhome;WFH8hrs–works8hoursormoreperweekfromhome.Source:HILDA.
Who works from home? Of course differences across industries may be attributable to the occupationalstructureandgendercompositionwithin those industries, andviceversa. Inordertoidentifyindependentfactorsthatcontributetotheobservedincidenceofworkingfromhome,multivariatelogitmodelsareestimatedoftheprobabilitythatanemployeeworksanyoftheirusualhoursfromhome,andoftheprobabilitythattheyworkeightormorehoursfromhomeeachweek.Wealsonotethatin2010and2011individualswereaskedwhetherornottheyhadaccesstotheinternetathome.Justunder93percentofpersons reportedhavingaccess,andaswouldbeexpected the incidenceofworkingfromhomewassubstantiallygreaterforthoseon-line(17percentcomparedto6percentforthosewithouttheinternetathome).However,homeinternetaccessisnotincludedinthemultivariateanalysisbecauseofthelikelihoodthatitisendogenous.
Panelmodelsareestimated toutilise thefact that thedata represent repeatobservationsonindividuals.4Theresultsreportedinthemainbodyofthepaperarefor
20.0
16.0
8.0
0.02001 2002 2003 2004 2005 2006 2007 2008 2009 2010 2011
2.0
14.0
12.0
10.0
6.0
4.0
Per c
ent o
f em
ploy
ees
18.0
WFH - female WFH - maleWFH8hrs - female WFH8hrs - male
4 Specifically, theXTLOGIT procedure in STATA,with vce(robust) option to generate robuststandarderrors.

171A. M. DOCKERY AND SHERRY BAWA
Is Working from Home Good Work or Bad Work? Evidence from Australian Employees
randomeffectsmodels,withthosefromtheequivalentfixedeffectsmodelsreportedintheappendices.GivenargumentsthatthereasonsAustraliansworkfromhomevarybetweenmenandwomen(PowellandCraig,2013),separatemodelsareestimatedbygender.Theresultsarereportedintheformofoddsratios,whichshowtheestimatedeffectof avariableon theprobabilityofworking fromhome relative to itsdefaultcategory.Aratioofunityindicatesnodifferencebetweenthetwocategories.Inthefirstmodel,forexample,thecoefficientof1.129for45-54yearoldfemalesindicatesthattheyareestimatedtobe12.9percent(thatis1.129-1=0.129)morelikelytoworkfromhome than theomitted categoryofwomenaged35 to44years. In contrast,womenbetween24and34areestimatedtobe17.7percentlesslikelytoworkfromhome(thatis,0.823-1=-0.177).Allvariableshavebeendefinedincategoricalformforconvenienceofinterpretation,althoughenteringsomeinlinearandquadraticformsprovedtobetechnicallysuperiorspecifications.
Theresultsindicatethatthelikelihoodofworkingfromhomeincreaseswithage. It ismarkedlyhigherforwomenemployeeswitharesidentchildagedzerotofouryearswhethertheyaremarriedorsingle,andtoalesserextenttheyoungestchildbeingaged5-14.5Thepresenceofchildrenhasalesserimpactonmarriedmen’sworklocations.Theresultsforsolefathersarenotsignificant,whichislikelytoreflectthelowsamplenumbersforsolefathers.
Characteristicsofanindividual’semploymenthaveamajorimpactupontheincidence of working from home. Compared to permanent employees, fixed termemployees aremore likely towork from home,while casuals are between 20 percentand45percent less likely towork fromhome.Thoseemployedunder ‘other’contractualarrangementsarearoundthreetimesmorelikelytoworkfromhomeandfourtimesmorelikelytodoextendedhoursfromhome,butwesuspectthisresultsfromablurringbetweenthedefinitionof‘employee’andthosewhoare‘ownaccount’workerstosomeextent,suchasemployeespaidoncommissionorpossiblycontractorsorconsultants.Relativetoemployeesintheprivatesector,governmentemployeesarelesslikelytoworkfromhome.Theeffectisstrongerforwomen,withnostatisticaldifferenceobservedbetweensectorsformenworkingeightormorehoursperweek.
The incidence ofworking fromhome increaseswith the employees’ lengthoftenurewiththeircurrentemployer,thoughtheeffectisstrongerinthemodelsforanyhoursworkedfromhome. Nosignificantvariationbytenureisobservedinthelikelihoodofmenworkingeightormorehoursperweekfromhome.Intermsofhoursworked,theincidenceofworkinganyhoursathomefollowsaUshape.Thedefaultcategoryisthoseworkingbetween31and38hours,whichincludesthemostcommonstandardfull-timeworkingweeksofa35houror37.5hourweek.Comparedtothese‘standardfull-time’workers,peoplewhousuallyworkpart-timeandpeoplewhoworklongerhoursaremorelikelytodosomeoftheirhoursfromhome.Theassociationisverystrongforthoseworkinglong(45-54)andverylong(55ormore)hoursperweek.Adifferentrelationshipisobservedfortheprobabilityofworkingeighthoursormoreperweekfromhome.Inthiscasethelikelihoodincreasessteadilywithhoursworked6,withanevenmorepronouncedassociationofworkinglongorverylonghours.5Thevariablesforthepresenceofchildrenarebasedonthepresenceandageoftherespondent’sownresidentchildreninthehousehold.6Inpartthiswillbesimplydefinitional,inthatpart-timeworkerswhoworklessthaneighthoursperweekcannotworkeightormorehoursathome.

172AUSTRALIAN JOURNAL OF LABOUR ECONOMICSVOLUME 17 • NUMBER 2 • 2014
Unionmembersaresubstantially less likely toworkanyhoursorextendedhours from home. The occupation dummies confirm that it is professionals andmanagersthataremostlikelytoworkfromhome.Theincidencesareanythingfrom35percentto95percentlowerforallotheroccupations.Asthedescriptivestatisticsimplied,employees in theeducationand trainingsectoraremuchmore likely thanthoseinhealthcareandsocialassistanceservices(theomittedcategory)toworkfromhome after controlling for occupational structure and the other job and individualcharacteristics. Ahigher incidenceofworkingfromhomefor those inagriculture,forestryandfishingmayagainreflectthatsomepeopleliveonthepropertieswheretheywork,asinthecaseoffarms,oranoverlapbetweenemployeeandownaccountworkers. Consistent with this, the effect is greatly accentuated in themodels forworkingeighthoursormorefromhome.Asmaybeexpectedgiventherequirementfor customer contact, the retail trade industry andhospitality (accommodation andfoodservices)havethelowestincidenceofhomeworkers.
Theresultshelptogivesomeindicationofwhetherornotworkingfromhomereflectsemployees’preferences.Generally,characteristicsofemployeesthatwouldbeexpected to be associatedwith higher statuswithin an organisation andwithin thelabourmarketmoregenerally–beinginaprofessionalormanagerialjob,beingmoresenior in age, not being a casual, having longer tenurewith the employer – are allassociatedwithbeingmorelikelytoworkfromhome.Theseassociationssuggestbeingable towork fromhome is a valued job attribute. In addition,we can surmise thatemployeeswithyoungerchildrenaremorelikelytowanttobeabletoworksomeoftheirhoursfromhome,tohelpinjugglingcaringresponsibilities.Theobservedresultsareconsistentwithsuchpreferencesbeingaccommodated,atleasttosomeextent.
Generally,variableshavesimilarestimatedimpactsonthelikelihoodofanemployeeworkinganyhoursfromhomeandofanemployeedoingamoresubstantialnumberofhoursfromhome.Thesalientdifferences,asnoted,arewithrespecttotenurewiththecurrentemployer,workingintheagriculture,forestryandfishingindustry,and thenumberofhoursworked in totaleachweek. Thefindings relating to totalworkinghours–thatworkinglongerhoursinthehomeincreasesdisproportionatelywithtotalhoursworked–aresuggestiveofworkingfromhomeprovidingapathwayfor jobs to intrudeuponhome life. Womenwhowork55hoursormoreperweekareestimatedtobeninetimesmorelikelytodoanyoftheirhoursinthehome,but21timesmorelikelytoworktheequivalentofafulldayormoreinthehome.Thecomparablefiguresformenare,respectively,sevenand11timesmorelikely.
Finally,theinfluenceofbeingaunionmemberistoreducethelikelihoodofworkingfromhome.Ifonebelievesthatunionsacttoprotectemployees’conditionsofemploymentand increase theirmembers’bargainingpowerwith theiremployer,thenthispointstotheconclusionthatworkingfromhomeissomethingthatdetractsfromthequalityofworkingconditions:somethingemployeesare‘protected’againstbytheirunion.Analternativehypothesisisthatunionsdiscourageworkingfromhomebecause it undermines their ability tomobilise and recruitworkers asmembers. Itshouldbenotedthattheunioneffectisnotsignificantintheequivalentfixed-effectsmodels,buttheotherkeyresultsarelargelyinsensitivetoestimationbyrandomeffectsversusfixedeffectsspecifications(seeappendixtableA1).

173A. M. DOCKERY AND SHERRY BAWA
Is Working from Home Good Work or Bad Work? Evidence from Australian Employees
Table 1 - Probability of working any hours from home, and of working eight or more hours from home, Australian employees, results from random-effects logit models, by gender, 2001-2011
Women Men WFH - any hours WFH 8+ hrs/wk WFH - any hours WFH 8+ hrs/wk Odds Odds Odds Odds Ratio P>|z| Ratio P>|z| Ratio P>|z| Ratio P>|z|Constant 0.038 0.00 0.004 0.00 0.048 0.00 0.005 0.00Age(years) 15to24 0.336 0.00 0.349 0.00 0.370 0.00 0.480 0.00 25to34 0.823 0.03 0.693 0.00 0.720 0.00 0.678 0.01 35to44 — — — — 45to54 1.129 0.16 1.170 0.20 1.093 0.30 1.458 0.01 55to64 1.093 0.48 1.076 0.68 1.248 0.07 2.292 0.00 65plus 1.249 0.44 1.587 0.29 1.226 0.42 3.162 0.00Familystatus Marriedwithnokids 1.389 0.00 1.312 0.05 1.248 0.02 1.177 0.24 Married&youngest child0-4 2.858 0.00 3.360 0.00 1.471 0.00 1.384 0.03 Married&youngest child5-14 1.970 0.00 1.759 0.00 1.498 0.00 1.397 0.03 Married&youngest child15-24 1.261 0.07 1.554 0.02 1.081 0.56 1.057 0.76 Singlewithnokids — Single&youngest child0-4 2.285 0.00 2.684 0.00 1.231 0.20 1.080 0.78 Single&youngest child5-14 1.543 0.00 1.625 0.01 1.265 0.21 1.211 0.57 Single&youngest child15-24 0.954 0.77 0.707 0.17 0.627 0.09 0.596 0.28Hasdisability 1.146 0.06 0.954 0.68 1.014 0.85 1.010 0.93Employmentcontract: Fixedterm 1.298 0.00 1.468 0.00 1.166 0.05 1.153 0.24 Casual 0.720 0.00 0.831 0.20 0.555 0.00 0.616 0.01 Permanentorongoing — — — — Other 3.372 0.00 4.622 0.00 2.675 0.00 3.837 0.00Sector Private,forprofit — — — — Private,not-for-profit 1.131 0.25 1.167 0.31 1.575 0.00 1.323 0.16 Governmententerprise 0.714 0.01 0.652 0.03 0.773 0.05 0.960 0.83 OtherGovernment 0.842 0.08 0.964 0.80 0.950 0.65 1.003 0.99 Other 1.505 0.02 1.567 0.12 2.174 0.00 1.943 0.02Tenurewithcurrentemployer 1yearorless — — — — 2to5years 1.370 0.00 1.057 0.55 1.323 0.00 1.058 0.56 6to10years 1.613 0.00 1.232 0.10 1.344 0.00 1.162 0.25 11ormoreyears 1.702 0.00 1.316 0.06 1.716 0.00 1.096 0.50Hoursusuallyworkedinmainjob 1to15hoursperweek 1.201 0.10 0.512 0.00 2.394 0.00 0.587 0.11 16to30hoursperweek 1.144 0.09 0.831 0.17 2.066 0.00 1.662 0.03 31to38hoursperweek — — — — 39to44hoursperweek 1.930 0.00 1.661 0.00 1.713 0.00 1.629 0.00 45to54hoursperweek 4.885 0.00 4.701 0.00 4.084 0.00 3.661 0.00 55ormorehoursperweek 9.244 0.00 21.230 0.00 6.996 0.00 11.188 0.00

174AUSTRALIAN JOURNAL OF LABOUR ECONOMICSVOLUME 17 • NUMBER 2 • 2014
Table 1 - Probability of working any hours from home, and of working eight or more hours from home, Australian employees, results from random-effects logit models, by gender, 2001-2011 (continued)
Women Men WFH - any hours WFH 8+ hrs/wk WFH - any hours WFH 8+ hrs/wk Odds Odds Odds Odds Ratio P>|z| Ratio P>|z| Ratio P>|z| Ratio P>|z|Union/employeeorg.member 0.865 0.04 0.859 0.14 0.807 0.00 0.745 0.01Occupation Manager 1.123 0.24 0.999 0.99 0.958 0.61 0.836 0.15 Professional — — — — Technician/tradesperson 0.192 0.00 0.146 0.00 0.184 0.00 0.137 0.00 Community/pers. servicesworker 0.274 0.00 0.284 0.00 0.278 0.00 0.276 0.00 Clerical/administration 0.311 0.00 0.449 0.00 0.354 0.00 0.295 0.00 Salesworker 0.350 0.00 0.456 0.00 0.557 0.00 0.640 0.04 Machineryoperator/driver 0.081 0.00 0.126 0.00 0.043 0.00 0.043 0.00 Labourer 0.108 0.00 0.086 0.00 0.104 0.00 0.110 0.00Industry Agric.,forestry,fishing 4.705 0.00 18.685 0.00 2.470 0.00 4.312 0.00 Mining 0.773 0.57 1.426 0.59 0.831 0.40 0.727 0.39 Manufacturing 1.218 0.26 2.850 0.00 0.771 0.11 1.045 0.87 Electricity,gas,water 0.962 0.95 0.864 0.83 1.019 0.94 0.671 0.39 Construction 2.662 0.00 5.796 0.00 1.249 0.19 1.248 0.45 Wholesaletrade 2.071 0.00 2.125 0.02 1.788 0.00 1.780 0.06 Retailtrade 0.564 0.00 0.309 0.00 0.526 0.00 0.697 0.25 Accommodation/food 0.634 0.02 0.680 0.24 0.658 0.05 0.772 0.49 Transport&storage 2.503 0.00 2.495 0.01 1.131 0.53 0.860 0.62 Informationmedia/ telecoms 1.546 0.04 2.096 0.02 2.061 0.00 2.483 0.01 Finance&insurance 1.016 0.93 1.350 0.32 1.907 0.00 2.550 0.00 Rent,hiring,realestate 2.266 0.00 2.123 0.08 2.532 0.00 2.702 0.02 Professionalservices 2.361 0.00 2.784 0.00 2.476 0.00 3.809 0.00 Adminsupportservices 1.264 0.23 2.234 0.01 0.972 0.91 1.867 0.13 Publicadmin 1.054 0.73 0.986 0.95 0.873 0.39 0.719 0.22 Education&training 7.990 0.00 7.747 0.00 7.529 0.00 9.942 0.00 Healthcare/social assistance — — — — Arts&recreation 1.483 0.13 1.561 0.27 1.925 0.01 2.894 0.01 Otherservices 2.155 0.00 4.343 0.00 1.364 0.13 2.837 0.00Observations 39016 39016 38928 38928Individuals 8532 8532 8424 8424Obs./person 4.6 4.6 4.6 4.6
WaldChi-sq. 2892 0.00 1413 0.00 2858 0.00 1386 0.00Logpseudo-likelihood -11322 -5660 -11109 -5442

175A. M. DOCKERY AND SHERRY BAWA
Is Working from Home Good Work or Bad Work? Evidence from Australian Employees
Thesimplefrequenciespresentedaboveshowwomenaremorelikelythanmentoworkfromhome.ThesameresultwasobservedfortheUKbyFelsteadet al.,(2000).Genderdifferenceswereexploredfurtherbyestimatingsimilarmodelsformalesandfemalesjointlywiththeinclusionofadummyvariablecapturinggender(notreported).Thisrevealedthatoneofthekeyfactorsdrivingthelowerincidenceofworkingfromhome formales is the sharper increase in hoursworked in the homebywomen astotalhoursworkedincrease.Thisoffsetsgenderdifferencesintheoccupationalandindustrialstructureofemploymentwhich,allthingsbeingequal,wouldcontributetoanincreasedlikelihoodofmalesworkingfromhomerelativetowomen.
4. Is home work well paid? Toassessthefinancialpay-offthatworkersreceiveforhoursspentworkingathomeastandardMincerwageequationwasestimatedinwhichthedependentvariableisthelogofrealhourlywagesearnedintheemployee’smainjob.7Theinclusionofadummyvariable indicating that the individualworks someof theirusualhours fromhomeprovidesanestimatedcoefficientthatisessentiallyzeroandcompletelyinsignificant,indicatingthatthereisnowagedifferentialassociatedwithworkingfromhome(seetable2).Limitingthedefinitionofthe‘works-at-home’dummytoonlythoseworkingeighthoursperweekormorefromhomereturnsanegativeandsignificantcoefficient.Theresultsuggeststhatemployeeswhoworkasubstantialnumberofhoursfromhomeearnaroundeightpercentlowerhourlywages,andthisdifferentialissimilarformenandwomen.
Hourly wages in this specification are calculated by dividing the HILDAderivedvariablefor‘currentweeklygrosswagesandsalary’byusualweeklyhoursworked,bothdefinedfortheemployee’smainjob.Notethatthisplacesthenumberofhoursworkedontheleft-handsideoftheestimatedequation,whereitactsasthedenominator.Given(1)thatmanyworkersarenotpaidbythehourand(2)thesharpincreaseintheincidenceofworkingfromhomeasthetotalnumberofhoursworkedincreasesbeyondatypicalfull-timeworkingweek,thiscouldmisrepresenttheimpactonoverall earnings. Restricting the sample to full timeemployees andestimatingmodelsforthelogofweeklywagestellsaverydifferentstory.Workingfromhomeisthenestimatedtobeassociatedwitharoundfourpercenthigherweeklywagesformenand3.5percenthigherweeklywagesforwomenwhoworkanyhoursinthehome.Howeverthatpremiumissmallerforthosewhoworkeighthoursperweekormorefromhome,andinthecaseofwomenisnotsignificantlydifferentfromzero.Itseemsthat full-timeworkerswhowork fromhomedoearnhigherweeklywages,but thegaindeclineswiththenumberofhoursworkedfromhome,andforallworkershourlywagesfallasoneworksmorehoursfromhome.Thisevidencepointstoemployeesreceivingarelativelylowerrateofcompensationforhoursputinathomerelativetohoursputinattheworkplace.
7 These results are not reported in full, but the random effects model is well behaved withvariableshavingtheexpectedsigns.Therangeofcontrolsisthesameasthoseshownintable3.ThewagesdataaredeflatedusingtheDecemberquarterCPIindexforeachyeartobeexpressedinreal2001dollars.
176AUSTRALIAN JOURNAL OF LABOUR ECONOMICSVOLUME 17 • NUMBER 2 • 2014
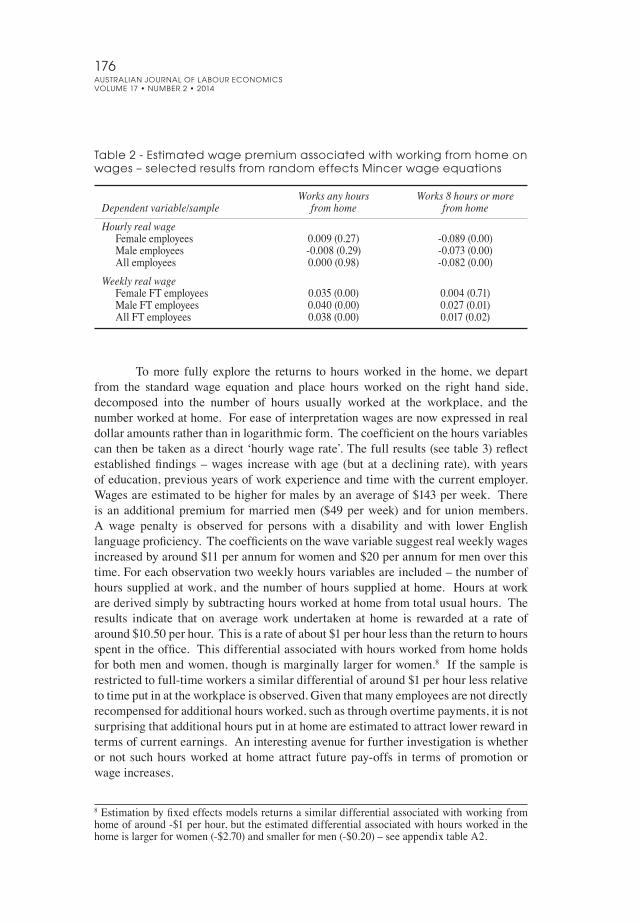
Table 2 - Estimated wage premium associated with working from home on wages – selected results from random effects Mincer wage equations
Works any hours Works 8 hours or moreDependent variable/sample from home from homeHourly real wage Femaleemployees 0.009(0.27) -0.089(0.00) Maleemployees -0.008(0.29) -0.073(0.00) Allemployees 0.000(0.98) -0.082(0.00)Weekly real wage FemaleFTemployees 0.035(0.00) 0.004(0.71) MaleFTemployees 0.040(0.00) 0.027(0.01) AllFTemployees 0.038(0.00) 0.017(0.02)
Tomore fully explore the returns tohoursworked in thehome,wedepart
from the standard wage equation and place hours worked on the right hand side,decomposed into the number of hours usually worked at the workplace, and thenumberworkedathome.Foreaseofinterpretationwagesarenowexpressedinrealdollaramountsratherthaninlogarithmicform.Thecoefficientonthehoursvariablescanthenbetakenasadirect‘hourlywagerate’.Thefullresults(seetable3)reflectestablishedfindings–wages increasewithage (butat adeclining rate),withyearsofeducation,previousyearsofworkexperienceandtimewiththecurrentemployer.Wagesareestimatedtobehigherformalesbyanaverageof$143perweek.Thereisanadditionalpremiumformarriedmen ($49perweek)and forunionmembers.A wage penalty is observed for persons with a disability and with lower Englishlanguageproficiency.Thecoefficientsonthewavevariablesuggestrealweeklywagesincreasedbyaround$11perannumforwomenand$20perannumformenoverthistime.Foreachobservationtwoweeklyhoursvariablesareincluded–thenumberofhourssuppliedatwork,andthenumberofhourssuppliedathome. Hoursatworkarederivedsimplybysubtractinghoursworkedathomefromtotalusualhours.Theresults indicate that on averagework undertaken at home is rewarded at a rate ofaround$10.50perhour.Thisisarateofabout$1perhourlessthanthereturntohoursspentintheoffice.Thisdifferentialassociatedwithhoursworkedfromhomeholdsforbothmenandwomen,thoughismarginallylargerforwomen.8Ifthesampleisrestrictedtofull-timeworkersasimilardifferentialofaround$1perhourlessrelativetotimeputinattheworkplaceisobserved.Giventhatmanyemployeesarenotdirectlyrecompensedforadditionalhoursworked,suchasthroughovertimepayments,itisnotsurprisingthatadditionalhoursputinathomeareestimatedtoattractlowerrewardintermsofcurrentearnings.Aninterestingavenueforfurtherinvestigationiswhetherornot suchhoursworkedathomeattract futurepay-offs in termsofpromotionorwageincreases.
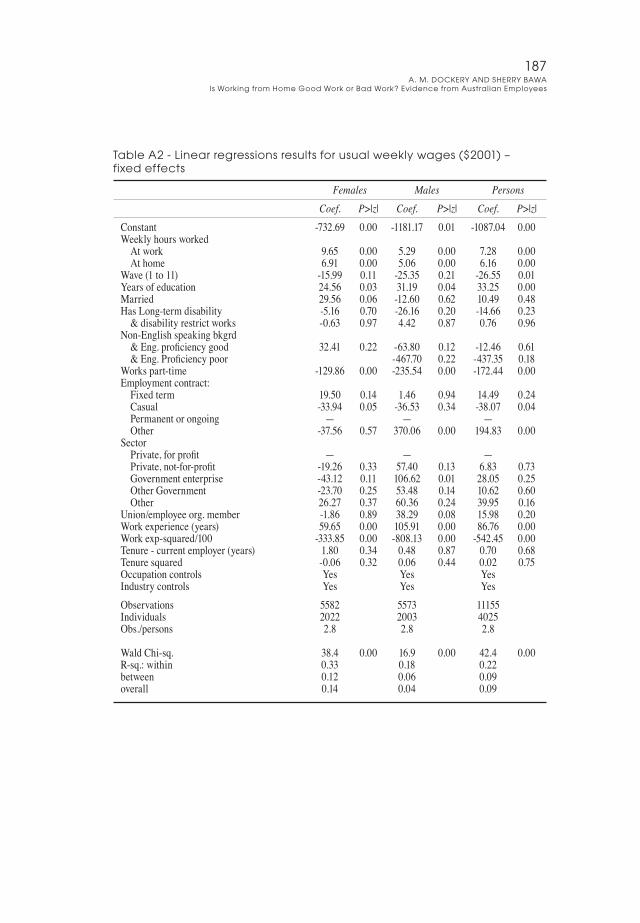
8Estimationbyfixedeffectsmodelsreturnsasimilardifferentialassociatedwithworkingfromhomeofaround-$1perhour,buttheestimateddifferentialassociatedwithhoursworkedinthehomeislargerforwomen(-$2.70)andsmallerformen(-$0.20)–seeappendixtableA2.

177A. M. DOCKERY AND SHERRY BAWA
Is Working from Home Good Work or Bad Work? Evidence from Australian Employees
Table 3 - Random effects linear regression results for usual weekly wages ($2001)
Females Males Persons Coef. P>|z| Coef. P>|z| Coef. P>|z|Constant -596.13 0.00 -977.61 0.00 -1006.36 0.00Weeklyhoursworked Atwork 12.01 0.00 11.43 0.00 11.67 0.00 Athome 10.76 0.00 10.58 0.00 10.59 0.00Wave(1to11) 10.60 0.00 19.79 0.00 15.16 0.00Male 142.66 0.00Age(inyears) 12.28 0.00 3.53 0.60 17.62 0.00Age-squared -0.17 0.00 -0.11 0.20 -0.25 0.00Yearsofeducationa 37.50 0.00 73.45 0.00 54.59 0.00Married 5.35 0.29 48.79 0.00 31.41 0.00HasLong-termdisability 0.32 0.94 -12.01 0.05 -6.17 0.11 &disabilityrestrictworks -11.01 0.03 -21.80 0.01 -17.64 0.00Non-Englishspeakingbkgrd. &Engproficiencygood -14.93 0.02 -48.48 0.00 -32.70 0.00 &Eng.Proficiencypoor -97.34 0.00 -55.10 0.15 -70.93 0.00Workspart-time -61.52 0.00 -52.66 0.00 -61.83 0.00Employmentcontract: Fixedterm 7.41 0.23 37.39 0.00 22.18 0.00 Casual -4.67 0.23 7.11 0.34 4.22 0.29 Permanentorongoing — — — Other -36.87 0.26 65.72 0.36 16.83 0.69Sector Private,forprofit — — — Private,not-for-profit -21.15 0.00 -68.10 0.00 -40.93 0.00 Governmententerprise 22.07 0.01 -0.23 0.99 11.03 0.23 OtherGovernment 14.45 0.01 -26.56 0.03 -5.64 0.35 Other -6.78 0.46 -51.09 0.01 -19.74 0.03Union/employeeorg.member 18.99 0.00 44.21 0.00 29.40 0.00Workexperience(years)b 10.02 0.00 33.16 0.00 16.20 0.00Workexp.-squared/100 -99.19 0.00 -421.75 0.00 -155.43 0.00Tenure-currentemployer(years) 3.33 0.00 3.45 0.03 2.94 0.00Tenuresquared -0.03 0.32 -0.02 0.57 -0.01 0.65Occupationcontrols Yes Yes YesIndustrycontrols Yes Yes YesObservations 30084 31585 61669Individuals 7291 7455 14745Obs./persons 4.1 4.2 4.2WaldChi-sq. 14575 0.00 7207 0.00 17763 0.00R-sq.:within 0.40 0.25 0.28between 0.65 0.48 0.54overall 0.60 0.44 0.51
Notes:aYearsofeducationisthesumofyearsofschool(assumedminimumofsevenplusreportedyearsofsecondaryschoolcompleted)andyearsofpost-schooleducationimputedfromhighestpost-schoolqualification(rangingfrom0.5yearsforaCertificateI/IItoeightyearsforaDoctorate);bworkexperienceisequaltothereportedemploymenthistoryvariable‘yearsinpaidworksinceleavingschool’.

178AUSTRALIAN JOURNAL OF LABOUR ECONOMICSVOLUME 17 • NUMBER 2 • 2014
5. Do employees prefer to be able to work from home? AnumberofdataitemsarecollectedinHILDAwhichenabledirecttestsonwhetherworking from home is generally a positive or negative attribute of jobs from anemployee’sperspective.Specificallyweutiliseresponsestothreequestionsrelatingtojobsatisfaction.Employedpersonsareaskedtoindicatehowsatisfiedordissatisfiedtheyarewithvariousaspectsoftheirjobsandtheirjoboverall.Ashowcardisusedwhichdepictsascalerangingfrom0(totallydissatisfied)to10(totallysatisfied).Theitemsinclude:
• Theflexibilityavailabletobalanceworkandnon-workcommitments• Thehoursyouwork• Allthingsconsidered,howsatisfiedareyouwithyourjob.9
Differences in these three itemsare investigated conditional uponworkingfromhome status to seewhetherworking fromhome is associatedwith higher orlowerjobsatisfaction.Lookingatthemeanresponsespooledoverthe11waves(table4)theresponsesindicatethatwomenwhoworkanyhoursfromhomearesignificantlylesssatisfiedwiththeflexibilityavailabletobalanceworkandnon-workcommitmentsthanwomenwhodonotworkfromhome,andthosewhoworkeighthoursormoreinthehomelesssatisfiedstill.Thisalsoholdsforthesubsetoffemaleparents.Formaleparents,thosewhoworkanyhoursandwhoworkeighthoursormorefromhomearemoresatisfiedwiththeirflexibilitytobalanceworkandnon-workcommitmentsthanthosewhodonotwork fromhome.For all groups, satisfactionwithhoursworkedislowerforthosewhoworkanyhoursfromhomeandlowerstillforthoseworkinglongerhoursinthehome.
Forfemales’overalljobsatisfaction,thereislittlevariationbyhomeworkerstatusbutformalesoveralljobsatisfactionseemstoincreasewithhoursworkedinthehome.Thismayreflectthatmenwithhigherjobsatisfactionaremorelikelytocontinuewiththeirworkwhentheygethome.
To control for a large range of other potential factors that may affect jobsatisfaction, and may be correlated with working from home status, multivariatemodelsareestimatedwiththesubjectiveratingsofjobsatisfactionasthedependentvariables. For the explanatory variables, a variable capturing working from homestatusisnowaddedtothesetofcovariatesincludedinthemodelsreportedintable1.Intheinterestsofparsimony,age,hoursusuallyworkedandtenurearenowspecifiedinlinearandquadraticformsratherthancategories,andtheoccupationandindustrycontrolsareincludedbutnotreported.10
Thesatisfactionratingscaleprovidesanordinaldiscretevariable,suited toestimationusingtheorderedprobitorlogitmodel.Foreaseofinterpretation,however,thespecificationusedisinsteadasimplelinearregression.Althoughthisistechnicallyaninappropriatespecificationforadependentvariableboundedbetweenzeroand10,resultstendtobeverysimilarwhethersuchdependentvariablesaretreatedascardinalvariablesorthemoretechnicallycorrectorderedlogitorprobitspecificationsareused(Ferrer-i-CarbonellandFrijters,2004).9Theotheritemscoveredweresatisfactionwith‘yourtotalpay’,‘yourjobsecurity’and‘theworkitself(whatyoudo)’.10Hoursworkedwasalsotestedinlogarithmicform,butthisresultedinalowerR-squared.

179A. M. DOCKERY AND SHERRY BAWA
Is Working from Home Good Work or Bad Work? Evidence from Australian Employees
Table 4 - Mean job satisfaction: flexibility, hours worked and overall; by gender and parent status
Don’t work Work any hours Works 8 hours/week from home from home or more from homeSatisfaction with flexibilityFemales-all 7.58 7.23*** 6.98***Femaleparentsa 7.60 7.30*** 7.05***Males-all 7.31 7.37* 7.39Maleparentsa 7.17 7.28** 7.30**Satisfaction with hours workedFemales-all 7.37 7.01*** 6.61***Femaleparentsa 7.44 7.06*** 6.65***Males-all 7.21 6.87* 6.73***Maleparentsa 7.17 6.74*** 6.59***Overall job satisfactionFemales-all 7.68 7.72* 7.62Femaleparentsa 7.75 7.76 7.70Males-all 7.54 7.64*** 7.70***Maleparentsa 7.52 7.58* 7.68***
Notes:***,**and*denotethedifferencebetweenthemeanandthecorrespondingmeanforthosewhodonotworkfromhomeissignificantattheonepercent,fivepercentand10percentlevels,respectively,bythestandardt-test.aParentsarethosewhohaveanyresidentownchildrenuptotheageof24.
Anumberofdifferentspecificationsaretestedtocapturetheeffectofworking
fromhome.Threeofthesearedummyvariablesdefinedtoequaloneiftheemployeeworksanyoftheirusualhoursfromhome;usuallyworkseighthoursperweekormorefromhome;and, followingWoodenandFok’s (2013)preferreddefinition,worksatleasthalfoftheirhoursfromhome.Thefinalspecificationisalinearvariableequaltothenumberofusualhoursperweekworkedfromhome.Modelsareagainestimatedseparatelybygendertoallowforpotentialdifferentialimpactsofworkingfromhomeformenandwomen.
Theresultsforrandom-effectspanelmodelswiththedummyvariablebasedonanyhoursworkedinthehomeamongtheregressorsarepresentedintable5.11Theestimatedcoefficientsforeachofthedifferentvariablescapturingworkingfromhomestatusfromcomparablemodelsaresummarisedintable6.
The key result is the positive association between working from home andemployees’satisfactionwiththeflexibilitytobalanceworkandnon-workcommitments.Moreover,thisestimatedeffectbecomeslargerandmorehighlysignificantforindicatorsassociatedwithagreaterintensityofworkingfromhome,eitherintermsofthenumberofhoursortheshareofhoursdoneinthehome.Toappreciatethattheestimatedeffectisofsomemagnitude,consider theestimatedcoefficientof0.57formaleswhoworkthemajorityoftheirhoursfromhome.Theliteralinterpretationisthatamaleworkingatleasthalfofhishoursfromhome,otherthingsbeingequal,moveshimupthe0to10 satisfaction scalebyalmost0.6of apoint. Responseson these scales are tightlyclusteredaround7.5.Forsatisfactionwithflexibility,80percentofemployeesnominate11ThemodelsareestimatedusingXTREGinSTATAwiththerandomeffectsandrobuststandarderrorsoptions.

180AUSTRALIAN JOURNAL OF LABOUR ECONOMICSVOLUME 17 • NUMBER 2 • 2014
afigurefromsixto10inthe‘satisfied’interval.Hence‘shifts’ofalmost0.6formalesand0.36forfemalesrepresentsizeabledifferencesinaveragesatisfaction.
Table 5 - Job satisfaction: random effects panel regression results, HILDA waves 1-11 (2001-2011)
Satisfaction with ability to balance work and non-work Satisfaction with Overall job commitments hours worked satisfaction Female Male Female Male Female MaleConstant 7.978*** 9.016*** 7.835*** 8.303*** 8.697*** 9.327***Worksanyhoursfromhome 0.063* 0.108*** -0.160*** -0.166*** 0.015 0.053*Age(inyears) 0.025*** -0.020** -0.039*** -0.069*** -0.049*** -0.090***Age-squared 0.000** 0.000*** 0.001*** 0.001*** 0.001*** 0.001***Familystatus Marriedwithnokids 0.095** 0.064 0.156*** 0.055 0.162*** 0.090** Married&youngestchild0-4 -0.162*** 0.031 0.157*** 0.031 0.230*** 0.134*** Married&youngestchild5-14 -0.086 0.019 0.159*** -0.014 0.231*** 0.145*** Married&youngestchild15-24 0.008 0.080 0.194*** 0.012 0.260*** 0.135*** Singlewithnokids — — — — — — Single&youngestchild0-4 -0.132 0.034 0.110 0.059 0.114* 0.134** Single&youngestchild5-14 -0.233*** 0.174* -0.047 0.066 0.201*** 0.191*** Single&youngestchild15-24 -0.115 0.022 -0.031 0.046 0.056 0.084Hasdisability -0.135*** -0.078** -0.113*** -0.105*** -0.120*** -0.078***Employmentcontract: Fixedterm -0.011 -0.068* 0.017 0.036 -0.047 -0.021 Casual 0.054 -0.158*** -0.296*** -0.313*** -0.079** -0.253*** Permanentorongoing — — — — — — Other -0.385* -0.413** -0.426** -0.261 -0.715*** -0.163Sector Private,forprofit — — — — — — Private,not-for-profit 0.208*** 0.162** 0.135*** 0.201*** 0.074* 0.175*** Governmententerprise 0.019 0.068 -0.024 0.205*** 0.046 0.168*** OtherGovernment 0.068 0.155*** 0.038 0.259*** 0.100*** 0.235*** Other 0.093 0.269** 0.016 0.046 0.118 0.107Tenurewithcurrentemployer(years) 0.011* -0.002 -0.015** -0.024*** -0.034*** -0.026***Tenuresquared 0.000** 0.000 0.000*** 0.001*** 0.001*** 0.001***Hoursusuallyworked/weekinmainjob -0.025*** -0.022*** 0.041*** 0.037*** -0.005* -0.007**Hourssquared 0.000*** 0.000*** -0.001*** -0.001*** 0.000 0.000Union/employeeorg.member -0.341*** -0.233*** -0.191*** -0.041 -0.189*** -0.021Occupationcontrols Yes Yes Yes Yes Yes YesIndustrycontrols Yes Yes Yes Yes Yes YesObservations 38990 38884 38998 38919 39001 38919Persons 8529 8417 8528 8423 8530 8424Obs./person 4.6 4.6 4.6 4.6 4.6 4.6WaldChi-square 1429*** 1236*** 885*** 1109*** 537*** 723***R-squared:within 0.04 0.03 0.04 0.04 0.01 0.01 Between 0.09 0.08 0.07 0.08 0.04 0.05 Overall 0.08 0.07 0.06 0.07 0.020.03
Notes:***,**and*denotetheestimatedcoefficientissignificantlydifferentfromzeroattheonepercent,fivepercentand10percentlevels,respectively.

181A. M. DOCKERY AND SHERRY BAWA
Is Working from Home Good Work or Bad Work? Evidence from Australian Employees
Table 6 - Summary of results - estimated effects of various indicators of working from home on job satisfaction (random-effects linear regression)
Satisfaction with... flexibility to balance work/non-work commitment The hours you work Job overallDefinition of workingfrom home statusa Female Male Female Male Female MaleWorksanyhoursfromhome 0.06* 0.11*** -0.16*** -0.17*** 0.01 0.05*Works8hoursperweekormorefromhome 0.10* 0.13** -0.22*** -0.25*** -0.02 0.03Worksmajorityofhoursfromhome 0.36*** 0.57*** 0.18** 0.14 0.13* 0.20**Numberofhoursworkedfromhomeperweek 0.012*** 0.016*** -0.006 -0.007** 0.000 0.005**
Notes:a.referstousualhoursworkedineachcase;***,**and*denotetheestimatedcoefficientissignificantlydifferentfromzeroattheonepercent,fivepercentand10percentlevels,respectively.
Workingfromhomeseemstobeassociatedwithalowerlevelofsatisfactionwith‘thehoursyouwork’,althoughthisdoesnotholdforthosewhoworkthemajorityof their hours from home. The fixed effects results (tableA3) for bothmen andwomenalsosuggestthosewhoworkmainlyfromhomearemoresatisfiedwithhoursworked. Thismay reflect a difference between thosewith ongoing arrangementsor intentions toworkfromhomeasopposedto thosewhodosointermittentlyasworkloadsandothercircumstancesrequire.Foroveralljobsatisfaction,theresultsarelessrobust–satisfactionisrelativelyhigherformalesratherthanfemalesworkingfromhome,butnoteagainthepotentialendogeneityofthisresult.Thesetofresultsreportedintable6iscloselymirroredbythoseobtainedusingfixed-effectsmodels(seeappendixtableA3).
Tobrieflynotesomeresultsfortheothercontrolvariablescontainedintable5,thepresenceofyoungandschoolagedchildrendecreaseswomen’ssatisfactionwithflexibility,butotherwisethepresenceofresidentchildrenisassociated(onaverage)withgreatersatisfaction.Employeeswithadisabilitythatrestrictseverydayactivitiesreport lower satisfaction in all cases. Permanent employment andwork in the not-for-profitandgovernmentsectorappearspreferable.Beingamemberofaunionoremployeeassociation isassociatedwithmarkedly lowersatisfactionwithflexibilityand, for women, with hours worked and overall job satisfaction. This resultmaybe endogenous in the sense that dissatisfied employeesmaybemore likely to joinaunion.However,italsofitswiththeresultsreportedabovesuggestingthatunionsmayactuallyacttoopposeflexibleworkingarrangementsthatincludethepossibilityofworking fromhome.Satisfactionwithflexibility to balancework and non-workcommitmentsdecreasesmarkedlywiththenumberofhoursworkedperweek.Takingthecoefficientsonhoursandhours-squaredtogether,theestimatedeffectofworking55hoursperweekasopposedto35hoursperweekistoreducewomen’ssatisfactionwithflexibilitytobalancecommitmentsbyalmostafullpointonthescale,andby

182AUSTRALIAN JOURNAL OF LABOUR ECONOMICSVOLUME 17 • NUMBER 2 • 2014
0.8 of a point formen. For overall job satisfaction the effects aremuch smaller.Satisfactionwithhoursworkedisestimatedtoincreaseuptoroughlytheequivalentofafull-timeworkload(40hoursperweek)beforedroppingoffwithadditionalhours.
Given these and the prior results relating to the impact of hours on thelikelihoodofworkingfromhome,additionalmodelswereestimatedseparatelyforthesubsetoflong-hoursworkers,definedasthosewhoreportusuallyworking45hoursormore,andotherworkers.Generally,workingfromhomeisassociatedwithgreaterflexibilityandgreateroveralljobsatisfactionforbothgroupsofworkers.However,thedissatisfactionwithhoursofworkassociatedwithworkingfromhomeismuchstronger for employees working long hours. The exception is those whowork themajorityof theirhours fromhome.For thosewhousuallywork less than45hoursper week, working the majority of hours from home is associated with increasedsatisfactionwithhoursworked,andtheeffectisinsignificantforlong-hoursworkers.
6. Conclusion Wehavesought tocast lighton the issueofwhetherornotworking fromhome issomethingtypicallyassociatedwithgoodjobs.Thishasbeeninvestigatedprimarilyintermsoftheeffectofworkingfromhomeonwork-lifebalance.Isworkingfromhomeapositiveattribute thathelpsemployeesbalance theircommitments?Or is itoneofthewaysthroughwhichlabourmarketderegulationisunderminingstandardworkingconditions?
Wehavefoundnosimpleanswer.Thedescriptiveanalysissuggeststhat,injustoveradecadeoftheHILDASurvey,therehasnotactuallybeenanyincreaseintheincidenceofemployeesworkingfromhome.Ifanythingtherehasbeenaslightdecrease in the proportion of employees working any hours from home, and theproportionworkingeighthoursormoreperweekin thehomehasremainedstatic.ThesefindingsforAustraliaseemtobeincontrasttotheimpressionpaintedintheinternationalliteratureofagrowingincidenceof‘teleworking’and‘telecommuting’.Thosewhodoworkfromhomereportworkingasubstantialnumberofhoursinthehome–aroundonedayaweek–andthishasalsoremainedrelativelystableovertime.
Multivariateanalysesshowthatmanagersandprofessionalsarebyfarthemostlikely toworkfromhome.Womenwithpre-schoolandschoolagedchildren,olderworkers,thosewhohavebeenwiththeiremployerforlongerandwhoareemployedintheprivatesectorarealsomorelikelytoworkfromhome.Unionmembershipisassociatedwithalowerincidenceofworkingfromhome.
Themostmarkedvariation in the likelihoodofworkingfromhomecomeswithrespecttothenumberofhoursusuallyworkedperweek.Workinglonghoursgoeshandinhandwithworkingfromhome.Forexample,femalesandmaleswhousuallywork55ormorehoursperweekareestimated tobenineandseven timesmorelikelytoworkfromhome,respectively.Thelikelihoodofworkingeighthoursperweekormorefromhomeincreasesevenmoredramatically,andthisresponseisstrongestforwomen.Hereinliesthedouble-edgednatureofhome-work:itspotentialtofacilitatelongerworkinghoursandtheintrusionofworkintohomelife.
Ifthereasonemployeesareworkingfromhomeistomeethomeandfamilycommitments, it doesnot follow that suchhomecommitments, and the time spent
183A. M. DOCKERY AND SHERRY BAWA
Is Working from Home Good Work or Bad Work? Evidence from Australian Employees
working there,would increasemore than proportionatelywith hours ofwork. Anissueheremaybethattimespentintheofficeisconstrainedbythetimingofhomecommitments,ratherthanthedurationofthosecommitments.Taketheexampleofanemployeewhodropsoffandpicksupchildrenfromschool,suchthatthestart-andend-timesoftheirshiftattheworkplaceisconstrainedbythosecommitments.Saveforreturningtotheworkplaceforasecondtimethatday,anyadditionalhourswouldthereforeneedtobedoneathome.Thisisconsistentwithresultsrelatingtogender.It isstill thecasethatwomenaremorelikelythanmentomeetcaringobligations,suchasgettingchildrentoandfromschoolandpreparingmeals.Consequently,whenworktimeslengthen,menstayintheofficeforlongerbutwomenworklongerathome.
Among full-timeworkers, it seems that jobsassociatedwithworking fromhomearehigherpayingjobs–typicallypayingaroundfourpercenthigherweeklywagesaftercontrollingforawiderangeofindividualandjobcharacteristics.However,this increase inwagesdoesnot fully compensatehomeworkers for thenumberofadditionalhourstheyputin.Weestimatethatworkersreceiveanhourlyrateforhoursworkedinthehomethatisroughly10percentlowerthantheyarecompensatedforhoursattheworkplace.Savingsincommutingtimesmayoffsetthisdifference,anditisalsopossiblethatworkingadditionalhoursfromhomemaycontributetofuturepromotionsandpayrises.
Irrespectiveofhoursworked,employeesvaluetheflexibilityofbeingabletoworksomeoftheirhoursfromhome,andthisisalsogenerallyassociatedwithgreateroveralljobsatisfaction.However,otherthanforthosewhoworkthemajorityoftheirhoursfromhome,workingfromhomeisassociatedwithlowersatisfactionwithhoursworked. It isclear thatmanyof thesehoursareworkedfromhomeasameans tocopewithlonghoursofworkandhighworkloads.Oncehoursofworkarecontrolledfor, it iswomenwhoaremore likely towork fromhome. For thoseworking longhours,beingabletodosomeofthosehoursfromhomedoesnotnecessarilyimpactnegativelyontheirsatisfactionwithworklifebalance,butratheritisthelonghoursthemselvesthatdetractfromsatisfaction.Inthesampleusedhere,oneinfourmaleemployeesreportedworking45hoursperweekorlongerandoneintenwomen.
Theimportantquestionistheextenttowhichthecapacitytoworkfromhomefacilitateslongerworkhoursandhencecontributestothedissatisfactionwithwork-lifebalanceassociatedwithlongerhoursofworkandreducedleisuretime.Itseemsakeydistinctiontomakeisbetween‘home-workers’asopposedtoworkerswhodosomeoftheirhoursfromhome.Herewefindunambiguouslypositiveeffectsforemployeeswhoworkatleasthalftheirhoursfromhome,andthisconcordswithpreviousfindingswithrespecttoemployeeswhoworkfromhomethroughaformalagreementwiththeiremployer(DockeryandBawa,2014).Thesedefinitionsarelikelytocaptureemployeeswhohaveongoingexplicitorimplicitarrangementsforworkingfromhome,andwhomightbeconsidered‘home-workers’.Thisstatusisclearlyvaluedbythoseemployeeswhohavesuchworkingarrangements.
Forotherswhofindthemselvesworkinglonghours,workingsomeofthosehours from home becomes a ‘necessary evil’ to copewith those long hours. Fortheseworkersitisthelonghoursthatdetractfromwork-lifebalance,notsomuchthefactthatthisoftenleadstohoursofworkbeingdonewithinthehome.Overall,we

184AUSTRALIAN JOURNAL OF LABOUR ECONOMICSVOLUME 17 • NUMBER 2 • 2014
concludethatjobswhichofferthepossibilitytoworkfromhomeare‘goodjobs’forpart-timeworkersandthosewhoworkstandardfull-timehours.Infact,foranygivenlevelofhoursworked,theoptiontoworkfromhomeisapositivejobattribute.Butthereisastinginthetail.Onceoneworksfromhome,hoursarenotgiven.Thereis reason tobelieve thatworking fromhome facilitates greater intrusion into life’snon-work domains through increases in workloads. In managing their employees’workloadsandqualityofworkinglife,employersshouldbemindfuloftheextenttowhichemployeesmaybeputtinginadditionalhoursoutsideoftheworkplace.
Totheextentthatemployees’choicestoworkfromhomewillbeprimarilyvoluntary,albeitinsomecasesachoicemadeduetohighworkloads,jobinsecurityand or other pressures, itmight be expected that the ‘rational, utilitymaximising’workerwouldalsoreportsatisfactionwiththosearrangements.ThedataonpreferredworkinghourscontainedinHILDAcouldbeusedtofurtherinvestigatetheassociationbetweenworking from home and hoursmismatch, and thismay cast light on thedegreetowhichworkingfromhomeisassociatedwith‘overwork’.Previousresearchhasdemonstratedthatmismatchbetweenactualandpreferredhoursofworkismoreimportant for job satisfaction thannumberof hoursworked (Wooden,Warren andDrago,2009).Thepossibilitythatemployeesdonotfullyappreciatetheexternalitiesassociatedwithworkingfromhome,ormistakenlyseeitasaone-offortemporaryresponsetotheirworkloads,canalsobeexploredthroughHILDA,thankstotheabilitytolinkanindividual’sworkpatternstootherhouseholdmembers’ratingsaboutwork-lifebalanceandfamilyfunctioning.Thisisthesubjectofongoingresearch.
ThepossibilityofutilisingthelongitudinalnatureofHILDAtotesttheimpactof working from home upon future promotion prospects and other future labourmarketoutcomesprovidesanotheravenueforfutureresearch.ThereisalsoaneedforresearchusingalternativeconstructsandricherinformationtoaddtowhatcanbegleanedfromtheexistingHILDAquestions.Thismaycomeintheformofqualitativestudiesandothersurveysaddressingthetopic,orthroughadditionalquestionsbeingincorporatedintofuturewavesofHILDA.

185A. M. DOCKERY AND SHERRY BAWA
Is Working from Home Good Work or Bad Work? Evidence from Australian Employees
Appendix Results for fixed effects models
Table A1 - Probability of working any hours from home, and of working eight or more hours from home, fixed-effect logistic regression models
Women Men WFH - any hours WFH 8+ hrs/wk WFH - any hours WFH 8+ hrs/wk Odds Odds Odds Odds Ratio P>|z| Ratio P>|z| Ratio P>|z| Ratio P>|z|Age(years) 15to24 0.708 0.04 0.569 0.04 0.550 0.00 0.413 0.00 25to34 1.046 0.66 0.825 0.21 0.847 0.09 0.706 0.02 35to44 — — — — 45to54 0.943 0.55 1.219 0.17 1.004 0.97 1.670 0.00 55to64 0.740 0.07 1.088 0.72 1.059 0.73 2.756 0.00 65plus 0.468 0.04 1.061 0.91 0.708 0.31 2.939 0.02Familystatus Marriedwithnokids 1.422 0.00 1.832 0.00 1.000 1.00 1.266 0.16 Married&youngest child0-4 2.796 0.00 3.600 0.00 1.179 0.15 1.324 0.12 Married&youngest child5-14 2.644 0.00 2.861 0.00 1.163 0.26 1.440 0.07 Married&youngest child15-24 1.609 0.00 3.053 0.00 0.755 0.08 1.048 0.84 Singlewithnokids — — — — Single&youngest child0-4 2.090 0.00 2.549 0.00 1.174 0.42 0.872 0.67 Single&youngest child5-14 1.430 0.03 1.676 0.05 1.160 0.52 0.916 0.79 Single&youngest child15-24 1.003 0.99 0.888 0.68 0.699 0.29 0.452 0.22Hasdisability 1.011 0.90 0.760 0.03 0.947 0.52 0.971 0.82Employmentcontract: Fixedterm 1.156 0.06 1.314 0.02 1.043 0.61 1.193 0.16 Casual 0.755 0.00 0.796 0.10 0.595 0.00 0.662 0.04 Permanentorongoing — — — — Other 2.935 0.01 3.333 0.03 2.510 0.01 2.952 0.03Sector Private,forprofit — — — — Private,not-for-profit 0.993 0.95 1.155 0.41 0.974 0.87 0.763 0.25 Governmententerprise 0.852 0.26 0.836 0.45 0.745 0.05 0.834 0.42 OtherGovernment 0.894 0.31 1.056 0.76 0.805 0.11 0.660 0.05 Other 1.217 0.30 1.286 0.37 1.587 0.10 0.941 0.86Tenurewithcurrentemployer 1yearorless — — — — 2to5years 1.349 0.00 1.017 0.86 1.359 0.00 1.130 0.21 6to10years 1.489 0.00 1.188 0.18 1.325 0.00 1.383 0.01 11ormoreyears 1.417 0.00 1.199 0.25 1.657 0.00 1.206 0.22Hoursusuallyworkedinmainjob 1to15hoursperweek 0.931 0.51 0.411 0.00 1.994 0.00 0.505 0.02 16to30hoursperweek 1.095 0.27 0.733 0.02 1.542 0.00 1.267 0.27 31to38hoursperweek — — — — 39to44hoursperweek 1.610 0.00 1.387 0.01 1.363 0.00 1.238 0.16 45to54hoursperweek 2.880 0.00 2.602 0.00 2.504 0.00 2.399 0.00 55ormorehoursperweek 3.892 0.00 7.545 0.00 3.608 0.00 5.765 0.00

186AUSTRALIAN JOURNAL OF LABOUR ECONOMICSVOLUME 17 • NUMBER 2 • 2014
Table A1 - Probability of working any hours from home, and of working eight or more hours from home, fixed-effect logistic regression models (continued)
Women Men WFH - any hours WFH 8+ hrs/wk WFH - any hours WFH 8+ hrs/wk Odds Odds Odds Odds Ratio P>|z| Ratio P>|z| Ratio P>|z| Ratio P>|z|Union/employeeorg.member 0.902 0.19 0.894 0.36 1.008 0.93 0.880 0.35Occupation Manager 1.115 0.27 1.126 0.39 1.036 0.67 0.928 0.54 Professional — — — — Technician/tradesperson 0.310 0.00 0.328 0.01 0.568 0.00 0.536 0.00 Community/pers.services worker 0.586 0.00 0.581 0.02 0.560 0.00 0.663 0.18 Clerical/administration 0.608 0.00 0.916 0.59 0.665 0.00 0.623 0.02 Salesworker 0.579 0.00 0.655 0.11 0.717 0.02 0.726 0.16 Machineryoperator/ driver 0.215 0.00 0.134 0.01 0.198 0.00 0.292 0.00 Labourer 0.472 0.00 0.416 0.05 0.419 0.00 0.562 0.06Industry Agric.,forestry,fishing 2.449 0.01 7.579 0.00 2.993 0.00 4.624 0.00 Mining 1.040 0.93 2.657 0.18 0.743 0.27 0.631 0.29 Manufacturing 1.098 0.63 2.355 0.01 0.802 0.25 1.200 0.55 Electricity,gas,water 1.108 0.81 0.923 0.92 0.985 0.96 1.023 0.97 Construction 1.951 0.01 3.288 0.00 1.242 0.30 0.997 0.99 Wholesaletrade 1.825 0.00 1.756 0.10 1.185 0.40 1.177 0.61 Retailtrade 0.648 0.02 0.297 0.00 0.544 0.00 0.695 0.29 Accommodation/food 0.688 0.07 0.582 0.21 0.518 0.01 0.620 0.30 Transport&storage 2.583 0.00 2.435 0.06 1.356 0.18 0.980 0.96 Informationmedia/ telecoms 1.230 0.36 1.308 0.45 0.929 0.78 1.141 0.72 Finance&insurance 1.236 0.34 1.024 0.95 1.292 0.27 2.169 0.04 Rent,hiring,realestate 1.124 0.68 1.011 0.98 1.243 0.51 1.420 0.47 Professionalservices 1.728 0.00 1.522 0.08 1.450 0.04 2.368 0.00 Adminsupportservices 1.011 0.96 1.434 0.32 0.674 0.15 1.343 0.51 Publicadmin 1.006 0.97 0.759 0.31 0.706 0.08 0.560 0.09 Education&training 2.906 0.00 2.501 0.00 2.228 0.00 2.294 0.01 Healthcare/social assistance — — — — Arts&recreation 0.976 0.93 0.936 0.88 1.245 0.40 1.682 0.22 Otherservices 1.625 0.02 2.083 0.02 1.102 0.67 1.937 0.08Observations 13088 6339 12720 6023Individuals 1712 820 1625 771Obs./person 7.6 7.7 7.8 7.8LRChi-sq. 804 0.00 561 0.00 664 0.00 434 0.00Log-likelihood -4613 -2065 -4543 -1980
187A. M. DOCKERY AND SHERRY BAWA
Is Working from Home Good Work or Bad Work? Evidence from Australian Employees
Table A2 - Linear regressions results for usual weekly wages ($2001) – fixed effects
Females Males Persons Coef. P>|z| Coef. P>|z| Coef. P>|z|Constant -732.69 0.00 -1181.17 0.01 -1087.04 0.00Weeklyhoursworked Atwork 9.65 0.00 5.29 0.00 7.28 0.00 Athome 6.91 0.00 5.06 0.00 6.16 0.00Wave(1to11) -15.99 0.11 -25.35 0.21 -26.55 0.01Yearsofeducation 24.56 0.03 31.19 0.04 33.25 0.00Married 29.56 0.06 -12.60 0.62 10.49 0.48HasLong-termdisability -5.16 0.70 -26.16 0.20 -14.66 0.23 &disabilityrestrictworks -0.63 0.97 4.42 0.87 0.76 0.96Non-Englishspeakingbkgrd &Eng.proficiencygood 32.41 0.22 -63.80 0.12 -12.46 0.61 &Eng.Proficiencypoor -467.70 0.22 -437.35 0.18Workspart-time -129.86 0.00 -235.54 0.00 -172.44 0.00Employmentcontract: Fixedterm 19.50 0.14 1.46 0.94 14.49 0.24 Casual -33.94 0.05 -36.53 0.34 -38.07 0.04 Permanentorongoing — — — Other -37.56 0.57 370.06 0.00 194.83 0.00Sector Private,forprofit — — — Private,not-for-profit -19.26 0.33 57.40 0.13 6.83 0.73 Governmententerprise -43.12 0.11 106.62 0.01 28.05 0.25 OtherGovernment -23.70 0.25 53.48 0.14 10.62 0.60 Other 26.27 0.37 60.36 0.24 39.95 0.16Union/employeeorg.member -1.86 0.89 38.29 0.08 15.98 0.20Workexperience(years) 59.65 0.00 105.91 0.00 86.76 0.00Workexp-squared/100 -333.85 0.00 -808.13 0.00 -542.45 0.00Tenure-currentemployer(years) 1.80 0.34 0.48 0.87 0.70 0.68Tenuresquared -0.06 0.32 0.06 0.44 0.02 0.75Occupationcontrols Yes Yes YesIndustrycontrols Yes Yes YesObservations 5582 5573 11155Individuals 2022 2003 4025Obs./persons 2.8 2.8 2.8
WaldChi-sq. 38.4 0.00 16.9 0.00 42.4 0.00R-sq.:within 0.33 0.18 0.22between 0.12 0.06 0.09overall 0.14 0.04 0.09

188AUSTRALIAN JOURNAL OF LABOUR ECONOMICSVOLUME 17 • NUMBER 2 • 2014
Table A3 - Summary of results - estimated effects of various indicators of working from home on job satisfaction from fixed effects models
Satisfaction with... flexibility to balance work/non-work commitment The hours you work Job overallDefinition of workingfrom home statusa Female Male Female Male Female MaleWorksanyhoursfromhome 0.07* 0.09** -0.12*** -0.12*** 0.03 0.06**Works8hoursperweekormorefromhome 0.13** 0.09 -0.11** -0.21*** 0.02 0.04Worksmajorityofhoursfromhome 0.28*** 0.44*** 0.16* 0.16* 0.15** 0.20**Numberofhoursworkedfromhomeperweek 0.014*** 0.012*** -0.001 -0.006** 0.002 0.005**
Notes:a.referstousualhoursworkedineachcase;***,**and*denotetheestimatedcoefficientissignificantlydifferentfromzeroattheonepercent,fivepercentand10percentlevels,respectively.
References Allen,T.(2001),‘Family-supportiveWorkEnvironments:TheRoleofOrganizational
Perceptions’,Journal of Vocational Behavior,58,414-435.Baltes,B.B.,Briggs,T.E.,Huff,J.W.,Wright,J.A.,andNeuman,G.A.(1999),‘Flexible
andCompressedWorkweekSchedules:AMeta-analysisofTheirEffectsonWork-relatedCriteria’,Journal of Applied Psychology,84,496-513.
Baruch,Y.(2001),‘TheStatusofResearchonTeleworkingandanAgendaforFutureResearch’,International Journal of Management Reviews,3(2),113-130.
Baruch,Y.,andNicholson,N.(1997),‘Home,SweetWork:RequirementsforEffectiveHomeWorking’,Journal of General Management,23,15–30.
Bloom,N.,J.Liang,J.Roberts,andYing,Z.J.(2013),DoesWorkingFromHomeWork?EvidencefromaChineseExperiment,Working Paper.Mimeo,Stanford.
Boston College Center for Work and Family (2000), ‘Measuring the Impact ofWorkplaceFlexibility’,ChestnutHill,MA.
Burgess, J.,Connell, J. andDockery,M. (2013),Quality of Work Research Project Report,ReportcommissionedbytheAustralianWorkplaceandProductivityAgency,CurtinBusinessSchool,Perth.
Cassells,R.,Gong,H.andDuncan,A.(2011),Race Against Time: How Australians Spend Their Time, AMP.NATSEM Income and Wealth Report, Iss. 30,November,Sydney,AMP.
Council of Economic Advisors (2010), ‘Work-life Balance and the Economics ofWorkplace Flexibility’, http://www.whitehouse.gov/files/documents/100331-cea-economics-workplaceflexibility.pdf
Dockery, A.M. (2012), ‘Deriving the Labour Supply Curve fromHappinessData’,Economics Letters,117,898-900.

189A. M. DOCKERY AND SHERRY BAWA
Is Working from Home Good Work or Bad Work? Evidence from Australian Employees
Dockery,A.M.andBawa,S.(2014),Is Working From Home Good Work or Bad Work? Evidence from Australian Employees,WorkingPaper14/2,BankwestCurtinEconomicsCentre,CurtinUniversity.
Doherty,S.T.,Andrey,J.andJohnson,L.C.(2000),TheEconomicandSocialImpactsof Telework, The New Workplace of the 21st Century, Washington: U.S.DepartmentofLabor,73-97.
Duxbury, L. and Higgins, C. (2002), ‘Telework: A Primer for the MillenniumIntroduction’,inC.L.CooperandR.J.Burke(eds.),The New World of Work: Challenges and Opportunities,Oxford,UK,BlackwellPublishersLtd.
Empirica Consultancy (1999), EcaTT (Electronic Commerce and Telework Trend)Survey,http://www.ecatt.com/ecatt/surveys/results/nwwg90001.html.
Felstead,A.,Jewson,N.,Phizacklea,A.andWaltersS.(2000),A Statistical Portrait of Working at Home in the UK. Evidence from the Labour Force Survey,WorkingPaper4,ESRAFutureofWorkProgram,ISSN1469-1531,1-46.
Ferrer-i-Carbonell,A.andFrijters,P.(2004),‘HowImportantisMethodologyfortheEstimates of theDeterminants ofHappiness’,The Economic Journal, 114,641-659.
Frank,R.H.(1999),Luxury Fever,TheFreePress,NewYork.Frey,B.S. (2008),Happiness: A Revolution in Economics,MITPress,Cambridge,
Massachusetts.Gajendran,RaviS.andHarrison,D.A.(2007),‘TheGood,theBad,andtheUnknown
About Telecommuting: Meta-analysis of Psychological Mediators andIndividualConsequences’,Journal of Applied Psychology,92(6),1524-154.
Galinsky, E., Bond, J., and Sakai, K. (2008), 2008 National Study of Employers.Retrieved January 28, 2009, from http://familiesandwork.org/site/research/reports/2008nse.pdf
Greenhaus,J.H.andPowell,G.N.(2006),‘WhenWorkandFamilyareAllies:ATheoryofWork–familyEnrichment’,Academy of Management Review,31,72-92.
Krahn,H.(1995),‘Non-standardWorkontheRise’,Perspectives,StatisticsCanada-Catalogue75-001E,Winter,35-42.
Kurland,N.B.andBailey,D.E.(1999),‘TheAdvantagesandChallengesofWorkingHere,There,Anywhere,andAnytime’,Organisational Dynamics,28(2),53-68.
Lafferty, G., Hall, R., Harley, B. and Whitehouse, G. (1997), Homeworking inAustralia:AnAssessmentofCurrentTrends.Australian Bulletin of Labour,23(2),143-156.
Li, J., Johnson, S., Han,W., Andrews, S., Strazdins, L., Kendall, G. and Dockery,A. (2014), ‘Parents’Non-standardWork Schedules andChildWellbeing.ACriticalReviewoftheLiterature’,Journal of Primary Prevention,35(1),53-73.
Powell, A. and Craig, L. (2013), ‘Paid Work at Home: Effects on Objective andSubjectiveTimeuse inAustralia’,paperpresented to theAustralianSocialPolicy Conference Contemporary Challenges for Social Policy, 16-18September,UniversityofNewSouthWales.
Pratt,J.H.(1999),1999TeleworkAmericaNationalTeleworkSurvey:Cost/BenefitofTeleworking toManageWork/LifeResponsibilities, International TeleworkAssociation&Council.

190AUSTRALIAN JOURNAL OF LABOUR ECONOMICSVOLUME 17 • NUMBER 2 • 2014
Schor,J.B.(1992),The Overworked American: The Unexpected Decline of Leisure,BasicBooks,NewYork.
Stone,K.V.W.(2012),‘TheDeclineintheStandardEmploymentContract:Evidencefrom Ten Advanced Industrial Countries’. UCLA School of Law, Law-Econ Research Paper No. 12-19. Available at SSRN: http://ssrn.com/abstract=2181082.
Thomas,L.T.andGanster,D.C.(1995),‘ImpactofFamily-supportiveWorkVariableson Work–family Conflict and Strain: A Control Perspective’, Journal of Applied Psychology,80,6-15.
Williams,P.,Pocock,B.andSkinner,N.(2008),‘“ClawingBackTime”:ExpansiveWorking Time and Implications for Work-life Outcomes in AustralianWorkers’,Employment & Society,22(4),737-748.
Wooden,M. and Fok, Y.K. (2013),Working at Home:Whatever Happened to theRevolution?,inRogerWikins(ed.),Families, Incomes and Jobs,8,106-113.
Wooden,M.,Warren,D.andDrago,R.(2009),WorkingTimeMismatchandSubjectiveWellbeing,British Journal of Industrial Relations,47(1),147-179.