isecdjcd----1111 - isid.ac.inskn/absvisecdjcd.pdf · professor kaushik basu (chief economic...
TRANSCRIPT

ISEC Diamond Jubilee Conference on Statistics, Economic Development and Public Administration
ISECDJCDISECDJCDISECDJCDISECDJCD----11111111
Indian Statistical Institute, 7, S. J. S SanIndian Statistical Institute, 7, S. J. S SanIndian Statistical Institute, 7, S. J. S SanIndian Statistical Institute, 7, S. J. S Sansanwal Marg sanwal Marg sanwal Marg sanwal Marg
New DelhiNew DelhiNew DelhiNew Delhi----110 016110 016110 016110 016
February 11February 11February 11February 11----12, 2011 12, 2011 12, 2011 12, 2011
Program and AbstractsProgram and AbstractsProgram and AbstractsProgram and Abstracts
- 2 -
Diamond Jubilee (1950Diamond Jubilee (1950Diamond Jubilee (1950Diamond Jubilee (1950----2010) of the2010) of the2010) of the2010) of the
INTERNATIONAL STATISTICAL EDUCATION INTERNATIONAL STATISTICAL EDUCATION INTERNATIONAL STATISTICAL EDUCATION INTERNATIONAL STATISTICAL EDUCATION CENTRECENTRECENTRECENTRE
ISECDJCDISECDJCDISECDJCDISECDJCD----11111111 Organized byOrganized byOrganized byOrganized by
Indian Statistical Institute, Delhi CentreIndian Statistical Institute, Delhi CentreIndian Statistical Institute, Delhi CentreIndian Statistical Institute, Delhi Centre
ContentsContentsContentsContents
Welcome……………………………………………………….3
Local Organizing Committee...………………………………4
Overview of Program…………………………………………5
Inaugural Session & Programme Schedule..….…………….7
Abstract of the papers ………………………………………11
Some Full papers…………………………………………..…31
Exhibition Contents…………………………………………142
- 3 -
Welcome to ISECDJCDISECDJCDISECDJCDISECDJCD----11111111 On behalf of the organizers of ISECDJCD-11, I welcome you in the ISEC Diamond Jubilee
Conference on Statistics, Economic Development and Public Administration at Indian Statistical
Institute, Delhi Centre. This conference will be organized as a part of Diamond Jubilee
Celebrations of the International Statistical Education Centre (ISEC, for details visit
http://www.isical.ac.in/~isecweb/) and it intends to review the current issues in the theory and
applications of Statistics, Economic Development and Public Administration.
This conference aims at discussing new developments and promises to build an interaction
between the users and researchers by bringing them together to address the important issues in
Statistics, Economic Development and Public Administration. The conference topics include
(but not limited to):
• Population Statistics: Problem & Prospects.
• Relation of Statistics and Public Administration.
• Issues in Economic Development: Developed vs. Developing Countries.
More information about social events will be available to you at the time of registration. You
may also contact me for further details about technical sessions, social events and Taj Mahal trip.
S. K. Neogy Convener Local Organizing Committee
- 4 -
Local Organizing Committee
Professor R.B. Bapat (Chairman)
Dr. N.K. Khatri
Professor Isha Dewan
Shri S.S. Sethi
Shri S.A. Srinivas
C E (A & F), ISI Kolkata
Professor P. Pal Choudhury
Professor Manoranjan Pal
Professor Premananda Bharati
Professor Ayanendranath Basu
Dr. Buddhadeb Ghosh
Mrs. Bhomra Chatterjee
Professor S.K. Neogy (Convener).
- 5 -
ISEC Diamond Jubilee Conference on Statistics, Economic ISEC Diamond Jubilee Conference on Statistics, Economic ISEC Diamond Jubilee Conference on Statistics, Economic ISEC Diamond Jubilee Conference on Statistics, Economic Development and Public AdministrationDevelopment and Public AdministrationDevelopment and Public AdministrationDevelopment and Public Administration
PrPrPrProgram Overviewogram Overviewogram Overviewogram Overview
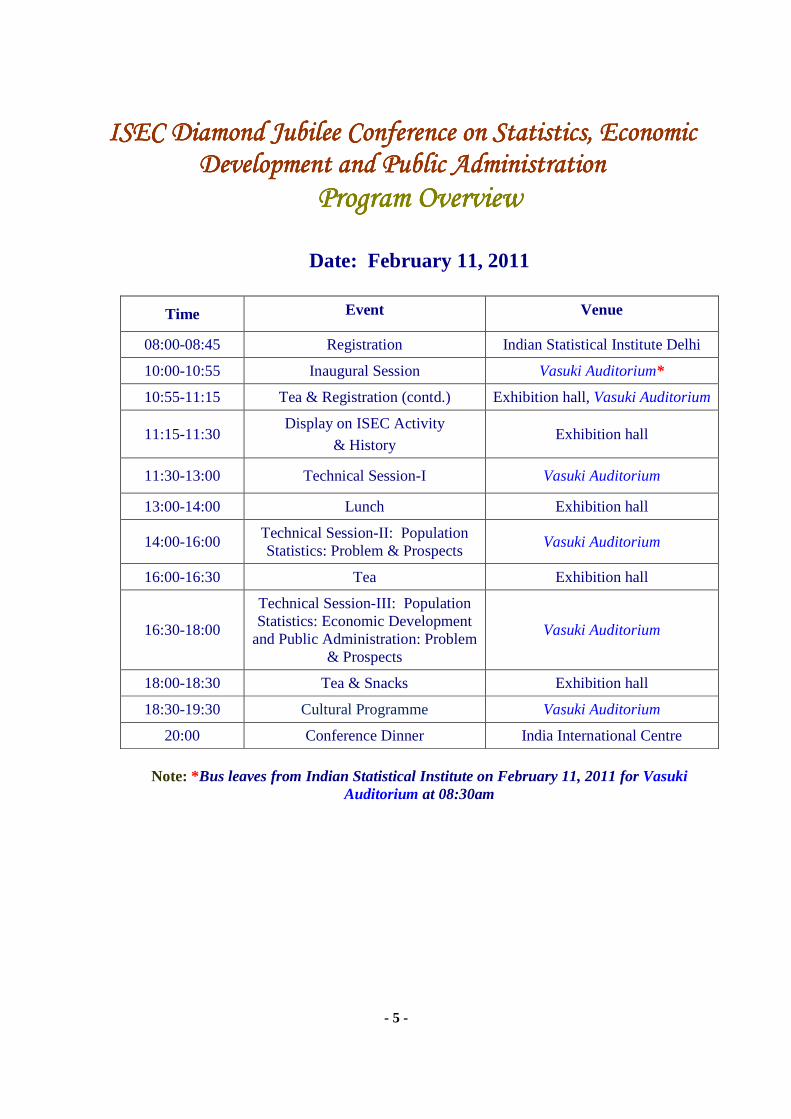
Date: February 11, 2011
Time Event Venue
08:00-08:45 Registration Indian Statistical Institute Delhi
10:00-10:55 Inaugural Session Vasuki Auditorium*
10:55-11:15 Tea & Registration (contd.) Exhibition hall, Vasuki Auditorium
11:15-11:30 Display on ISEC Activity
& History Exhibition hall
11:30-13:00 Technical Session-I Vasuki Auditorium
13:00-14:00 Lunch Exhibition hall
14:00-16:00 Technical Session-II: Population Statistics: Problem & Prospects
Vasuki Auditorium
16:00-16:30 Tea Exhibition hall
16:30-18:00
Technical Session-III: Population Statistics: Economic Development
and Public Administration: Problem & Prospects
Vasuki Auditorium
18:00-18:30 Tea & Snacks Exhibition hall
18:30-19:30 Cultural Programme Vasuki Auditorium
20:00 Conference Dinner India International Centre
Note: *Bus leaves from Indian Statistical Institute on February 11, 2011 for Vasuki
Auditorium at 08:30am

- 6 -
Program Overview (Contd.)Program Overview (Contd.)Program Overview (Contd.)Program Overview (Contd.)
Date: February 12, 2011
Time Event Venue
10:00-11:15 Technical Session-IV: Population
Statistics & Economic Development ISI Auditorium* *
11:15-11:30 Tea ISI Auditorium Lawn
11:15-11:30 Display on ISEC Activity
& History Conference Hall (Admin.
Building)
11:30-13:30 Technical Session-V: Economic
Development and Statistics ISI Auditorium
13:30-14:30 Lunch ISI Guest house Lawn
14:30-16:00 Technical Session-VI: Population
Statistics, Economic Development and Environment
ISI Auditorium
16:00-16:30 Tea ISI Auditorium Lawn
16:30-17:00 Concluding Session ISI Auditorium
17:00-17:30 High Tea ISI Auditorium Lawn
** Note: Located near Library Building of Indian Statistical Institute, Delhi Centre
February 13, 2011 Time: 07:30 –19:00 : Taj Mahal Trip

- 7 -
ISEC Diamond Jubilee ConferencISEC Diamond Jubilee ConferencISEC Diamond Jubilee ConferencISEC Diamond Jubilee Conference on Statistics, Economic e on Statistics, Economic e on Statistics, Economic e on Statistics, Economic Development and Public AdministrationDevelopment and Public AdministrationDevelopment and Public AdministrationDevelopment and Public Administration
February 11-12, 2011 Inaugural Session Details
February 11, 2011 Time: 10:00 -10:55 Venue: Vasuki Auditorium*
1. Welcome address: Shri R. B. Bapat, Head, Indian Statistical Institute Delhi Centre (05 minutes)
2. Address by Shri Pabitra Pal Choudhury, Member Secretary, Board of Directors, ISEC (5 minutes)
3. Address by Shri Bimal K. Roy, Director, Indian Statistical Institute (5 minutes)
4. Address by Shri T. C. Anant, CSI & Secretary Ministry of Statistics and Programme Implementations, Govt. of India (10 minutes)
5. Address by Shri Pronab Sen, Principal Adviser, Planning Commission and Former Chief Statistician of India (10 minutes)
6. Address by Shri M. S. Gill, Hon’ble Minister of Statistics and Programme Implementation (IC) (15 minutes)
7. Vote of thanks by: Shri S. K. Neogy, Convener Local Organizing Committee (5 minutes)
Note: Bus leaves from Indian Statistical Institute on February 11, 2011 for Vasuki Auditorium at 08:45am
Tea break: 10:55 – 11:15
February 11, 2011 Time: 11:15 -11:30 Visit to Exhibition hall
Technical SessionsTechnical SessionsTechnical SessionsTechnical Sessions DetailsDetailsDetailsDetails February 11, 2011 Time: 11:30 –13:00 Venue: Vasuki Auditorium
Technical Session –I: Keynote Address
Chairman :Professor Ashish Bose (Honorary Professor, The Institute of Economic Growth)
1. Professor Kaushik Basu (Chief Economic Adviser, Government of India, Ministry of Finance & C. Marks Professor (on leave) Department of Economics, Cornell University ) Indian Economy: The Challenges Ahead
2. Mr. Ronald Luttikhuizen (Senior Economist/Statistician, World Bank) Virtual Statistical System, A Knowledge Portal To Support Statistical Capacity Building
*Vasuki Auditorium, Lok Kala Manch, 20, Lodhi Institutional Area, Lodhi Road, New Delhi - 110 003. Vasuki Auditorium is located in the pristine environs of Lodhi Institutional Area (500 Mtrs. away from India Habitat Centre and located in the lane behind the SAI Baba Temple).
- 8 -
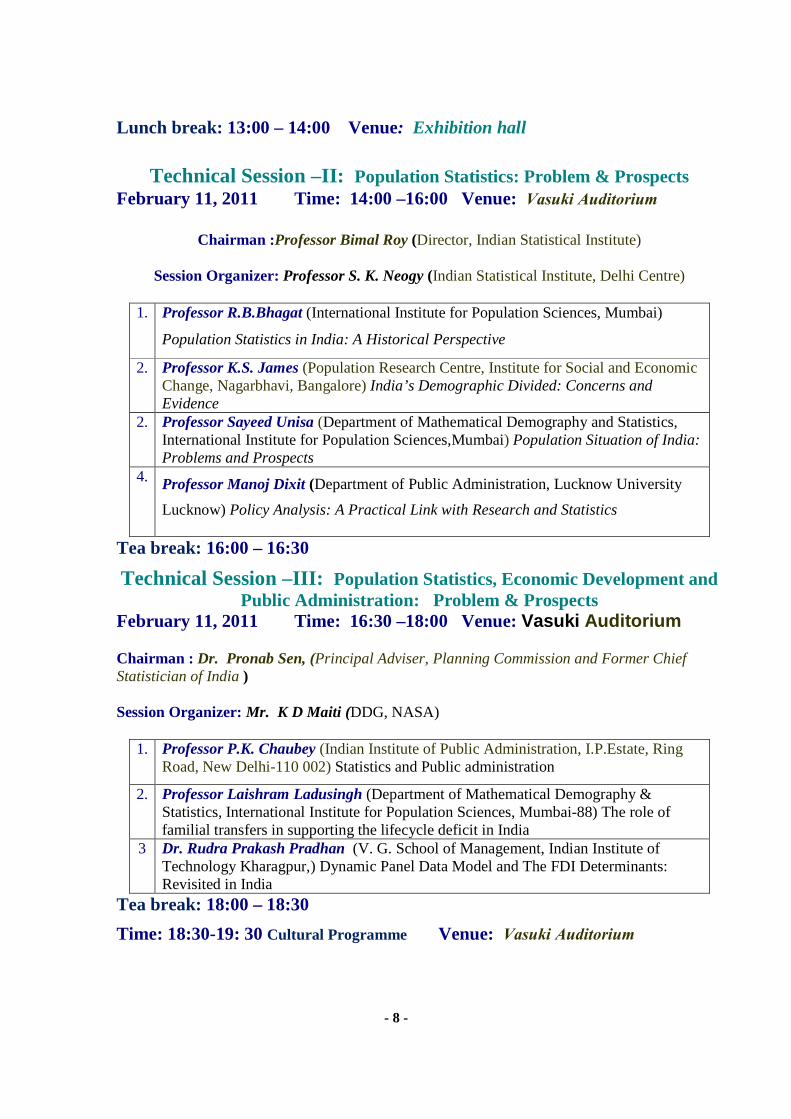
Lunch break: 13:00 – 14:00 Venue: Exhibition hall
Technical Session –II: Population Statistics: Problem & Prospects February 11, 2011 Time: 14:00 –16:00 Venue: Vasuki Auditorium
Chairman :Professor Bimal Roy (Director, Indian Statistical Institute)
Session Organizer: Professor S. K. Neogy (Indian Statistical Institute, Delhi Centre)
1. Professor R.B.Bhagat (International Institute for Population Sciences, Mumbai)
Population Statistics in India: A Historical Perspective
2. Professor K.S. James (Population Research Centre, Institute for Social and Economic Change, Nagarbhavi, Bangalore) India’s Demographic Divided: Concerns and Evidence
2. Professor Sayeed Unisa (Department of Mathematical Demography and Statistics, International Institute for Population Sciences,Mumbai) Population Situation of India: Problems and Prospects
4. Professor Manoj Dixit (Department of Public Administration, Lucknow University
Lucknow) Policy Analysis: A Practical Link with Research and Statistics
Tea break: 16:00 – 16:30
Technical Session –III: Population Statistics, Economic Development and Public Administration: Problem & Prospects
February 11, 2011 Time: 16:30 –18:00 Venue: Vasuki Auditorium
Chairman : Dr. Pronab Sen, (Principal Adviser, Planning Commission and Former Chief Statistician of India )
Session Organizer: Mr. K D Maiti (DDG, NASA)
1. Professor P.K. Chaubey (Indian Institute of Public Administration, I.P.Estate, Ring Road, New Delhi-110 002) Statistics and Public administration
2. Professor Laishram Ladusingh (Department of Mathematical Demography & Statistics, International Institute for Population Sciences, Mumbai-88) The role of familial transfers in supporting the lifecycle deficit in India
3 Dr. Rudra Prakash Pradhan (V. G. School of Management, Indian Institute of Technology Kharagpur,) Dynamic Panel Data Model and The FDI Determinants: Revisited in India
Tea break: 18:00 – 18:30
Time: 18:30-19: 30 Cultural Programme Venue: Vasuki Auditorium

- 9 -
Time 20:00 Conference Dinner Venue: India International Centre
Technical Session –IV: Population Statistics & Economic Development February 12, 2011 Time: 10:00 –11:15 Venue: ISI Auditorium, Indian Statistical Institute Delhi Centre
Chairman: Professor Ayanendranath Basu (Indian Statistical Institute, Kolkata)
1. Dr. Soumyadip Chattopadhyay (Department of Economics and Politics, Visva-
Bharati University, Santiniketan, India.) Decentralized Urban Governance in West Bengal: Does Rhetoric Match Reality?
2. Dr. Sharda Kumari (Rajkumar Goel Engineering College, Ghaziabad) & Dr. Kadambini Kumari (Indira School of Business, Pune) Comparative analysis of Developed vs. Developing Countries on varies Economical parameters
3. Dr. Biswajit Mandal (Visva-Bharati University, Santiniketan, India and Professor Sugata Marjit Centre for Studies in Social Sciences, Calcutta, India and The Leverhulme Centre for Research on Globalisation and Economic Policy University of Nottingham, UK.) Economic Reform, Extortion and the Informal Sector
Technical Session –V: Economic Development and Statistics
February 12, 2011 Time: 11:30 –13:30 Venue: ISI Auditorium, Indian Statistical Institute Delhi Centre
Chairman: Professor Atul Sharma
Session Organizer: Professor Bharat Ramaswami (Indian Statistical Institute, Delhi Centre)
1. Professor Indira Rajaraman, Ex-member, Finance Commission and Honorary Visiting Professor, Indian Statistical Institute, Delhi) Core Issues in a Statistical System
2. Professor K. Kanakasabapathy (Director, EPW Research Foundation, Mumbai ) Financial Sector Statistics and Development Issues
3 Professor R. Nagaraj (Indira Gandhi Institute of Development Research, Mumbai) Quality of India’s Economic Statistics: A Skeptical Note
Lunch : 13:30 – 14:30 Venue: Indian Statistical Institute Guest house
- 10 -
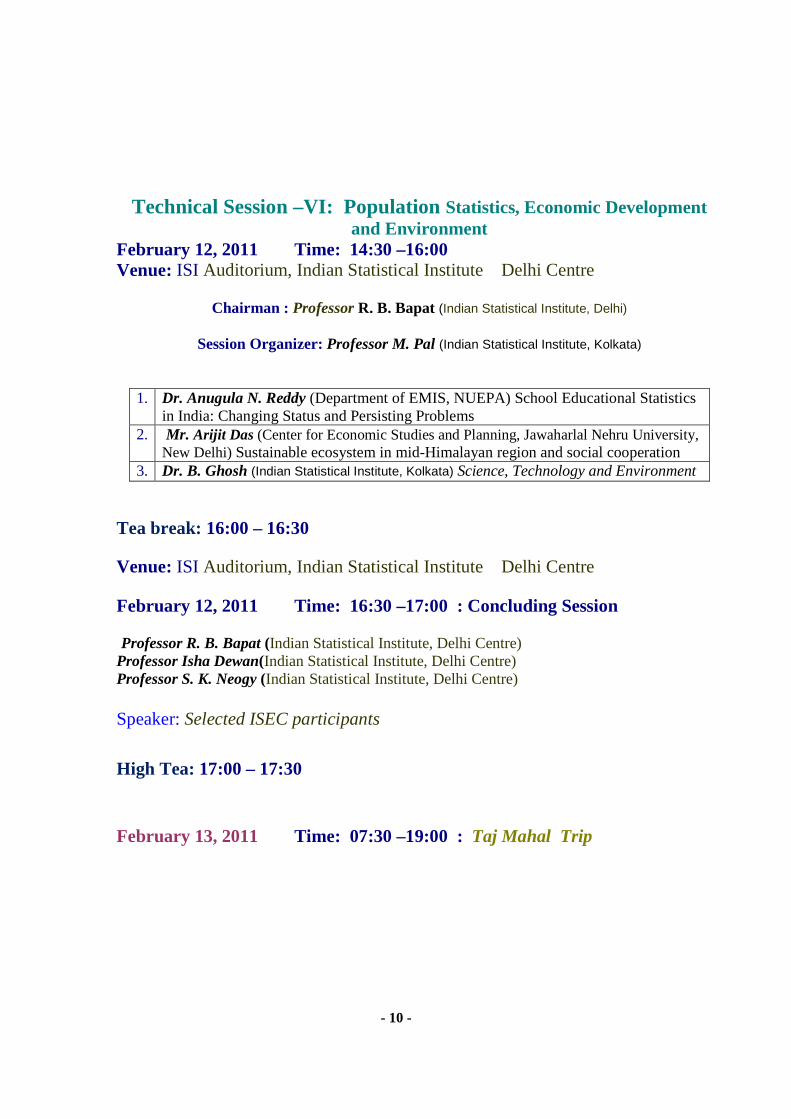
Technical Session –VI: Population Statistics, Economic Development
and Environment February 12, 2011 Time: 14:30 –16:00 Venue: ISI Auditorium, Indian Statistical Institute Delhi Centre
Chairman : Professor R. B. Bapat (Indian Statistical Institute, Delhi)
Session Organizer: Professor M. Pal (Indian Statistical Institute, Kolkata)
1. Dr. Anugula N. Reddy (Department of EMIS, NUEPA) School Educational Statistics
in India: Changing Status and Persisting Problems 2. Mr. Arijit Das (Center for Economic Studies and Planning, Jawaharlal Nehru University,
New Delhi) Sustainable ecosystem in mid-Himalayan region and social cooperation 3. Dr. B. Ghosh (Indian Statistical Institute, Kolkata) Science, Technology and Environment
Tea break: 16:00 – 16:30
Venue: ISI Auditorium, Indian Statistical Institute Delhi Centre
February 12, 2011 Time: 16:30 –17:00 : Concluding Session
Professor R. B. Bapat (Indian Statistical Institute, Delhi Centre) Professor Isha Dewan(Indian Statistical Institute, Delhi Centre) Professor S. K. Neogy (Indian Statistical Institute, Delhi Centre) Speaker: Selected ISEC participants
High Tea: 17:00 – 17:30
February 13, 2011 Time: 07:30 –19:00 : Taj Mahal Trip

- 11 -
ABSTRACT OF THE PAPERSABSTRACT OF THE PAPERSABSTRACT OF THE PAPERSABSTRACT OF THE PAPERS Indian Economy: The Challenges Ahead
Kaushik Basu
Chief Economic Adviser, Government of India, Ministry of Finance
& C. Marks Professor (on leave)
Department of Economics, Cornell University
Virtual Statistical System,
A Knowledge Portal To Support Statistical Capacity Building
Ronald Luttikhuizen, World Bank/DECDG/DGSDP

- 12 -
Population Statistics in India: A Historical Perspective
R. B. Bhagat
Department of Migration and Urban Studies
International Institute for Population Sciences, Mumbai-88
E-mail: [email protected]
The modern demographic statistics in India has a strong colonial root with the beginning of
census in 1872. The 2011 census to be conducted in February 2011 would be the 15th census in
India. Although census during British period was not only a source of size, growth, age and sex,
marital status, educational levels and rural and urban composition of population, but also there
was an overriding concern for demographic data by caste and religion . The census in this
context played more importantly an instrument of governance rather than an instrument of
development planning. This is evident in the fact that the Census of India still continues to be
part of the Ministry of Home Affairs unlike British Census controlled by an independent
Statistical Authority and US Census working under the Department of Commerce. After
independence, however, its role has been recast after dropping the question of caste from the
census except for the questions on SCs and STs. On the other hand, the rural- urban
classification, workforce composition and migrant and non-migrant composition of population
have gone through several definitional changes. Further, since 1991 Census housing tables have
been expanded to include household amenities like electricity, sources of drinking water, toilet
facility and household assets like car, television, telephone/mobile phone, refrigerator, motor
cycle, bank account etc. This paper discuses the changing nature of the economic and social
aspects of population data over the censuses in India.

- 13 -
India’s Demographic Divided
Concerns and Evidence K.S. James
Population Research Centre Institute for Social and Economic Change
Nagarbhavi, Bangalore-560072 E. Mail: [email protected]
With many developing countries including India are currently experiencing faster growth
of working age population, there has been an overwhelming optimism that the demographic
bonus will take these countries to newer economic heights. The scepticism on the possible
demographic advantage for India due to change in the age structure more towards adult
population has been growing over the last few years. On the contrary, the pessimists mainly
argue that India might experience a demographic burden or nightmare due to poor educational
status and skill development among the large mass of population in the working age group.
However, most of these arguments remain as rhetoric without any systematic analysis of
empirical data and estimating the complex linkages between population change and economic
growth.
This study looks at the concept of demographic dividend more critically in the context of
India. The regression method using the panel data has been used widely for estimating
demographic dividend in many countries. The other possible approach is macro-economic
simulation. This study uses the regression both the methods to understand the effect of age
structure change on the economic performance of India. The empirical analysis clearly exhibits
the powerful positive impact of working age group population boom on economic growth in the
country. This is despite the fact that the education and health conditions of the people are still
poor. The rapid reduction in the number of children in many states provided several household
level benefits particularly higher levels of saving and the resulting in beneficial impact on
economy. India is likely to enjoy the benefits of demographic advantage for a few more decades
due to wide variation in the achievement of fertility transition in different states.

- 14 -
Population Situation of India: Problems and Prospects
Sayeed Unisa
Department of Mathematical Demography and Statistics International Institute for Population Sciences,
Deonar, Mumbai 400088 Email: [email protected]
This paper examines the possible implications of past, present and future trends in population
size and rates of growth in India. A discussion of quality of age, sex data in the past will be
carried out before projection of population. Various approaches to formulating population
projection with educational level will be discussed. This paper will also present situation of
major states of India with their age-sex pyramid, population size and growth. Different states of
India will reach peaks in their total population, working population, and aging population at
different times as the rate of decline of fertility and mortality are not the same for all states.
Problems and prospects of population size and growth in future will also me multifaceted in
India as contrast situation of high fertility in some states and rapid fertility with aging in other
states will be prevailing. The paper suggests that in order for population problems to be solved,
the population programmes need to be developed and implemented within the framework of each
state’s development plans.
- 15 -
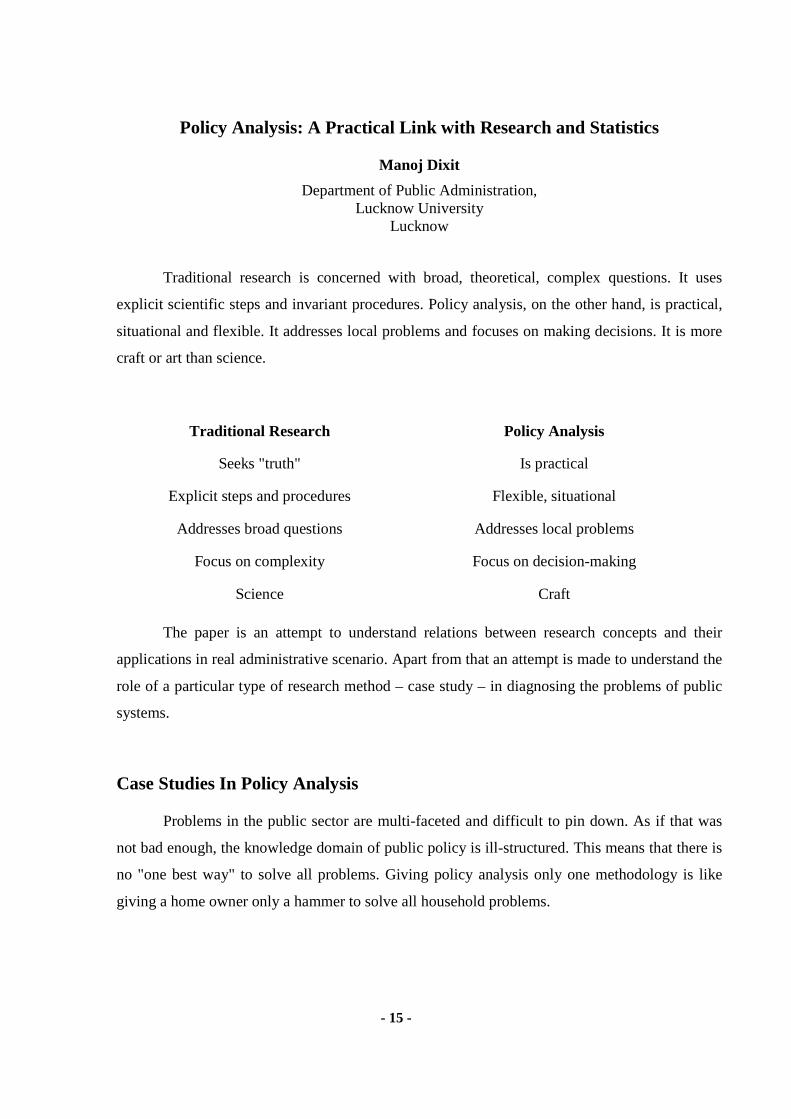
Policy Analysis: A Practical Link with Research and Statistics
Manoj Dixit
Department of Public Administration, Lucknow University
Lucknow
Traditional research is concerned with broad, theoretical, complex questions. It uses
explicit scientific steps and invariant procedures. Policy analysis, on the other hand, is practical,
situational and flexible. It addresses local problems and focuses on making decisions. It is more
craft or art than science.
Traditional Research Policy Analysis
Seeks "truth" Is practical
Explicit steps and procedures Flexible, situational
Addresses broad questions Addresses local problems
Focus on complexity Focus on decision-making
Science Craft
The paper is an attempt to understand relations between research concepts and their
applications in real administrative scenario. Apart from that an attempt is made to understand the
role of a particular type of research method – case study – in diagnosing the problems of public
systems.
Case Studies In Policy Analysis
Problems in the public sector are multi-faceted and difficult to pin down. As if that was
not bad enough, the knowledge domain of public policy is ill-structured. This means that there is
no "one best way" to solve all problems. Giving policy analysis only one methodology is like
giving a home owner only a hammer to solve all household problems.

- 16 -
A new approach is needed to learning in this area. This approach is offered by case
studies. Case studies link problems to a reality; they offer the opportunity for the application of
policy analysis techniques in a concrete context.
The way information is remembered and use is linked to the way it is learned. Case
studies provide cues to the types of techniques that are needed to approach a solution to the
problem. These cues help policy analysts learn multiple approaches to learning and to problem
solving.
Use of case studies will help to:
1) Recognize situations where analysis is appropriate and productive;
2) Become competent in the application of different approaches and methods;
3) Learn how to communicate the results of policy analysis.
- 17 -
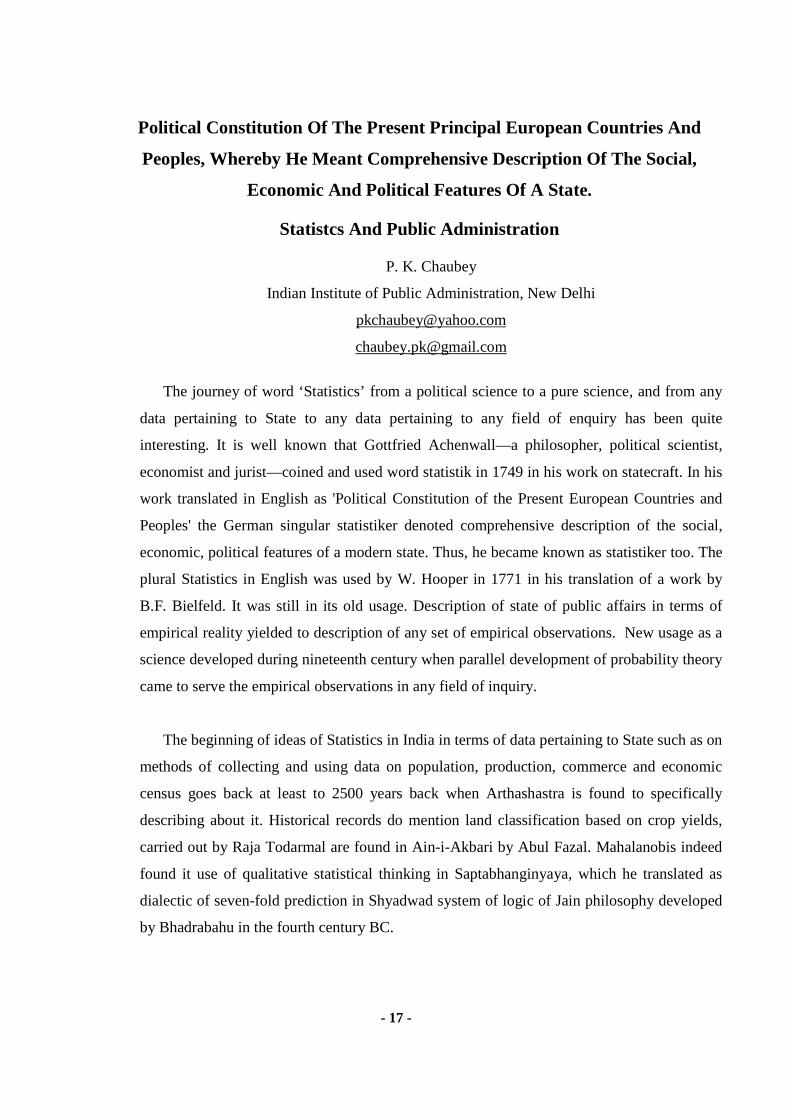
Political Constitution Of The Present Principal European Countries And
Peoples, Whereby He Meant Comprehensive Description Of The Social,
Economic And Political Features Of A State.
Statistcs And Public Administration
P. K. Chaubey
Indian Institute of Public Administration, New Delhi
The journey of word ‘Statistics’ from a political science to a pure science, and from any
data pertaining to State to any data pertaining to any field of enquiry has been quite
interesting. It is well known that Gottfried Achenwall—a philosopher, political scientist,
economist and jurist—coined and used word statistik in 1749 in his work on statecraft. In his
work translated in English as 'Political Constitution of the Present European Countries and
Peoples' the German singular statistiker denoted comprehensive description of the social,
economic, political features of a modern state. Thus, he became known as statistiker too. The
plural Statistics in English was used by W. Hooper in 1771 in his translation of a work by
B.F. Bielfeld. It was still in its old usage. Description of state of public affairs in terms of
empirical reality yielded to description of any set of empirical observations. New usage as a
science developed during nineteenth century when parallel development of probability theory
came to serve the empirical observations in any field of inquiry.
The beginning of ideas of Statistics in India in terms of data pertaining to State such as on
methods of collecting and using data on population, production, commerce and economic
census goes back at least to 2500 years back when Arthashastra is found to specifically
describing about it. Historical records do mention land classification based on crop yields,
carried out by Raja Todarmal are found in Ain-i-Akbari by Abul Fazal. Mahalanobis indeed
found it use of qualitative statistical thinking in Saptabhanginyaya, which he translated as
dialectic of seven-fold prediction in Shyadwad system of logic of Jain philosophy developed
by Bhadrabahu in the fourth century BC.

- 18 -
The same could be said about the West or China. Christ was born during the period of
conducting of census—when people were supposed to come and record details about them in
places designated by State.
However, humans did not wait for formal arrival of Statistics either sense. They have
always been using experience of their own or their brothern and observations made out of
experiments and also used. They seem to be using almost from antiquity the idea of sampling
and indulged in decision-making in uncertainty always history. Around 20 years ago, in his
CSIR lecture—entitled Statistics and Truth—CR Rao made a incisive observation that
‘Statistics as a method of learning from experience and decision-making under uncertainty
must have been practiced from the beginning of mankind.’ The same assertion can perhaps
be made about other beings with only difference that human experience could be passed on
to successive generations. In a way, it seems humans learnt from history and extrapolated
history. Statistics in this sense is a particular way of dealing with history—which can now be
looked as selected collection of facts. This is how Klein looked as Econometrics.
Contemporary data can thus be viewed as contemporary history for this purpose.
Data relate to any observation, not necessarily those converted to numeric way. After all,
there are only two questions out of seven W’s, viz. how many and how much/less, that refer
to quantitative dimensions. Numbers do not come alone. However, in the phase when science
meant ‘measure and measure only’, data came to mean numerical data for most of the
students so much so that they could not think of qualitative variable. Thanks to computer
terminology, practical everybody has realized the real meaning of data as givens.
While data or observations, however made, were collected and used by all varieties of
scientists as well as by lay-persons—the former laying down or following some set
procedures, those specifically collected by or behalf of State (say by churches) were used by
the State for State purposes—which in earlier days were supposed to military and revenue.
That is why, in certain phases of history, only male members were counted as only they came
to be conscripted for armed forces. So the data—social, economic, political or
religious/secular—collected on population, production, lands, livestock, estates, commerce,
revenue, etc could properly be called statistics.

- 19 -
However, when formal methods of classification, analysis, summarization and
presentation were devised, word Statistics came to denote both the data as well as the science
of inferring from them. When the idea of using probability, rather specifying the amount of
uncertainty, came to help the analysis, we came to classify Statistics itself as Descriptive
Statistics and Inferential Statistics.
Inductive reasoning, though used from antiquity, was not codified because
people/scholars could not realize that amount of uncertainty could be specified till the middle
of nineteenth century. Once this was realized it became clear that statistics could be applied
every where. As CR Rao says ‘all sciences in the abstract are mathematics and all methods of
acquiring knowledge (about the world) as statistics’ as the phenomenal word is statistical or
call it stochastic.
It could be easily realized that Statistics originally to State and statecraft only, which
means it related to societies with state. Non-societies also had data but no statistics. A chief
characteristic of the state is that it has military, a specialized section of society, which
presupposes certain rise in productivity so that a section of society could be maintained
exclusively to fight with others without being engaged in productive work. Counting people
was essential for military purposes and hence the census was started. Military could not be
maintained by the state without revenue, of course in-kind in early days, bases for revenue
had to be assessed. By then, it could be realized, the system of private property should have
emerged even though state could conscript labour for generating wherewithal for state.
Existence of state also presupposes bureaucracy or public administration to manage its
affairs—military and civil. In a private property society, even law and order becomes
important. Public administration is often narrowly defined as officials tasked with carrying
out or implementing decisions made by the state but is broadly defined to cover practically
all aspects of state activity. Though it is true that in a democratic state, a distinction between
political and bureaucratic, between those elected by the people as representatives and those
selected for carrying out orders by the representatives is duly made, yet the distinction cannot

- 20 -
be carried too far as interaction between the two is now too complex, almost organic. So, all
the state activities can be taken as public administration for the present purpose.
With passage of time, activities of the state transformed a great deal: from watch-and-
ward state to welfare state; from defending from external aggression and internal
disturbances to removing poverty and providing employment; and from taxing people and
activities to subsidizing some of the activities. It was once upon a time to protecting life and
property but now it is said to be life, liberty and property. State now covers practically all
public affairs which were once upon a time were taken care of communal processes but for
emergence of non-government organization on the horizon.
State was supposed to an agency of society for carrying out certain function. However,
agencies develop a tendency of becoming autonomous. And state slowly emerged as most
powerful and therefore coercive monopoly. In some treatises of political science, state was
held as unifier of its society, which has a lot of meaning in a multi-ethnic state.
Countervailing forces, again over time, tried to subdue this tendency. The operation of state
changed, as a result, from the rule of king to republican rule. However, it did not resulted in
diminution of its activities but only tremendous increase. But there is often two way flow
state-citizen interactions.
State activities can for the sake of convenience be grouped in three categories, (i)
decision-making, (ii) policy-making, and (iii) opinion-making. State can seek and does seek
active support from the academia in each of these. Statistics come handy in all the three. This
is done both in terms collection of facts—data, qualitative and quantitative, as well as using
statistical tools that have been developed to analyze the facts and forecast events and
processes. Mahalanobis indeed remarked once upon a time that statistics is a modern
technology of the present (twentieth) century whereas technology is supposed to help solve a
societal problem or resolve a societal issue. Technology is a social product and it can be said
that statistics emerged in a way as a tool or fashions tools for analysis of societal problems,
including those of scientists from physicists to economists to astronomers to
biotechnologists, to name a few.

- 21 -
Activities of decision-making, policy-making and opinion-making require knowledge of
why and how but before that whether it is an issue and if it is an issue what priority does it
merit, given the scarcity of resources. These activities are normally in the secular domain of
social, cultural, political and economic domain and all policies pertaining to science and
technology, including information technology and biotechnology, fall in these categories
inasmuch as do sports policy and girl child policy.
Statistics is needed in both of its forms. Collection of facts has to be done through
economical methods is fine. But whether census has to be conducted or sampling is enough
or better. Whether census has to be supplemented by sample could be an issue. What should
be the design of sampling procedure as well as what could be proper questionnaire, if
necessary. Whether one requires time series data or cross-sectional data is enough or purpose
requires pooled data or panel data. Whether it is doing only once or it is systematically
collected over time. Whether a change is warranted or whether continuity has to be
maintained. The tools have to be fashioned even if the broad principles are known.
Depending upon the data whether one has conduct univariate analysis or multivariate one.
How to select appropriate tools or to devise a new one, if possible, depends on the purpose in
hand and inclination of the researcher. Public administrators can do certain things on their
own but can involve/engage scholars/professionals to do the job. In any case, statistical
inputs become necessary in making any of these.
Some of decisions and policies are to be made only when popular opinion is their favour.
Some archaic values may prevent their implementation. And it may become necessary for the
state to gauge the mood of the people and try to change their thinking in a multi-ethnic
context. The state may choose to refrain from attempting any change.
Decisions and policies are made but they do not work for eternity. They need to be
monitored while under implementation and concurrent evaluations may be undertaken.
Decisions implemented, if reversible, have to be evaluated. Policies in any case have
evaluated and statistics come very handy. Recent economic events have revealed the
importance of statistics even though they have been in use now for long, despite the debate
and quarrels on appropriateness of statistical data and statistical tools.
- 22 -
The Role Of Familial Transfers In Supporting The Lifecycle Deficit In India
Laishram Ladusingh Department of Mathematical Demography & Statistics
International Institute for Population Sciences Mumbai-400088 (India)
Email: [email protected]
M.R. Narayana Center for Economic Research Unit
Institute for Social and Economic Change Bangalore- 560072 (India)
Email:[email protected]
Abstract
This paper has examined age patterns of per capita consumption in India by sector, emphasizing
the socio-cultural significance of intra-household transfers to support the lifecycle deficit. We
have used the analytical framework of National Transfer Accounts and data from India Human
Development Survey (IHDS), conducted during 2004–05 (NCAER) and National Account
Statistics (CSO 2006). Education and health care are the main forms of consumption that
produce a lifecycle deficit among the young and elderly individuals. We found that young and
elderly dependents respectively account for 3% and 5% of aggregate labour income and 34% and
9% of aggregate consumption. Familial transfers from household members with disposable
income go mostly to members below age 20, accounting for 51% of the lifecycle deficit of this
age group, whereas intra-household transfers to members of ages 60+ fall far short of their
lifecycle deficit. The main conclusions we draw from this study are that India has a shortage of
public funding to meet the lifecycle deficit of its population, and that children and the elderly
would not be able to consume essential goods and services were it not for the existence of
familial transfers in general and intra-household transfers in particular.

- 23 -
Dynamic Panel Data Model and The FDI Determinants: Revisited in
India
Rudra Prakash Pradhan
V. G. School of Management
Indian Institute of Technology Kharagpur,
Abstract
The paper deals with different characteristics of panel data models to examine the determinants
of FDI inflows in India. Using the data over 2001-2008, it finds that the main determinants of
FDI inflows are the availability of power, domestic investment and profit. It further justifies that
higher profitability increases FDI inflows into a state, while larger variability in it can reduce the
same.
Keywords: Dynamic panel data model, FDI, India
Decentralized Urban Governance in West Bengal: Does Rhetoric Match
Reality?
Soumyadip Chattopadhyay
Department of Economics and Politics
Visva-Bharati University, Santiniketan – 731 235
West Bengal India.
E-mail: [email protected]
Abstract
One of the major promises of decentralization is that it brings popular participation and
accountability to local governance and, therefore, makes local government more responsive to
citizens’ desires and more effective in delivering services. The 74th Constitutional Amendment
Act in India provides the much needed platform to operationalize the rhetoric of decentralization
into reality. This amendment marks a distinct watershed in the concept and practice of citizens’
participation in urban governance. Acknowledging the importance of participation in democratic
local government, this paper, using primary data, evaluates the implications of constitutional
provisions for participation and accountability at the municipal level in West Bengal. The study
finds that a large gap exists between the rhetoric surroundings the constitutional provisions and

- 24 -
their actual implementations. Political nature of the ward committee and thin attendance of the
citizens in the meetings put a question mark on the efficacy of the WC as a true participative
forum at the municipal level. The numerical representation has not transformed into effective
representation with respect to participation of elected representatives and their accountability in
municipal governments.
Comparative analysis of Developed vs Developing Countries on varies
Economical parameters
Sharda Kadambini Kumari,
Rajkumar Goel Engineering College, Indira School of Business Ghaziabad Pune-411 033
E-mail ID: [email protected] e-mail ID: [email protected]
Abstract
Economic development is the increase in the standard of living in a nation's population with
sustained growth from a simple, low-income economy to a modern, high-income economy Also,
if the local quality of life could be improved, economic development would be enhanced. Its
scope includes the process and policies by which a nation improves the economic, political, and
social well-being of its people.
Our research work will reflect on the comparing developing & developed countries on the
different issues under following parameters as follows:
• Education
• Contribution to GDP
• Socio-Cultural Aspect
• Tends to grow or downsize
• Impact on future economical structure of the country
* Key Words: Gross Domestic Product (GDP),Gross National Product (GNP), Human
Development Index (HDI), the less developed countries (LDC), Purchasing power parity (PPP)

- 25 -
Economic Reform, Extortion and the Informal Sector
Biswajit Mandal
Visva-Bharati University, Santiniketan, India
and
Sugata Marjit
Centre for Studies in Social Sciences, Calcutta, India
and
The Leverhulme Centre for Research on Globalisation and Economic Policy
University of Nottingham, UK
Abstract
Informal economy involving unrecorded, unregistered, extra legal activities employs majority of
the workforce in the developing world. Such extra legal existence of informal manufacturing and
service sectors is facilitated through extortion by agents of political forces in power. Such
extortion activities themselves constitute an informal segment. We develop a general equilibrium
model to explore the possible consequences of a change in the fee of extortion, change in the
quality of administration, tariff reform etc. Economic reform of various kinds has interesting
effects on the size of the extortion sector. Various reformatory policies may actually lead to an
expansion of the extortion component of the informal sector.
Key words: International Trade, Extortion, General Equilibrium.
- 26 -
Core Issues in a Statistical System
Indira Rajaraman
Ex-member, Finance Commission
and Honorary Visiting Professor, Indian Statistical Institute, Delhi
Abstract
One of the paradoxical developments over the last quarter century has been that even as
developing countries have exhibited improved growth momentum, dissatisfaction has grown
over the adequacy of GDP as a measure of well-being, and even with GDP growth as a target of
achievement. A number of alternative measures of the human condition have been advanced,
such as the Human Development Index of the UNDP, which averages over direct measures of
educational and health attainments. In recent years there have even been whole commissions set
up to examine possible measures of human happiness, and whether these are at all correlated
with GDP growth.
While not denying the obvious limitations of GDP as a measure of human well-being, alternative
measures of human well-being can only be in the nature of supplements to GDP, which will
remain the most basic measure that a statistical system has to get right. Even more importantly,
sub-national disaggregates of national GDP yield the only comprehensive handle on within-
country regional inequality. At the end of the day, redistributive fiscal flows have to be
predicated on some nationally acceptable measure of within-country inequalities, and measures
of income originating and income accruing at subnational levels remain the most fundamental.
Economic development also relies critically on macroeconomic stability, for which good
measures of headline and core inflation are needed.
Finally, any data system has to insure against special purpose data collection, where the special
purpose could shape expectations about the use to which the data will be put, and therefore carry
implicit incentives to distort the data reported.
These are the three issues on which the talk will focus, using illustrations from the Indian
statistical system to show how, even today, these measurement issues continue to confound
important decisions bearing on development policy.

- 27 -
Financial Sector Statistics and Development Issues
K. Kanakasabapathy
Director, EPW Research Foundation, Mumbai
Abstract
I. Role of finance in the development process--brief outline of mainstream thinking. Inter-
relationship between real and financial sector activities. Stages of financial development and
complexities of modern financial system. Lessons from the recent global financial crisis.
II Scope and diversity of financial sector statistics: money, banking, non-banking financial,
money, foreign exchange, government securities and capital markets, insurance, small savings,
provident funds and pension funds, fiscal and external sectors. Formal and informal sectors.
Domestic and cross-border.
III Need for data generation. Perspectives of users-- micro and macro level monitoring of
financial sector activities by regulators, supervisors and credit rating agencies; market analysis
and forecasting by market agents, analysts and advisors; empirical validation of theories and
models by Economists and researchers.
IV. Sources of Data and data dissemination process. Real time and historical time series data
needs. Role of official, private and non-profit organizations and think-tanks. Issues on
Transparency and disclosure.
V. Data gaps, despite data and information deluge. Compliance with Special Data Dissemination
Standards.
VI. Gaps identified by the National Statistical Commission and the Committee on Savings and
Investment.
VII. Concluding Observations.
- 28 -
Quality of India’s Economic Statistics: A Skeptical Note
R. Nagaraj
Professor, Indira Gandhi Institute of Development Research
Mumbai
Abstract
India’s official statistical system, in comparison to most developing countries, is considered to be
better, both scientifically and institutionally. But, of late, the data quality are said to have
deteriorated. This is illustrated with a few examples from the output estimates of manufacturing
and services sectors, which have a bearing on our understanding of the recent economic
performance.
Similarly, while the world is enthralled by China’s unprecedented economic growth, serious
scholars have harboured many doubts about its underlying statistics. Although the official data
have improved enormously since the reforms, many serious shortcomings seem to remain. The
paper will also briefly illustrate the problem with a few examples.
Why have India’s statistics deteriorated? Attributing it to the “government failure”, policy
makers have encouraged outsourcing to improve their efficiency. In our view, the reason lies in
the failure to enforce the minimum rules to record the inception, output growth and closure of
factories, offices and firms – abdicating the basic functions of the sovereign, in the name of
entrepreneurial freedom and incentives.

- 29 -
School Educational Statistics in India:
Changing Status and Persisting Problems
Anugula N. Reddy
Department of EMIS, NUEPA
Sustainable ecosystem in mid-Himalayan region and social cooperation
Arijit Das
Ph.d Student
Center for Economic Studies and Planning
Jawaharlal Nehru University
Email: [email protected]
Abstract
Property rights and management of common property resources such as forests, fisheries and
irrigation systems has becoming a central issue in environmental economics and policy. This
paper studies cooperative actions among the villagers in mid-Himalayan region. This study uses
the data of 165 villages equally spread over mid- Himalayan region of Uttaranchal and Himachal
Pradesh, collected during late 90s by a group of researchers consists of Jean-Marie Baland,
Pranab Bardhan, Sanghamitra Das and Dilip Mookherjee.
The data shows about 44 percent of the respondent of 165 villages are concerned about the
degradation of the forests around their villages. Only 105 responses indicate some type of action
to protect neighbouring forests. This means only 17 percentage of the respondents acknowledged
that some type of action taken place. In terms of villages, numbers of villages experience some
type of cooperative action is negligible. But another striking result is that collective action is not
absent in the surveyed villages. In public goods we could observe presence of a fair amount of
- 30 -
collective activities. In electricity provisions we could find that about 70 percent of respondent
tells that it is collective action by the villagers. In other public goods provisions also we could
observe fair amount of cooperation among the villagers.
This opposite result raises questions about cooperative activities among the villagers. Their
cooperative activities could be purely need based and rational rather than evolutionary. In this
research I would try to find cause of cooperative activities of the villagers and effect of factors
like heterogeneity, norm, social capital, institution set ups, external effect (NGOs) and need in
collective activities in forest maintenance.
Science, Technology and Environment
B. Ghosh
Indian Statistical Institute
203, B. T. Road
Kolkata
\

- 31 -
SOME FULL PAPERSSOME FULL PAPERSSOME FULL PAPERSSOME FULL PAPERS
Virtual Statistical System
A Knowledge Portal To Support Statistical Capacity Building.
Ronald Luttikhuizen, World Bank/DECDG/DGSDP
Introduction The Development Economics Data Group (DECDG) Directorate of the World Bank has one unit
that is called Statistical Development and Partnerships (DGSDP).
Our business is to improve the capacity of developing countries to produce statistics. This
business needs and can be improved. Statistics as outputs are specific kinds of knowledge
products. They try to tell a story over the world with concepts and numbers. The assumption is
that the concepts are meaningful and the numbers correct.
Statisticians are the knowledge workers and the knowledge producers. They need to understand
the concepts, and where these come from and how to use methods to create correct numbers.
And they need to know a lot more than that. Generally speaking statistical organizations face a
shortage of knowledge and a lack of access to relevant knowledge.
When we look at the costs of the production of statistics we see that normally 80% is caused by
the staff. The rest is costs of IT infrastructure, equipment, building, travel, etc. For the staff to be
able to do their work they need to have access to the relevant knowledge. That is key. This
means that the knowledge they access need to be useful, and usable. Further the staff in statistical
offices needs to be able to absorb that knowledge and to communicate about it. The VSS is
design to support all this.
The VSS projected started with one meeting of a group of interested organizations and countries.
They approved the approach proposed by the World Bank.
1. VSS Principles.
The VSS is built on certain principles. First there is the policy principle of the World Bank: The
Bank wants to provide Open Data, Open Knowledge and Open Solutions. There are two
considerations. One: in the development policy the aim is that developing countries are being
helped to help themselves and to solve their own problems. By making data available to them
they can use the data and study their situation. With the VSS they have access to a vast range of

- 32 -
information that is needed to understand what should be considered to improve and change. With
the VSS they also have part of the tools (read knowledge) at their disposal to be correctly
informed and to make the right decisions. At least they can have a proper and informed
discussion about the topics.
Secondly, in practical terms the relevant knowledge about statistics is structured in such a way
that it makes it very easy to understand what knowledge is available and how this knowledge is
related to other types of knowledge. Moreover: the VSS (VSS Wiki) provides the opportunity for
statisticians to upload their own information, to enter into discussions while using the discussion
groups and to make use of an e-learning program that has been developed to complete the VSS.
This makes that the VSS is a fully integrated tool that allows the user to make full and complete
use of the options it provides.
2. The VSS Home Page.
The VSS home page is the opening page. The site is based on two sides. Left and Right.
The left side is presenting the Activities. These ACTIVITIES is the total of general knowledge
that a statistical organization needs to have in order to conduct its work.
It is based on 10 activities. Each of these can be divided into subgroups again, and in some cases
again in sub-sub-groups. The order of these 10 Activities is based on the logical structure of the
statistical production process. Each statistical organization, especially the national statistical
offices, can be considered as organizations that follow a general pattern of activities. Generally
speaking one can say that one activity is a condition for the next activity to work properly. In the
end good quality statistics also depend on the user-community. Professional users tend to have
the effect of an increase in the quality of statistics. Also on the left side are a number of selected
sites that are useful to consider.
The right site is presenting the THEMES. The themes are the subject matter topics or domains
about which statistics are produced. The list of these topics is based on an internationally agreed
classification of statistical topics. There are five main groupings, with many sub-groupings and
even some sub-sub-groupings. Also on the right site is presented the list of comments that are
made by users of the site.
5. Why VSS
VSS addresses serious knowledge ( access & shortage) problems in partner countries. This
includes: Structural lack of access to knowledge. People leave their functions and newcomers
need to be retrained. Also there is a growing need for archiving. Further there is a growing need

- 33 -
to have easy accessible study materials within reach for all workers in statistics. The aim of the
VSS is to deliver statistical knowledge for all.
6. VSS and endless knowledge.
VSS is the beginning, but not the end. Knowledge is endless, VSS is endless:
In theory there is a vast amount of knowledge available about statistics to learn from. But the
information people need is often not easy to find. Again in theory one can define the set of
information that people need when they work in statistics. Part of this information can be made
available on line with the VSS. The VSS does not imply that it is complete. In fact we state
clearly the VSS can never be complete. The VSS presently has already a lot of information and
this information can be extended in the coming yours.
Directly on the site available are about 2500 pages of text: directly available and in the form of
PDF documents, and through the selected links. In addition the site is linked to a large number of
other sites, among which several work banks sites. Already the World Bank GDDS project sites
have at least a 2500 pages of additional documentation directly available. And on the VSS e-
Learning site the user will find again 10.000 pages with training materials. This means that the
site offers, apart from the links, access to at least 15,000 pages of information. And so it goes on
and on.
On the site one can find:
o Intros and full text versions.
o Hundreds of links to other websites / documents.
o Direct links to VSS related Project site and VSS Learning site.
o VSS needs to grow up and have a life. The life of the site is defined by the way it
is used. The site can be used by individuals who visit the site and use it whenever
they wish. Also it can be used in an organized way, by organizations. In that case
the site should be part of a training program of students or professionals who want
to update their information, or want to use the interactive functions of the site. In
this case the VSS needs to be integrated in the training approaches of these
organizations.
7. About the VSS site.
Relevant aspects:
Structure. Essential are the left and the right side. This distinction is about what it takes to be
effective in statistics. A good starting point is to use the concept of the Statistical Production

- 34 -
Processes. These are represented by the list of the Activities. Producing statistics is a step by step
process. The Activities form together, as a series of steps, the structure of such a process. These
steps represent a general or generic process that is relevant for each organization. This can also
be called the “super process”. Also each specific project (the Themes) has its own production
process, but the super process still remains relevant. Using this super process one can understand
in which way the general production process is also relevant for each specific project.
Content: there are about 150 topics (modules), for each topic about four aspects (sub modules);
in total about 500 plus sub modules with information. Interactivity: comments can be made to
react about what is on the site. Also can be reported about what is missing. The VSS wiki is
designed to give users the opportunity to create their own knowledge base. Using the Discussion
groups, structured according to the geographical regions of the world users can start or be
engaging in discussions. The search function is helpful.
8. Activities.
The list of Activities is based on the understanding that in statistics we have knowledge of a
more general matter, and knowledge of a rather specific matter. The general information is
relevant for all those working in statistics. The specific knowledge is mostly only relevant for
those who are dealing with these specific topics.
This means that the general information in fact is mostly also relevant for those involved in each
statistical project in official statistics. The activity classification is based on the Overall
Statistical Production Process. The activities can also be considered as the “building blocks” of
national statistical systems. The site provides further a selection of selected links and additional
resources.
9. Themes.
Themes are about specific subjects, topics, projects, issues. Topics relate to statistical projects.
The structure of the themes is based on the UN/ECE/OECD/Eurostat Classification about
statistics. The VSS Themes are rich with info, but are always limited due to the enormous
amount of information that exists. Relevant information always can be added.
9. The VSS Wiki and Discussion groups.
The main body of the VSS consists on materials there were specifically written or collected for
the VSS. But we want to give the user also the opportunity to share their information on the site,
or to start building their own knowledge base. For this reason the VSS Wiki has been created. To
use the Wiki one starts by selection of a region.

- 35 -
Another function is to start or participate in discussions groups. One even can start their own
professional blog and users can react to the postings. Again it would be good to start picking a
region like SSA. But in order to be able to upload information or to participate in discussion one
has first to register.
10. E Learning
An essential part of the VSS concept is the training courses. These courses are made available
through a separate site which has more and other function than the VSS. The VSS e-Learning
training courses are dealing with 10 separate topics. In total there about 200 courses available
(about 20 per topic). These training courses can be reached when going to the Training part of
the site and click on the “moodle” link that leads the user to the World Bank Institute site where
the training courses are uploaded.
List of topics of the courses:
• Management of Statistical Systems.
• Project management
• Labor
• Justice and Security
• Quality assurance of the Population and Housing Census.
• Agriculture
• Business Registers/Business Statistics
• System of national Accounts (1&2)
• Government Finance Statistics.
• GIS
Different types of courses:
At present the courses are available in several modes of delivery.
• Fully Animated with voice. This is the most developed form of delivery. This is only
available for the topic Management.
• Slides and notes with voice over. These are only available for Justice and Labor.
• Only Slides and notes. These are available for all courses. The purpose is to download
them on the own computer and to study the slides and the notes.
- 36 -
11. The Use of VSS.
The best way to use the VSS is to learn from what it offers. Also the VBSS can be used as a
checklist. This explains the knowledge one needs to know in dealing with statistics. Furthermore
it is Portal, a one stop shop, with hundreds of links. Proper use of the site facilitates the designing
of blueprints for change of the organization. The VSS eLearning site is an excellent tool to
educate users in a targeted way by following the training courses. The VSS wants to share
knowledge and to exchange views. This can be done while using the unlimited possibilities of
the site to share and communicate.
When one understands the structure of the site, and is able to use the site as a checklist, the users
can select topics for in-depth study and use the links to other sites.
The VSS is a powerful communication tool. It allows to upload own contributions. The VSS e-
Learning can be used for active learning. This can be done by individuals in their own time but
also in an organized way by making use of the class room options. The idea is that all users can
share the site. We are contemplating the development of on line Training programs. This can
lead to awarding participates with different kinds of certificates. We are thinking about
developing country and regional courses: on the VSS and on the training materials.
12. Next steps.
A marketing plan (MP) has been drafted and will be implemented. The aim of the MP is to have
an increased activity on the site. We hope that it will be possible to have the VSS integrated in all
statistical capacity projects. When the VSS is accepted it even can be extended in terms of
content and languages. In the far future the VSS can be used to provide consultancy services.
Here again there are several options.

- 37 -
The Role Of Familial Transfers In Supporting The Lifecycle Deficit In India
Laishram Ladusingh
Department of Mathematical Demography & Statistics International Institute for Population Sciences
Mumbai-400088 (India) Email: [email protected]
M.R. Narayana
Center for Economic Research Unit Institute for Social and Economic Change
Bangalore- 560072 (India) Email:[email protected]
Abstract
This paper has examined age patterns of per capita consumption in India by sector, emphasizing
the socio-cultural significance of intra-household transfers to support the lifecycle deficit. We
have used the analytical framework of National Transfer Accounts and data from India Human
Development Survey (IHDS), conducted during 2004–05 (NCAER) and National Account
Statistics (CSO 2006). Education and health care are the main forms of consumption that
produce a lifecycle deficit among the young and elderly individuals. We found that young and
elderly dependents respectively account for 3% and 5% of aggregate labour income and 34% and
9% of aggregate consumption. Familial transfers from household members with disposable
income go mostly to members below age 20, accounting for 51% of the lifecycle deficit of this
age group, whereas intra-household transfers to members of ages 60+ fall far short of their
lifecycle deficit. The main conclusions we draw from this study are that India has a shortage of
public funding to meet the lifecycle deficit of its population, and that children and the elderly
would not be able to consume essential goods and services were it not for the existence of
familial transfers in general and intra-household transfers in particular.

- 38 -
Introduction This paper estimates the nature and magnitude of familial transfers to support the lifecycle deficit
(excess of aggregate consumption over labor income) of economic dependents (persons below
the age of 20 and above age 60) in India in 2004-05, using the analytical framework of National
Transfer Accounts. Young and elderly dependents respectively account for 3% and 5% of
aggregate labor income and 34% and 9% of aggregate consumption. In other words, the lifecycle
deficit of young dependents is about 6.9 times that of the elderly. For young dependents
education is the major form of consumption, whereas for elderly dependents it is health care.
Familial transfers are estimated by net inter- and intrahousehold transfers, and are distinguished by education, health care, and other forms of consumption. The results offer positive evidence of a remarkable role for familial transfers in India. The respective mean ages of beneficiaries and donors are 14.5 and 50.1 for education, 55.1 and 53.4 for health care, and 32.6 and 50.9 for other forms of consumption. Most importantly, total intrahousehold transfers support about 51% of the deficit of younger dependents, but fall short of the deficit for elderly dependents. This surprising finding is contrary to the general presumption that elderly dependents are supported by their families, given the poor public social security arrangements for elderly.
During the economically unproductive stages of life individuals are supported by familial and public transfers and, in the latter dependent stage, by asset-based reallocations. Public policies regulate the goods and services provided to dependent individuals of different ages, their monetary value varying from economy to economy. At the household level, the kinds of goods and services transferred to dependent children and elders are governed by social norms and social contracts between household members. A growing concern in developing economies as a consequence of longer life expectancy and declining family size is the ability of families to support elder members (K.O. Mason 1992). Few studies, however, have focused on the role of intergenerational monetary transfers for supporting dependent children and elders in developing countries where generational co-residence continues to be a general social norm and practice. This chapter is an attempt to provide empirical evidence of the magnitude of familial transfers in the Indian economy. Several studies of intergenerational transfers in Asia focus primarily on parent–child transfers (e.g., Ofstedal, Knodel, and Chayovan 1999; Zimmer and Kwong 2003). In the Philippines, Thailand, Taiwan, and Singapore, transfers from adult children are the main source of income for elder persons (Hermalin, Chang, and Roan 2002). In mainland China between 30% and 50% of elders receive financial support from adult children (X. Chen and Silverstein 2000). In their study of intergenerational transfers in Taiwan and the Philippines, Agree, Biddlecom, and Valente (2005) found that in both countries the elderly rely on kin but that in Taiwan transfers are concentrated among lineal kin, whereas in the Philippines transfers are more broadly distributed among family relations, particularly siblings. Lillard and Willis (2002) have found that parents in Southeast Asia give loans to children that are later repaid and that, in Indonesia, transfers within families serve as insurance for family members. The aforementioned studies of familial transfers in East and Southeast Asia are limited to a few countries and focus on interhousehold transfers. Intrahousehold transfers, emphasized in this chapter, are much greater in their magnitude. The National Transfer Accounts (NTA) methodology provides a framework for determining the nature and magnitude of familial transfers consistent with National Income and Product
- 39 -
Accounts (NIPA). Using the NTA framework (A. Mason et al. 2006), we attempt in this chapter to discern age patterns of consumption of public and private monetary resources for education, health, and other needs and the role of intrahousehold transfers in supporting the lifecycle deficit of economic dependents in India in 2004–05. To provide a background for understanding the age patterns of lifecycle consumption of education, health care, and other goods and services in India, we begin by discussing the factors that have a bearing on lifecycle consumption and intrahousehold transfers.
Factors affecting the lifecycle deficit and familial transfers
The ability of individuals to pay for essential goods and services during their lives depends on
their earning potential, which in turn depends on their education and skills as well as on the
availability of jobs. At the same time labor income depends on macroeconomic conditions that
cannot be controlled by individuals. Employment growth in India has improved considerably,
doubling the 1.3% pace of growth during the 1990s over the first five years of the current century
(OECD 2007, 120). This represents an unprecedented improvement in India’s labor market
performance (Anant et al. 2006; GOI, Ministry of Finance 2006; Nagaraj 2004). The average
daily wages of workers in the formal sector are biased in favor of urban workers and males,
although the gap between urban and rural workers and between men and women has been
narrowing over time.
No economy can afford to risk under investing in human resource development through education. The Constitution of India established the goal of universal and free basic education for all children through the age of 14. Today nearly four out of five children in the 6–14 age group are in school and two out of three are functionally literate (Govinda 2002, 1). Between academic years 1950–51 and 1999–2000, enrolment increased about six times at the primary stage, 13.5 times at the upper primary stage, and 17 times at the secondary and senior secondary stages combined. Enrolment of girls has registered an even faster growth, increasing 9 times, 34 times, and 52 times respectively at these three stages (NCERT 2003, 115). Public expenditure on education and private transfers are closely linked with enrolment rates and educational attainment. Private spending on education is strongly correlated with a family’s income level. Public health expenditure was merely 0.94% of GDP in 2001–02 (as against 0.04% in 1970–71), still too meager to meet the demand for health care of a huge population with a pronounced burden of disease. In contrast with education expenditures, most spending on health is in the private sector, which accounts for 77% of total health expenditures in India (GOI, Ministry of Health and Family Welfare 2005, 1). Most household expenditure on health care is out-of-pocket. As a percentage of per capita income it has doubled, rising from 2.71% to 5.53%, between 1960–70 and 2001–03 (Bhat and Jain 2006, 67). India’s social security measures are many and divided between the central and state governments on the one hand, and the private sector on the other. The National Social Security Program is a system for transferring public goods, such as health services and education, to the population. It has three parts. The first consists of programs intended for the entire population, the second comprises targeted programs for beneficiaries in specified income categories, and the third includes spatial and social categories. The social security program thus coincides with the poverty-alleviation program in providing in-kind transfers of public goods and services for consumption. In addition, social security schemes exist for organized workers both in the public sector (the government and quasi-governmental agencies) and in the private sector (registered factories and companies). The schemes are implemented through various labor laws. Their benefits include medical care, sickness and

- 40 -
maternity leave with pay, a retrenchment benefit, old-age benefits (e.g., a pension or a provident fund with gratuity), and compensation for injury. For specified industrial workers (e.g., miners), welfare funds provide housing benefits, medical care, and education for their children, all of which are financed by taxes on exported items (e.g., iron ore). Organized workers further benefit from voluntary and tax-exempted schemes, such as small savings schemes and pensions offered by life insurance companies.
Sources of data
The data for this study are drawn from multiple sources. Macroeconomic controls for the fiscal
year 2004–05 as regards salaries and wages of employees, mixed income (that is, income from
household enterprises), and private expenditures on education, health, and other goods and
services were extracted from the National Accounts Statistics (CSO 2006). The India Human
Development Survey (IHDS), conducted during 2004–05, was the source of micro data on
income from wages and salaries and from self-employment; on household expenditures on food,
nonfood items, health care, education, and housing rent; on money borrowed and household
credit; on the enrolment status of children in public and private educational institutions; and on
the treatment status of individuals for minor and major illnesses (Desai et al. 2008). The IHDS
was a nationally representative survey covering more than 200 thousand individuals from 41,554
households in 1,503 villages and 971 urban neighborhoods.
Income, consumption, and the lifecycle deficit
Age patterns of consumption for education and health by sector and income were obtained
directly from individual-level data. We derived the age pattern of other private consumption by
using an empirical equivalent scale discussed in A. Mason et al. (2006), whereas we calculated
the age pattern of other public consumption on a per capita basis. We derived aggregate labor
income, private and public consumption by sector, and the lifecycle deficit for broad age groups,
all of which are consistent with the NIPA for the fiscal year 2004–05, by applying the NTA
framework. At a nominal price, aggregate consumption was 17,505 billion rupees as against the
aggregate labor income of 15,845 billion rupees, leading to a lifecycle deficit of 1,660 billion
rupees in that fiscal year. We found that the prime working age group, 20–59, contributed 92%

- 41 -
of the total labor income, whereas the share of the age group below 20 years was 3% and that of
the elderly age group (60 years and older) was 5%. The respective contributions to aggregate
labor income by the three broad age groups reflect the sizable population of children and the
moderate size of the aged population in the country’s age distribution.
While contributing 3% of the total aggregate labor income, the population under age 20 accounted for 34% of the total aggregate (public and private) consumption. In contrast, the elder population enjoyed just 9% of aggregate consumption. The remaining 57% of public and private consumption belonged to the prime working age group. The investment in children and youths is about 3.5 times greater than that in population over age 60. This result signals a near-absence of public policies to provide social security and health care for India’s elders. Private consumption on health care and other goods and services is much greater than public consumption; only education receives major public support. The discussion so far indicates that young and aged populations consume far more than their share of labor income and thus experience a lifecycle deficit. For the prime working-age population, however, aggregate labor income exceeds aggregate consumption, producing a monetary surplus. As a consequence of their greater consumption of both private and public resources in relation to their share of aggregate labor income, the young and the elderly together produce a lifecycle deficit 1.4 times the monetary surplus of the prime working-age population. Figure 1 shows the age patterns of aggregate labor income, consumption, and life cycle deficit in 2004–05.
Figure 1: Aggregate labor income, consumption, and the lifecycle deficit. India, 2004-05
The age profile of aggregate consumption indicates that India’s population has a large proportion of children and a much smaller, but increasing, proportion of elders. This age distribution translates into a larger lifecycle deficit for the under-20 population and a smaller deficit for the 60+ population. The age profile of labor income shows a larger share of aggregate labor income in the prime working age group of 20–59 years and a concentration of surplus due to the excess of income over consumption. Next we look at consumption patterns. Per capita consumption profiles can be more relevant to policy than aggregated consumption profiles. To reveal the Indian age patterns of education, health, and other consumption by sector, Figure 2 shows per capita consumption profiles consistent with the NIPA. It indicates that the surplus of the prime working age group supports the deficit of the under-20 and 60+ age groups overwhelmingly through familial transfers. Table 1 summarizes the proportions of per capita consumption by sector.

- 42 -
Figure 2: Age patterns of per capita consumption by sector, India, 2004-05
Moreover, the public and private age profiles of consumption have sharply contrasting features. In the private sector, consumption of goods and services other than education and health care constitute 74.7% of total consumption (Table 1). Per capita private other consumption (consumption excluding health and education) is low during the first five years of life, increases sharply with age until the mid-20s, and thereafter remains more or less flat. Per capita private education is concentrated in the 4–25 age range, showing a slight peak at late teens, the stage of higher secondary education; but its share of total consumption is only 1.2%. The per capita private health care profile is more or less trough-shaped up to age 30 and steadily rises until about age 80; it constitutes 6.6% of total consumption of the fiscal year 2004–05. The age pattern of public per capita consumption contrasts with that of private consumption mostly because of the much lower (and flat) public investment in services other than education and health. In the school-going age group, however, there is significantly greater public than private investment in education. The per capita public consumption profile for health care shows a slight rise at advanced ages. The shares of public consumption on education, health, and others are 2.1%, 1.6%, and 13.9%, respectively, making up only 17.6% of total consumption. Table 1: Summary of per capita consumption, India, 2004-05
Sector Share (%) Mean age
All sectors 100.0
41.0
Public 17.6 35.5 Health 1.6 49.6 Education 2.1 13.7 Other 13.9 37.1
Private 82.4 42.2 Health 6.6 49.5 Education 1.2 14.7 Other 74.7 42.0
Note: Per capita values are weighted using L(x) from India’s life table to calculate the shares and the mean ages
The mean age for total consumption is 41 years. In the public sector the mean age for consumption is 35.5 years, and in the private sector it is 42.2 years. For health consumption in the public and private sectors, the mean ages are nearly identical (49.6and 49.5 years, respectively). The high mean age for

- 43 -
private health consumption reflects the fact that individuals incurred out-of-pocket expenditures for health care at advanced ages, in the near absence of social security and India’s inadequate public health care expenditure. As for education, the mean ages for public and private consumption are 13.7 and 14.7 years, once again signaling a longer period of private support for education. The mean age for other public consumption (infrastructure, defense, etc.) is 37.1 years. In the private sector other consumption relates to housing, food, clothing, social needs, etc.; and the corresponding mean age is 42.0 years. The lifecycle-deficit implication of consumption at young and old ages is better understood when the per capita labor income and the per capita age-specific consumption patterns are plotted together, as in Figure 3. The age profile of per capita labor income reflects several distinctive features. It is an inverse broad U-shaped curve that starts in the early teens, gradually increases with age, peaks in the mid-40s, remains high until the mid-50s, and thereafter declines rapidly, tapering off with advancing age.
[Figure 3 about here]
Figure 3: Per capita labor income and consumption, India, 2004-05
The existence of child labor is evident in the early age of entry into economic work and young persons’ marginal share of labor income. The age profile of per capita consumption also exhibits interesting features, particularly during the school-going ages and at older ages. Per capita monthly consumption increases sharply from about age 4 until it attains an early peak at about 19 years, reflecting some investment for education, and at the same time a sharp increase in consumption other than education and health. The consumption profile crosses the income profile at ages 25 and 60, the average ages of entry into the labor force and retirement respectively. During the 35 years of economically gainful activities the per capita consumption profile is more or less stable, rising marginally after retirement age owing to health care costs. For individuals below age 25 and above age 60 the gap between the per capita labor income and consumption profiles is the magnitude of the lifecycle deficit. The NTA framework recognizes the role of public and private asset reallocations and transfers as a means to support the lifecycle deficit, depending on the structure of the underlying economy. In a welfare state the lifecycle deficit is funded mostly by public intervention. In many other societies, it is funded by a combination of private asset-based reallocations and transfers. In India the family plays a major role in such transactions.
Familial transfers to support the lifecycle deficit
Intrahousehold and interhousehold transfers are the two forms of familial transfer considered in
the NTA framework (A. Mason et al. 2006). Household members with a surplus fund the

- 44 -
consumption of members with a deficit through intrahousehold transfers. Familial transfers as a
means of supporting the lifecycle deficit of current consumption are important in India because
of the large number of joint families living under the poverty line in rural areas.
Figure 4, which shows age profiles of the beneficiaries and donors of aggregate intrahousehold transfers for education, health, and other types of expenditure, reveals that monetary transfers for education are larger than are those for health. A distinctive feature of the transfers is that although most donors are in the working age groups, a sizable proportion are elders, whose support includes education for grandchildren. The main consumption need for household members below age 20 is for schooling, whereas for those above age 60 it is for health care, in addition to other essential goods and services.
Figure 4: Aggregate Intrahousehold transfers (in crores) for education, health and other, India,
2004-05
Figure 5 depicts the age profiles of the per capita lifecycle deficit, net intrahousehold transfers, interhousehold inflows, and familial transfers, which constitute the totality of net intra- and interhousehold inflows. It is evident that familial transfers are heavily biased toward children, whereas elders scarcely benefit from them. This suggests that although elders help fund the education of their grandchildren, they are left to care for themselves from their own past saving and assets in the absence of a robust public social security program.

- 45 -
Figure 5: Per capita familial transfers and Lifecycle deficit, India,2004-05
The mean ages of beneficiaries and donors and the magnitude of intrahousehold transfers for education, health care, and other consumption are summarized in Figure 6. In this figure the direction of each arrow indicates the direction of the flow of intrahousehold transfers—that is, from older to younger or from younger to older ages; the head and the tail represent the mean ages of beneficiaries and donors respectively; and the thickness of the arrows represents the magnitude of the transfer. The numerical values shown along with each arrow are the monetary values of intrahousehold transfers in crores (1 crore = 10 million rupees). The mean ages of beneficiaries and donors are based on aggregate age profiles of those groups.
Figure6: Aggregate intrahousehold transfers by sectors, India, 2004-05
Total intrahousehold transfers make up 51% of the lifecycle deficit of the population below age 20, whereas intrahousehold transfers to the population of ages 60+ fall short of their lifecycle deficit. Most of the intrahousehold transfers are for current consumption of goods and services other than health care
- 46 -
and education. The respective mean ages of beneficiaries and donors are 32.6 and 50.9 for the residual (other) category of consumption. The mean age of children who receive familial financial support for education is 14.5 years, and that of household members who support them is 50.1 years. The mean age of family members who support health care for other members is 53.4 years, and that of the recipients is 55.1 years. All mean ages were calculated using the value of transfers to and from each age group. Indian children below age 20 years receive familial support from other household members, whereas elders are not at all supported by familial transfers. This finding is contrary to the widespread belief that in the absence of a viable public social security safety net Indian elders depend on their kin, particularly on sons, for their wellbeing.
Summary and conclusion
This paper has examined age patterns of per capita consumption in India by sector, emphasizing
the sociocultural significance of intrahousehold transfers to support the lifecycle deficit. As in
any developing economy with a large population of children and a smaller but increasing aged
population, at the aggregate level the lifecycle deficit of the Indian population under age 20 is 6.5
times than that of 60+ population. At the per capita level, however, the lifecycle deficit of the
60+ population is more pronounced and comparable to that of the under-20 population.
Education and health care are the main forms of consumption that produce a lifecycle deficit
among the young and elderly individuals. Familial transfers from household members with
disposable income go mostly to members below age 20, accounting for 51% of the lifecycle
deficit of this age group, whereas intrahousehold transfers to members of ages 60+ fall far short
of their lifecycle deficit. The main conclusions we draw from this study are that India has a
shortage of public funding to meet the lifecycle deficit of its population, and that children and the
elderly would not be able to consume essential goods and services were it not for the existence of
familial transfers in general and intrahousehold transfers in particular.

- 47 -
References
Agree, E.M., A.E. Biddlecom, and T.W. Valente. 2005. Intergenerational transfers of resources
between older persons and extended kin in Taiwan and the Philippines. Population
Studies 59(2): 181–95.
Anant, T.C.A., R. Hasan, P. Mohapatra, R. Nagraj, and S.K. Sasikumar. 2006. Labor markets in
India: Issues and perspectives. In J. Felipe and R. Hasan (eds.), Essays in industrial
policy, pp. 148–165. New Delhi: Oxford University Press.
Bhat, R., and N. Jain. 2006. Analysis of public and private healthcare expenditures. Economic
and Political Weekly, January 6: 57–68.
Chen, X., and M.Silverstein. 2000. Intergenerational social support and psychological well-being
of older parents in China. Research on Aging 22(1): 43–65.
CSO [Central Statistical Organisation]. 2006. National accounts statistics 2005. New Delhi:
Government of India.
Desai, S., A. Dubey, B.L. Joshi, M. Sen, A. Sheriff, and R. Vanneman. 2008. India Human
Development Survey. Unpublished report, University of Maryland, .College Park, MD.
Govinda, R. 2002. India education report. New Delhi: Oxford University Press.
GOI [Government of India], Ministry of Finance. 2006. Economic Survey 2004–2005.
http://indiabadget.nic.in/es 2004-05/esmain.htm (accessed 5 October 2008).
GOI [Government of India], Ministry of Health and Family Welfare. 2005. National Health
Accounts India 2001–02, National Health Accounts India. New Delhi.

- 48 -
Hermalin, A.I., M.C. Chang, and C. Roan. 2002. Economic well-being: Insights from multiple
measures of income and assets. In A.I. Hermalin, ed., The well-being of the elders in
Asia, pp. 295–360. Ann Arbor: University of Michigan Press.
Lillard, L., and R.J. Willis . 2002. Patterns of intergenerational transfers in Southeast Asia. The
Journal of Marriage and Family 64: 627–41.
Mason, A., R. Lee, A.C. Tung, M.S. Lai, and T. Miller. 2006. Population aging and
intergenerational transfers: Introducing age into national accounts. Working Paper No.
12770. Cambridge, MA: National Bureau of Economic Research.
Mason, K.O. 1992. Family change and support of the elderly in Asia: What do we know? Asia-
Pacific Population Journal 7(3): 13–32.
Nagaraj, R. 2004. Fall in organized manufacturing employment: A brief note. Economic and
Political Weekly 39(30): 3387–90.
NCERT [National Council of Educational Research and Training]. 2003. Compendium of
educational statistics. New Delhi.
OECD [Organisation for Economic Co-operation and Development]. 2007. OECD economic
surveys: India. New Delhi: Academic Foundation.
Ofstedal, M.B., J. Knodel, and N. Chayovan. 1999. Intergenerational support and gender: A
comparison of four Asian countries. Southeast Asian Journal of Social Science 27(2): 21–
41.
Zimmer, Z., and J. Kwong. 2003. Family size and support for older adults in urban and rural China.
Demography 40(1): 23–44.

- 49 -
Dynamic Panel Data Model and The FDI Determinants: Revisited in
India
Rudra Prakash Pradhan
V. G. School of Management
Indian Institute of Technology Kharagpur,
Abstract
The paper deals with different characteristics of panel data models to examine the determinants
of FDI inflows in India. Using the data over 2001-2008, it finds that the main determinants of
FDI inflows are the availability of power, domestic investment and profit. It further justifies that
higher profitability increases FDI inflows into a state, while larger variability in it can reduce the
same.
Keywords: Dynamic panel data model, FDI, India
1. Introduction The finding of an adequately fitted model for an economical phenomenon has been a great
intension of researchers since very ancient times. The functional form and the different methods
of estimation of a classical model are the main and powerful sources to satisfy this intention. In
the way, panel data model is an attempt of the same type. Panel data usually refers to a cross
section repeatedly sampled over time, but where the same economic agent has been followed
throughout the period of the sample (Pasha et al., 2007). A number of studies can be found in the
favour of panel data modelling. For instance, see Hsiao (1986), Judson and Owen (1996),
Nerlove (2000), Baltagi (2001), etc. among many others. The panel data models are themselves
well explanatory, when we encounter the data on a set of economic units observed at more than
one point in time.
But it is very often that the response variable depends not only on pure exogenous variables but
also its own lag values. In the present context, we have compared different characteristics of
panel data models while dealing with the determinants of FDI inflows in India.

- 50 -
The rest of the paper is organized into four different sections. Section 2 offers the theoretical
framework of FDI inflows. Section 3 discusses the structure of panel data models. Section 4
presents the results and discussion. Section 5 offers conclusion.
2. The Theoretical Framework of Determinants
In the international economics and business literature, foreign direct investment (FDI) is a
growing global phenomenon, with flows reaching 1.2 trillion by 2010 (WIR, 2010). The
numbers of home and host countries and two-way flows have increased. As an increasing
number of countries are both home and host to international investments, the traditional
dichotomy between home country and host country interest have clouded and a more balanced
perception of the benefits and costs of FDI has emerged (Apergis et al., 2006; Frenkel et al.,
2004; Tang and Qi, 2006; Yue, 1996). FDI is a key ingredient for successful economic growth,
particularly in developing countries. This is because the very essence of economic development
is the rapid and efficient transfer and adoption of best practice across the borders (Kok and
Ersoy, 2009). Besides, FDI has innumerable other effects on the host country’s economy. It
effects production, employment, prices, development and general welfare of the recipient
country. It is also probably one of the most significant factors leading to the globalization of the
international economy. Hence, the enormous increase in FDI inflows across countries is one of
the signs of globalization of the world economy over the past few years (WIR, 2006). On the
contrary, FDI inflows may have some negative effects such as environment, disparities, transfer
pricing, etc.
FDI takes place in response to home country push factors and host country pull factors as well as
firm specific factors. Dunning (1980) identifies three sets of determinants of FDI inflows: first,
the investing firm must have an ownership advantage over competitors in the host country,
usually technology, marketing expertise and/ or financial resources; second, the host country
must possess some locational advantage to attract investments, usually the availability of specific
resources, infrastructure, market size or potential and lower costs; and third, there must be
internationalization advantage that induces the investing firm to choose the direct investment
option over other arrangements such as licensing, franchising or exporting. There are numbers of
studies that have been conducted to identify the determinants of FDI. But no consensus
conclusion has been emerged, particularly in the sense that there is no widely accepted set of
explanatory variables that can be considered as the true determinants of FDI. The results

- 51 -
produced by studies of FDI are typically sensitive to these factors, indicating the lack of
robustness. For instance, factors such as labour, trade, inflation, exchange rate, etc. have been
found to have both negative and positive effects on FDI. So the determinants of FDI inflows are
highly sensitive. Keeping in above backdrop, present paper seeks to investigate the determinants
of FDI inflows in India.
3. Methodology and Data Description
Panel data have both cross sectional and time series dimensions. So the applications of
regression models to fit econometric models are more complex than those for simple cross
sectional data sets and time series data sets. Nevertheless, they are increasingly being used in
applied work. In this section, we briefly highlight the same
The general framework of panel model is as follows:
Where Y is dependent variable, Xj are observed explanatory variables, i refers to the unit of
observation, t refers to time period, αi is unobserved effect εit is a disturbance term assumed to
satisfy the usual regression modelling condition. If αi is correlated with any of the Xj variables,
the regression estimates from a regression of Y on X j variables will be subject to unobserved
heterogeneity bias. Even if the unobserved effect is not correlated with any of the explanatory
variables, its presence will in general cause OLS to yield inefficient estimates and invalid
standard errors. We will now consider ways of overcoming these problems. However, if the Xj
controls are so comprehensive that they capture all the relevant characteristics of the individual,
there will be no relevant unobserved characteristics. In that case, αi term may be dropped and a
pooled OLS regression may be used to fit the model, treating all the observations for all of the
time periods as a single sample. Moreover, there two approaches to fit the panel data: fixed
effect regression model and random effect regression model.
The fixed effects regression model is of three different forms: within-group fixed effect model,
first difference fixed effect model and least square dummy variable (LSDV) fixed effects model.
The within-group fixed effects model is in following form:

- 52 -
This is known as the within groups regression model because it is explaining the variations about
the mean of the dependent variable in terms of the variations about the means of the explanatory
variables for the group of observations relating to a given individual.
The first difference fixed effect model is as follows:
Here the unobserved effect is eliminated by subtracting the observations for the previous time
period from the observation for the current time period, for all time periods. The LSDV
regression model is as follows:
Here, the unobserved effect is brought explicitly into the model. Zi is considered as dummy
variable, where it is equal to 1 in the case of an observation relating to individual I and 0
otherwise. Formally, the unobserved effect is being treated as the coefficient of the individual-
specific dummy variable. The weight of αiZi represents the fixed effect on the dependent variable
Y i for individual i.
It is to be noted that when the variables of interest are constant for each individual, a fixed
effects regression is not an effective tool because such variables cannot be included. So the
alternative approach is the use of random effect regression model. It has two conditions. First, Zi
should be drawn randomly from a given distribution. This may well be the case if the individual
observations constitute a random sample from a given population. If this is the case, the αi may
be treated as random variables, drawn from a given distribution and we can write the model is
follows:

- 53 -
The second condition is that the Zi variables are distributed independently of all of the Xj
variables. If this is not the case, α and hence u, will not be uncorrelated with the Xj variables and
the random effects estimation will be biased and inconsistent. We would have to use fixed effects
estimation instead, even if the first condition seems to be satisfied.
The empirical analysis is based on a panel of 16 Indian states over the period from 2001 to 2008.
The variables used under this study are FDI inflows; power (POW), measured as a percentage of
power supply; education (EDU), measured as the ratio between educational institutions to
students; health (HEA), measured by infant survival rate; transport (TRA), measured by density
of road and railway; research and development (R&D), measured as a percentage of R & D
expenditure; domestic investment (DOI), measured as the percentage share of implemented
industrial entrepreneur memoranda to the total industrial investment proposals; profit (PRO),
measured as the percentage share of output; and risk (RIS), measured as the variation of profit.
4. Results and Discussion
This section scans the estimated results of FDI determinants by using dynamic panel data model.
The results are presented and discussed under two heads: the fixed effect model and random
effect model (see Table 1). Starting with fixed effect model, the estimated results indicate that
the main determinants of FDI inflows are power (POW), domestic investment (DOI), profit
(PRO) and risk (RIS). While the coefficients of POW, DOI and PRO are positive, the coefficient
of RS is negative. This represents that the availability of power and high domestic investments
and profits have significant impact on FDI inflows in India. But the variation of profit has
significant negative impact on FDI inflows. Coming to random effect model, the results are also
somewhat same. That means the main determinants of FDI inflows are the availability of power,
domestic investment and the existence of profit. But the high volatility of profit leads to negative
impact on FDI inflows in India. That means higher profitability increases FDI inflows into a
state, while greater variations in it reduce the same. This may be fact that higher profitability
signals better business environment and possibility of greater return in future. This raises the
ability and willingness of the existing firms to grow and encourages new firms to enter the
market. But the variations in profitability discourage new investors who are risks averse and also
restrict the existing enterprises for expanding their business. The results are substantially
supported by Wald χ2 and overall R2 (see Table 1). Further the Breusch and Pegan Lagrange

- 54 -
Multiplier test yields χ2, which suggests the selection for REM over the pooled regression
model.
The impacts of other variables, such as education, health, transport and R&D, are, however, not
significant. This gives lots of contradictory results. For instance, the insignificant relationship
between R&D and FDI inflows contradict to the proposition that the states closer to technology
frontier attract more investment (Nunnenkamp and Strake, 2007; Aghion et al., 2006). This may
be due to fact that the foreign firms more on their own R&D base than on sourcing the same
from outside. Similarly, it also contradicts that the availability of infrastructure is necessary for
attracting more FDI (Kumar, 2002). This is very important, as the lack of infrastructure certainly
cause for low FDI inflows in many of the Indian states. This may be the situation, when foreign
investors create their own infrastructure as per their need instead of depending on the domestic
existing infrastructure. If it is so, availability of infrastructure is not a precondition for
investment. Moreover, FDI can be directed directly towards the creation of infrastructure,
especially when domestic investment is not sufficient enough to meet the infrastructure
requirements. In such cases, infrastructure is not a cause but an effect of FDI inflows. Besides,
the requirement of infrastructure is largely industry specific. So depending upon the nature of
industry for investment, a state with even poor infrastructure can attract more FDI inflows in the
economy.
4. Conclusion
The paper examines the determinants of FDI inflows in India during the period 2001-2008.
Using dynamic panel data model, it finds that the main determinants of FDI inflows are the
availability of power, domestic investment and the occurrence of profit. But the high volatility of
profit leads to negative impact on FDI inflows in India. This indicates that higher profitability
increases FDI inflows into a state, while larger variability in it can reduce the same. The impact
of other factors, particularly, infrastructure, do not provide any significant impact on FDI inflows
in India during the period under investigation.
The findings give some important policy implications in the Indian economy. First, since FDI
inflows and the required infrastructure are industry specific, different clusters of industries
should be designed depending upon their nature and needs of infrastructure. This demands that
infrastructure facilities should be developed as per the need of the investment. Second, the policy
framework should ensure high return from investment in future. This requires removal of entry
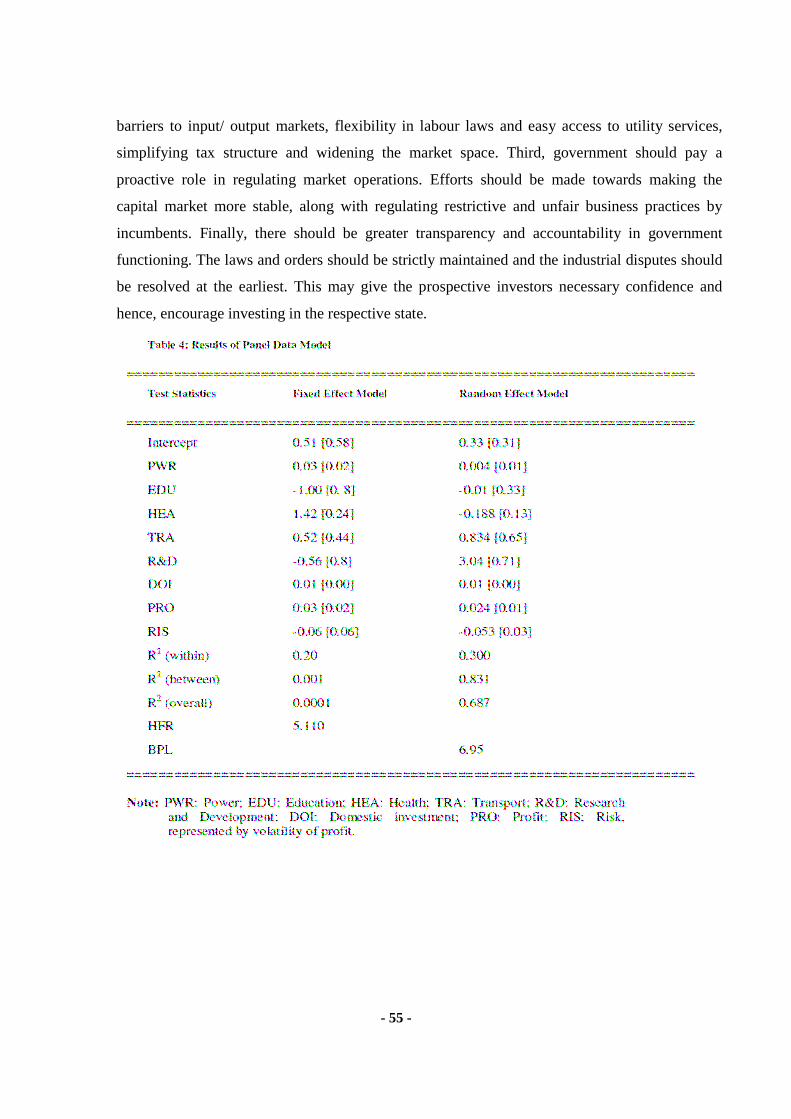
- 55 -
barriers to input/ output markets, flexibility in labour laws and easy access to utility services,
simplifying tax structure and widening the market space. Third, government should pay a
proactive role in regulating market operations. Efforts should be made towards making the
capital market more stable, along with regulating restrictive and unfair business practices by
incumbents. Finally, there should be greater transparency and accountability in government
functioning. The laws and orders should be strictly maintained and the industrial disputes should
be resolved at the earliest. This may give the prospective investors necessary confidence and
hence, encourage investing in the respective state.
- 56 -
References
Apergis, N., Katrakilidis, C. P. and Tabakis, N. M. (2006). Dynamic Linkages between FDI
Inflows and Domestic Investment: A Panel Cointegration Approach. Atlantic Economic Journal,
34: 385-394.
Baltagi, B. H. (2001). Econometric Analysis of Panel Data. John Wiley and Sons Ltd.,
Chichester, England.
Baltagi, B. H. and Kao, C. (2000). Nonstationary Panels, Cointegration in Panels and Dynamic
Panels: A Survey. Centre for Policy Research, Working Paper, No. 16, Syracuse University,
New York.
Cuadros, A., Orts, V. and Alguacil, M. (2004). Openness and Growth: Re-examining Foreign
Direct Investment, Trade and Output Linkage in Latin America. Journal of Development Studies,
40: 167-192.
Dunning, J. (1980). Towards An Eclectic Theory of International Production: Some Empirical
Tests. Journal of International Business Studies, 11: 9-31.
Frenkel, M., Funke, K. and Stadtmann, G. (2004). A Panel Analysis of Bilateral FDI Flows to
Emerging Economies. Economic Systems, 28: 281-300.
Hsiao, F. S. T. and Hsiao, M. C. W. (2006). FDI, Exports and GDP in East and Southeast Asia-
Panel Data Versus Time Series Causality Analysis. Journal of Asian Economics, 17: 1082-1106.
Judson, R. A. and Owen, A. L. (1996). Estimating Dynamic Panel Data Models: A Practical
Guide for Macroeconomists. Economic Letters, 65: 9-15.
Kok, R. and Ersoy, B. A. (2009). Analyses of FDI Determinants in Developing Countries.
International Journal of Social Economics, 36: 105-123.
Kumar, N. (2002). Infrastructure Availability, Foreign Direct Investment Inflows and Their
Export Orientation: A Cross Country Exploration, RIS Discussion Paper, 26, RIS, New Delhi.
Nerlove, M. (2000). An Essay on History of Panel Data Econometrics. Proceedings of Ninth
International Conference on Panel Data, Geneva, Switzerland.
Pasha, G. R., Aslam, M. and Abdullah, M. (2007). Dynamic Panel Data Model for Investment,
Real Value and Capital Stock Data. Pakistan Journal of Operation Research, 3: 13-17.

- 57 -
Qi, C. and Tang, J. C. S. (2006). Foreign Direct Investment: A Genetic Algorithm Approach.
Socio Economic Planning Science, 40: 143-155.
WIR (2006). World Investment Report, United Nations Conference on Trade and Development,
New York.
WIR (2010). World Investment Report, United Nations Conference on Trade and Development,
New York.
Yue, C. S. (1996). ASEAN Strategies on Foreign Direct Investment and Prospects for ASEAN-
India Investments. Journal of Asian Economics, 7: 701-721.

- 58 -
Decentralized Urban Governance in West Bengal: Does Rhetoric Match Reality?
Soumyadip Chattopadhyay Department of Economics and Politics
Visva Bharati University, Santiniketan - 731235 West Bengal India
E-mail: [email protected]
Introduction
Decentralization, broadly, the assignment of fiscal, political and administrative power to
local levels of governments, has assumed central role in matters of governance in the developing
world over the last few years. This process formalizes the causal chain of devolution leading to
more active citizen involvement and voice in the formulation and implementation of public
policies. This, in turn, increases the ability of the citizens to hold local politicians/officials
accountable. Essentially, the major promise of decentralization is that it brings popular
participation and accountability to local governance and, therefore, makes local government
more responsive to citizens’ desires and more effective in delivering services. In reality,
participation may occur in three different ways: (a) representative (usually but not necessarily
elective) government1; (b) direct participation either at community or project level2 and (c)
mobilisation from above3. One need to be very much careful about the distinction between
‘participation which permits representations or directly active involvement in local institutions
from mobilisation which may well involve large numbers of people right down to the grass roots,
but which nevertheless has little to do with enhancing the responsiveness of government bodies’.
A public policy decision is not a ‘once-and-for-all’ act. It involves a number of stages ranging
from putting an item on the agenda, through technical advice, discussion of favored proposals, to
enforcement of final decision. Thus which (what) segment (proportion) of population taking part
in which mode (stage) of local decision making process is crucially important. The operation of
accountability mechanism, both internal (i.e., within institutional processes) as well as external
(i.e., in relation between the local institutions and the public), determines the efficacy of
1 Under this variant, participation encompasses the followings: (i) voting in election, (ii) contesting election as a candidate, (iii) taking part in election campaign, (iv) trying to influence government activities through, e.g., protesting etc. Here elections serve as a check to hold the representatives accountable to the people. 2 Direct participation, with the help of wide range of small scale community level (or project based) institutions provides the citizens equal chance of actively taking part in the decision making process by subjecting all decisions to discussion and approval by all members of the relevant community. Thus, a pressure of accountability is built up on the (political) decision makers to respond to the needs and preferences of the citizen. 3 The mobilisational form of participation is generally pursued by the authorities and/or political parties with the purpose of co-opting and, thereby, increasing the effectiveness of implementation of their own policies.

- 59 -
participation process4. In the end, participation is considered as an input to the building of
accountability and as an output of sense of empowerment. Moreover, effective participation is
reinforcing in nature in the sense that once the process is started, it lead to further increase in the
level and scope of participation (Crook et. al. 1999: 6-11).
However, the causal chain of devolution leading to greater citizen participation and voice
and resultant increase in accountability has been questioned both on theoretical and empirical
grounds. As such, there is no necessary correlation between the perceived broad based local
participation and decentralization and the resultant improvement in the accountability
mechanism. This correlation presupposes both the desires of individuals to take part in local
government as well as the existence of appropriate forums that allow and encourage the free
expressions of their interests. Moreover, societies in general and communities in particular are, in
fact, spaces of internal differentiation and hierarchies. Consequently, participation would always
be open to manipulation by better equipped sections of the community in terms of their social
position, economic power or better skills (both with respect to information and communication).
In essence, specific social, economic and political setting and the type of decentralization
influence the relationships between participation and accountability.
Of late, the commitment towards popular participation in governance at the local level
has been reinforced through recent policies of the Central and the State governments in India,
which have given an opportunity to the citizen to express their voice and influence the decision
making process affecting their lives. In particular, the 74th Constitutional Amendment Act (1992)
opened up a new chapter in the history of democratic decentralization in India by devolving
power to the people. The implementations of provision of the CAA vary from one state to
another. In this wave of decentralization, West Bengal’s attempt has been unique in its scope and
intensity. West Bengal is the only state in the country where municipal elections are being held
at regular intervals, since the 1980 amendment of Bengal Municipal Act 1932. Further, in this
state, from 1980s onwards the municipal governments have been subjected to some radical
institutional and fiscal reforms. The West Bengal Municipal Act 1993, in conformity with the
74th CAA, ushered in a new era of democratic decentralization aiming at functional as well as
4 It is important to note the difference between participation and related responsiveness in terms of process and the same in terms of outcomes. Local government may consult the residents regarding the local decision. The process produces a sense of genuine satisfaction among the local residents and, as a result, they may be concerned, at least initially, more with the process than the actual results. But, ‘accountability requires that local governments both develop processes that make residents feel their opinion being solicited and provide outcomes that make residents feel that their public service needs are being met’ (Smoke, 2001: 19)
- 60 -
financial empowerment of the ULBs5. Under the new institutional framework, citizens can
actively participate in their own administration and development through a two-tier system of
local governance – the municipality and the Ward Committee (WC). The former is an elective
body at the level of municipality consisting of elected representatives of the people (councilors)
and the latter is a nominated body at the level of the ward.
Against this background, the present paper attempts to evaluate the implications of
constitutional provisions for participation and accountability at the municipal level in West
Bengal. To serve our research purpose, we purposively chose three municipalities, namely, Bally
municipality, Bolpur municipality and Cooch Behar municipality. Bally municipality is located
within the Kolkata Metropolitan Area whereas the other two selected municipalities are non-
KMA municipalities. From political point of view, while Bally municipality was under the
absolute control of the Left Front, the other two municipalities were run by the Indian National
Congress. Then, four wards in each of the three selected municipalities were selected randomly.
The socio-economic-political scenarios in our selected wards are different and, therefore, data
collected from those wards are likely to be useful to trace the underlying changes in the urban
governance framework following the 74th CAA. From each ward, we randomly selected 25
households, thereby drawing a sample of 300 households in all. In addition, we randomly
selected three WC members from each selected ward, thereby having 36 members in all. We also
interviewed the elected representatives of twelve randomly selected wards.
The plan of this paper is as follows. In the first section, we discuss peoples’ participation
in the WC meetings. The second section deals with the WC members’ participation in WC
meetings along with their perception on functioning of the WCs. In the third section, we assess
the functioning of the elected representatives by examining their regular municipal activities.
The final section summarizes the main findings of this paper.
5 West Bengal is located in northeastern part of India. In terms of absolute size of urban population, West Bengal ranks fourth amongst the Indian States. In particular, as per Census 2001, 28.03 percent of the total population resides in various urban areas. The rate of growth of urban population during 1991-2001 has been 20.20 percent. The average density of the urban population in West Bengal is 6798 per square kilometer, which is the highest in the country. Municipalisation has also kept pace with the number of municipal bodies rising from 96 in 1951 to 126 (6 Municipal Corporations, 117 municipalities and 3 Notified Area Authority) in 2005. These bodies are normally dichotomized as municipal bodies located within the Kolkata Metropolitan Area (KMA) and the non-KMA municipalities (Government of West Bengal, Administrative Report of Municipal Affairs Department 2001-2005: 1-3).
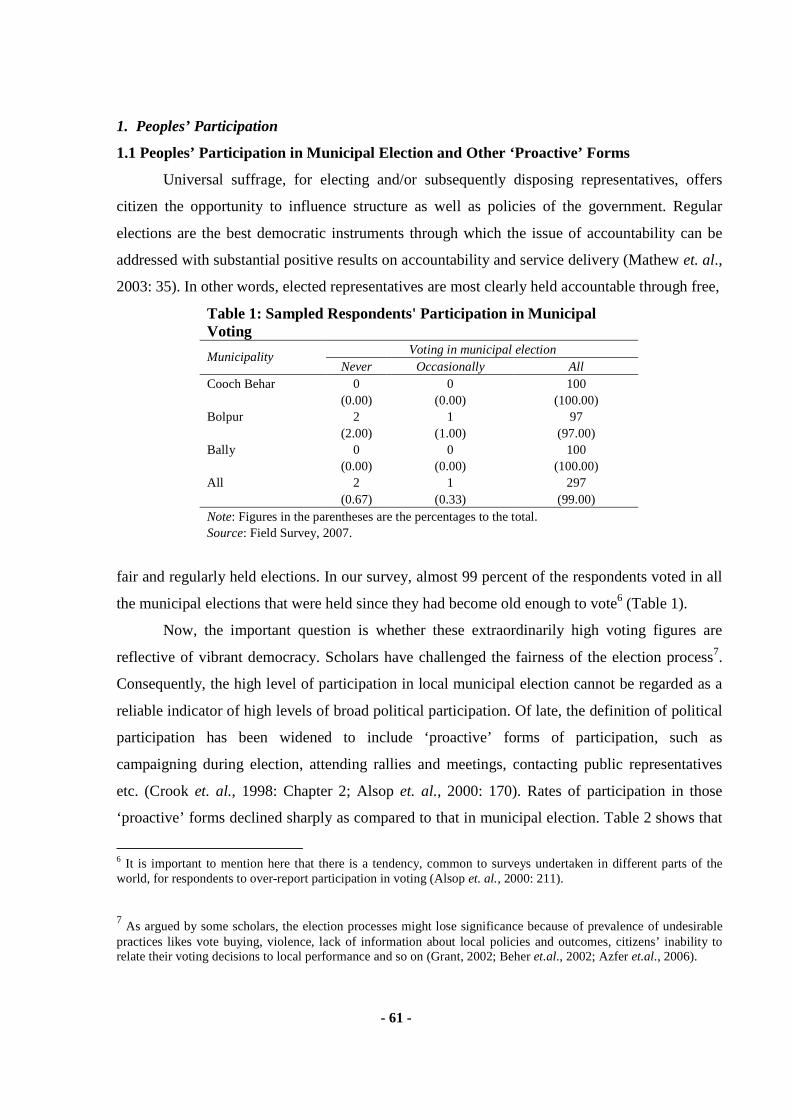
- 61 -
1. Peoples’ Participation
1.1 Peoples’ Participation in Municipal Election and Other ‘Proactive’ Forms
Universal suffrage, for electing and/or subsequently disposing representatives, offers
citizen the opportunity to influence structure as well as policies of the government. Regular
elections are the best democratic instruments through which the issue of accountability can be
addressed with substantial positive results on accountability and service delivery (Mathew et. al.,
2003: 35). In other words, elected representatives are most clearly held accountable through free,
Table 1: Sampled Respondents' Participation in Municipal Voting
Voting in municipal election Municipality
Never Occasionally All Cooch Behar 0 0 100 (0.00) (0.00) (100.00) Bolpur 2 1 97 (2.00) (1.00) (97.00) Bally 0 0 100 (0.00) (0.00) (100.00) All 2 1 297 (0.67) (0.33) (99.00) Note: Figures in the parentheses are the percentages to the total. Source: Field Survey, 2007.
fair and regularly held elections. In our survey, almost 99 percent of the respondents voted in all
the municipal elections that were held since they had become old enough to vote6 (Table 1).
Now, the important question is whether these extraordinarily high voting figures are
reflective of vibrant democracy. Scholars have challenged the fairness of the election process7.
Consequently, the high level of participation in local municipal election cannot be regarded as a
reliable indicator of high levels of broad political participation. Of late, the definition of political
participation has been widened to include ‘proactive’ forms of participation, such as
campaigning during election, attending rallies and meetings, contacting public representatives
etc. (Crook et. al., 1998: Chapter 2; Alsop et. al., 2000: 170). Rates of participation in those
‘proactive’ forms declined sharply as compared to that in municipal election. Table 2 shows that
6 It is important to mention here that there is a tendency, common to surveys undertaken in different parts of the world, for respondents to over-report participation in voting (Alsop et. al., 2000: 211).
7 As argued by some scholars, the election processes might lose significance because of prevalence of undesirable practices likes vote buying, violence, lack of information about local policies and outcomes, citizens’ inability to relate their voting decisions to local performance and so on (Grant, 2002; Beher et.al., 2002; Azfer et.al., 2006).

- 62 -
only 39 percent of the respondents in our surveyed municipalities actively took part in election
campaign, political meetings etc.
Table 2: Sampled Respondents' Participation in Political Activity
Political Participation Municipality
Active Passive Cooch Behar 46 54 (46.00) (54.00) Bolpur 26 74 (26.00) (74.00) Bally 45 55 (45.00) (55.00) Total 117 183
(39.00) (61.00) Note: Figures in the parentheses are the percentages to the total. Source: Field Survey, 2007
1.2 Institutionalizing Citizens’ Participation: The Role of the Ward Committees (WCs)
Apart from regular municipal election, the 74th CAA also seeks to institutionalize
citizens’ participation through the formation of WCs in ULBs with three lakhs or more
population. The Government of West Bengal makes it mandatory to constitute the WCs for all
municipalities, irrespective of the size of the population. In fact, West Bengal is one of the few
states, which in the first opportunity after the municipality elections in 1995, ensured that WCs
are formed in all municipalities8. However, significant variations have been observed in the
functioning of the WCs among the municipalities in the state as well as among the wards in same
municipality (Ghosh et. al., 2004: 29-30).
As par the provisions of WC Rules 2001, two types of meetings are to be conducted by
the WCs: (a) ordinary meeting in which members of the committee must meet at least once in
every month and (b) annual general meeting (AGM), to be held within June 30 of each year and
preferably be arranged in a public place within the ward, in which all residents of the ward are
invited. A detailed report on activities performed by the WC in the ward during the preceding
year and also the programs to be taken up during the current year are presented in the AGM. The
2003 amendment suggests that the WC will also have to convene a half-yearly general meeting
in the same way as they convene the AGM. Ordinary monthly meetings are not open to the
8 This arrangement is superior to the provision of constituting the WCs only in corporation areas for a group of wards, as practiced in states like Karnataka, Maharastra, Tamil Nadu, Delhi etc. In other words, the degree of decentralization in this state has been higher with greater scope of participatory governance through closer proximity of citizens with the elected representatives.

- 63 -
public. Besides these types of meetings, WCs can also meet to discuss any emergency issues in
the ward.
Peoples’ Participation in AGM of the WCs
Theoretically, annual general meeting (AGM) of the WC provides a forum where people
from every parts of society can voice their opinion, criticize elected officials and suggest
solutions to practical problems. In such meetings, the scope of deliberations, between citizens
and elected representatives on issues concerning local citizens, provide a mechanism by which
elected representatives can be made accountable to the local constituents. In spite of being an
important forum providing genuine opportunity for participation, AGM of the WC was held only
in four out of 12 municipal wards surveyed by us. However, the most disturbing fact, which has
serious implications for accountability and transparency of municipalities, is very poor
attendance of the respondents in the AGM of the WC. Only 28 percent of the total respondents
attended the AGMs in those four wards. The attendance rate was highest in ward 6 of Bally
municipality with almost half of the respondents reported their attendance in the AGM. But, the
scenario was truly bleak in the other three wards with the corresponding figure ranging from
only 16 percent in ward 4 of Cooch Behar municipality to 28 percent in ward 6 of Bolpur
municipality (Table 3). If we compare the attendance of the respondents for two sexes (Table 4),
a striking fact is that higher proportion of our female respondents in those four wards actually
attended the AGMs. Moreover, women belonging to the SC/ST category attended the AGM
relatively in a larger proportion compared to the women from general category. This indicates
that official policies, targeted towards greater participation of socially and economically
disadvantageous section of people, started producing positive results.
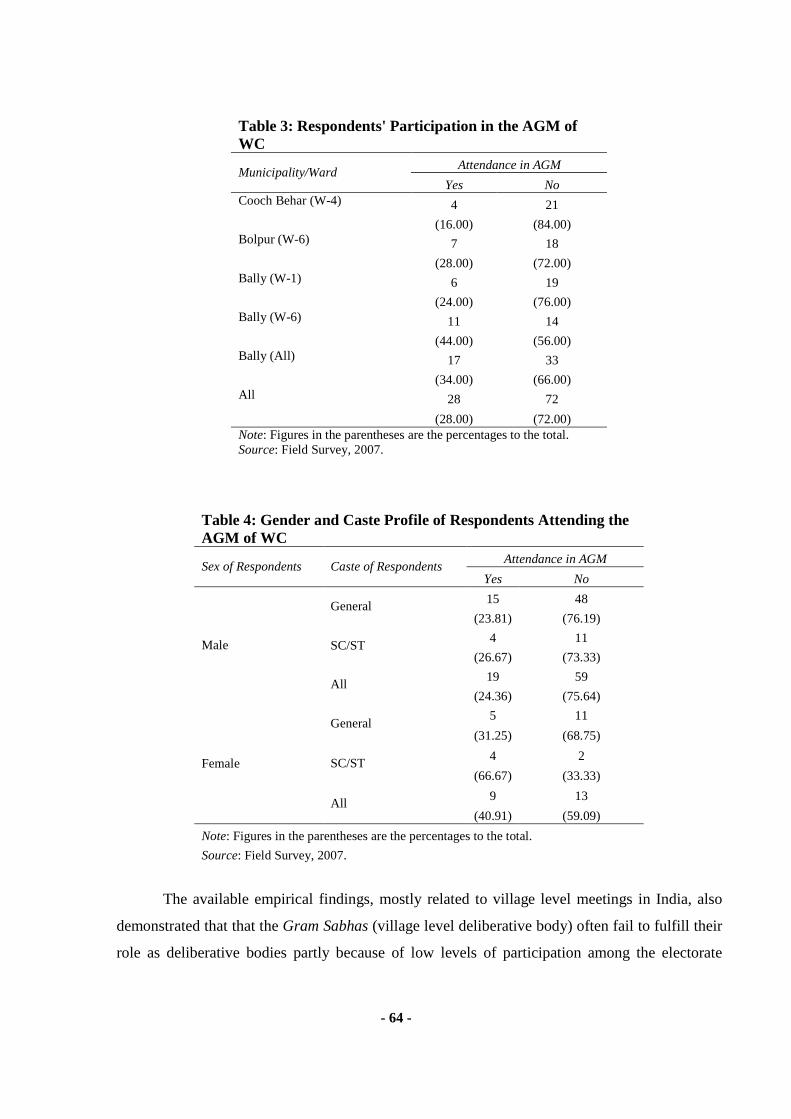
- 64 -
Table 3: Respondents' Participation in the AGM of WC
Attendance in AGM Municipality/Ward
Yes No
4 21 Cooch Behar (W-4)
(16.00) (84.00)
7 18 Bolpur (W-6)
(28.00) (72.00)
6 19 Bally (W-1)
(24.00) (76.00)
11 14 Bally (W-6)
(44.00) (56.00)
17 33 Bally (All)
(34.00) (66.00)
28 72 All
(28.00) (72.00) Note: Figures in the parentheses are the percentages to the total. Source: Field Survey, 2007.
Table 4: Gender and Caste Profile of Respondents Attending the AGM of WC
Attendance in AGM Sex of Respondents Caste of Respondents
Yes No
15 48 General (23.81) (76.19)
4 11 SC/ST
(26.67) (73.33)
19 59
Male
All (24.36) (75.64)
5 11 General
(31.25) (68.75)
4 2 SC/ST
(66.67) (33.33)
9 13
Female
All (40.91) (59.09)
Note: Figures in the parentheses are the percentages to the total.
Source: Field Survey, 2007.
The available empirical findings, mostly related to village level meetings in India, also
demonstrated that that the Gram Sabhas (village level deliberative body) often fail to fulfill their
role as deliberative bodies partly because of low levels of participation among the electorate

- 65 -
(Alsop et. al., 2000: 171; Ghatak et.al., 2002: 50; Beher et. al., 2002: 36; Johnson 2003: 29;
Sarkar, 2008: ABP 14th May). Nevertheless, the situation is far gloomy in the urban areas as
participatory involvement of citizens in local governance structure is almost totally absent there9.
For example, in Bangalore, there were 31 WCs, which were fatally hampered by the combination
of a debatable nomination process, limited citizen representation and an ambiguous mandate
(Ramanathan, 2007: 674).
Several studies have attempted to identify the reasons behind insufficient participation
and the reasons identified are: lack of awareness about meetings, hesitation among women to
actively participate because of social taboos, lack of awareness among people in general, and
specifically among women and socio-economically backward sections, about their roles and
rights in these meetings, inconvenient meeting time and venue, pre-conceived notion about
futility of those meetings, disadvantaged sections or backward castes believing that their voices
will not be honoured as the leadership comes from the higher echelons of the society, corruption,
and so (Mathew et. al., 2003: 48; Johnson 2003: 29; Ghatak et. al., 2002: 50-51; Beher et. al.,
2002: 37).
Factors Explaining Low Participation of People in WCs
In this study, we identified the factors that might explain the low attendance in the AGM
of the WCs. We observed that a significant majority of respondents in all the three municipalities
were completely ignorant about existence, constitutional status and rules and activities of the
WCs. Although the WCs were constituted in every ward, only 57 percent of the total respondents
were aware of existence of WCs (Table 5). The concept of WC as a constitutional body for
9 According to Ramanathan, although the 73rd and 74th constitutional amendments created units of local self governments at the rural and urban levels respectively, urban decentralization has received far less attention in the country because of increasing significance of panchayati raj institutions in the villages. This lopsided approach has its root in the very process of drafting of two seminal pieces of legislation that have given rural and urban local governments their current positions. Four decades of struggle and intense debates by the policy makers culminated in the 73rd CAA while an urban decentralization amendment was drafted within a period of few months, mirroring in some ways the structural aspects of rural decentralization, capturing some unique needs of urban areas but missing the essential spirit of rural amendment-the centrality of the citizen and the bottom up nature of local self-government. In particular, as par the 73rd CAA, Gram Sabha means “a body consisting of persons registered in the electoral rolls relating to a village comprised within the area of panchayat at the village level”. On the other hand, the 74th CAA discusses the institutional arrangement of the WC rather than recognizing the centrality of the registered voter. Under the 74th CAA, “the legislature of a state may, by law, make provision with respect to (i) the composition and the territorial area of a ward committee; (ii) the manner in which the seats in a ward committee shall be filled”. Thus, from a constitutional standpoint, a clear and formal status of urban voter, like their rural counterpart, is absent. This, in turn, exacerbates the ‘organic connection’ between urban citizen and the government (ibid 2007: 674-681).
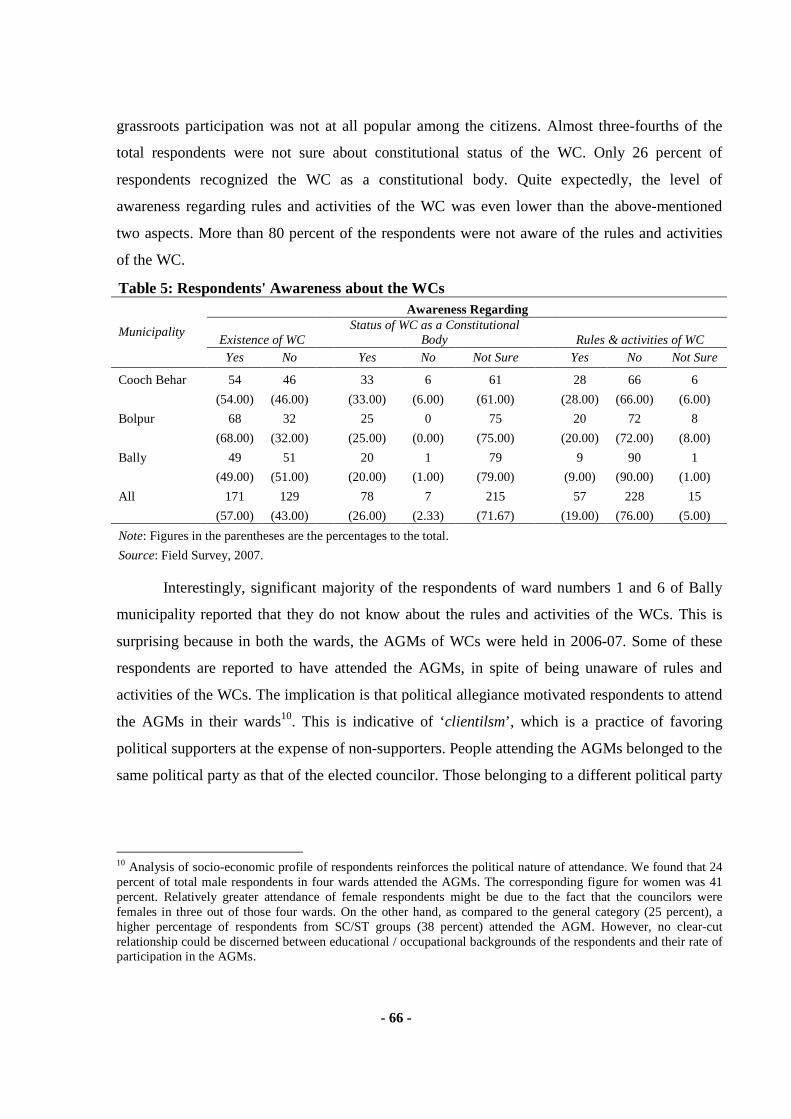
- 66 -
grassroots participation was not at all popular among the citizens. Almost three-fourths of the
total respondents were not sure about constitutional status of the WC. Only 26 percent of
respondents recognized the WC as a constitutional body. Quite expectedly, the level of
awareness regarding rules and activities of the WC was even lower than the above-mentioned
two aspects. More than 80 percent of the respondents were not aware of the rules and activities
of the WC.
Table 5: Respondents' Awareness about the WCs Awareness Regarding
Existence of WC Status of WC as a Constitutional
Body Rules & activities of WC Municipality
Yes No Yes No Not Sure Yes No Not Sure
Cooch Behar 54 46 33 6 61 28 66 6
(54.00) (46.00) (33.00) (6.00) (61.00) (28.00) (66.00) (6.00)
Bolpur 68 32 25 0 75 20 72 8
(68.00) (32.00) (25.00) (0.00) (75.00) (20.00) (72.00) (8.00)
Bally 49 51 20 1 79 9 90 1
(49.00) (51.00) (20.00) (1.00) (79.00) (9.00) (90.00) (1.00)
All 171 129 78 7 215 57 228 15
(57.00) (43.00) (26.00) (2.33) (71.67) (19.00) (76.00) (5.00)
Note: Figures in the parentheses are the percentages to the total.
Source: Field Survey, 2007.
Interestingly, significant majority of the respondents of ward numbers 1 and 6 of Bally
municipality reported that they do not know about the rules and activities of the WCs. This is
surprising because in both the wards, the AGMs of WCs were held in 2006-07. Some of these
respondents are reported to have attended the AGMs, in spite of being unaware of rules and
activities of the WCs. The implication is that political allegiance motivated respondents to attend
the AGMs in their wards10. This is indicative of ‘clientilsm’, which is a practice of favoring
political supporters at the expense of non-supporters. People attending the AGMs belonged to the
same political party as that of the elected councilor. Those belonging to a different political party
10 Analysis of socio-economic profile of respondents reinforces the political nature of attendance. We found that 24 percent of total male respondents in four wards attended the AGMs. The corresponding figure for women was 41 percent. Relatively greater attendance of female respondents might be due to the fact that the councilors were females in three out of those four wards. On the other hand, as compared to the general category (25 percent), a higher percentage of respondents from SC/ST groups (38 percent) attended the AGM. However, no clear-cut relationship could be discerned between educational / occupational backgrounds of the respondents and their rate of participation in the AGMs.

- 67 -
or apolitical kept themselves away from such meetings11. This seriously dampened the
constitutionally envisaged apolitical spirit of the functioning of the WCs as the vibrant policy-
making bodies with active involvement of common people.
Thus, against such a bizarre background of overwhelming majority of respondents being
simply unaware of mere existence, constitutional status, as well as rules and activities of the
WCs, peoples’ low attendance in the AGMs of WCs is nothing but natural outcome. This
underscores the supreme importance of providing information to citizens about constitutional
provisions as well as rules and regulations related to democratic decision making. It matters little
whether the constitutional provision guarantees decision-making rights of the citizens or not
when the people are not aware of what right and opportunity they have, and they are unable to
enforce their constitutional rights. Quite understandably, if there are many such individuals who
do not have information on constitutional provisions, then their ability to enforce responsiveness
and accountability will be low. Reducing this gap in information is, indeed, a key task in
designing appropriate urban development policy.
Considering all the four wards in which the AGMs were held, majority of the respondents
are found unaware of any such meetings in their wards. The percentage of respondents, having
information about AGMs, ranged from 16 percent in ward 4 of Cooch Behar municipality to 60
percent in ward 6 of Bally municipality. It is also interesting to note that not all people having
information on date and time of AGM attended the meeting. About 20-25 percent of informed
respondents did not attend the AGMs in two wards of Bally municipality. Not even half of the
informed respondents in ward 6 of Bolpur municipality took part in the AGM. One might explain
this in terms of peoples’ adverse perception about fruitfulness of such meetings. This observation
can be substantiated by analyzing data on the respondents’ knowledge about the decisions taken
in WC meetings and their actual implementation. Taking all the four wards together, where the
AGMs were held, a significant majority of the respondents expressed that they had no
information about the WC decisions (Table 6). Only about 21 percent of respondents revealed
that they knew about the decisions taken in the WC meetings.
11 One study on municipalities in KMA areas found that most of the participants in the AGMs organized by WCs were either close to the ward councilor or were attracted by various incentives offered by the ward councilors to enhance attendance rate in the AGMs. In one ward of Kalyani municipality, the councilor arranged some small gifts for the participants, through lottery, to increase attendance rate in the AGM (Pal, 2006: 517).
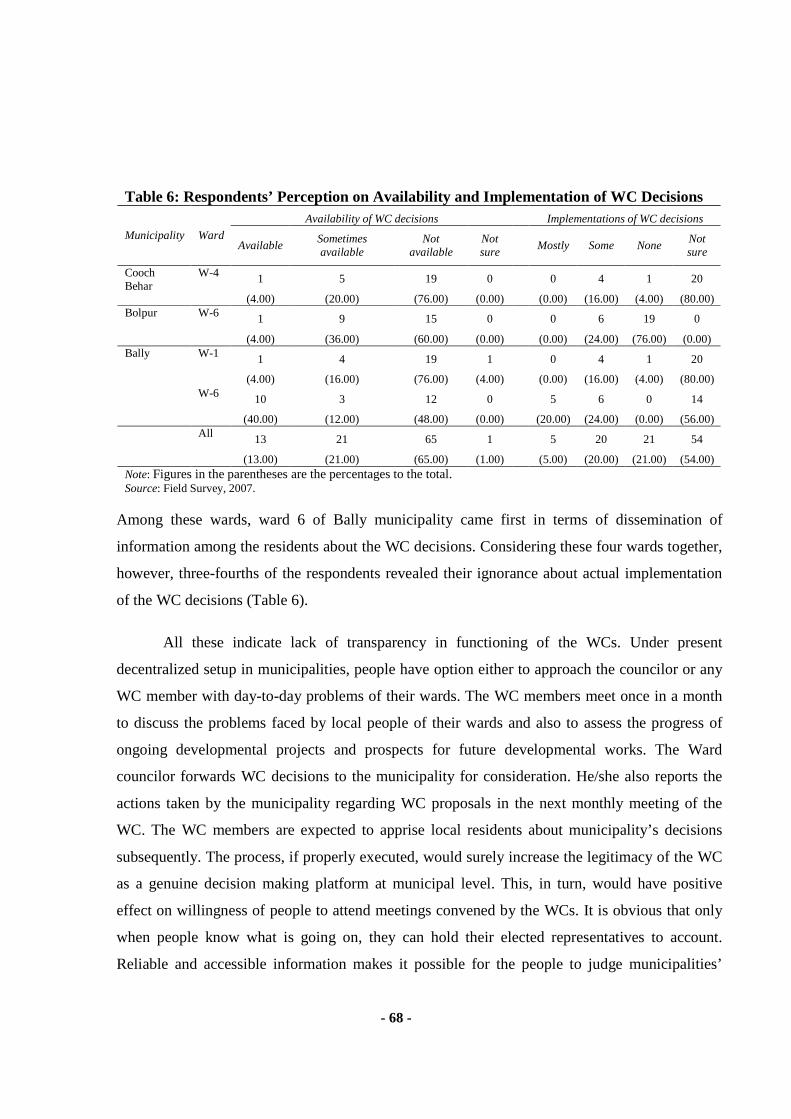
- 68 -
Table 6: Respondents’ Perception on Availability and Implementation of WC Decisions Availability of WC decisions Implementations of WC decisions
Municipality Ward Available
Sometimes available
Not available
Not sure
Mostly Some None Not sure
1 5 19 0 0 4 1 20 Cooch Behar
W-4
(4.00) (20.00) (76.00) (0.00) (0.00) (16.00) (4.00) (80.00)
1 9 15 0 0 6 19 0 Bolpur W-6
(4.00) (36.00) (60.00) (0.00) (0.00) (24.00) (76.00) (0.00)
1 4 19 1 0 4 1 20 W-1
(4.00) (16.00) (76.00) (4.00) (0.00) (16.00) (4.00) (80.00)
10 3 12 0 5 6 0 14
Bally
W-6
(40.00) (12.00) (48.00) (0.00) (20.00) (24.00) (0.00) (56.00)
13 21 65 1 5 20 21 54
All
(13.00) (21.00) (65.00) (1.00) (5.00) (20.00) (21.00) (54.00) Note: Figures in the parentheses are the percentages to the total. Source: Field Survey, 2007.
Among these wards, ward 6 of Bally municipality came first in terms of dissemination of
information among the residents about the WC decisions. Considering these four wards together,
however, three-fourths of the respondents revealed their ignorance about actual implementation
of the WC decisions (Table 6).
All these indicate lack of transparency in functioning of the WCs. Under present
decentralized setup in municipalities, people have option either to approach the councilor or any
WC member with day-to-day problems of their wards. The WC members meet once in a month
to discuss the problems faced by local people of their wards and also to assess the progress of
ongoing developmental projects and prospects for future developmental works. The Ward
councilor forwards WC decisions to the municipality for consideration. He/she also reports the
actions taken by the municipality regarding WC proposals in the next monthly meeting of the
WC. The WC members are expected to apprise local residents about municipality’s decisions
subsequently. The process, if properly executed, would surely increase the legitimacy of the WC
as a genuine decision making platform at municipal level. This, in turn, would have positive
effect on willingness of people to attend meetings convened by the WCs. It is obvious that only
when people know what is going on, they can hold their elected representatives to account.
Reliable and accessible information makes it possible for the people to judge municipalities’

- 69 -
performances and hold them accountable. Indeed, transparency is key to systematic
accountability12. However, the reality, based on our survey experiences, depicted something else.
The non-availability of information on decisions of the WCs and their implementation created a
sense of disbelief about effective functioning of WCs among the local residents. This, in turn,
induced respondents not to participate in any kind of activities of the WCs.
Peoples’ Perception about WC Deliberations
Let us now have a glimpse on functioning of the WCs based on the experiences of
individual respondents who attended the AGMs of the WCs. Quite understandably, public
deliberations on issues affecting common people, exchange of ideas among the different
stakeholders etc. legitimize the democratic decision making process which, in turn, improve
accountability and transparency of the entire process. However, our analysis in the preceding
sections reveals that the scope of any public deliberations was severely limited due to irregularity
in convening the AGMs as well as insignificant attendance of the respondents in such meetings.
Nevertheless, we enquired about the mode of participation of respondents who attended the
AGMs. Simply sitting and listening to the proceedings of the meetings was the most dominant
Table 7: Individual Respondents' Responses on Functioning of AGM of WCs Manner of Participation Mode of Decision Making
Municipality Sit & listen Passive* Active** Councilor alone By few members Collectively
3 0 1 1 2 1 Cooch Behar
(75.00) (0.00) (25.00) (25.00) (50.00) (25.00)
6 0 1 0 0 7 Bolpur
(85.71) (0.00) (14.28) (0.00) (0.00) (100.00)
5 7 5 0 1 16 Bally
(29.41) (41.17) (29.41) (0.00) (5.88) (94.11)
14 7 7 1 3 24 All
(50.00) (25.00) (25.00) (3.51) (10.71) (85.71)
Notes: Figures in the parentheses are the percentage to the total. Total number of respondents is 28.
*: Participate in discussions initiated by others. **: Initiate the discussion himself/herself.
Source: Field Survey, 2007.
12 Interestingly, under decentralized set up, local participation in government processes can increase the flow of information and hence accountability. But, this sequence in itself may be enough to discourage the elected representatives to make information on local government decisions publicly available (Grant, 2002: 19).

- 70 -
form of participation as half of the respondents did so (Table 7). Only one-fourth of the
respondents actively participated in discussions. Among the municipalities, significant
proportion of respondents (almost 70 percent) in Bally municipality participated in the
discussions; majority of those respondents belonged to ward 6. Almost 86 percent of the
respondents reported that decisions were taken on a consensus basis. According to only 11
percent of the respondents, few members dominate the decision making process. Few more
points need to be noted in this context. Most of the participants in the AGMs were close to the
ward councilor as well as his/her political party. Those who are critical of the ward councilor’s
leadership, including people belonging to other political parties, were reluctant to participate in
the AGM for voicing their concerns. In this situation, one would not expect a participant to
oppose any suggestion or decision made by the ward councilor. This, in fact, is one of the
important reasons behind our respondents’ inactive participation. In reality, there is a general
unwillingness among the local people to voice their opinion publicly as they avoid antagonizing
their local party leaders.
Thus, it clearly appears that non-occurrence of AGM in most of the municipal wards
seriously undermined the constitutionally envisaged aim of ‘deepening democracy’. In our
survey, democratic local governments in most cases failed to offer potential participatory
possibilities, even unable to convene AGM on a regular basis, to a large number of citizens.
However, despite these limitations, the AGM, at least for those who attended, seemed to be an
important institutional forum contributing to the ideal of participatory governance. The
experience of deliberating in public forums on issues such as garbage collection, streetlights,
roads etc. can expand citizens’ skills. Moreover, positive experiences are likely to induce other
citizens to participate in such public forums13.
13 Citizens, in reality, need skills along with motivation to take the full advantage of participatory possibilities provided by the decentralized setup. As Gaventa says, “citizen participation does not just happen, even when the political spaces and opportunities emerge for it to do so. Developing effective citizenship and building democratic institutions take effort, skill and attention” (Gaventa, 1999: 50). More the citizens get opportunity to deliberate in public forums, more will be their skills and motivation. This, in turn, paves the path for effective/meaningful participation.
- 71 -
2. Ward Committee Members’ Participation
As per the constitutional provision, the WC members are required to participate in the
monthly meetings of the WCs. Another aspect of their participation in municipal activities is
related to their interaction with local residents, which allows them to know the needs and
priorities of the residents and attend those. This type of participation is also related to the concept
of accountability. The present section examines the actual process of participation by the WC
members. As per the constitutional provision, each WC should have 4 to 14 members (depending
upon the size of population of the ward), excluding the local councilor. The members are
categorized as the councilor’s nominees and chairman’s nominees. The local councilor is the
chairperson of the WC and is empowered to select the members from amongst local residents.
People belonging to the socially and economically disadvantageous sections are also expected to
represent the WC. The chairperson of the municipality also has the power to nominate a certain
number of members to each WC. Moreover, there are provisions for reservation of some seats in
the WCs for social workers, educationists, cultural activists, women from backward classes etc.
The WCs, thus, are envisioned as the separate apolitical citizens’ body to provide local residents
much needed platform to make demands and to have them forwarded to the municipality.
However, our empirical observations suggest otherwise. In general, councilors as well as
chairman of the municipality nominated members for the WC from among their own party
supporters. In Bally municipality, none of the WC members belonged to any opposition political
party. The councilors of all four wards surveyed were from the same political party, which also
formed the board at the municipality14. The chairman of the municipality and the councilor did
not nominate any member from the opposition political party in the WC15. In some wards of
Bolpur municipality and Cooch Behar municipality, members from different political
backgrounds were selected in the WCs. But, in majority cases, members having different
political affiliations were not informed about date and time of the monthly meetings of the
WCs16. Thus, the basic purpose of the WC as an apolitical citizens’ body, as envisaged by the
14 In fact, in Bally municipality, candidates of the Left Front won all the municipal seats. 15 Informally, some councilors reported that they approached some members of the opposition political party to become members of the WC, but none of them showed any interest. 16 Two WC members belonging to the opposition political party, one each from Bolpur municipality and Cooch Behar municipality, reported that they did not receive any invitation to attend the monthly WC meetings. One of the
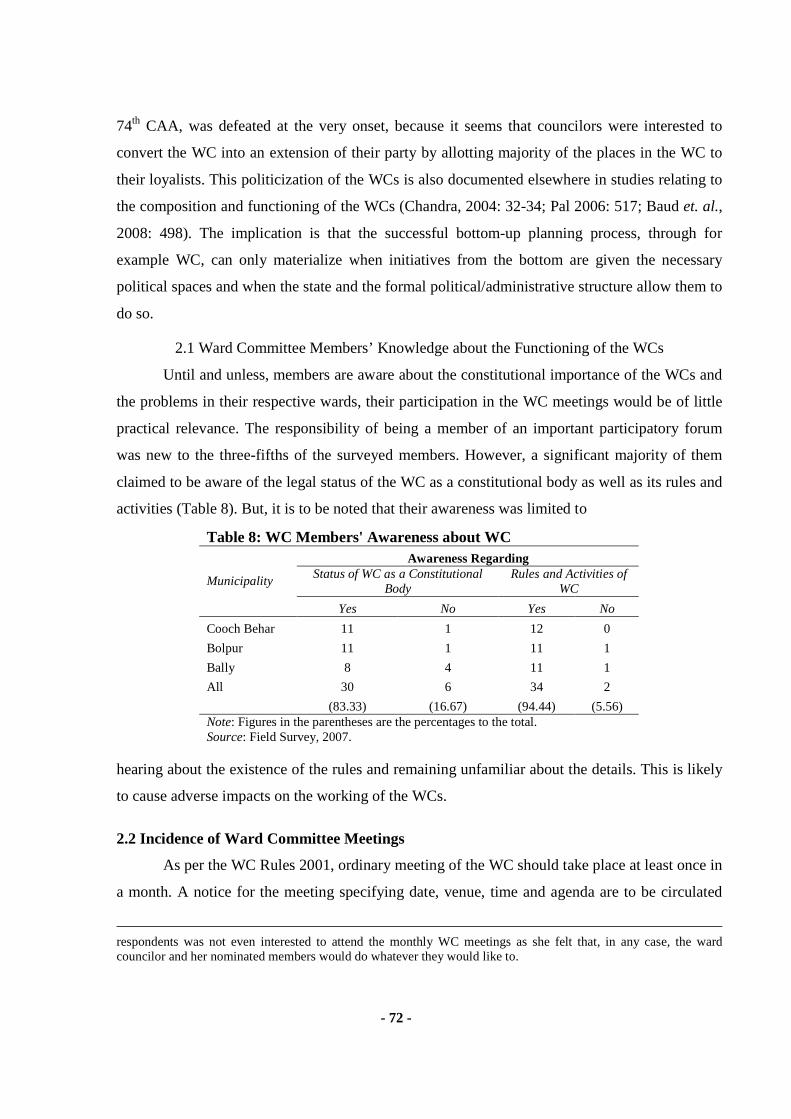
- 72 -
74th CAA, was defeated at the very onset, because it seems that councilors were interested to
convert the WC into an extension of their party by allotting majority of the places in the WC to
their loyalists. This politicization of the WCs is also documented elsewhere in studies relating to
the composition and functioning of the WCs (Chandra, 2004: 32-34; Pal 2006: 517; Baud et. al.,
2008: 498). The implication is that the successful bottom-up planning process, through for
example WC, can only materialize when initiatives from the bottom are given the necessary
political spaces and when the state and the formal political/administrative structure allow them to
do so.
2.1 Ward Committee Members’ Knowledge about the Functioning of the WCs
Until and unless, members are aware about the constitutional importance of the WCs and
the problems in their respective wards, their participation in the WC meetings would be of little
practical relevance. The responsibility of being a member of an important participatory forum
was new to the three-fifths of the surveyed members. However, a significant majority of them
claimed to be aware of the legal status of the WC as a constitutional body as well as its rules and
activities (Table 8). But, it is to be noted that their awareness was limited to
Table 8: WC Members' Awareness about WC Awareness Regarding
Status of WC as a Constitutional Body
Rules and Activities of WC
Municipality
Yes No Yes No
Cooch Behar 11 1 12 0
Bolpur 11 1 11 1
Bally 8 4 11 1
All 30 6 34 2
(83.33) (16.67) (94.44) (5.56) Note: Figures in the parentheses are the percentages to the total. Source: Field Survey, 2007.
hearing about the existence of the rules and remaining unfamiliar about the details. This is likely
to cause adverse impacts on the working of the WCs.
2.2 Incidence of Ward Committee Meetings
As per the WC Rules 2001, ordinary meeting of the WC should take place at least once in
a month. A notice for the meeting specifying date, venue, time and agenda are to be circulated
respondents was not even interested to attend the monthly WC meetings as she felt that, in any case, the ward councilor and her nominated members would do whatever they would like to.

- 73 -
among the members at least seven days before the date of the meeting. All the respondents in our
survey, except one, had information on date and timing of the WC meetings. However, large
intra- as well as inter-municipality variations were found in case of frequency of holding the WC
meetings (Table 9). Only 36 percent of the respondents reported that the
Table 9: WC Members' Responses on Incidence and Their Attendance in WC Meetings Frequency of WC Meetings Attendance in WC meetings
Municipality Once in a month/As
needed Every 3/4 months Irregular
None/Not sure Few Most All None
Cooch Behar 0 5 6 1 1 1 9 1
Bolpur 5 5 1 1 6 3 2 1
Bally 9 2 1 0 3 3 6 0
All 14 12 8 2 10 7 17 2
(38.88) (33.33) (22.22) (5.55) (27.78) (19.44) (47.22) (5.56) Note: Figures in the parentheses are the percentages to the total. Source: Field Survey, 2007.
monthly meetings of the WCs were held on a regular basis. Quite a significant proportion of the
respondents (22 percent) mentioned the irregular nature of such meetings. As per the
respondents’ responses, it seemed that, except ward number 27, regular monthly meetings were
held in all the surveyed wards of Bally municipality. In Bolpur municipality, it is reported that
the meetings were held with an interval of three/four months in all the sampled wards. In wards 4
and 19 of Cooch Behar municipality, the WC meetings were very irregular. Moreover, the
members’ participation in these meetings was very thin. Less than half of the respondents
claimed to have attended all the WC meetings, held during 2006-2007 in their respective wards.
Two WC members, belonging to the opposition political party, reported that they did not attend
any WC meeting in the reference year as they were unaware of any such meetings. The
participation of the WC members in monthly meetings was rather passive. Only one third of the
respondents participated in the meetings actively, which means initiating and getting involved in
the discussions (Table 10). About one-half of them claimed to have
Table 10: WC Members' Responses on Mode of Participation in WC Meetings Municipality Sit & Listen Passive Active
Cooch Behar 3 5 3
Bolpur 1 6 4
Bally 1 8 3
All 5 19 10
(14.71) (55.88) (29.41) Notes: Same as in Table 9 Source: Field Survey, 2007.

- 74 -
taken part in discussions in a passive manner. On the other hand, for 14 percent of the
respondents, the participation in the meetings was limited to simply sitting and listening to the
proceedings and nodding their heads. Among the active participants, an overwhelming majority
was males (90 percent). Only one female respondent actively participated in the meetings. In
essence, WC members’ mode of participation hardly produces any surprise. As mentioned
earlier, almost cent percent of the WC members belonged to the political party of the elected
councilor. Moreover, the members belonging to opposition party were rarely invited to attend the
meetings. Thus, it is fair to conclude that the actual function of the members was limited to
rationalizing the political decisions already made by the higher leadership. Naturally, the extent
of active participation was highly limited and very rarely the WC members proposed any new
plan/activities or alternatives to existing plan/activities or opposed any of the proposals of the
councilors.
The WC members took decisions mostly on consensus basis (Table 11). Only 11 percent
Table 11: Members' Responses on Mode of Decision Making in WC meetings Municipality A B C
Cooch Behar 2 2 9
Bolpur 1 3 8
Bally 1 3 7
All 4 8 24
(11.11) (22.22) (66.67)
Notes: A -Chairman decides; B - Few members decide, C - Every member decides.
Figures in the parentheses are the percentages to the total.
Source: Field Survey, 2007.
of the respondents reported that the chairperson dictates the decision on any issue. However,
there were no instances where the decisions got pending due to lack of unanimity. Dutta (2003)
in his study of Rajpur-Sonarpur and Berhampore municipalities and Ghosh et. al. (2003) in their
study of Siliguri Municipal Corpoation and Bidhannagar municipality found similar results.
Dutta hailed absence of serious debate, as a positive step towards achieving the developmental
goals quickly and easily (Dutta, 2003: 26). However, given the political nature of the WCs,
absence of serious debate put a question mark on the efficacy of the WCs as a true participative
forum at the municipal level.

- 75 -
3. Role of the Elected Representatives
In decentralized local governance structure, one of the important mechanisms for
ensuring accountability involves a smooth relationship between citizens and elected
representatives, which is strengthened by frequent interactions and communications between
them. In our study, we found that a significant majority of the respondents (79 percent)
approached the local councilor for their problems, followed by the WC members (22 percent)
and political party representatives (13 percent). We further enquired about the frequency of
interactions and communications between the councilors and local residents. It is found that 65
percent of the respondents approached the councilors at least once during the reference year17.
Among them, some of the respondents contacted the councilor, quite regularly, with their
problems. On the other hand, one-third of the respondents never made any contact with the
councilors. According to one-half of the respondents, the councilors frequently visited their
wards to get some idea about needs and priorities of the constituents. Majority of the respondents
were able to directly approach the councilors and most of them drew some attention from the
councilors. Thus, it seemed that there was enough scope for interaction and communication
between local citizens and elected councilors. However, it also appears that such interactions
have been confined to the people belonging to the same political party while those from
opposition parties generally refrained from such interactions and communications.
3.1 Participation of Elected Representatives
We also studied in detail the manner of participation in regular municipal activities and
related matters by the councilors. In this context, our first point of enquiry was their familiarity
with the 74th CAA. We found that cent percent of them were aware of the 74th CAA. However,
while interacting with them more intensively, it was noticed that some of the elected
representatives, especially women and those from disadvantaged sections, were yet to fully
comprehend the provisions of the 74th CAA. In some cases, the councilors appeared to be
ignorant about the WC rules. For example, one of the councilors believed that the person
belonging to opposition political party is ineligible to become a member of the WC, which is
wrong as per the WC Rules 2001 or its subsequent amendment in 2003. This particular
17 This figure needs careful interpretation as it seemed that people affiliated to the party to which the councilor represented interacted most frequently.

- 76 -
councilor’s utterances revealed not only his ignorance about the WC rules but also a tendency to
exclude the element of opposition from the local decision making processes. Moreover, from the
conversations with the female elected representatives, especially female representatives from the
SC/ST groups, it appeared that the local residents tend to bypass them and prefer to reach the
local political party members directly, which minimized their roles in the municipality affairs.
The councilors discussed most of the problems of their wards in WC meetings. Meetings
at the municipality are the other forums where they could raise and discuss those problems. The
usual convention is to convene the meeting of the board of councilors once in a month to discuss
various important issues18. Eight out of 12 councilors claimed that they attended all the board
meetings (Table 12). The remaining four councilors attended as many (not all) meetings as
possible.
Table 12: Councilors' Attendance in Municipal Board Meetings Municipality Most All
Cooch Behar 1 3
Bolpur 3 1
Bally 0 4
All 4 8
Source: Field Survey, 2007.
However, the important question here is how far their participation or representation has been
effective or meaningful. Effective participation implied articulation of desires and problems of
citizens in the municipal meetings, participation in the deliberations on citizens’ problems, and
application of own judgment in matters relating to decision-making. The analysis of elected
representatives’ mode of participation in the meetings of board of councilors exhibited gender
differences with regard to capacity of the representatives to raise issues and participate in the
deliberations (Table 13).
18Interestingly, according to one Councilor (belonging to an opposition party) the monthly meetings are held at regular intervals not because of the fact that the elected representatives are truly interested at deliberations on local issues but because the councilors get certain allowances for convening and/or conducting as well as attending that meetings.

- 77 -
Table 13: Councilors' Mode of Participation in Municipal Board Meetings Sex of Respondents Caste of Respondents Sit & Listen Passive Active
General 0 0 3 Male
SC/ST 0 0 1
General 1 3 0 Female
SC/ST 2 2 0
Source: Field Survey, 2007.
All the four selected male councilors stated that they raised problems of their locality in the
meetings. All of them actively participated in the meetings to the extent that they initiated
discussions and/or got involved in deliberations. However, none of our selected female
representatives raised issues on their own in the meetings. Five of the women elected
representatives stated that they participated in the discussions initiated by others. Simply sitting
and listening to the proceedings of the meetings was the form of participation for other three
female representatives. The women representatives generally approached the chairman or any
other member of the municipality in advance about the problems of their locality, expecting that
they will speak on their behalf, rather than speaking in the meetings themselves. This inability to
directly raise an issue and also limited participation in deliberations reduced their influence over
the decision making process as through the meetings of the municipal boards.
Further, majority of the councilors reported that decisions are taken on the basis of a
consensus. Some further enquiry revealed that the decisions to be taken are pre-determined by
the chairman and a few influential councilors. Such decisions are just endorsed formally through
the municipality meetings. In the event of any dispute, decisions are taken on the basis of
majority vote. Thus, it appears that there is limited scope for using one’s own judgment in
municipal decision making processes. Thus, under the prevailing system, there is little scope of
numerical representation by various socio-economic groups in the municipal bodies getting
translated into an effectiveness representation, which really undermines the very essence of the
system of decentralization.
4. Summing Up
In terms of findings emerging from our analysis of micro data in urban West Bengal, we
point out a number of areas that require immediate attention while planning strategies for
decentralized urban governance.
- 78 -
Firstly, we observed that irregularity of monthly meetings and annual general meetings of
the ward committees weakened the prospect of having more transparent and accountable local
decision-making process. It is possible that the councilors themselves desired to keep the
activities of the ward committees beyond the scope of public scrutiny. Legally speaking,
municipalities could monitor the functioning of the ward committees with the help of a standing
committee constituted by the Board of Councilors. At the extreme, the Board of Councilors can
dissolve the non-functioning ward committees. However, the irony is that the municipalities do
not appear to be much interested in utilizing these provisions and this is indicative of their
negligence towards the ward committees. Utilizing the existing legal provisions and enforcing
them seriously would be necessary to prevent the non-occurrence of such important meetings.
Secondly, in course of our study, it has been found that even where the annual general
meetings were held, low participation of people in such meetings defeated the very purpose of
broadening the local decision-making process. Such low rate of participation is quite natural
when the urban people are constrained by the lack of information as regards the details of the
annual general meetings. Hence, there is a need to redress this information deficiency through,
for example, adequate house-to-house campaigns with special emphasis on reaching women and
those belonging to lower castes. It would also be useful to engage local media to disseminate the
relevant information as has been done in some other states of India.
Thirdly, another important implication arising from our study is that politically motivated
selection of the ward committee members diluted the non-political character of the ward
committees as envisaged by the 74th CAA. The councilors, in their attempt to eliminate any
possible opposition, selected members from their own political parties. In this situation, some
efforts to de-politicize the process of selection of ward committee members are called for. In
fact, the Amendment to the WC Rules in 2003 proposes that names of the members selected by
the councilor would have to be presented before the first annual general meeting for people’s
approval. The strict adherence to this rule might be helpful to democratize the selection process
of the ward committee members. Existence of impartial media and involvement of the voluntary
organizations might also act as possible counterweights to reduce the degree of politicization.
These institutions might be used to expose the political nature of the selection process, increase
the consciousness of the people as regards the constitutionally envisaged character of such
committees, and provoke public opinion against such politicization.

- 79 -
Fourthly, it is quite understandable that meaningful participation under decentralization is
crucially dependent on the capacity of the citizens to participate. In course of our field study, we
observed rather passive participation of the citizens in the annual general meetings of the ward
committees. It seemed to us that as the participating citizens were usually supporters of the
councilor, they were expected to comply with the decisions made by the councilor in such
meetings. Some people might also have felt inhibited to freely express their views as the
participation in a public forum was completely a new experience for them. Hence, the
government should take steps to ensure greater and more effective participation by the citizens,
as through launching a sustained campaign program to generate the citizens’ interest / awareness
about the ward committees and their necessity. The non-governmental organizations could also
be mobilized to play an important role in this regard.
Fifthly, the elected representatives (the councilors) themselves play a crucial role in the
present decentralized set up. However, their ‘numerical representation’ does not necessarily
produce desired results towards ‘effective representation’ as most of the members from socially
and economically disadvantaged sections are unable to directly raise any issue and/or participate
in discussions in the meetings. In any case, their limited participation in the deliberations
eventually reduces their influence over the decision-taking processes. We need strong and
committed political and executive leaders who can comprehend the need for reforms and have
courage to initiate the reform process. The leadership must be inspired and committed to carry
forward the reform initiatives.
In essence, following Rakodi’s classification (2001), the decentralized arrangements in
West Bengal upholds the attributes of representative democracy where citizens’ interests are met
through rules and institutions, elected governments, regular election etc. But, the finer provisions
of participatory democracy, which put special emphasis on arrangements where citizens can
directly participate in decision making process, are not being seriously explored and utilized.
This sort of arrangement, undoubtedly, has much wider connotation for accountability. It stands
out clearly that effective decentralization would require attention to both the supply and demand
sides of democratic governance. On the supply side, appropriate institutions, rules and incentives
mechanisms are needed to link the citizens with the government and their office bearers. On the
demand side, capacity development of the citizens is extremely crucial to exploit the
opportunities generated through supply side interventions. Conscious and combined efforts by
- 80 -
the government and non-government organizations along with greater involvement of the
citizens have the potentiality to improve the municipal governance system.
References
Alsop, R.J, A. Krishna and D. Sjoblom (2000): “Are gram panchyats inclusive? Report of a
study conducted in Rajasthan and Madhya Pradesh”, Background Paper No.3 of the
World Bank’s unpublished Overview of Rural Decentralisation in India, Vol. 3.
Bardhan, P and D. Mookherjee (2003): “Decentralisation and accountability in infrastructure
delivery in developing countries”, November [downloaded from
globetrotter.berkeley.edu].
Baud I and N Nainan (2008): “Negotiated spaces for representation in Mumbai: ward
committees, advanced locality management and the politics of middle class
activism”, Environment and Urbanization, Vol. 20 (2), 483-499.
Behar, A and Y. Kumar (2002): “Decentralisation in Madhya Pradesh in India: From
panchayati raj to gram swaraj (1995-2001)”, Working Paper No. 170, Overseas
Development Institute, London, September.
Brinkerhoff, D.W and Omar Azfar (2006): “Decentralization and community empowerment:
Does community empowerment deepen democracy and improve service delivery?”,
Paper presented for US Agency for International Development, Office of Democracy
and Governance, Washington DC, October.
Chandra, Medha (2004): “Bridging everyday and high politics-the 74th CAA and Inclusion in
Kolkata, India”, Development Planning Unit, University College London, London.
Crook, R.C and A.S. Sverrisson (1999): “To what extent can decentralised forms ofgovernment
enhance the development of pro-poor policies and improve poverty alleviations
outcomes?”, August.
Gaventa, John (1999): “Citizen knowledge, citizen competence and democracy building” in
Stephan L.Elkin and Karol E. Sotan, (Eds.) Citizen competence and democratic
institutions, University Park, PA: Penn State Press, 49-67.
Ghatak, M and M.Ghatak (2002): “Recent reforms in the panchayat system in West Bengal:
Towards greater participatory governance?”, Economic and Political Weekly, January 5,
45-58.
Government of West Bengal (2006): Administrative Report of Municipal Affairs Department
2001-2005, Kolkata
- 81 -
Grant, U (2002): “Local government decision making: Citizen participation and local
government accountability-A literature review”, International Development
Department, University of Birmingham, March.
Institute of Social Science (1996): “Municipal governance in West Bengal people’s perception
and participation”, ISS Manuscript Report-9, ISS, New Delhi.
Johnson, C, P. Deshingkar and D Start (2005): “Grounding the state: Devolution and
development in India’s Panchayats”, Journal of Development Studies, Vol. 41 No. 6,
August, pp. 937-970.
Kim, A (2008): “Decentralisation and provision of public services: Framework and
implementation”, Policy Research Working Paper 4503, The World Bank Development
Research Group, January.
Klugman, J (1994): “Decentralisation: A survey of literature from a human development
perspective”, Occasional Paper 13.
Krishna A (2007): “The conundrum of services: why services are crucial for making service
provision better” in S Devarajan and I Widlund (eds.) The politics of service
delivery in democracies better access for the poor, Edita, Stockholm.
Pal A (2006): “Scope of bottom – up planning in Kolkata: rhetoric vs reality”, Environment
and Urbanization, Vol. 18 No. 2 October, 501-521.
Patnaik, P (2005): “Affairmative action and representation of weaker sections participation and
accountability in Orissa’s panchayats”, Economic and Political Weekly, October 29,
4753-4761.
Puri, E (2004): “Understanding participation theoretical foundations and practical implications”,
Economic and Political Weekly, June 12, 2511-2517.
Rakodi, C (2001): “Urban politics and governance: A review of the literature”, International
Development Department, School of Public Policy, University of Birmingham.
Ramanathan R (2007): “Federalism, urban decentralization and citizen participation”,
Economic and Political Weekly, February 24, 674-681.
Robinson, M (2003): “Participation, local governance and decentralised service delivery”, Paper
Prepared for a Workshop on ‘New Approaches to Decentralised Service Delivery’ Held
in Santiago, Chile, 16-20 March.
Sharma R (2003): “Kerala’s decentralization idea in practice”, Economic and Political Weekly,
September 6, 3832-3851.

- 82 -
Smoke, P (2001): “Fiscal decentralisation in developing countries A review of currentconcepts
and practice”, Democracy, Governance and Human Rights Programme Paper Number 2,
United Nations Research Institute for Social Development, February.
World Bank (2003): “Devolution in Pakistan-preparing for service delivery improvements”, A
Working Paper Prepared for the Forum on Intergovernmental Relations and Service
Delivery in Pakistan, 27-29 June.
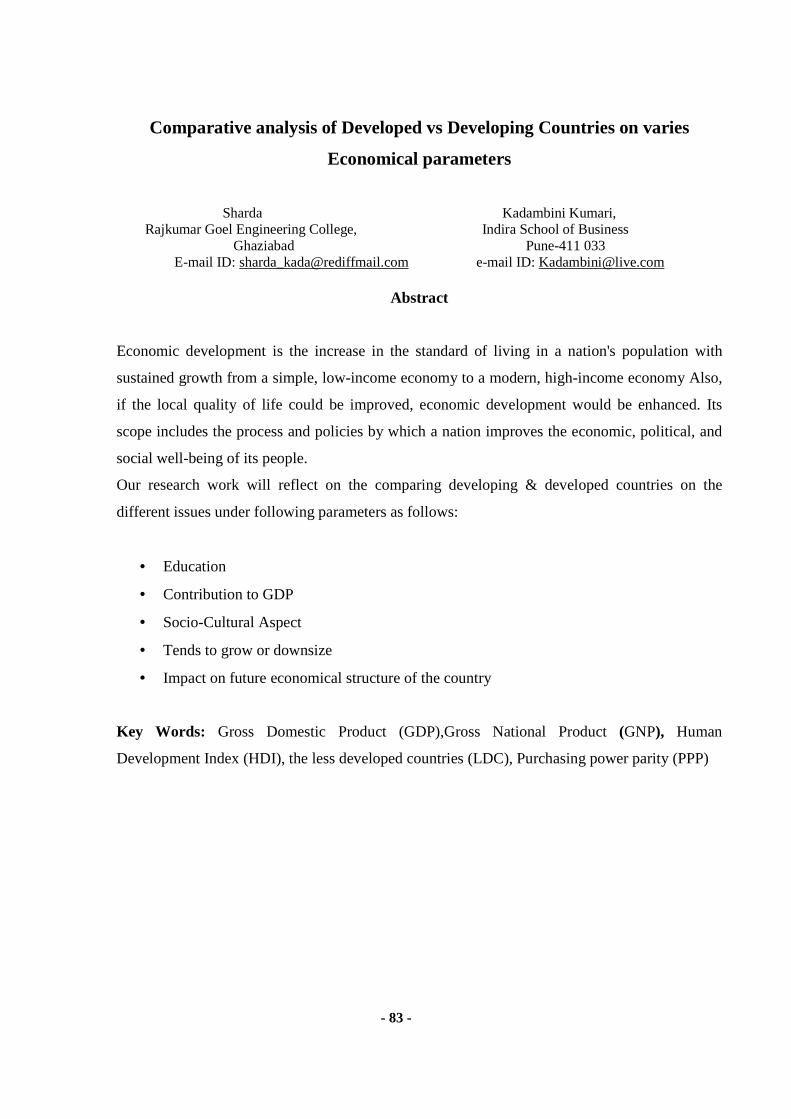
- 83 -
Comparative analysis of Developed vs Developing Countries on varies
Economical parameters
Sharda Kadambini Kumari,
Rajkumar Goel Engineering College, Indira School of Business Ghaziabad Pune-411 033
E-mail ID: [email protected] e-mail ID: [email protected]
Abstract
Economic development is the increase in the standard of living in a nation's population with
sustained growth from a simple, low-income economy to a modern, high-income economy Also,
if the local quality of life could be improved, economic development would be enhanced. Its
scope includes the process and policies by which a nation improves the economic, political, and
social well-being of its people.
Our research work will reflect on the comparing developing & developed countries on the
different issues under following parameters as follows:
• Education
• Contribution to GDP
• Socio-Cultural Aspect
• Tends to grow or downsize
• Impact on future economical structure of the country
Key Words: Gross Domestic Product (GDP),Gross National Product (GNP), Human
Development Index (HDI), the less developed countries (LDC), Purchasing power parity (PPP)
- 84 -
1. Economic Development Concepts
Traditionally economists have made little if any distinction between economic growth and
economic development using the terms almost synonymously. As a concept, economic
development can be seen as a complex multi-dimensional concept involving improvements in
human well-being, however defined Critics point out that GDP is a narrow measure of economic
welfare that does not take account of important non-economic aspects eg more leisure time,
access to health & education, environment, freedom or social justice. Economic growth is a
necessary but insufficient condition for economic development. Professor Dudley Seers argues
development is about outcomes i.e., development occurs with the reduction and elimination of
poverty, inequality unemployment, & illiteracy, within a growing economy.
1.1 Economics For Development
Economic development is the development of economic wealth of countries or regions for the
well-being of their inhabitants. This is the short definition of Economic Development. Economic
Growth & development are two different terms used in economics. Generally speaking economic
development refers to the problems of underdeveloped countries and economic growth to those
of developed countries. By Economic Growth we simply mean increase in per capita income or
increase in GNP. In recent literature, the term economic growth refers to sustained increase in a
country's output of goods and services, or more precisely product per capita. Output is generally
measured in terms of GNP.
The term economic development is far more comprehensive. It implies progressive changes in
the socio-economic structure of a country. Viewed in this way economic development Involves a
steady decline in agricultural shares in GNP and continuous increase in shares of industries, trade
banking construction and services. Further whereas economic growth merely refers to rise in
output; development implies change in technological and institutional organization of production
as well as in distributive pattern of income.
Hence, compared to the objective of development, economic growth is easy realize. By a larger
mobilization of resources and raising their productivity, output level can be raised. The process
of development is far more extensive. Apart from a rise in output, it involves changes in
- 85 -
composition of output, shift in the allocation of productive resources, and elimination or
reduction of poverty, inequalities and unemployment.
In the words of Amartya Sen "Development requires the removal of major sources of unfreedom
poverty as well as tyranny, poor economic opportunities as well as systematic social deprivation
neglect of public facilities as well as intolerance or over activity of repressive states."
Economic development is not possible without growth but growth is possible without
development because growth is just increase in GNP It does not have any other parameters to it.
Development can be conceived as Multi-Dimensional process or phenomena. If there is increase
in GNP more than the increase in per capita Income then we can say that Development is
possible. When given conditions of population improves then we can say that this is also an
indicator of economic Development.
Professor Michael Todaro sees three objectives of development:
“Producing more life sustaining necessities such as food shelter & health care and broadening
their distribution raising standards of living and individual self esteem
Expanding economic and social choice and reducing fear.”.
The UN has developed a widely accepted set of indices to measure development against a
mix of composite indicators:
UN's Human Development Index (HDI) measures a country's average achievements in three
basic dimensions of human development: life expectancy, educational attainment and adjusted
real income ($PPP per person). UN's Human Poverty Index (HPI) measure deprivation using %
of people expected to die before age 40, % of illiterate adults, % of people without access to
health services and safe water and the % of underweight children under five. Development
economics emerged as a branch of economics because economists after World War II become
concerned about the low standard of living in so many countries of Latin America, Africa, and
Asia. There are, however, important reservations in making development economics as branch of
economics as opposed to the ultimate objective of the study of economics. The first approaches
to development economics assumed that the economies of the less developed countries (LDCs)
- 86 -
were so different from the developed countries that basic economics could not explain the
behaviour of LDC economies. Such approaches produced some interesting and even elegant
economic models, but these models failed to explain the patterns of no growth, slow growth, or
growth and retrogression found in the LDCs.Slowly the field swung back towards more
acceptance that opportunity cost, supply and demand, and so on apply to the LDCs also. This
cleared the ground for better approaches. Traditional economics, however, still couldn't reconcile
the weak and failed growth patterns. What
was required to explain poor growth were macro and institutional factors beyond micro concepts
of the firm, individual preferences, and endowments? Institutional analysis has been able to
explain the poor growth patterns much better than the market failure theories did. However, there
is no generally accepted institutional theory of economic development that a large share of
development economists agrees upon. There is not even agreement on how important
institutional factors are.
1.2 Economic Development
Economic Development is a branch of economics that deals with the study of macroeconomic
causes of long term economic growth, and microeconomics; the incentive issues of individual
households and firms, especially in developing countries. This may involve using mathematical
methods from dynamical systems like differential equations and inter-temporal optimization, or
it may involve a mixture of quantitative and qualitative methods. Development is a phenomenon
which occurs over a long period of time but economic growth is increase in GNP which can
occur when we are able to achieve increase in number of resources or increase in technology or
by the combination of both. Freidman defines growth as an expansion of the system in one or
more dimensions without a change in its structure and development as an innovative process
leading to the structural transformation of social systems for the development for the society.
Thus Economic growth is related to a quantitative sustained increase in the country’s per capita
output or income accompanied by expansion in its labour force, consumption capital and volume
of trade. On the other hand economic wants goods incentives and institutions.

- 87 -
2. Measurement Of Economic Development
2.1 Gross Domestic Product (GDP)
GDP includes all the various form of spending on domestically produced goods & services. To
understand how the economy is using its scares resources, economist studied the composition of
GDP.GDP divided into four components.
Notation for GDP=Y
Y= C+I+G+NX
C= Consumption
I=Investment
G=Government Purchases
NX=Net Exports
2.2 Gross National Product (GNP)
GNP is the total income earned by nations permanent residents(called Nationals).It is different
from GDP by including income that are citizens earned abroad & excluding income that
foreigners earned here.
2.3 Human Development Index (HDI)
Apart from measuring income with the help of per capita GNP we have one more method to
calculate Economic development, it is HDI. HDI does not replace GNP but adds considerably to
an understanding of the real position of as society in much respect as would be clear from the
following discussion
• HDI measures education and health and is thus multi dimensional rather than One
Dimensional

- 88 -
• It focuses the attention of the policy makers on the ultimate objective of development not
just the means
• It is more meaningful as a rational average than GNP
It shows that Human development gaps between nations are more manageable than the ever
widening disparities in income HDI is composite of 3 basic indicators of human development–
longevity, knowledge and standard of living. Longevity is measured by life expectancy at birth;
knowledge by a combination of adult literacy and combined primary and secondary and tertiary
enroll. Ratios and standard of living is measured by real GDP per capita.
2.4 Purchasing power parity (PPP)
In their simplest form, PPPs are price relatives, which show the ratio of the prices in national
currencies of the same good or service in different countries. Purchasing power parity (PPP) is an
economic technique used when attempting to determine the relative values of two currencies. It
is useful because often the amount of goods a currency can purchase within two nations varies
drastically; based on availability of goods, demand for the goods, and a number of other, difficult
to determine factors. PPP solves this problem by taking some international measure and
determining the cost for that measure in each of the two currencies, then comparing that amount.
Purchasing power parity is, of course, an imperfect device for determining things such as GDP,
as the exchange rate will vary based on the basket item used for the index. This effect is lessened
by looking at a large sample of commodities, rather than one or two, but this simply minimizes
the problem rather than eliminating it entirely. It is also worth noting that PPP lumps items
together into broad classes, not taking into account things such as quality — a hat is a hat is a
hat, and its value in the index remains static, even though a shoddy hat's value on the
international market would be much lower than a well-made hat's value.
- 89 -
3. Define Developing & Developing Country
Developing country is a term generally used to describe a nation with a low level of material
well-being. Since no single definition of the term developed country is recognized
internationally, the levels of development may vary widely within so-called developing
countries. Some developing countries have high average standards of living.
Top references for developing countries:
• India
• China
• Brazil
• Bangladesh
• Nigeria
• South Africa
• Philippines
• Indonesia
The term developed country is used to describe countries that have a high level of development
according to some criteria.
Top references for developed countries:
• Japan
• Australia
• Canada
• Germany
• France
• Sweden
• Italy
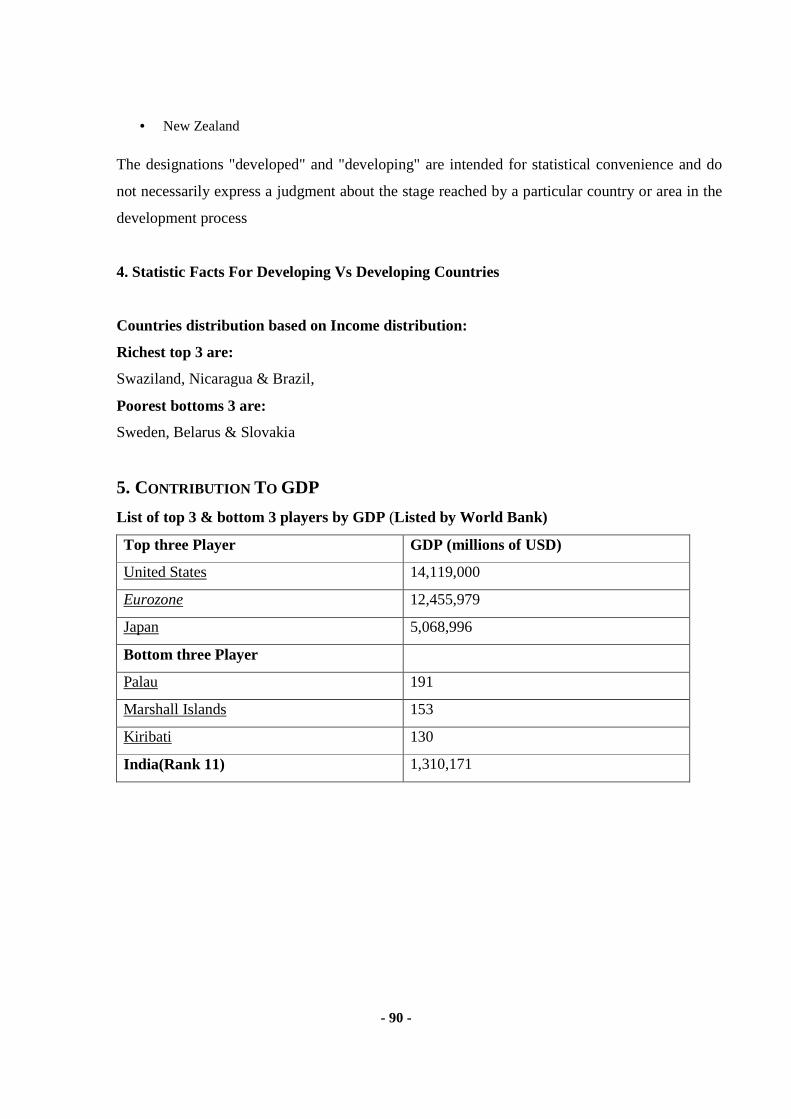
- 90 -
• New Zealand
The designations "developed" and "developing" are intended for statistical convenience and do
not necessarily express a judgment about the stage reached by a particular country or area in the
development process
4. Statistic Facts For Developing Vs Developing Countries
Countries distribution based on Income distribution:
Richest top 3 are:
Swaziland, Nicaragua & Brazil,
Poorest bottoms 3 are:
Sweden, Belarus & Slovakia
5. CONTRIBUTION TO GDP
List of top 3 & bottom 3 players by GDP (Listed by World Bank)
Top three Player GDP (millions of USD)
United States 14,119,000
Eurozone 12,455,979
Japan 5,068,996
Bottom three Player
Palau 191
Marshall Islands 153
Kiribati 130
India(Rank 11) 1,310,171

- 91 -
List of top 3 & bottom 3 players by GNP
Top three Player GNP ( $ per person)
Luxembourg: 37,499.20
Switzerland: 36,987.60
Japan: 35,474.10
Bottom three Player
Somalia: 0
Iraq: 0
Libya: 0
India(Rank 128) 441.56
6. Socio-Cultural ASPECT FOR Developing VS Developed COUNTRIES
6.1 BIRTH RATES
Developing countries have high birth rates because
• Many parents will have a lot of children in the expectation that some will die because of
the high infant mortality rate
• Large families can help in looking after the farm
• The children will be able to look after their parents if they become old or sick; there may
not be a old age pension scheme
• There may be a shortage of family planning facilities and advice
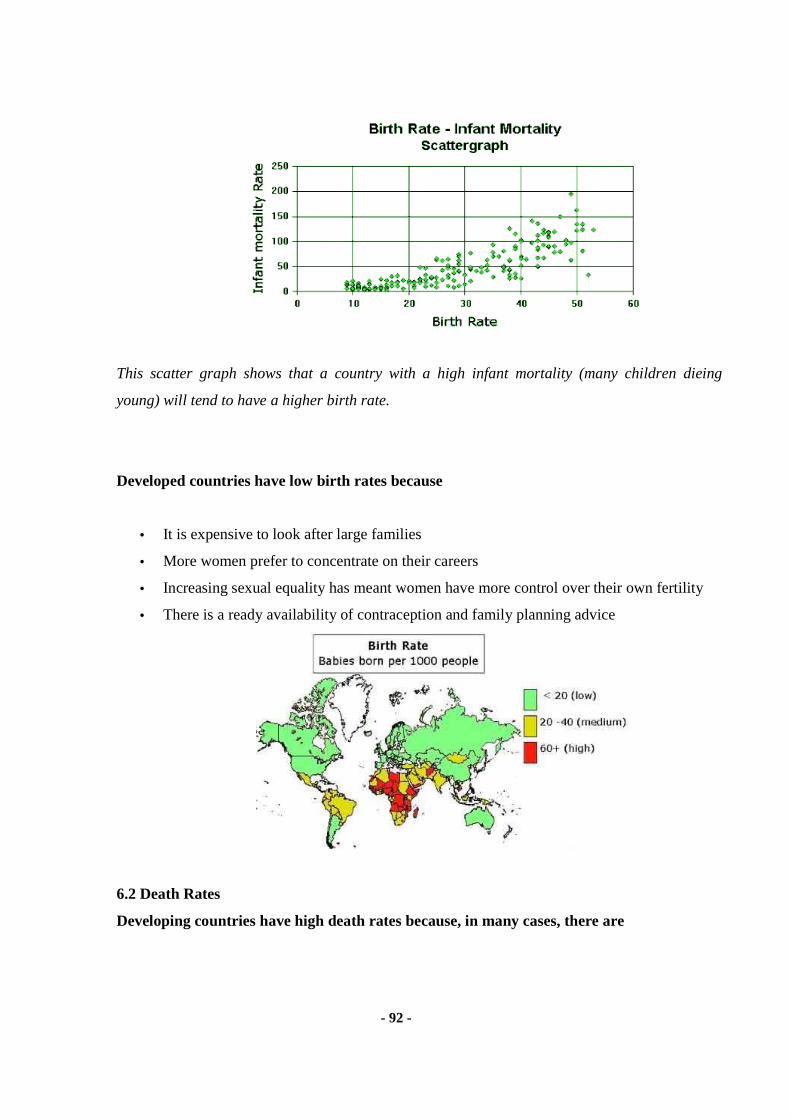
- 92 -
This scatter graph shows that a country with a high infant mortality (many children dieing
young) will tend to have a higher birth rate.
Developed countries have low birth rates because
• It is expensive to look after large families
• More women prefer to concentrate on their careers
• Increasing sexual equality has meant women have more control over their own fertility
• There is a ready availability of contraception and family planning advice
6.2 Death Rates
Developing countries have high death rates because, in many cases, there are
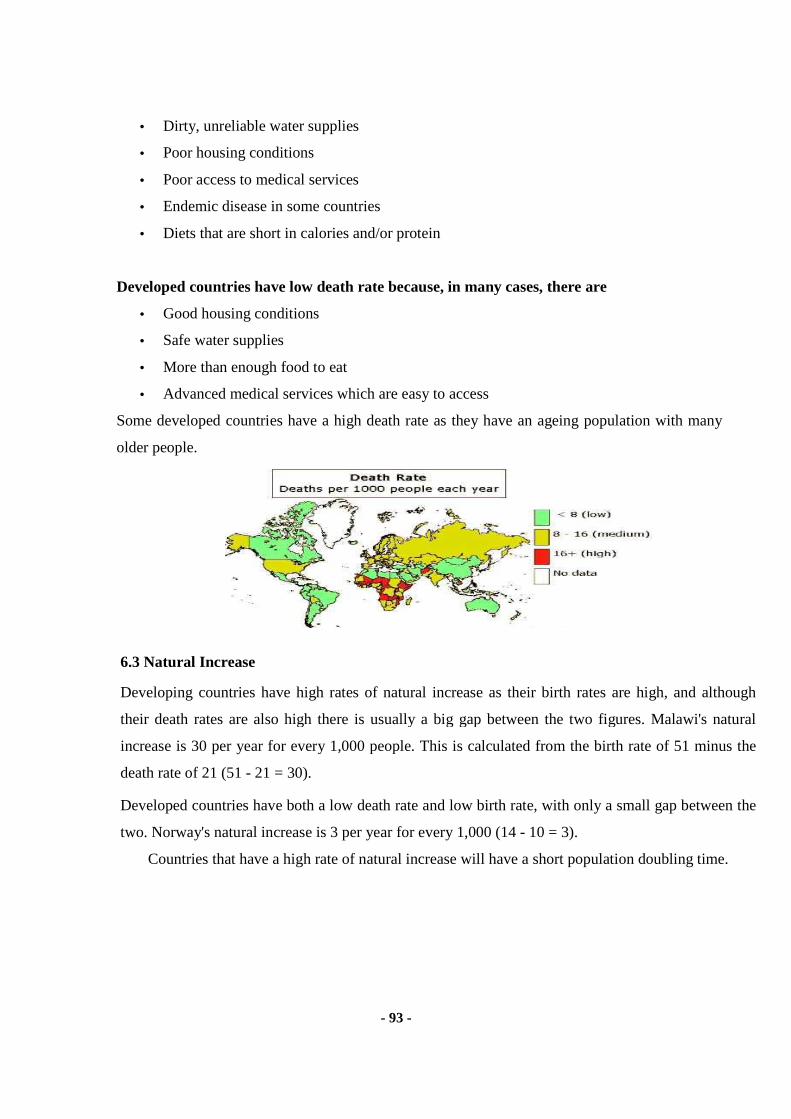
- 93 -
• Dirty, unreliable water supplies
• Poor housing conditions
• Poor access to medical services
• Endemic disease in some countries
• Diets that are short in calories and/or protein
Developed countries have low death rate because, in many cases, there are
• Good housing conditions
• Safe water supplies
• More than enough food to eat
• Advanced medical services which are easy to access
Some developed countries have a high death rate as they have an ageing population with many
older people.
6.3 Natural Increase
Developing countries have high rates of natural increase as their birth rates are high, and although
their death rates are also high there is usually a big gap between the two figures. Malawi's natural
increase is 30 per year for every 1,000 people. This is calculated from the birth rate of 51 minus the
death rate of 21 (51 - 21 = 30).
Developed countries have both a low death rate and low birth rate, with only a small gap between the
two. Norway's natural increase is 3 per year for every 1,000 (14 - 10 = 3).
Countries that have a high rate of natural increase will have a short population doubling time.

- 94 -
6.4 Infant Mortality
The infant mortality rates are higher in developing countries. The reasons for these higher rates are
that developing countries often have
• A shortage of medical services
• A greater number of children born to mothers
• Poor nutrition of mothers and babies
• Less knowledge of health matters
• Dirty water supplies
The chances of surviving to your fifth birthday depend on where you are born in the world

- 95 -
6.5. Per capita Income
7. Education Sector Analysis
The following change factors described have fuelled the current interest in the quality of higher
educational institutions in developed as well as developing countries:
• The rapid expansion of student numbers in the face of public expenditure worries;
• The general mission for better public and private services of education;
• Increasing competition within the educational ‘market’ for resources and students;
• Tension between efficiency and quality
They have been one of the motivators for implementation of new way of educational delivery
also in developing & developed countries.
Socio-cultural barriers to student enrolment in education in developing countries include poverty,
direct cost of schooling, gender socialization, level of parental education and cultural and
traditional practices, such as early marriage, customary fostering, puberty rites Students enrolled
in school are more likely to be withdrawn from school to help in household chores and family
business. Gender biased educated of the people in less developed countries.
Achieving equal access to education for boys and girls faces several challenges in developing
countries including:
- 96 -
• Implementing strategies for gender equality in education that take into account the need
for changes in attitudes, values and cultural practices.
• Expanding and strengthening incentive and scholarship schemes for girls improving the
quality and relevance of basic education.
• Increasing the transition rate for girls to senior secondary schools.
• Sensitizing parents and communities about the importance of girl's education.
The provision of incentives to encourage female enrolments has greatly enhanced and reduced
the gender disparities existing. Donor assistance must also focus on funding initiatives aimed at
improving access to and delivery of Technical / Vocational Institutions that seek to improve the
relevance of education to employment opportunities.
Example from developing country: India
Indian GDP –Trend Of Growth Rate 1960-1980 : 3.5% 1980-1990 : 5.4% 1990-2000 : 4.4% 2000-2009 : 6.4%
The contributions of various sectors in the Indian GDP for 2007-2008 are as follows: Agriculture: - 17% Industry: - 29% Service Sector: - 54%
Indian education sector has gained significant attention from policymakers, investors, and media
in the few last year. The year 2010 will continue to be an important year with increasing demand
for education and corresponding new ways of meeting those demands. The top five trends expect
are:
• Internationalization would become more glamorous:
Internationalization as a strategy for building reputation will gain more prominence. This may
range from establishing international collaborations for student/faculty exchange programs to
joint research projects and offshore campuses.
• Policy landscape will become tougher, wider spectrum of institutional quality:
Quality of Indian higher education system has lagged behind the growth in quantity. Given the
unfortunate state of regulatory mechanism in India, there are several changes expected in the

- 97 -
direction of transparency and stricter norms. Several institutions need to shape up to fulfil the
norms.
• Growth of multicampus model, not-for-profit will no t be welcomed:
Competition and opportunity would compel institutions with resources to gain scale, move
beyond their traditional markets and innovate the educational offerings
• Technology adoption will increase:
With the growth in scale of the institutions and multicampus models, there will be increasing
need for streamlining and controlling processes. Technology solutions in the form of campus
management software packages will gain ground. Even course management tools will become
prominent among faculty for efficiently organizing their classes.
• Demand of professional talent in education sector will increase:
Indian education sector is growing at a fast pace but the professionals including faculty and
administrators are lagging behind both in quantity or quality. This will pose even more
threatening scarcity about the availability of faculty.
Example from developed country: Australia
Economic contribution
2007-08 $M
Expenditure 6,435.9 Labour 4,597.3 GOS 482.8 Value-added 5,080.1
The contributions of various sectors in the Australian GDP for 2007-2008 are as follows:
Agriculture: 4.1% industry: 26% services: 70% (2009 est.)
Note: This entry gives the percentage contribution of agriculture, industry, and services to total
GDP. The distribution will total less than 100 percent if the data are incomplete.
In 2005, the higher education sector comprised the following:
• 37 public universities;
• 2 private universities;
• 1 approved branch of an overseas university;

- 98 -
• 4 self-accrediting higher education providers; and
• Around 130 non self-accrediting higher education providers.
In 2005, there were 957,176 students attending Australian higher education providers.
Compare the trends of developing & developed countries education sector. Developing countries
have some drawbacks like gender biasness, quality & number of educational institutes, funding,
global facilities etc. From the facts & figures of the contribution to the GDP, we can say the
following:
• Developing countries are in growing stage
• New market for the developed countries to set-up their university
• Developed countries are in saturation in their own countries
• Scopes of growth are more in developing countries
8. Trend of Growth
Economic growth is the increase of per capita gross domestic product (GDP) or other measure of
aggregate income. It is often measured as the rate of change in real GDP. Economic growth
refers only to the quantity of goods and services produced. An industrial economy gets its
resource from other countries. There is no need to worry about farms because they get their
produce from other countries just like their natural resources. Economic growth can be either
positive or negative. Negative growth can be referred to by saying that the economy is shrinking.
Negative growth is associated with economic recession and economic depression. In order to
compare per capita income among countries, the statistics may be quoted in a single currency,
based on either prevailing exchange rates or purchasing power parity. To compensate for
changes in the value of money (inflation or deflation) the GDP or GNP is usually given in "real"
or inflation adjusted, terms rather than the actual money figure compiled in a given year, which
is called the nominal or current figure.

- 99 -
GDP Accumulated growth
From the above graph we can see the growth rate of developing countries with higher % in
compare of developed countries. Most promising developing country is china with highest % of
growth.
Developing countries are growing with faster pace than the developed countries. Growth
parameter need to be innovative for the developed countries to match with the developing
countries as many parameter of economical growth are all ready saturated in developed country.
9. Conclusion More than 150 countries in Asia, Africa, the Middle East, and Latin America are classified as
developing nations and others are developed. They are a diverse group in terms of culture,
religion, geography, economic progress and activities, and types of government. There is no
agreed upon way for geographers to designate “developed" as opposed to "developing"
countries. But most agree that a developing country is a country with a relatively low standard of
living, undeveloped industries, and low Human Development Index. There are other factors
need to be taken care by developing countries to immerging as a developed country in the future
like: control on overpopulation, infrastructural development, political stability, access and
quality of health care etc.
Even the growth rates of Developing countries are high then also lots of effort required to be
developed. Developed country need to be innovative to expand their economical growth. They
can target the developing nation as a market. In education sector, developing country need to be

- 100 -
improve on quality & need to be open-up for foreign players. Developed countries are must look
positive to enter the developing counties and utilize the opportunity to grow. Developing
countries need to overcome from the social barriers like: illiteracy, gender biasness etc.
Economical structure will be more dynamic in the future for both the developing & developed
countries.
References
• Access Economics Pty Limited for Australian Council for Private Education and Training,The
Australian education sector and the economic contribution of international students,April 2009
• Dr. Rahul Choudaha ,Trends for Indian education sector in 2010, January 14, 2010
• Education Sector Strategic Plan (ESSP)Ghana, 2007
• Mirna, CORIC & Karmela, ALEKSIC-MASLAC form Zagreb School of Economics and
Management,Zagreb, Croatia,Research paper E-learning potential in education sector of
developing countries:relationship marketing tool and cost cutting tool in times of financial
downturn
• N.Gregory Mankiw, Principles of Macroecononics,5th edition, page 208 & 209
• http://www.acuma.org.au/resource_library/vsu/vsu_impact_study/section03/index.htm
• http://www.economics4development.com/
• http://www.indexmundi.com/australia/gdp_composition_by_sector.html
• http://www.nationmaster.com/graph/eco_inc_dis_ric_10-economy-income-distribution-richest-
10
• http://www.scalloway.org.uk/popu6.htm
• http://www.tradechakra.com/indian-economy/gdp.html

- 101 -
• http://en.wikipedia.org/wiki/Developing_country
• http://en.wikipedia.org/wiki/File:WeltBIPWorldgroupOECDengl.PNG
• http://en.wikipedia.org/wiki/List_of_countries_by_GDP_(nominal)
• http://www.wisegeek.com/what-is-purchasing-power-parity.htm
• http://www.economics4development.com/
- 102 -
Economic Reform, Extortion and the Informal Sector
Biswajit Mandal
Visva-Bharati University, Santiniketan, India
and
Sugata Marjit
Centre for Studies in Social Sciences, Calcutta, India
and
The Leverhulme Centre for Research on Globalisation and Economic Policy
University of Nottingham, UK
Abstract
Informal economy involving unrecorded, unregistered, extra legal activities employs majority of
the workforce in the developing world. Such extra legal existence of informal manufacturing and
service sectors is facilitated through extortion by agents of political forces in power. Such
extortion activities themselves constitute an informal segment. We develop a general equilibrium
model to explore the possible consequences of a change in the fee of extortion, change in the
quality of administration, tariff reform etc. Economic reform of various kinds has interesting
effects on the size of the extortion sector. Various reformatory policies may actually lead to an
expansion of the extortion component of the informal sector.
Key words: International Trade, Extortion, General Equilibrium.
- 103 -
1. Introduction
Informal sector is an important ingredient of the contemporary world economy particularly in the
developing regions as this segment occupies a formidable chunk of the unskilled labor force. The
informal sector covers primarily the non-agricultural employment of unskilled labor. It accounts for
50-80% employment in South Asia, 30-50% in South East Asia, 40-50% in Africa, 55% in Latin
America and Caribbean, 24% in Southern Europe, 10% in Western Europe, 18% in Canada and 8%
in USA. However, the main derogatory feature of informal sector is its extralegality or illegality by
law since it does not conform to government regulations. These units do not abide by labor
regulations of the government, and do not pay taxes. In fact a large part of it would have vanished if
they had to confront government regulations. The paucity of legal protection makes the informal
sector an easy pray for extortion and corruption. It has been reported in Ethiopia that the urban
informal sector of this rural country is comprised of almost one million people and is vastly distorted
with extortion. While Morocco experiences an annual loss of $ 3.6 billion because of lack of
transparency related extortion/corruption/bribe (Drakard, 2009). In order to reduce extortion in the
informal segment countries like Ghana, Senegal, Kenya etcetera have already attempted to facilitate
and promote registration and license to informal units. This has resulted in a significant reduction in
the degree of extortion (Fjeldstad, 2001). Existing literature on informal sector conventionally
defines informal activity as something which takes place underground, covers smuggling, mafia etc.
(Konrad and Skaperdas, 1998). Informal sector has not been considered as a segment which provides
livelihood to a sizeable amount of mass without doing any dangerously harmful illegal activity as
such. There are also a few papers (Johnson, Kaufmann and Zoido-Lobaton, 1998; Johnson,
Kaufmann and Shleifer, 1997; Gerxhani, 2004; Loayza, 1996; Shneider and Enste, 2000) where it
has been shown how the existence of bureaucratic control, corruption and higher tax rates in the
formal counterpart induces firm to operate in the informal sector. The interface of contract theory and
informal economy is analyzed in Quintin (2008). It has been shown there that the size of the
informal sector has an inverse relation with an increase in contract enforcement in the formal sector.
It is noteworthy to mention here is that by using a competitive framework Amaral and Quintin (2006)
has shown why the most talented managers operate with more physical capital and self-select
into the formal sector than managers in the informal units. This analysis emphasizes that most
skilled labor work in the formal sector as long as the enforcement gap between formal and
Economic Reform, Extortion and Informal Sector informal sectors is ample. In another interesting paper
Dijkstra (2006) shows how under different circumstances an economy may end up with good (no
informal sector), bad (no formal sector) and mixed (both formal and informal sectors) equilibria. But

- 104 -
none of these papers recognize the existence of corruption in the informal sector itself. Nonetheless,
Friedman, Johnson, Kaufman and Zoido-Lobaton (2000) have found the existence of corruption and
production both as separate activities within the informal sector. Their paper is a partial
equilibrium one where the existence of corruption in the informal sector is slightly touched upon.
In this model we intend to bring in both these two parts of informal fragments in a simple general
equilibrium framework.
To suit our purpose we shall define the informal sector as the one which does not have to pay the
minimum wage. Several papers have used this interpretation of the informal sector such as Agenor
and Montiel (1997), Carruth and Oswald (1981), Marjit (2003), Kar and Marjit (2001), Beladi and
Chao (1993), Beladi and Yabuuchi (2001), Chaudhuri (2003) etc. The survival of the informal
segment requires negotiation with administration as this part of the economy is illegal by structure.
Sometimes this negotiation is done by politically supported intermediaries, the “extortionists”.
These extortionists take care of legal troubles and other hurdles for the informal producers. They
keep the police at bay by paying bribes which in turn are extracted from the informal entrepreneurs,
labor, capitalists etc. There is a substantial literature on extortion and mafia related activities such as
Skaperdas (1992, 2001), Konard and Skaperdas (1998) etc. Our work is substantially different from
that literature.
First, we consider extortion as a facilitating device for organizing production in the informal sector. It
is not pure extortion involving all segments of the society. Second, more significantly, we consider
mobility of labor between extortion sector and informal production sector as well. Thus extortionists
also have the option to work in the informal sector. Such mobility is then embedded in a general
equilibrium structure where capital mobility also plays an important role. The story of the paper runs
as follows. Let us assume that there are three goods out of which two are produced in the formal
sector and the rest is produced in the so-called informal sector.
All goods are different and only formal goods are traded. Informal good is non-traded. One
commodity in the formal set up uses skilled worker as specific factor and the other uses unskilled
Economic Reform, Extortion and Informal Sector labor as the same, with capital moving between them.
Here formal workers are organized but not the informal workers which mean that the formal sector
has to pay minimum wage, but not the informal sector. Informal unskilled workers have to face a
competitive market. Therefore, unskilled wage in the formal and informal segments are not identical.
Whoever does not find a job in the formal sector will get one in the informal sector and wage there
can have a free fall. No one can afford to remain unemployed because they have to survive. Formal

- 105 -
workers are likely to get higher administered wage than their informal counterpart because of the
existence of trade unions.
In this context we need to mention that our work is related to the research area dealing with
economics of corruption. Marcoullier and Young (1995) has developed a two sector model on graft
and corruption demonstrating tacit political support for informal sector. But they do not model
extortion in a general equilibrium framework. Similarly Marjit, Ghosh and Biswas (2007) brings in
informal sector and corrupt bureaucrats but they do not constitute labor mobility between various
informal segments and does not consider a general equilibrium framework. The model we develop is
in the tradition of more recent work in trade theory on extensions of the basic Heckscher-Ohlin-
Samuelson (HOS) set up drawing from an early work of Gruen and Corden (1970) and from later
contributions of Jones and Marjit (1992, 2008), Marjit and Beladi (1999), Beladi and Marjit (1992)
etc.
It should be noted at the very outset that the extortionists in our model will be intermediaries
lubricating the activities of the informal sector and have the option of engaging in informal
production activities as well. Given this set up various reformatory policies may have
counterintuitive outcomes with unintended expansion of the informal segment. The basic results that
we derive in this paper are as follows: higher fee for extortion causes a squeeze in informal
productive activity but informal extortion sector must expand; better quality of administration might
bring about more informal production in the economy though corruptive activity shrinks; and under
reasonable condition a tariff reduction may amplify the informal output whereas under the same
condition informal workers would be worse off in money terms but not in real terms. Interestingly a
reform policy is more likely to increase the extortion activity in the economy.
Section 2 discusses the basic model and the equilibrium. Section 3 deals with the impact of a
change in the degree of extortion, change in the monitoring or auditing probability and tariff cut
Economic Reform, Extortion and Informal Sector on outputs, informal wage, informal good’s price and
the size of extortion sector. The last section concludes the paper. The relevant mathematical
derivations are provided in the Appendix.
2. The Basic Model and Solutions There are three goods X, Y and Z produced in the neo-classical framework using four factors such as
skilled labor (S), unskilled labor (L) and two types of capital (K and T). Capital is perfectly mobile
across X and Y but T is specific to Z. S is specific to X and gets Ws as wage. L is mobile between Y
and Z. Laborers are unionized in Y. They get as their wage. K gets identical return r across X
and Y while T gets R in Z. Who are not fortunate enough to work in Y, have to go out of the formal

- 106 -
segment. Because of their livelihood they need to find out alternative workplace. This is provided by
the production of Z. However, Z can not be produced by these two factors only. It requires the
service of another factor that actually negotiates between producers and administrators since Z is not
permitted to be produced legally. But if Z is never produced some labor must remain unemployed
and they will not survive. Therefore Z is a necessary for a perfectly competitive full employment
framework. Nonetheless, producers of Z need to comply with some institutional and political menace
as it is an extra-legal, if not illegal, activity. To combat such menace producers obtain service of
intermediaries who actually watch out for these institutional perils. Intermediaries are unproductive
in that no additional output is produced by them. Their marginal productivities in terms of the
volume of goods are zero though they get positive return for their work. However, without such an
arrangement production of Z could not have taken place. We call this sector Z as an informal sector.
Intermediation is done only by labor. People engaged in intermediation activities get pecuniary
benefit without producing goods. Let LN be the people and N be the sector representing
intermediation/ extortion. Important to note that the return to extortionists, WN must be greater than
competitive informal wage, W. The difference between PZ and sum of the returns to productive
factors in Z goes to extortionists as a payment for intermediation activities. N people also need to
take care of the police personnel who are supposed to go for evicting these informal production units
as these are illegal from government’s perspective. Let the probability of being caught in act is q and
under this condition intermediators need to pay b fraction of WN as bribe. After paying out for the
police the return to LN must be equal to W since labor is mobile between Z and N. Here it is worth
mentioning that LN people always receive WN as return it does not matter whether administration can
identify the informal units or not. Thus here both, a part of Economic Reform, Extortion and Informal
Sector administration and N people are involved in corrupt practices. N people pay bribe to police
not only for the informal production units but also for their own existence. If there are no informal
activities the return to N people goes down to zero. And on the other hand whether Z survives or not
that crucially depends on how many people are involved in extortion activities or how much is paid
for these extortionists. Say α is the fraction of output that is lost due to these political/ institutional
complications related intermediations. Precisely speaking α represents the fee of extortion. Here it is
advisable not to confuse between “fee” and “wage”: fee means the fraction or the value of per unit of
output that is lost due to extortion whereas extortionist’s wage is the return to a single extortionist for
his service. Thus we can coin this sort of intermediations as directly unproductive profit-seeking
activities (Bhagwati, 1982). This is the concept of corruption and/or related extortion that we are
going to use in our model.

- 107 -
We have a small open economy with competitive markets for production as well as for extortions
related intermediation or corruption. Competitive corruption market implies that the lost output
due to intermediation is fully exhausted in paying out extortionists out of which a part (may be
fixed or variable) goes to police. Moreover, we have the standard neo-classical assumptions of
constant returns to scale and diminishing return to factors. The following set of equations
describes the model and the interpretations of symbols are usual and well used in trade models
(Jones, 1965, 1971). Let the prices of X and Y be normalized to unity. Y is the importable
commodity and subject to a tariff t.
The competitive price conditions are given by:
Note that, α ∈[0,1]; a low α will mean lower fee of extortion and conversely. Note that, the
production function for Z is represented by
The expected wage for intermediators satisfies the following equation
Note that, this equality is established because of labor mobility between informal production
and extortion segments. This has to hold true. If the LHS (RHS) of equation-5 becomes greater
Economic Reform, Extortion and Informal Sector than RHS (LHS) everyone would try to be involved in
extortion (production) related activities and would result in non-feasibility of both the informal
segments. The reason is the complementarity between extortionists and productive workers in the
informal sector. And equation-5 further makes informal workers, essentially, indifferent between
extortion and production. Therefore,

- 108 -
determined.
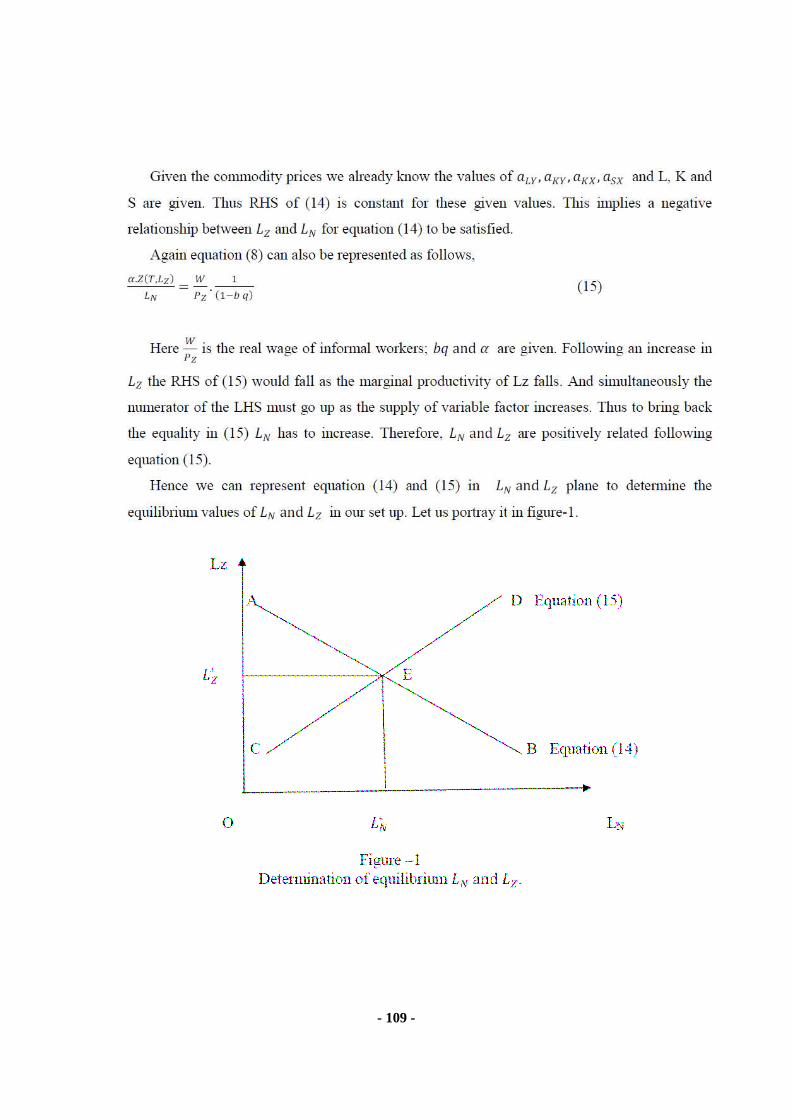
- 109 -

- 110 -
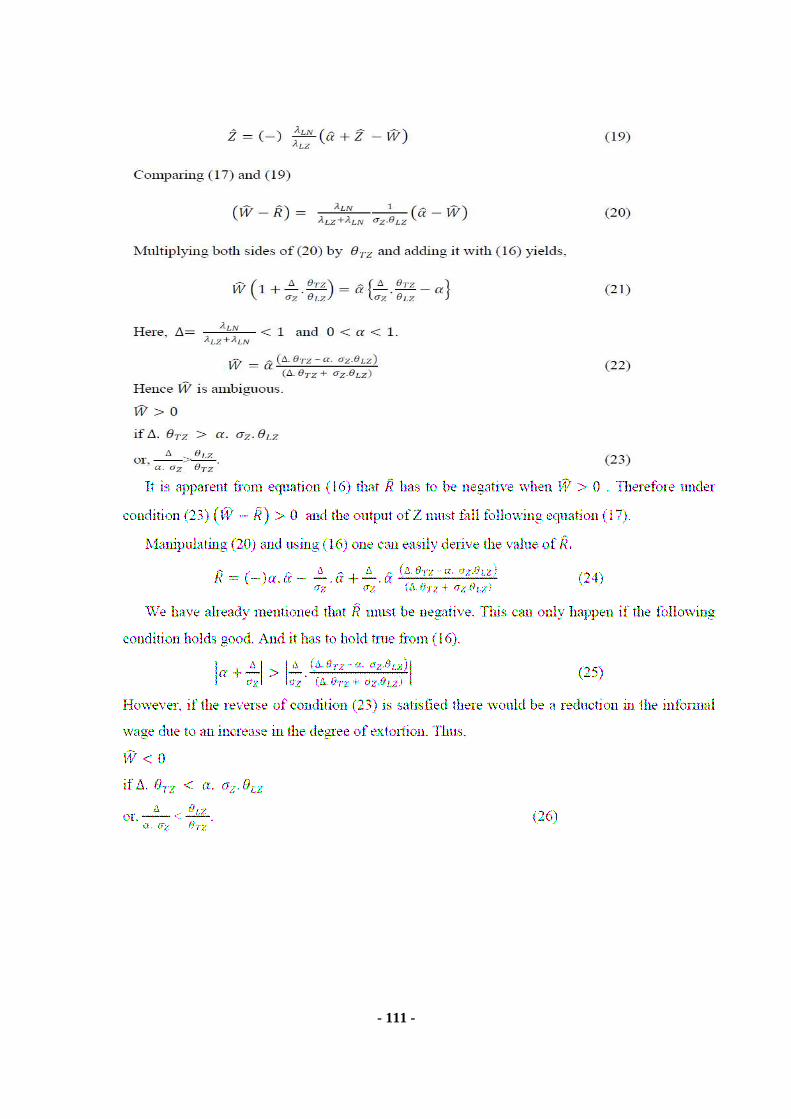
- 111 -
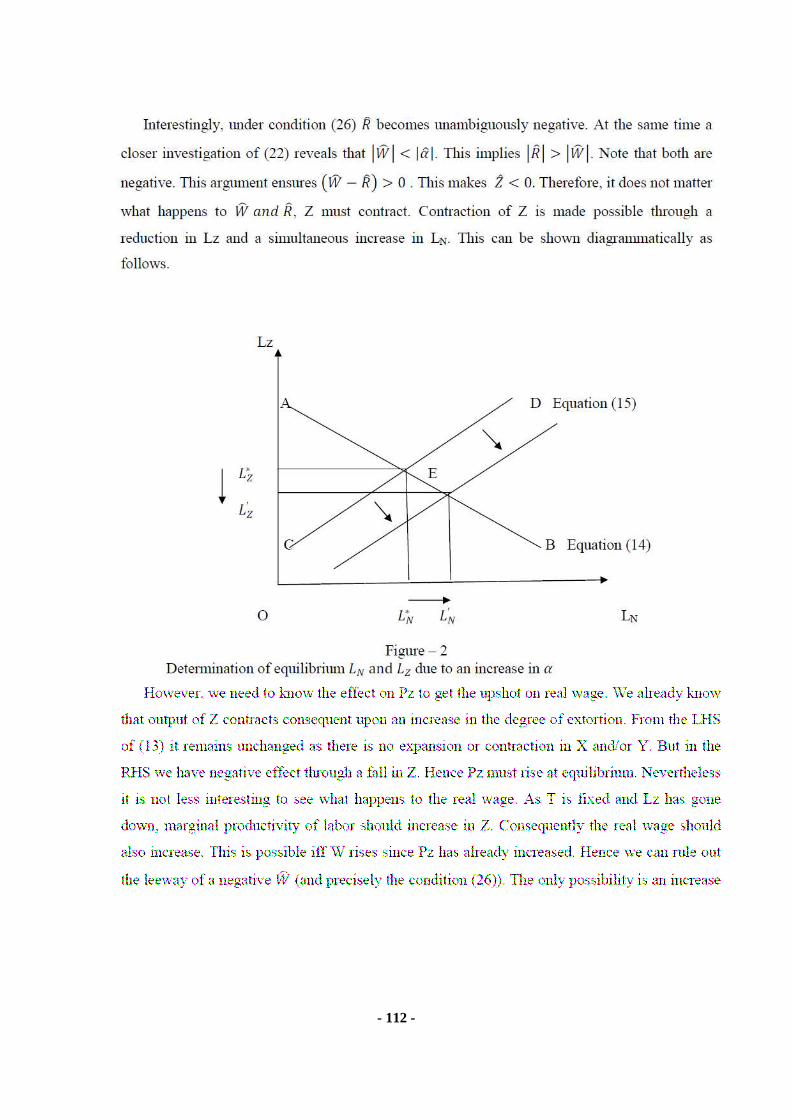
- 112 -

- 113 -
- 114 -
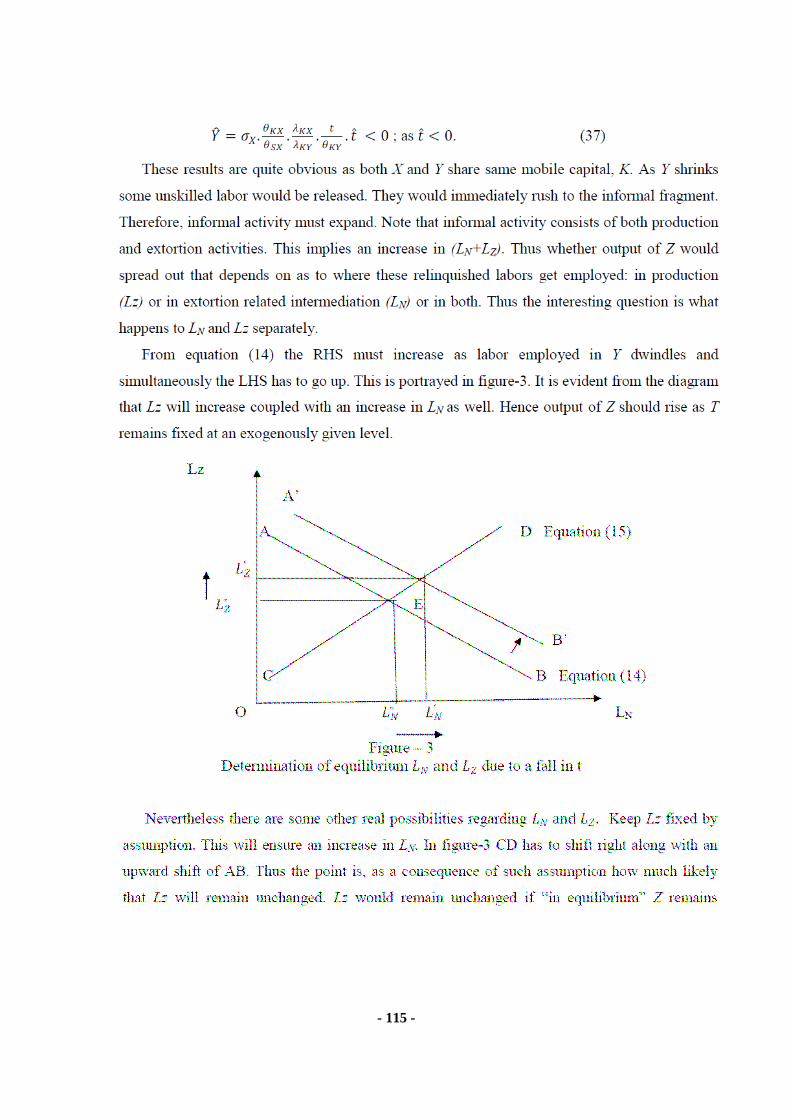
- 115 -

- 116 -
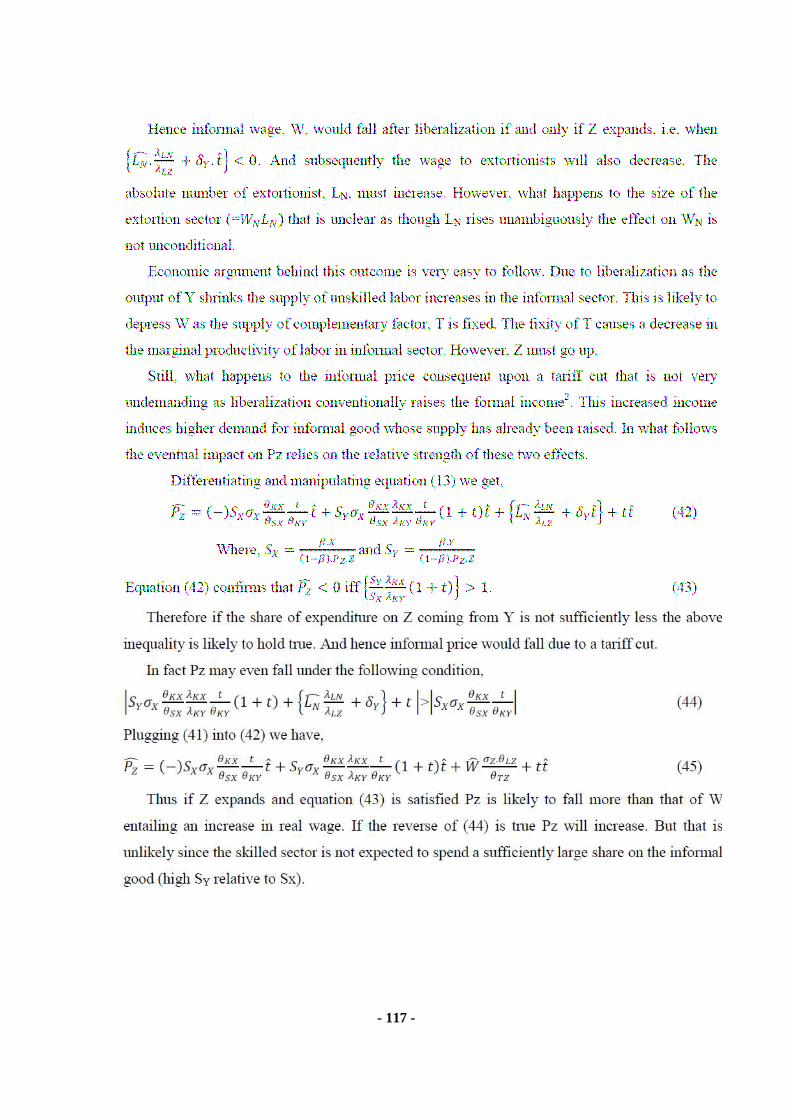
- 117 -
- 118 -

- 119 -

- 120 -
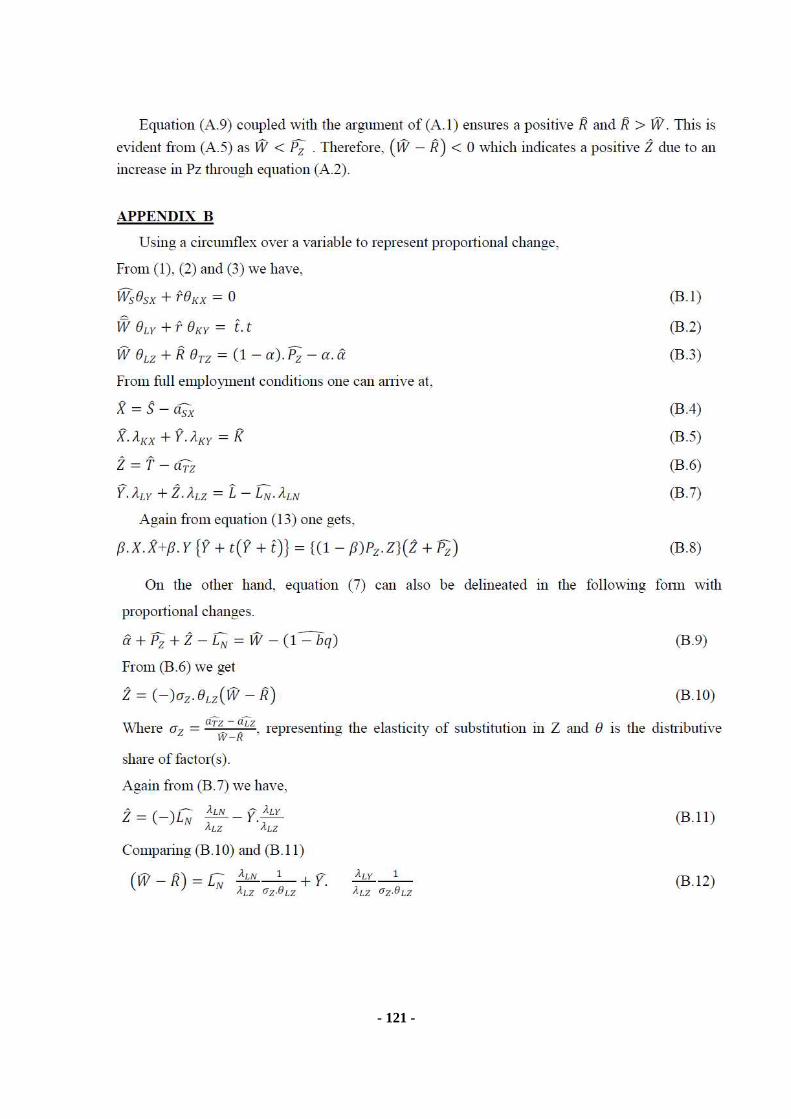
- 121 -

- 122 -
- 123 -

- 124 -

- 125 -
School Educational Statistics in India:
Changing Status and Persisting Problems
Anugula N. Reddy Department of EMIS, NUEPA
e-mail: [email protected], [email protected]
The status of school education statistics has changed from that of inadequate availability of data
to that of, as one observer has succinctly put it, the jungle of statistics. The data on school
education particularly relating to elementary education has witnessed enormous growth and
increasing diversification of sources during the last couple of decades. The moot question is
whether the reliability, validity of school education statistics is improved and the time lag is
reduced. Can we now say with confidence how many children are enrolled, how many dropout,
how many are out-of-school, how many children attend school regularly, etc. Has the time lag
identified as a perennial problem inflicting Indian statistics on education reduced with increasing
use of modern technologies? This short paper briefly describes the changing status and attempts
to flag the emerging issues that require greater debate.
Changing Status of School Educational Statistics
The data on education can be collected from schools and government bodies on the one hand and
households on the other. Though the data on some variables like enrolment, dropout and to some
extent fees paid are collected from both sources but a large part of data is supplementary in
nature. The overlap with respect to enrolment and other variables do not mean duplication. It
helps in validating the official data and in identifying the areas of concern in reliability and
validity of data. Much of the data from schools and government bodies on education are
collected and collated by Ministry of Human Resource Development (MHRD) and its affiliate
autonomous institutions such as National Council of Educational Research and Training
(NCERT), National University Educational Planning and Administration (NUEPA) and
Ministries of Education in State Governments. The data on education from households are
generally collected by National Sample Survey Organization (NSSO). Census and NFHS also
provides data on school education from households. Recently a few other organizations have also
beginning to collect data on education from households.

- 126 -
Data from Schools and Government Bodies
Numerical Data
MHRD
School educational statistics are collected and collated primarily by MHRD and disseminated in
its various publications. These publications include Education in India (EI), Vol. I and II. The
first volume gives numerical data like schools, enrolment, repeaters, teachers, trained teachers by
type of institutions and levels of education. The second volume gives financial data that are
discussed in subsequent section. The two volumes of EI were further divided into two parts: first
two sets Vol. I(S) and II(S) gives data for school education and the second set called Vol. I(C)
and Vol. II(C) gives data on college and higher education. The MHRD also publishes Education
in India Vol. III giving public examination results and Vol. IV giving details about enrolment of
SC and ST children. Though these documents indeed give very detailed information but
inordinate time lag in publishing makes them less useful. Further the latest publications are
bereft of many details with several cells left empty giving only aggregate figures. The time lag in
the publication of Education in India, Vol. III and IV is much large and hardly any one notices
the publication of this document. Even fewer use it for research and planning purposes. Besides
these, the MHRD also publishes Examination Results at High and Higher Secondary Levels (the
latest one is published in 2003 but data refers to 1999/2000). The MHRD publishes few others
like Education in States/UTs, A Handbook of Education and Allied Statistics that are largely
reproduction of data from the previous sources mentioned. Another publication Selected
Information on School Education gives data on structure of education, working days, number of
holidays, etc.
Selected Educational Statistics (SES) is another important and widely used publication of
MHRD. It gives data on institutions, enrolment by class, stage, institutions, SC/ST, and gender,
teachers, by training, female teachers, Gross enrolment ratio, etc. Information on additional
variables like institutions by management, rural areas, etc was added in a couple years. The data
provided in this publication are provisional in nature. But huge time lag in publishing other
documents makes it the only official source of data that is widely used by researchers, policy
makers and administrative personnel, etc. even worse the data are used as if it is final even
- 127 -
though it is provisional and for many states it is simply repetition or an increase over the
previous year figures.
NCERT
Other sources of data from school include All India Educational Survey (AIES) and District
Information System in Education (DISE). The AIES is conducted periodically by NCERT. The
periodicity between various surveys has changed. The reference date for the collection of data is
30th September from 5th survey onwards. The data are collected using two forms one for schools
and the other for village. The purpose of the surveys is provide detailed information base on
schooling facilities in the country at the time of conceiving five year plans. But non-
synchronization of plan period and non-availability survey results at the planning stage made it
nearly impossible to use survey data in the formulation of five year plans. The AIES are
conducted with the cooperation of state departments of education. The NCERT generally
appoints field officers for the duration of survey normally from the officers of state education
department. From sixth survey onwards the NCERT collaborated with NIC to computerize,
aggregate and transmit data to higher levels. This, it is expected that reduces time lags and
retains unit level data for further analysis. The survey provides detailed information not only on
schools, enrolment by age, sex, caste, religion, etc. but also access to schooling by distance,
infra-structural facilities in schools, incentives, management of school, teacher’s qualifications,
etc. Though these are called surveys but they are essentially census of schools. The survey does
not collect data on financial aspects and on higher education. The survey also suffers from
inordinate delay in publishing the data even after collaboration with NIC. For example, the
publications containing the 7th survey data conducted in 2002-03 have just started trickling in.
One noteworthy feature of 7th survey is that the data on select variables at national and state are
made available on internet.
Though a large amount of data are collected in surveys but not optimally utilized. Part of the
reason lies the manual processing of data, inordinate delays in publishing of data, limited access
to unit level data even after collaboration with NIC, etc. Further given the fact that the survey
also canvasses village form, it is possible to examine the schooling in relation with several other
characteristics of villages available from other sources of data like census, etc. It may be
advisable to use village code in common with census. This helps in merging data from different
- 128 -
sources. It is understood that the preparation for 8th survey is on and use of online entry of data
are planned to be experimented.
DISE, NUEPA
The DISE of NUEPA is the latest to collect primary data on school education. The externally
funded, resource intensive and target oriented interventions in elementary education since 1990
and the need to monitor the progress has led to initiation of DISE. The DISE was started as a
monitoring tool as part of District Primary Education Programme (DPEP) initially to collect data
on primary education from DPEP districts. It was later extended to cover elementary education
in the whole of country. The DISE data are collected annually school as unit. DISE collects data
on several variables including those that are proposed to be monitored as part of DPEP and SSA.
A standard Data Capture Format (DCF) with built-in mechanism to add a couple of variables by
states at their discretion and need is used the collect data. The responsibility to collect data and
accuracy of data rests with state governments. The NUEPA only collates unit level data and
produces national and state level aggregate data. There is no permanent mechanism at state level
to take responsibility to canvass the DCF and transmit reliable data with the least time lag. The
State Project Offices have Educational Management Information System (EMIS) units that
coordinates entire work. The data flow would start school submitting filled DCF to CRC/BRCs
who are expected to check for errors and on satisfaction they will be submitted to Mandal/Block
level offices. The Mandal/Block level officers are expected satisfy themselves with accuracy of
data received and then return them to the District MIS in charges. In most states, data entry takes
place at district level and data in soft form shall be submitted to state level officers. The state
office collates data from all districts then in turn submits to NUEPA through MHRD/Ed. CIL.
The DISE collects data on a large number variables enrolment by sex, age, caste, religion, etc,
facilities in schools, teachers, training, incentives to students and teachers, development grants,
etc. It has developed software called DISE to manage the data. Though time lag in the collection
and dissemination was reduced but the quality of data questioned. The DISE introduced Post-
Enumeration Survey (PES) of 5% sample schools to ascertain validity of data. Unfortunately the
quality of several PES reports is deplorably low. A cursory glance at the PES reports (2005-06)
reveals that the enrolment figures, epicenter all controversies about data on school education are
given faithfully with notable exceptions. But surprisingly largest discrepancies reported with

- 129 -
respect to the data on infrastructure, and other variable like management. The DISE as a mode of
collection of data: data are collated and published by a professional body besides providing
technical and software support; data are supplied by state governments; end use of data is
essentially aimed at designing and monitoring central interventions as part of DPEP and SSA
(though several researchers are being liberally provided access to unit level data and many are
using it) presents an interesting case study in the methodology of official data collection and
collation.
From the above it is clear that there is no dearth of data on elementary education. The MHRD
and NCERT are providing data on a variety of aspects of school education like schools,
enrolment, infrastructural facilities, incentives, teachers, etc. However, quality of data continues
to be a grey area. Further despite increasing use of computers the time lag could not be reduced
much. The DISE, temporary arrangement made to collect data to monitor progress under DPEP
and SSA has grown into a full-fledged data collection and collation system. As DISE collects
data on annual basis, there was some duplication with the efforts of MHRD. A couple of states
have abandoned their regular system of data collection and are relying on DISE only. There was
a talk to replace the existing mainstream official system of data collection with the DISE. The
data provided by MHRD and NCERT supplements each other. A few variables like number of
schools, enrolment, teachers figure in more than one source of data. This provides the scope to
compare the data of different sources to examine the reliability, validity of data. Indeed large
variations particularly with reference to the number and/proportion of children enrolled have
been reported between various sources. The enrolment figures reported by MHRD are found to
be much higher than the figures given by other sources giving substance to perceptions like
inflating of enrolment in government schools for a variety of reasons that includes compulsion to
show progress. In order to ward off this criticism the government hired independent consultancy
firms to estimate the number of out-of-school children. A few NGOs have also joined the
bandwagon or collecting data on out-of-school children along learning levels. The inordinate
time lag in publishing data from nearly all sources of govt made it less useful for planning,
monitoring and even for research. Therefore it is generally felt that the mechanism for collection
of school education statistics needs to be revived to reduce time lag, to increase the reliability,
validity of data. Another important limitation of existing data is that it is not provided by
management. But given the fact that the data are collected school as unit and use of latest
- 130 -
technologies enables one to transmit unit level data upwards and makes aggregation in different
permutations and combinations easier it should be possible to aggregate data by management. At
this stage it may be pertinent the remind ourselves in order to fulfill the commitment to achieve
universalisation of elementary education several interventions backed by large public allocations
have been designed. From this it follows that the implementation of interventions and progress
made has to be monitored. The database on elementary education naturally received greatest
attention from researchers, critiques, policy makers, etc. As a result we are endowed with large
information on the problems with respect to database on elementary education. The problems
relating to database on secondary education remained unexplored. What kind data are available?
What data are necessary to plan universal secondary education? What are the strengths,
weaknesses and gaps of existing database on secondary education? It is difficult to give a
satisfactory answer to these questions though some general problems of database on school
education may also apply to secondary education as well. This is one important area that
requires the attention of scholars, critiques and policy makers.
Financial Statistics
The expenditure on education can be divided into public and private expenditure. The data on
expenditure provided by MHRD refers to public expenditure only. Though, fees and other
charges paid by students and philanthropic contributions to public institutions of education also
figure in some of the publications. It is not clear whether the fees and other charges paid and
philanthropic contributions made to private unaided recognized institutions is partially or
completely included in the aggregate financial data of MHRD. The data on private expenditure
on adults can be gleaned from other sources like CSO estimates of final consumption
expenditure and NSSO estimates of household expenditure.
Data on Public Expenditure
The Analysis of Budgeted Expenditure on Education (ABEE) and Education in India, Vol. II
published by MHRD are most important sources of data on public expenditure on education. The
later is renamed as Education in India, Vol. II(S) after separating the publications by school and
college (higher education) levels. The publication of Education in India, Vol. II(S) is being either

- 131 -
inordinately delayed or nearly suspended for the recent period. The latest year for which
Education in India, Vol. II(S) available is 1995-96. One can also compile data on public
expenditure on education from budget documents of states and centre though it is cumbersome.
In fact the Analysis of Budgeted Expenditure is compiled from budget documents of centre and
states. The MHRD has brought out a publication called Budgetary Resources for Education
1950-51 to 1992-93 culling data from various publications of MHRD that gives time series data
on budgetary allocations to education by levels of education under education department
between 1950s up to 1992-93.
The Education in India is being published since independence and provides data on important
variables on long term. Of course it has undergone several changes and one need to careful in
trying to construct time series data from this publication. This publication provides data on
expenditure on education by states, by nature of expenditure (recurring and non-recurring), by
levels (very elaborated), by functional classification of expenditure, etc. The data on income is
similarly provided by states, by levels, by nature of income (recurring and non-recurring), by
sources, etc. It provides data on fees and also philanthropic contributions to education by levels.
However data for the latest years is in highly aggregate form particularly with respect to
functional classification of expenditure and sources of income making it irrelevant to the
emerging debates such as levels of cost recovery, contribution of philanthropy, etc in education.
The aggregate data in this publication a priori should include the data on private recognised
schools. However it is not clear the extent of coverage and quality of data relating to expenditure
and income from private recognised schools. However due to its methodology i.e. manual
collection of data, aggregation of data at various stages i.e. mandals/blocks, districts, states and
then at national level not only the final publication is inordinately delayed but also several errors
intentionally or unintentionally crept in. The data from this publication are not comparable with
the data given in ABEE. But the income from public sources and expenditure data of ABEE are
technically comparable. The inordinate time lag, jettisoning of many details in latest publication
that otherwise used to be available makes it less useful. However, given the unit for the
collection of data i.e. school and current state of art of computer technology it is possible to (i) to
reduce the time lag and (ii) reduce the errors that may creep in at various stages of aggregation
(iii) transfer of unit wise data upwards that makes it easier to give access to researchers. This
shall help improve the quality and usage of data
- 132 -
The ABEE provides data on public expenditure on education by levels of education, by centre
and state, plan and non-plan, by revenue and capital accounts, etc. The central expenditure is also
given by education and by different departments other than education. The expenditure incurred
by states is given by education and other departments but the composition of other departments
is not available. The total expenditure is given by education and training (of course what
constitutes training is not very clear). The actual expenditure and revised and budget expenditure
of subsequent years are given in each year’s publication of ABEE. This publication is being
published regularly since 1990. The time lag in the availability of actual expenditure is about 4-5
years. Of course the availability of data on revised and budget expenditures for subsequent years
moderates it. Several useful indicators can be calculated using the data form this publication like
the proportion of revenue and capital expenditure, plan and non-plan expenditure, centre and
state shares, proportion of total budget allocated to education. The data from this is useful in
calculating the public expenditure on education as proportion GNP.
Though, ABEE provides quite useful data in great detail but also suffers from some deficiencies.
Some of these include the following.
♦ The budget expenditure incurred by departments other than education which constitutes about 20 per cent of total budget expenditure on education is not given by levels. This makes the estimation of actual expenditure on different levels of education imprecise. The SES for the years 2002-03 to 2004-05 apportion the other department expenditure according to the proportions of different levels of education within education department expenditure. Without denying the plausibility of this, it is important to realize that there is no a priori ground to apportion other department expenditure to various levels in the same proportion obtained for the education department expenditure. This is important because much of the expenditure of other departments like Ministry of Agriculture, Health, etc. is on specialized higher and professional education. In addition the contribution of different departments is available only for central government departments. The state departments other than education also contribute to half of other department’s expenditure but their composition is not available. As a result any crude estimation may likely to give distorted picture of intra-sectoral allocation. This is one important area that needs immediate attention from MHRD.
♦ Another important limitation of ABEE is intra-functional allocation of resources. The desegregation of data in ABEE does not follow any rational pattern but given according to administrative classification. The classification adopted by ABEE include assistance government schools, local body schools, non-government schools, text books, teacher training, scholarships, non-formal education and others. In this classification the first three refers to administrative classification of schools and the later refers functional
- 133 -
allocation of expenditure that cut across all three types of schools mentioned above. Therefore it is difficult to gauge the functional allocation of resources from ABEE. Besides, as the expenditure on incentives such as scholarships, etc. is borne by state social welfare departments. Thus the intra-functional allocation derived from ABEE may not be accurate.
♦ The ABEE also does not give the central expenditure by states. This makes it difficult to assess the central assistance extended to states and whether the central assistance is reducing or increasing the regional inequalities. However as mentioned below another publication of MHRD appears to be addressing this limitation but its publication is rather irregular.
The MHRD also publishes another publication called Annual Statistics of Education Sector. It
was published for a couple of years since 1997-98 but not continued thereafter. It appears that
the publication of this document is revived recently. This publication provides very limited
additional information that is not available in ABEE. One aspect on which there are no data in
ABEE but are available in Annual Statistics of Education Sector is the allocation of central
expenditure under various central and centrally sponsored schemes by states.
Another important publication that gives detailed information on plan expenditure is Analysis of
Annual Plan: Education Sector brought out by Education Division, Planning Commission. This
is a compilation of data within the planning commission. This publication provides data on plan
outlays, actual expenditures under various heads by states, by levels of education. It also gives
the progress in achieving physical targets in terms of enrolment, etc during the plan period.
However, the publication of this document was erratic and not being brought out for the last
couple of years.
One important limitation of data on public expenditure that cuts across all publications is non-
availability of data on income and expenditure separately for schools under different
management and private expenditure under different categories of schools. Though ABEE
provides allocation of resources by management, it confined to public expenditure on
government, local body and private aided schools. No data are available on fees and other
charges levied by schools of different management. The fee and other user charges levied by
private schools not only generate operating expenses or even profits but also act as exclusionary
device. In fact the data on private schools is limited to number of schools and to enrolment
(essentially from AIESs conducted in intervals) and data on no other aspect are available. This is
- 134 -
an important gap in the existing data base on education particularly in the context of changing
contours of debate on public financing of education.
From above it can concluded that though there exists several publications (most of them
published by MHRD) providing data on public expenditure on education but suffers from time
lag, incompleteness of information, duplicity, never ending deferment of publication of some
documents, etc. The Education in India, Vol. II(S) would have become an important source but
time lag and also incomplete information and high level of aggregation in the latest publication
(latest data are available for the year 1996-97!) makes it less useful. Other publications like
Annual Financial Statistics of Education Sector barely include any additional information that is
not available in standard publications. Perhaps an important step forward to address some of
these limitations is to revive the Education in India, Vol. II(S) with computerization of data at
block/district level. This publication can be supplemented with ABEE. All other publications can
be merged into either of them. Necessary care should be taken to ensure the data from private
recognised school are included in Education in India, Vol. II(S).
Data on Private Expenditure As every one knows any planning of education doomed to fail, if it does not take into account the
motives, considerations people who are end users of educational facilities. The desirability,
ability and willingness people to pay for education are entering into the debates on education in a
variety of ways. Data on private expenditure can only obtained from household surveys.
Data from households
NSSO
As mentioned earlier several agencies began to collect data as part their general socio-economic
surveys. The NSSO also took very active interest in education since 1990 and collected data
specifically on education. The 50th, 52nd, 55th, 61st and 64th round surveys provide educational
data. The available data ranges from current attendance status, current attendance by age, years
of schooling, attendance by working and not working, attendance management of institute,
literacy level, dropouts, never enrolled, reasons for dropout and never enrolled and private

- 135 -
expenditure on education by management of institution, by objects, by income groups, by levels
etc. Since NSSO collects data on socio-economic background of households, it is possible to
generate a variety of cross tabulations to identify the grey areas in the participation in education.
Published reports contain a few such cross-tabulations like current attendance rates, private
expenditure, by Monthly Per Captia Expenditure (MPCE) groups, by caste, by quintiles, etc.
The NSSO data can also be used to validate official data on enrolment rates, etc. The NSSO
provides data on such variables as private expenditure, user charged paid to school by
management that no other source could provide. NSSO data can also be used to examine the
debates on cost recovery and household contribution to education. Some of the limitations of
NSSO data include many a time detailed cross tabulations are not available in desired forms and
also not available by states.
NFHS
The Demographic and Health Surveys are being carried out across the world with several
common variables. In India it is called National Family and Health Survey. It provides data on
several aspects of education like participation, years of schooling completed, level of schooling
competed, year of discontinuation of studies, reasons for discontinuation, etc. The NFHS also
collects data on several household and individual variables like assets, health status, and
educational background of adult household members that can be usefully analysed to understand
the nature participation on education. NFHS data can also be used to triangulate participation
rates. Till now three surveys were conducted. The educational level of individual household
member, current and previous attendance status, reasons for not continuing/never enrolling, are
some of the variables of interest to school education. In conjecture with other data in the survey
it is possible to undertake interesting research. Since similar surveys are being carried in several
countries across the world, it is possible to undertake multi-country studies on school education
using this data. In fact some interesting research has emerged from the NFHS data.
NCAER
The increasing importance given to the concept of human development and elementary education
as an important component of it has prompted several organizations to collect data on elementary

- 136 -
education as part of human development surveys. The surveys being carried out by National
Council of Applied Economic Research (NCEAR) deserves to be mentioned. NCEAR has
conducted a couple of surveys since early 1990s and one more survey is going on. The data
generated from these surveys appears to have been made available to a few select researchers to
undertake further research.
PRATHAM
PRATHAM an NGO has started collecting data on out-of-school children and achievement
levels of children by administering tests district wise. A sample of 20 villages (increased to 30 in
the one completed recently) and 20 households (households were selected with out master list)
from each village were selected for the purposes of collection of data. The personnel of MHRD
are heavily involved in the first round of survey. On the basis this the proportion of out-of-school
children and learning levels of children in each district were estimated. The entry of NGOs into
data collection raises several questions. Can they collect data free from errors? What role the
NGOs and the data collected by NGOs would play in the wider debate on education.
Research Consultancy Firms
The government is increasingly resorting to contracting out the job data collection to research
consultancy firms. Some these include the study on out-of-school carried by SRI-IMRB. On the
basis of this study the government has announced that the number of out-of-school children
drastically reduced. A few more on dropouts, teacher and student absenteeism have also been
undertaken reports of which are awaited. It has not felt it necessary to involve various
autonomous professional institutions and universities to undertake this job. This practice also
raises several questions with regard to who should collect data, do the consultancy firms have the
capacity and will to carry out studies autonomously, how data are being used in the debates in
education, etc.

- 137 -
Others
The general perception that the number of out-of-school children is much higher than the figures
reported by official statistics and the response of state is less than adequate has prompted
concerned educationists and others to undertake what is now famously called PROBE survey on
elementary education. It has generated much discussion and the data collected as part of survey
was utilized by researchers to produce a couple of research papers. UNICEF and UNSECO
sponsored studies also collected large amount of data on education.
Persisting Gaps and Problems
Despite collection of large amount data by autonomous professional organizations, NGOs,
private research consultancy firms, mega research projects, several gaps continue to persist.
Some of these include
♦ The data on private sector particularly on unaided recognized and unrecognized sector
continues to be sketchy. Though much more information available on the number of
institutions, enrolment in unaided recognized private schools from AIES and DISE. The
data on the proportion children who receive incentives, proportion of SC and ST children
who attend private schools are also available from AIES and also from mega surveys.
The 7th AIES also provides number of unrecognized schools by states and the DISE
provides a little more detailed information on private unrecognized schools at elementary
level in a couple states. But coverage remains limited. Further these figures are
aggregates over the entire private sector. In the context of increasing differentiation
within the private sector perhaps the aggregate figures may give distorted picture of
private sector. There is a need to not only cover the private recognized and unrecognized
sector but fine tune the information to reflect the changing context.
♦ No institutional financial data are available on private sector. Whatever little financial
data are available on private sector essentially reported by households. This aspect also
requires greater attention.
♦ Data on age composition of enrolment by class wise is critical in assessing progress
towards universal elementary education but consistently neglected. Part of the problem
- 138 -
may be the age of pupils reported in schools may be highly unreliable. But nevertheless
availability of some data on age composition of enrolment gives some idea about the
status universal elementary education may also give some indications as to the future
requirements. The DISE of course fill up this to some extent. The age reported in DISE
is what teacher entered as the age of children most often a guess estimate than found from
parents. Perhaps NSSO can also shed some light on this by giving appropriate cross table.
Emerging Issues
Several critical issues emerge from the developments taking place since 1990 in the collection
and dissemination of school education data. Some of these are
♦ The status of school education statistics has changed from that of inadequate availability
of data to that of, as one observer has succinctly put it, the jungle of statistics. The data
on school education particularly relating to elementary education has witnessed enormous
growth and increasing diversification of sources during the last couple of decades.
♦ School education statistics are being collected by multiple agencies. Conventionally
MHRD and state departments of education used to provide data on a few core indicators
like schools, enrolment, teachers, public expenditure, examination results, etc. The
autonomous professional organizations such as NCERT, NUEPA, and others used to
supplement this data with detailed information not only on core variables but also on
access, infrastructural facilities in schools, incentives, etc. on recurrent basis in different
intervals to provide inputs into policy making. This served two purposes. It provided the
detailed data in regular intervals necessary for planning. Secondly it helped to examine
the validity of the data provided by MHRD. In the recent past a number of changes have
taken place. A few autonomous professional organizations beginning to collect data on
regular basis not only on such core variables like enrolment, gender, caste, teachers, etc.
but also on infrastructural facilities, etc. Other agencies have also entered into the
business of collection of routine data such as enrolment, attendance levels, achievement
levels, dropouts, teacher absence, etc. on a large scale. These include NGOs, private
consultancy firms and research organizations. In a few of these the officials from MHRD
and its consultants are heavily involved in the design and implementation of study.

- 139 -
♦ What kinds of changes are being fuelled by these developments? Do the gaps and
deficiencies in the excising database are addressed by these changes? How does data on
school education compare by different sources. Are the data reported in official and semi-
official sources reconcilable with the data generated from household surveys? What are
the methodological and practical issues that need to be taken into in triangulating data
from different sources particularly from schools and households?
♦ The practice of collecting and disseminating official statistics on school education
appears to be changing. The state is increasingly delegating the business of collection of
data to professional organizations and even hiring private consultancy firms. Though it
may be argued that some of these are in project mode and/or simply a one-time step to fill
the gaps in existing data sets but the trend is unmistakable. The state has hired in services
of consultancy firms to ascertain the number and proportion of out-of-school children,
dropout rates, teacher and pupil absence. The state has overlooked the technical expertise
of its affiliate institutions in carrying out the same task
♦ An obvious question that emerges in the context of diversification of sources of data is
who should be primarily responsible of collecting and disseminating the official statistics.
Can this function be delegated to autonomous professional institutions? What role the
state should play in collection and dissemination of official statistics? What role is
expected from autonomous professional organizations in the production and
dissemination of official data? Can one expect the consultancy firms to provide data free
from biases?
♦ It is widely recognized that the collection of official statistics must continue to be the
responsibility of government. The autonomous institutions can supplement to fill the
gaps, provide technical support, and re-organize the data and produce temporal and
spatial comparable data sets from the existing official data. But the collection and
dissemination of core data must remain the responsibility of the government.
♦ There is considerable duplicity in the efforts made by different organizations to collect
school level data. For example, MHRD and DISE provide data on annual basis on several
common variables, though DISE provides data on several variables that are not normally
collected by MHRD. Though there is a need to reduce duplicity but it should not lead to
- 140 -
only one source of data. The multiple sources of data help in validating data. What is
needed is to forge co-ordination among these agencies to avoid wasteful duplication.
♦ It is important to analyze the nature of inconsistencies between different data sets. Do
differing reference dates, methodologies and definition account for these discrepancies.
These are not merely numbers to be reported. They may be symptoms of much deeper
malaise in the system
♦ Another issue that emerges in the context of increasing diversification of data collection
agencies is burdening the school teachers who are ultimately responsible for providing
data. Further the DCFs also found to be unwieldy in most cases. Many a time it is found
that data on variables that are unlikely to change on year to year basis are also collected
annually. Perhaps it may be useful to identify core information that is important and
changes from year to year. Data on these variables can be collected annually and also by
multiple agencies. This reduces the burden imposed on the teachers and helps quick
transmission. The data on other variables can be collected in regular intervals and
different components can be collected by different agencies with some planned
overlapping to ascertain the validity of data.
♦ The increasing processing power of computers and easy availability of computers and
internet at district and even below district levels opens up enormous possibilities to
manage large data sets with least difficulty. At one extreme all stages of collection and
transmission of data with the exception of filling of forms at school level can be
computerized. This reduces the possibility of errors in aggregation and transmission. This
will helps in storing unit level data for subsequent analysis. Thus computerization of data
collection and aggregation is one of the important emerging areas.
♦ The persistent time lag continues to be an issue in school education statistics. Despite
availability a variety of documents and sources often one finds it difficult to collect latest
data on as simple as enrolment, sex composition, etc. The provisional statistics released
as quick estimates are nearly being used as if they are final data. It important that the time
lag is reduced. Perhaps one way of doing this is that instead of replacing the mainstream
data collection system with DISE, a few successful and promising elements in DISE like
computerization of data transmission and aggregation, special software for
computerization of data, entry at local levels be it mandal/block/district level can be
- 141 -
adopted to minimize the time lag in collection, upward transmission, processing and
publishing by mainstream data collection mechanism.
♦ The bottom line to improve the reliability and validity of data is faithful and accurate
filling forms at school level. How to ensure faithful and accurate filling of forms by
teachers is one of the important long standing problem in Indian educational statistics. It
is possible to provide training to teachers at CRC/BRC level if problem is only about
inadequate or inaccurate grasping of concepts, definition specific to educational data.
Teachers can be encouraged to keep records and provide appropriate information by
providing incentives. There is no denying that these do indeed go a long way in
improving the quality of data. But if the problem is more than technicalities and the
teacher is under compulsion (real or perceived) to show progress, he of course would
show progress. The educational system under consistent pressure to show progress since
independence. In fact the system geared to show only progress even if the size of school
going children is shrinking. It is may be worthwhile to explore how the pressures to show
progress have influenced the system in general and quality and reliability of data in
particular. Besides there are several mundane issues that effect reliability of data. The
placement of teachers is one such issue that may induce teacher to report fake enrolment.
Perhaps it may be prudent to delink the placement of teacher with the number of children
enrolled in school but can be linked to size of school going age children in the village.
Others factors that are considered to be influencing the quality of data include incentives
like midday meal, etc
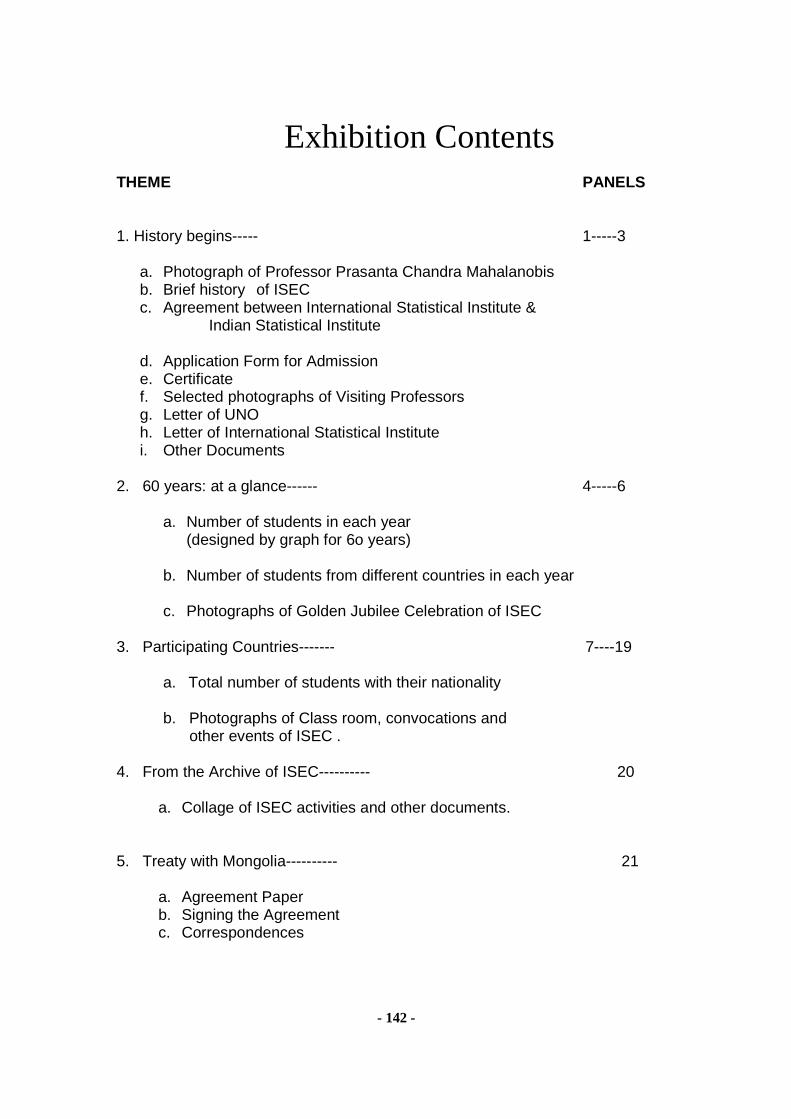
- 142 -
Exhibition Contents
THEME PANELS 1. History begins----- 1-----3
a. Photograph of Professor Prasanta Chandra Mahalanobis b. Brief history of ISEC c. Agreement between International Statistical Institute & Indian Statistical Institute d. Application Form for Admission e. Certificate f. Selected photographs of Visiting Professors g. Letter of UNO h. Letter of International Statistical Institute i. Other Documents
2. 60 years: at a glance------ 4-----6
a. Number of students in each year (designed by graph for 6o years)
b. Number of students from different countries in each year c. Photographs of Golden Jubilee Celebration of ISEC
3. Participating Countries------- 7----19
a. Total number of students with their nationality b. Photographs of Class room, convocations and other events of ISEC .
4. From the Archive of ISEC---------- 20
a. Collage of ISEC activities and other documents. 5. Treaty with Mongolia---------- 21
a. Agreement Paper b. Signing the Agreement c. Correspondences

- 143 -
6. Commonwealth countries----------- 22 a. World map showing Commonwealth countries 7. Golden Words---------- 23-24
Messages from-- a. Hon’ble Minister Pranab Mukherjee, Chairman, ISI b. Professor M G K Menon, President, ISI c. Professor C R Rao, Chairman, Board of Directors, ISEC d. Dr. M S Gill, Hon’ble Minister, MOSPI, Gov of India e. Professor T C A Anant, Secretary, MOSPI, Govt of India f. Professor R Radhakrishna, Chairman, NSC, Govt of India