isolation of biologically active …shodhganga.inflibnet.ac.in/bitstream/10603/70755/1/ashok thesis...
TRANSCRIPT
ISOLATION OF BIOLOGICALLY ACTIVE OLIGOSACCHARIDES FROM
MILK OF Ovies aries AND THEIR STRUCTURE ELUCIDATION
THESIS SUBMITTED
TO THE UNIVERSITY OF LUCKNOW
FOR THE DEGREE OF
DOCTOR OF PHILOSOPHY
IN
CHEMISTRY
By
ASHOK KUMAR RANJAN (M.Sc.)
DEPARTMENT OF CHEMISTRY UNIVERSITY OF LUCKNOW
LUCKNOW, UTTAR PRADESH (INDIA)
2015

Prof. R. N. Pathak Professor & Head
This is to certify that all necessary requirements for the submission of Ph.D.
thesis of Mr. Ashok Kumar Ranjan has been fully observed.
Pathak Department of Chemistry University of L
Email:
CERTIFICATE
This is to certify that all necessary requirements for the submission of Ph.D.
thesis of Mr. Ashok Kumar Ranjan has been fully observed.
[Prof. R. N. Pathak
Department of Chemistry
University of Luckno
Department of Chemistry University of Lucknow
Lucknow 226007 INDIA
Email: [email protected]
This is to certify that all necessary requirements for the submission of Ph.D.
[Prof. R. N. Pathak]
Head
Department of Chemistry
University of Lucknow
Lucknow.

Dr. Desh Deepak Phone: (R) 0522-2258879
M. Sc., Ph.D. (M) 09454856373 FNMRS, FISMS, FACCT, FISCB, FSCBS Email- [email protected]
Department of Chemistry University of Lucknow Lucknow-226007, India
Dated
CERTIFICATE
This is to certify that the work embodied in this thesis has been carried out by
Mr. ASHOK KUMAR RANJAN, M.Sc., under my supervision. He has fulfilled the
requirements for the degree of Doctor of Philosophy of Lucknow University,
regarding the nature and prescribed period of investigational work. The work
included in this thesis has not been submitted for any other degree and unless
otherwise stated, is all original.
Dr. Desh Deepak (Associate Prof.)
Department of Chemistry University of Lucknow,
Lucknow.

Dedicated
to
my Parents

CONTENTS
Page No.
ACKNOWLEDGEMENTS
ABBREVIATIONS i-iv
PREFATORY NOTE v-xix
CHAPTER-I INTRODUCTION 1-40
Importance of Carbohydrates and Oligosaccharides 1-6
Biological activity of Milk Oligosaccharides 6-12
Methods of Isolation of Milk Oligosaccharides 13-14
Purification of Milk Oligosaccharides 14-17
Structure Elucidation of Milk Oligosaccharides 18-40
CHAPTER-II ISOLATION 41-57
Isolation of Ovies aries Milk Oligosaccharides 41-44
Purification of Ovies aries Milk Oligosaccharides 45-47
Description of Isolated Oligosaccharides 48-57
CHAPTER-III RESULTS AND DISCUSSION 58-127
Structural Elucidation of Oligosaccharide-A (Capriose) 58-74
Structural Elucidation of Oligosaccharide-B (Viesose) 75-91
Structural Elucidation of Oligosaccharide-C (Ariesose) 92-109
Structural Elucidation of Oligosaccharide-D (Riesose) 110-127
CHAPTER-IV EXPERIMENTAL 128-134
BIBLIOGRAPHY 135-144
APPENDIX 145

ACKNOWLEDGMENT
First and foremost, I’d like to avail this opportunity to express my deep gratitude towards
my supervisor Dr. Desh Deepak, Associate Prof. Department of Chemistry,
University of Lucknow, Lucknow for his continuous support and guidance in my Ph.D.
dissertation and research work. If it was not for his patience, constant motivation, his un
bound zeal to do something new and his profound love and understanding of the subject,
this venture of mine would just not have been possible. It was completely blissful for me
to have found a counsellor in my guide whose suggestions to me are nothing less than
lessons for life.
Also, I am indebted to Prof. R. N. Pathak, Head, Department of Chemistry,
University of Lucknow, Lucknow for providing me with laboratory and library facilities
at whatever time I needed them and his support was something I could always fall back
on. I am grateful Prof. Naveen Khare, Department of Chemistry, University of Lucknow
for those meaningful discussions he would have with me at all points during the day and
his constructive criticism followed by excellent suggestions. My sincere gratitude goes to
Prof. Raja Roy, CBMR, SGPGI, Lucknow for providing me NMR facilities and fruitful
suggestions and discussions, whenever and where ever it was required. Without thanking
him this would totally be incomplete. I am also thankful to Dr. Sanjeev Kumar Shukla,
CDRI, Lucknow, for the successful running of my NMR spectra. I would like to thank
Dr. Sanjeev Kanaujia, CDRI, Lucknow for providing me Mass Spectrometry facilities. I
would like to thank Dr. Amit Srivastava for providing me HPLC facilities. My sincere
thanks go to Mr. Alok Shukla for his moral support. I am warmly thankful to Dr. (Mrs.)
Neelima Deepak for her blessings, love, affection and encouragement. It’s my deep
privilege to express gratitude to Prof. (Mrs.) Anakshi Khare, former Head, Department
of Chemistry, University of Lucknow, Lucknow.
I am grateful to my research colleague Mrs. Meenakshi Singh for her constant
support and helpful suggestions. I am also thankful to my research colleagues Ashish
Singh, Kuldeep Kumar, Gunjan, Mujeeb Khan, Pushpraj and Ranjeet . I would also
like to express my gratitude towards my seniors Dr. Narendra Mani Tripathi, Dr.

Aneesh Kumar, Dr. Mayank Agnihotri and Dr. R. K. Bajpayee for their valuable
suggestions and help.
I am extremely thankful to my friends Mr. Sheel Ratan, Mukul, Anil, and
Surjeet Singh, Ranvijay Singh, Shailendra Bharti, Ms. Stuti, Priydarshni, Ritu,
Shaheen, and Indu for their moral support.
In the end, a special mention of those people who put me in this place where I
could do my doctorate I, hence would like to express my deepest gratitude towards my
family, my parents in particular, Mr. Nanhu Ram and Mrs. Sharda Devi, without their
blessings and support this achievement was not possible. I am also thankful to my
brothers Mr. Pradeep Kr. Ranjan, Dr. Ajai Kr. Ranjan and Mr. Manoj Kr. Ranjan
and my most loving sister and her husband Mrs. Premlata Roshan and Mr. Satish
Roshan for their undying support and encouragement which helped me to do better every
day.
I wish to thanks to all those who helped me in one or other way.
Date Ashok Kumar Ranjan

i
ABBREVIATIONS USED
AcOH = Acetic acid
Ac2O = Acetic anhydride
Ag2CO3 = Silver carbonate
AgNO3 = Silver nitrate
AgOH = Silver hydroxide
Ag2S = Silver sulphide
Anhyd. = Anhydrous
Aq. = Aqeous
BaCO3 = Barium carbonate
BuOH = n-Butanol
Br2 = Bromine
C = Carbon
CC = Column chromatography
CDCl3 = Deuterated chloroform
CHCl3 = Chloroform
CH2Cl2 = Dichloromethane
CH3CHO = Acetaldehyde
CH3CN = Acetonitrile
C6H5CH3 = Toluene
conc. = Concentration
D = Doublet
Dd = Double doublet
D2O = Deuterated water
DTH = Delayed type hypersensitivity
2D
ESMS
=
=
Two dimensional
Electron Spray mass spectrometry
EtOH = Ethanol
Et2O = Diethyl ether = solvent ether
EtOAc = Ethyl acetate

ii
FABMS = Fast atom bombardment mass spectrometry
FeCl3 = Ferric chloride
Fe2(SO4)3 = Ferric sulphate
Fr.
Fuc
=
=
Fraction(s)
Fucose
G = Grams
Gal = Galactose
GalNAc = 2-Acetamido-2-deoxy-galactose
Glc = Glucose
GlcNAc = 2-Acetamido-2-deoxy-glucose
H = Hour
H = Hydrogen
HA = Haemagglutination titre
HCl = Hydrochloric acid
H2O = Water
HPLC = High performance liquid chromatography
H2S = Hydrogen sulphide
H2SO4 = Sulphuric acid
Hz = Hertz
i.p. = Intraperitoneal
J = Coupling constant
Kg = Kilogram
KOH = Potassium hydroxide
LND = Lacto-N-difucohexaose
LNF = Lacto-N-fucopentaose
LNH = Lacto-N-hexaose
LNT = Lacto-N-tetraose
LNnT = Lacto-N-neotetraose
Lt.
Lea
Leb
=
=
=
Liter
Lewis a
Lewis b

iii
Lex = Lewis x
M = Multiplet
MeOH = Methanol
Me2CO = Acetone
Mg = Milligram
MHz = Megahertz
Min = Minute
Ml = Milliliter
µl = Microlitre
MLR = Mixed lymphocyte reaction
MMI = Macrophage migration index
Mol. wt. = Molecular weight
Mp = Melting point
Mmp = Mixed melting point
N = Normal
NaBH4 = Sodium borohydride
Na2CO3 = Sodium carbonate
NaIO4 = Sodium metaperiodate
NaOH = Sodium hydroxide
NaOCH3 = Sodium methoxide
Na2SO4 = Sodium sulphate
NMR = Nuclear magnetic resonance spectroscopy
O = Oxygen
OAc = Acetyl
OH = Hydroxyl
ORD = Optical rotatory dispersion
Pb(OH)2 = Lead hydroxide
PC = Paper chromatography
PFC = Plaque-forming cells
P2O5 = Phosphorus penta-oxide
Pyr = Pyridine

iv
Q = Quartet
R P = Reverse phase
S = Singlet
S D = Standard deviation
SEM = Standard error of mean
SiO2 = Silica
SRBC = Sheep red blood cells
T = Triplet
TBA = Thiobarbituric acid
TDW = Triple distilled water
TLC = Thin layer chromatography
TMS = Tetra methyl silane
UV = Ultra violet
[α]D = Rotation/specific rotation
α = Alpha
β = Beta
δ = Delta

v
PREFATORY NOTE
The work presented in this thesis began in September 2011 under the able guidance of
Dr. Desh Deepak associate professor, Department of chemistry, University of Lucknow.
With a view to carry out a detailed chemical and physical investigation of milk
oligosaccharides isolated from Sheep milk (Oveis aries). The Sheep milk
oligosaccharides were isolated and purified by different chromatographic methods and
their structure were elucidated by chemical degradation, chemical transformation and
spectroscopic techniques (1H, 13C and 2D i.e. HSQC, HMBC, COSY and TOCSY NMR
and MASS spectrometry).
In the present scenario glyco compounds have established them self as important
therapeutic agents with milder or no side effects. Numbers of antibiotics, vaccines, anti
cancer agents, immunostimulant are in clinical trials having either carbohydrates or their
derivatives in their structure. Under the category of carbohydrates, oligosaccharides are
an important class of compounds. They are present in higher plants, fungi, algae, bacteria
and milk. The oligosaccharides isolated from these sources have showed varied
biological activities such anti-tumor, immunological, anticomplimentory, anti-cancer,
anti-inflammtroy, Anti-coagulant, hypoglycemic and anti-viral activities. In the recent
years milk has immerged as an important source of new and structurally complex
oligosaccharides which are promising therapeutic agents evaluated against dreaded
diseases like AIDS and cancer. In the ancient medicinal system like ayuerveda and
Unani, specific activities are reported for milks of various origin but at that time role of
oligosaccharides were not known. So the glycochemist has taken this field as a challenge
and isolated number of oligosaccharides from milk and studied their varied biological
activities. These milk oligosaccharides have been classified as acidic or sialylated
oligosaccharides and non-sialylated or normal oligosaccharides they are further classified
as fucosylated, branch chained and straight chained oligosaccharides. This classification
is based on either due to presence of specific moieties such as sialic acid (Neuraminic
acid), fucose, or on the basis of their structures i.e. the monosaccharides are present in
straight chain or they are having branching in them. Number of oligosaccharides have
been isolated from milk of Donkey, Mare, Buffalo, Camel, Cow, Chouri cow, Yak, Gaddi

vi
sheep etc. and their biological activities have been studied. As the medicinal importance
in the Sheep’s milk in ancient medicinal system was enormous and it has shown potent
activities against leukoderma, antimicrobial agents and enhance the organism’s natural
defenses against invading pathogens. Keeping in mind the medicinal importance of
Sheep milk and the role of oligosaccharides in it, in the present dissertation Sheep milk
was analyzed for its oligosaccharides contents. In the present work oligosaccharides were
isolated from Sheep’s milk by following established methods and combing the recent and
traditional chromatographic techniques. Further the stereospecific structures of these
oligosaccharides were established with help of recent two dimensional experiments of
NMR and MASS spectrometry and combining the data with traditional methods of
chemical degradation and chemical transformation.
The thesis entitled “ISOLATION OF BIOLOGICALLY ACTIVE
OLIGOSACCHARIDES FROM MILK OF Ovies aries AND THEIR STRUCTURE
ELUCIDATION” has been divided into four chapters:
CHAPTER I: INTRODUCTION
In this chapter a brief introduction of the biological significance of carbohydrates
and important drugs containing carbohydrate moieties are given. It also includes the
biological activities shown by naturally occurring oligosaccharides, especially those
found in milk of various origins and their biological importance. Various methods of
isolation of milk oligosaccharides mainly Modified method of Kobata and Ginsburg have
been described. This chapter includes different chromatographic techniques like Thin
Layer Chromatography, Column Chromatography, High Performance Liquid
Chromatography, Reverse Phase-HPLC etc. which have been used in the purification of
oligosaccharides. Various chemical degradation and transformation techniques such as
acid hydrolysis, acetylation/methylation etc have been discussed. Spectroscopic
techniques like NMR (1H, 13C and 2D NMR spectroscopy) and Mass spectrometry which
are used in the structure elucidation of milk oligosaccharides have also been discussed in
detail in this chapter.

vii
CHAPTER II: ISOLATION OF MILK OLIGOSACCHARIDES
This chapter describes in detail the methods of processing, isolation and
purification of ‘Sheep’ milk oligosaccharides. For the present chemical investigation of
milk oligosaccharide, Sheep milk was collected in bulk (10 lit.) and was processed by
‘modified method of Kobata and Ginsberg’ which afforded a crude mixture of
oligosaccharide containing normal and amino sugar in them. The lyophilized material
(crude milk oligosaccharide mixture) was purified on a Sephadex G-25 column which
separated glycoproteins and proteins from oligosaccharides. Oligosaccharide fractions so
obtained from Sephadex G-25 column were pooled and subjected to reverse phase HPLC
for establishing their homogeneity in crude oligosaccharide mixture. The peaks were
numbered in their increasing order of retention time i.e. 7.21 min (R1), 7.63 min (R2),
8.45 min (R3), 17.21 min (R4), 17.41 min (R5), 20.58 min (R6), 21.39 min (R7), 21.78 min
(R8), 24.69 min (R9), 25.42 min (R10), 25.97 min (R11), 27.51 min (R12). The HPLC
showed the presence of twelve oligosaccharide. Mixture of oligosaccharide was
acetylated by acetic anhydride and pyridine for getting their respective acetyl derivatives
which were resolved nicely on TLC and showed nine well resolved spots which were
designated as a, b, c, d, e, f, g, h and i. Repeated column chromatography of these
acetylated oligosaccharides mixture on silica gel, using different solvent systems
followed by their deacetylation afforded four novel oligosaccharides viz. A, B, C and D.
Table-1: Acetylated and Deacetylated oligosaccharides obtained from Sheep milk
Acetylated Compound Deacetylated Compound
Alphabetical name
Analytical notation
Quantity (mg) Alphabetical name
Analytical notation
Quantity (mg) Isolated by
CC Taken for
deacetylation
a ARSM-1A 112 40 A ARSM-1 35
b ARSM-2A 419 50 B ARSM-2 45
c ARSM-3A 46 32 C ARSM-3 24
d ARSM-4A 62 52 D ARSM-4 44
viii
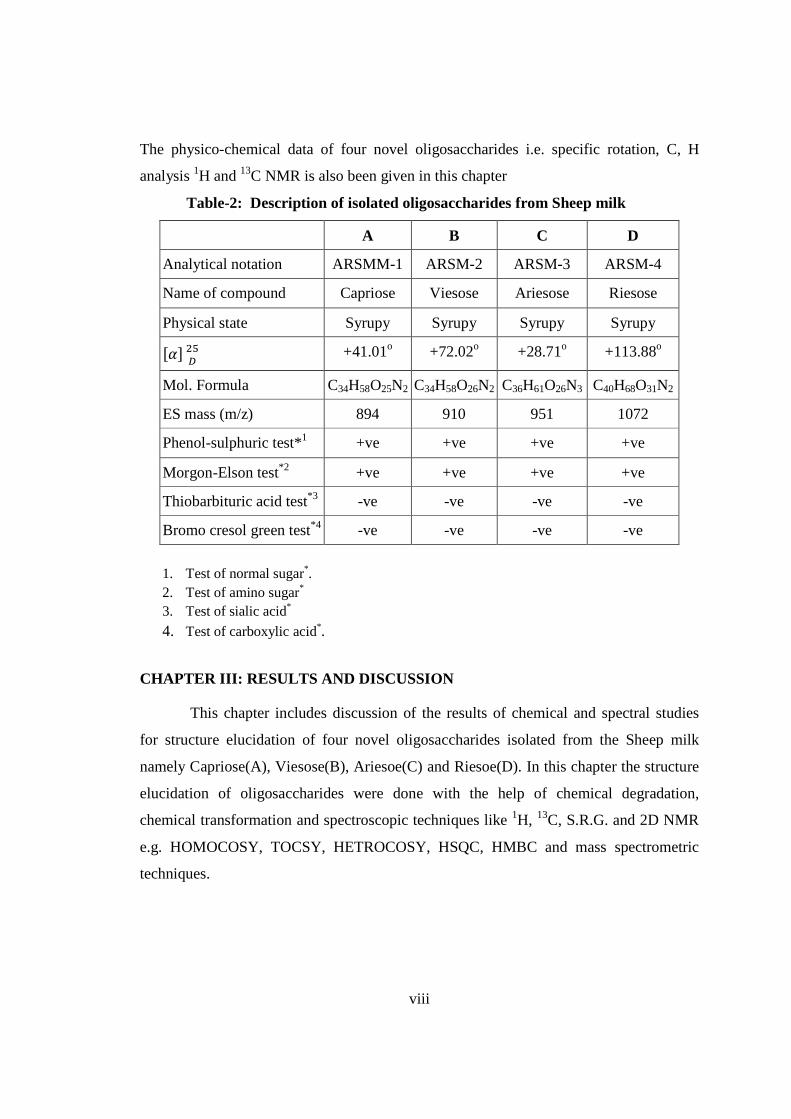
The physico-chemical data of four novel oligosaccharides i.e. specific rotation, C, H
analysis 1H and 13C NMR is also been given in this chapter
Table-2: Description of isolated oligosaccharides from Sheep milk
A B C D
Analytical notation ARSMM-1 ARSM-2 ARSM-3 ARSM-4
Name of compound Capriose Viesose Ariesose Riesose
Physical state Syrupy Syrupy Syrupy Syrupy
��� ���
+41.01o +72.02o +28.71o +113.88o
Mol. Formula C34H58O25N2 C34H58O26N2 C36H61O26N3 C40H68O31N2
ES mass (m/z) 894 910 951 1072
Phenol-sulphuric test*1 +ve +ve +ve +ve
Morgon-Elson test*2 +ve +ve +ve +ve
Thiobarbituric acid test*3 -ve -ve -ve -ve
Bromo cresol green test*4 -ve -ve -ve -ve
1. Test of normal sugar*. 2. Test of amino sugar* 3. Test of sialic acid*
4. Test of carboxylic acid*.
CHAPTER III: RESULTS AND DISCUSSION
This chapter includes discussion of the results of chemical and spectral studies
for structure elucidation of four novel oligosaccharides isolated from the Sheep milk
namely Capriose(A), Viesose(B), Ariesoe(C) and Riesoe(D). In this chapter the structure
elucidation of oligosaccharides were done with the help of chemical degradation,
chemical transformation and spectroscopic techniques like 1H, 13C, S.R.G. and 2D NMR
e.g. HOMOCOSY, TOCSY, HETROCOSY, HSQC, HMBC and mass spectrometric
techniques.
ix
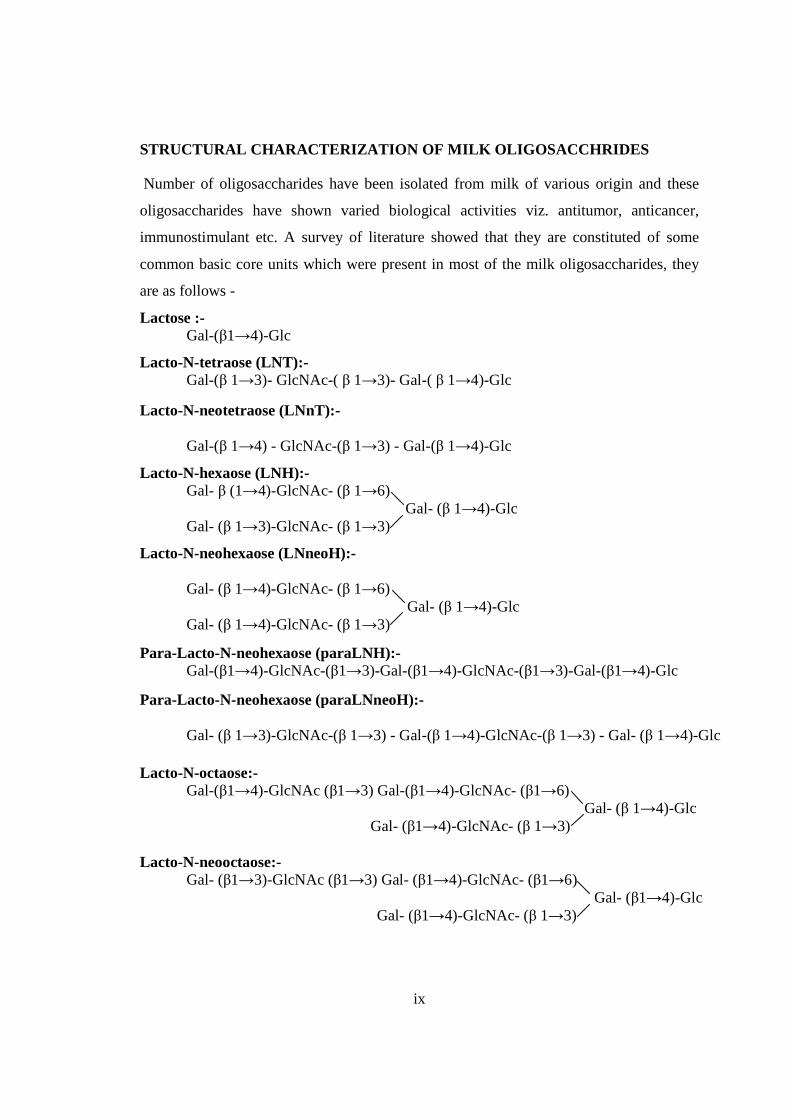
STRUCTURAL CHARACTERIZATION OF MILK OLIGOSACCHRIDES
Number of oligosaccharides have been isolated from milk of various origin and these
oligosaccharides have shown varied biological activities viz. antitumor, anticancer,
immunostimulant etc. A survey of literature showed that they are constituted of some
common basic core units which were present in most of the milk oligosaccharides, they
are as follows -
Lactose :- Gal-(β1→4)-Glc
Lacto-N-tetraose (LNT):- Gal-(β 1→3)- GlcNAc-( β 1→3)- Gal-( β 1→4)-Glc
Lacto-N-neotetraose (LNnT):- Gal-(β 1→4) - GlcNAc-(β 1→3) - Gal-(β 1→4)-Glc
Lacto-N-hexaose (LNH):- Gal- β (1→4)-GlcNAc- (β 1→6) Gal- (β 1→4)-Glc Gal- (β 1→3)-GlcNAc- (β 1→3)
Lacto-N-neohexaose (LNneoH):- Gal- (β 1→4)-GlcNAc- (β 1→6) Gal- (β 1→4)-Glc Gal- (β 1→4)-GlcNAc- (β 1→3)
Para-Lacto-N-neohexaose (paraLNH):- Gal-(β1→4)-GlcNAc-(β1→3)-Gal-(β1→4)-GlcNAc-(β1→3)-Gal-(β1→4)-Glc
Para-Lacto-N-neohexaose (paraLNneoH):- Gal- (β 1→3)-GlcNAc-(β 1→3) - Gal-(β 1→4)-GlcNAc-(β 1→3) - Gal- (β 1→4)-Glc Lacto-N-octaose:- Gal-(β1→4)-GlcNAc (β1→3) Gal-(β1→4)-GlcNAc- (β1→6) Gal- (β 1→4)-Glc Gal- (β1→4)-GlcNAc- (β 1→3) Lacto-N-neooctaose:- Gal- (β1→3)-GlcNAc (β1→3) Gal- (β1→4)-GlcNAc- (β1→6) Gal- (β1→4)-Glc Gal- (β1→4)-GlcNAc- (β 1→3)

x
Iso-Lacto-N-octaose:- Gal- (β1→4)-GlcNAc (β1→3) Gal- (β1→4)-GlcNAc- (β1→6) Gal- (β 1→4)-Glc Gal- (β1→3)-GlcNAc- (β 1→3)
Para-Lacto-N-octaose:- Gal-(β1→3)-GlcNAc-(β1→3)-Gal-(β1→4)-GlcNAc-(β1→3)-Gal-(β1→4)-
GlcNAc-(β 1→3)- Gal-( β 1→4)-Glc
Lacto-N-decaose:- Gal- (β 1→4)-GlcNAc-(β 1→6) Gal- (β 1→4)-GlcNAc- (β 1→6) Gal- (β 1→4)-GlcNAc- (β 1→3) Gal- (β 1→4)-Glc Gal- (β 1→4)-GlcNAc- (β 1→3)
The previous workers have elucidated the structure of milk oligosaccharides by
chemical degradation, chemical transformation, structure reporter group theory and
spectroscopic techniques (NMR and Mass spectrometry). In the present study the
structures of four novel milk oligosaccharides were established by comparing the
chemical shift (1H and 13 C NMR) of anomeric proton and carbon resonance signals and
other important signals of unknown milk oligosaccharides with the chemical shifts of
known milk oligosaccharides. Simultaneously analogies between chemical shift of certain
‘structural reporter group resonances’ were used to make proton resonance
assignments as well as structural assignments of the oligosaccharides. All chemical shifts
of anomeric proton signals of milk oligosaccharides were further confirmed by 2D (1H-1H HOMOCOSY, TOCSY, HMBC and HSQC) NMR experiments, which were earlier
assigned with the help of 1H and 13C NMR data. Other techniques like deacetylation,
methylation, hydrolysis, chemical degradation and mass spectrometry were also used for
the structural elucidation of these novel oligosaccharide.

xi
COMPOUND-A CAPRIOSE
Compound A, C34H58O25N2, �����
� +41.01o gave positive Phenol-sulphuric acid test,
Fiegl test, and Morgan-Elson test, showing the presence of normal and amino sugars
moietie(s) in the compound-A. The HSQC spectrum of acetylated capriose showed the
presence of five cross peaks of six anomeric protons doublets and carbons in their
respective region at 6.37x89.68, 5.72x91.66, 5.40x91.66, 5.19x101.05, 4.48x101.05(2H),
suggesting the presence of six anomeric protons and carbon in it. Further the presence of
six anomeric signals were confirmed by presence of five 1H NMR doublets i.e. at δ
6.37(1H), 5.72(1H), 5.40(1H), 5.19(1H) 4.48(2H) in the acetylated spectrum of Capriose
in CDCl3 at 300 MHz. The presence of six anomeric carbons were also confirmed by the
presence of three anomeric carbon signals at δ 89.68(1C), 91.66(2C), 101.05(3C) in the 13C NMR spectrum of acetylated compound-A in CDCl3 at 300 MHz. The pentasccharide
nature of capriose was further supported by five anomeric proton doublets of five protons
δ 5.57(1H), 4.59(1H) 5.3 (1H), 4.35(2H) along with two methyl (NHCOCH3) signal at δ
1.94 (2NHAc) in the 300 MHz NMR spectrum of Capriose in D2O. These data suggested
that compound capriose may be a pentasccharides in its reducing form. In 1H NMR
spectrum of acetylated capriose out of 6 anomeric proton signals, signal at δ 6.37 and δ
5.72 were assigned for downfield shifted α and β anomeric protons at the reducing end
suggesting that was in its reducing form and suggested that compound-A ‘capriose’ may
be a pentasccharide in its reducing form. Further the ES mass spectrum of capriose
showed highest mass ion peaks at m/z 956 assigned to [M+Na+K]+ and m/z 933
assigned to [M+K]+, it also contain the molecular ion peak at m/z 894 confirming the
molecular weight as 894 which was in agreement with derived composition C34H58O25N2.
The reducing nature of compound was further confirmed by methylglycosylation
MeOH/H+ followed by its acid hydrolysis, which led to the isolation of α and β- methyl
glucosides along with Gal, GlcNac and FucNac, suggesting the presence of glucose at the
reducing end, for convenience all five monosaccharides were denoted as S-1, S-2, S-3, S-
4 and S-5. The monosaccharide constituents in compound-A were confirmed by its
killiani hydrolysis under strong acidic condition, followed by paper chromatography and
TLC. In this hydrolysis four spots were found identical with the authentic samples of Glc,
Gal, GlcNac and FucNac by co-chromatography. Thus the pentasaccharide contained
xii
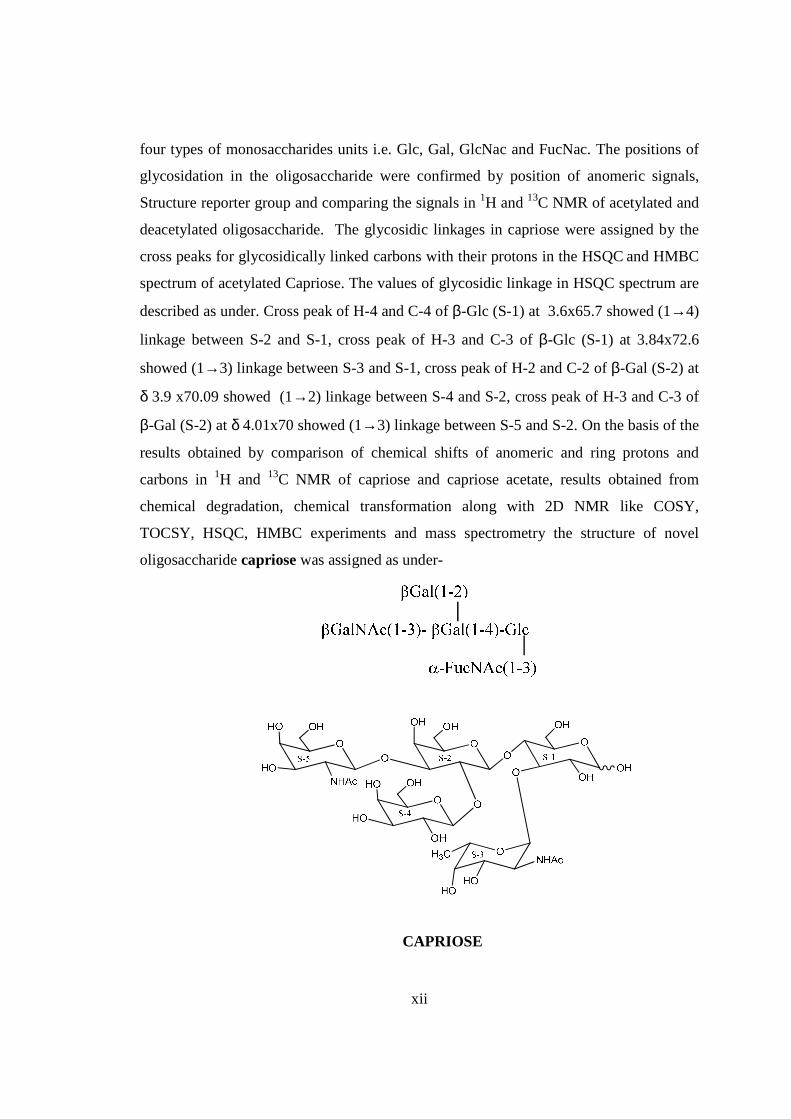
four types of monosaccharides units i.e. Glc, Gal, GlcNac and FucNac. The positions of
glycosidation in the oligosaccharide were confirmed by position of anomeric signals,
Structure reporter group and comparing the signals in 1H and 13C NMR of acetylated and
deacetylated oligosaccharide. The glycosidic linkages in capriose were assigned by the
cross peaks for glycosidically linked carbons with their protons in the HSQC and HMBC
spectrum of acetylated Capriose. The values of glycosidic linkage in HSQC spectrum are
described as under. Cross peak of H-4 and C-4 of β-Glc (S-1) at 3.6x65.7 showed (1→4)
linkage between S-2 and S-1, cross peak of H-3 and C-3 of β-Glc (S-1) at 3.84x72.6
showed (1→3) linkage between S-3 and S-1, cross peak of H-2 and C-2 of β-Gal (S-2) at
δ 3.9 x70.09 showed (1→2) linkage between S-4 and S-2, cross peak of H-3 and C-3 of
β-Gal (S-2) at δ 4.01x70 showed (1→3) linkage between S-5 and S-2. On the basis of the
results obtained by comparison of chemical shifts of anomeric and ring protons and
carbons in 1H and 13C NMR of capriose and capriose acetate, results obtained from
chemical degradation, chemical transformation along with 2D NMR like COSY,
TOCSY, HSQC, HMBC experiments and mass spectrometry the structure of novel
oligosaccharide capriose was assigned as under-
CAPRIOSE

xiii
COMPOUND-B VIESOSE
Compound B, C34H58O26N2, �����
� +72.02o gave positive Phenol-sulphuric acid test, Fiegl
test and Morgan-Elson test showing the presence of normal and amino sugars moietie(s)
in the compound B. The HSQC spectrum of acetylated viesose showed the presence of
five cross peaks for six anomeric protons and six anomeric carbons in their respective
region at 6.22x89.10, 5.64x91.56, 4.976x91.56, 5.22x101.97, 4.56x100.84(2H),
suggesting the presence of six anomeric protons and carbon in it. Further the presence of
six anomeric peaks of anomeric protons were separately confirmed by five NMR
doublets i.e. δ 6.22(1H), 5.64(1H), 5.22(1H), 4.97(1H), 4.56(2H) in the 1H NMR
spectrum of acetylated viesose in CDCl3 at 300 MHz. The presence of six anomeric
carbons were confirmed by the presence of four peaks at δ 89.10(1C), 91.56(2C),
100.97(1C), 100.84(2C) in 13C spectrum of viesose acetate in CDCl3 at 300 MHz. The
pentasccharide nature of viesose was further supported by the presence of five anomeric
proton doublets for six anomeric protons at δ 5.20(1H), 4.6(1H), 4.49(1H), 4.46(1H),
4.39(2H) in 1H NMR spectrum of viesose in D2O at 300 MHz. These data suggested that
viesose may be a pentasccharides in its reducing form. In 1H NMR spectrum of
acetylated viesose out of 6 anomeric proton signal, signal at δ 6.22 and 5.64 contained
downfield shifted α and β anomeric protons suggested that it was in its reducing form and
compound-B ‘viesose’ may be a pentasccharide in its reducing form. Further the ES mass
spectrum of viesose showed the highest mass ion peaks at m/z 972 assigned to
[M+Na+K]+ and m/z 949 assigned to [M+K]+, it also contain the molecular ion peak at
m/z 910 confirming the molecular weight as 910 which was in agreement of derived
composition i.e. C34H58O26N2. The reducing nature of compound-B viesose was
confirmed by its methylglycosylation MeOH/H+ followed by its acid hydrolysis, which
led to the isolation of α and β- methyl glucosides along with Gal, GlcNac and GalNac,
suggesting the presence of glucose at the reducing end, for convenience all five
monosaccharides were denoted as S-1, S-2, S-3, S-4 and S-5 respectively from the
reducing end. The monosaccharide constituents in compound-B were confirmed by its
killiani hydrolysis under strong acidic condition, followed by paper chromatography and
TLC. In this hydrolysis four spots were found identical with the authentic samples of Glc,
Gal, GlcNac and GalNac by co-chromatography. Thus the pentasaccharide contained four
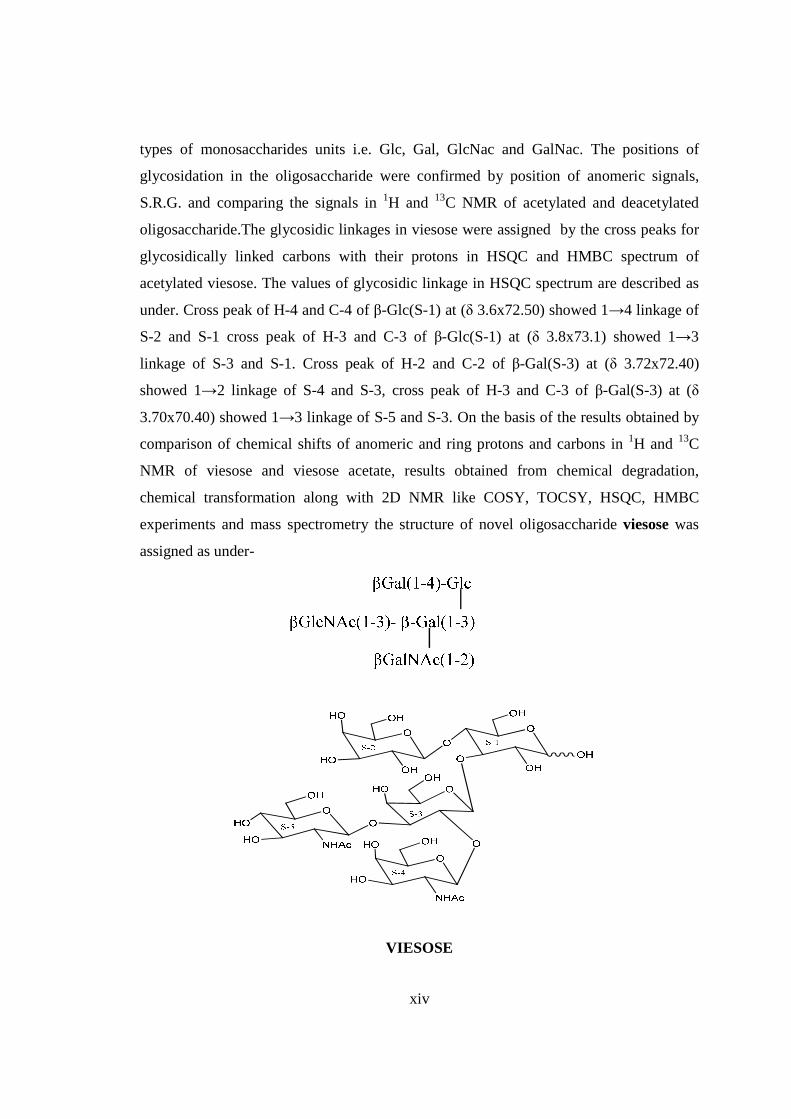
xiv
types of monosaccharides units i.e. Glc, Gal, GlcNac and GalNac. The positions of
glycosidation in the oligosaccharide were confirmed by position of anomeric signals,
S.R.G. and comparing the signals in 1H and 13C NMR of acetylated and deacetylated
oligosaccharide.The glycosidic linkages in viesose were assigned by the cross peaks for
glycosidically linked carbons with their protons in HSQC and HMBC spectrum of
acetylated viesose. The values of glycosidic linkage in HSQC spectrum are described as
under. Cross peak of H-4 and C-4 of β-Glc(S-1) at (δ 3.6x72.50) showed 1→4 linkage of
S-2 and S-1 cross peak of H-3 and C-3 of β-Glc(S-1) at (δ 3.8x73.1) showed 1→3
linkage of S-3 and S-1. Cross peak of H-2 and C-2 of β-Gal(S-3) at (δ 3.72x72.40)
showed 1→2 linkage of S-4 and S-3, cross peak of H-3 and C-3 of β-Gal(S-3) at (δ
3.70x70.40) showed 1→3 linkage of S-5 and S-3. On the basis of the results obtained by
comparison of chemical shifts of anomeric and ring protons and carbons in 1H and 13C
NMR of viesose and viesose acetate, results obtained from chemical degradation,
chemical transformation along with 2D NMR like COSY, TOCSY, HSQC, HMBC
experiments and mass spectrometry the structure of novel oligosaccharide viesose was
assigned as under-
VIESOSE

xv
COMPOUND-C ARIESOSE
Compound C, C36H61O26N3, �����
� +28.71o gave positive Phenol-sulphuric acid test, Fiegl
test and Morgan-Elson test showing the presence of normal and amino sugars moietie(s)
in the compound C. The HSQC spectrum of acetylated Ariesose showed the presence of
six cross peaks of anomeric protons and carbons in their respective region at 6.23x89.13,
5.64x91.57, 4.58x101.88, 4.55x102.02, 4.49x100.92, 4.49x101.19 suggesting the
presence of six anomeric protons and carbons into it. Presence of five anomeric peaks for
six protons doublets were separately confirmed by 1H NMR of acetylated ariesose at 300
MHz i.e. δ 6.23(1H), 5.64(1H), 4.58(1H), 4.55(1H), 4.49(2H). The presence of six
carbons were also confirmed by the presence of six anomeric carbons peaks at δ
89.13(1C), 91.57(1C), 101.88(1C), 102.02(1C), 100.92(1C), 101.19(1C) in the acetylated
spectrum of Ariesose at 300 MHz. The pentasccharide nature of Ariesose was further
supported by five anomeric peaks for six protons doublets i.e. δ5.15 (1H), δ4.59 (1H),
δ4.47 (1H), δ4.44 (1H), 4.38 (2H) in 1H NMR spectrum of Ariesose in D2O at 300 MHz.
Further the anomeric proton singlet at δ6.23 and δ5.64 in the 1H NMR of acetylated
compound-C showed downfield shifted α and β anomeric protons showing its was in its
reducing form and suggested that compound Ariesose may be a pentasccharide in its
reducing form. Further the ES mass spectrum of Ariesose showed the highest mass ion
peaks at m/z 1013 assigned to [M+Na+K]+ and m/z 990 assigned to [M+K]+, it also
contain the moleculer ion peak at m/z 951 confirming the moleculer weight of ariesose
was 951 which was in agreement to derived composition i.e.C36H61O26N3. The reducing
nature of compound was further confirmed by methylglycosylation MeOH/H+ followed
by its acid hydrolysis, which led to isolation of α and β- methyl glucosides along with Gal
and GalNac suggesting the presence of glucose at the reducing end, for convenience all
five monosaccharides were denoted as S-1, S-2, S-3, S-4 and S-5. The monosaccharide
constituents in compound–C were confirmed by its killiani hydrolysis under strong acidic
condition, followed by paper chromatography and TLC. In this hydrolysis four spots
were found identical with the authentic samples of Glc, Gal, GlcNac and GalNac by co-
chromatography. Thus the pentasaccharide contained four types of monosaccharides units
i.e. Glc, Gal, GlcNac and GalNac. The 1H NMR also contain three methyl signals of
NHCOCH3 at δ 1.85 and δ 2.01(2NHAc) showing out of five three monosaccharides was
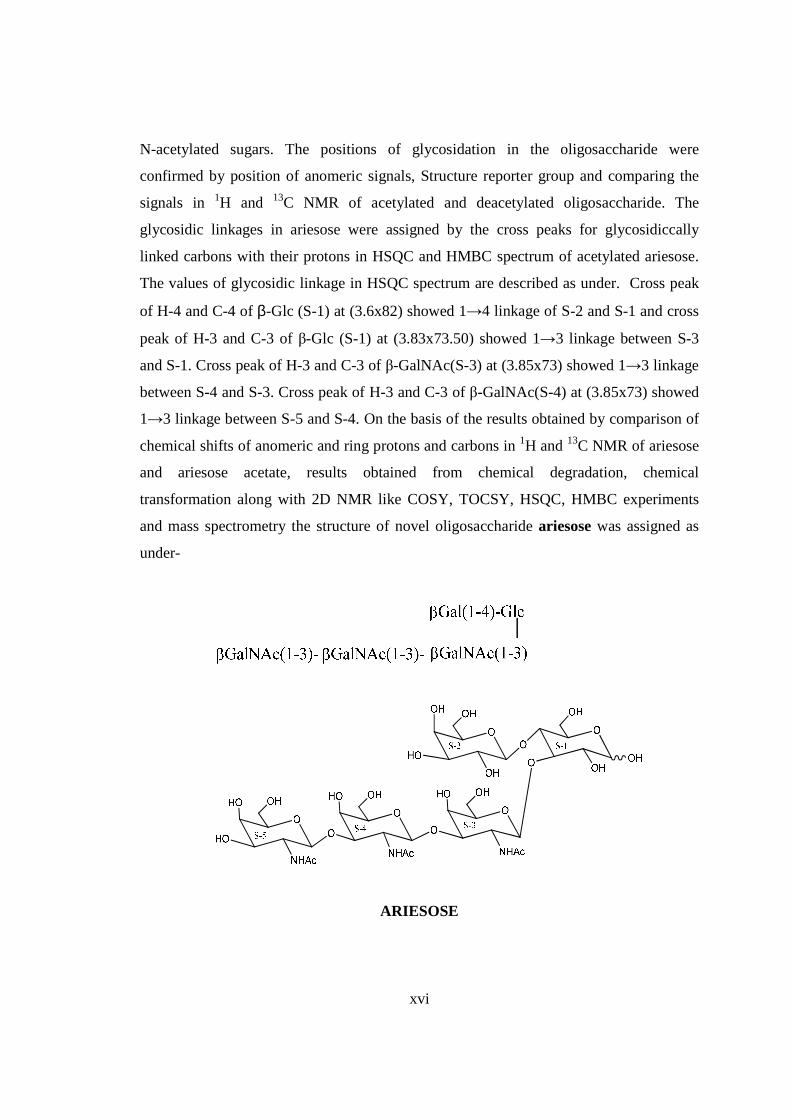
xvi
N-acetylated sugars. The positions of glycosidation in the oligosaccharide were
confirmed by position of anomeric signals, Structure reporter group and comparing the
signals in 1H and 13C NMR of acetylated and deacetylated oligosaccharide. The
glycosidic linkages in ariesose were assigned by the cross peaks for glycosidiccally
linked carbons with their protons in HSQC and HMBC spectrum of acetylated ariesose.
The values of glycosidic linkage in HSQC spectrum are described as under. Cross peak
of H-4 and C-4 of β-Glc (S-1) at (3.6x82) showed 1→4 linkage of S-2 and S-1 and cross
peak of H-3 and C-3 of β-Glc (S-1) at (3.83x73.50) showed 1→3 linkage between S-3
and S-1. Cross peak of H-3 and C-3 of β-GalNAc(S-3) at (3.85x73) showed 1→3 linkage
between S-4 and S-3. Cross peak of H-3 and C-3 of β-GalNAc(S-4) at (3.85x73) showed
1→3 linkage between S-5 and S-4. On the basis of the results obtained by comparison of
chemical shifts of anomeric and ring protons and carbons in 1H and 13C NMR of ariesose
and ariesose acetate, results obtained from chemical degradation, chemical
transformation along with 2D NMR like COSY, TOCSY, HSQC, HMBC experiments
and mass spectrometry the structure of novel oligosaccharide ariesose was assigned as
under-
ARIESOSE

xvii
COMPOUND-D RIESOSE
Compound-D, C40H68O31N2, �����
� +113o gave positive Phenol-sulphuric acid test, Fiegl
test and Morgan-Elson test showing the presence of normal and amino sugar moietie(s) in
the compound-D. The HSQC spectrum of acetylated riesose showed the presence of six
cross peaks for seven anomeric protons doublets and carbons in their respective region at
6.17x90.24, 5.37x90.12, 4.77x95.26, 4.59x101.90, 4.52x101.05, 4.52x100.96 suggesting
the presence of six anomeric protons and carbons in it. The presence of seven anomeric
proton doublets were confirmed by five anomeric signals in 1H NMR i.e. at δ 6.17,
5.37(2H), 4.77(1H), 4.59(1H), 4.52(2H) in the 1H NMR spectrum of riesose acetate in
CDCl3 at 300 MHz. The presence of seven anomeric carbons were confirmed by the
presence of six anomeric peak signals in 13C spectrum at δ 90.12(2C), 90.24(1C),
95.26(1C), 100.96(1C), 101.05(1C), 101.90(1C), of acetylated riesoses in CDCl3 at 300
MHz. These data suggested that compound riesose may be a Hexasccharide in its
reducing form. In 1H NMR spectrum of riesose acetate which contains seven anomeric
signals, out of which signal at δ 6.17 and 5.37 were assigned for downfield shifted α and
β anomeric protons of monosaccharide present at the reducing end suggested that
compound-D ‘riesose’ may be a hexasccharide in its reducing form. The hexaasccharide
nature of riesose was further supported by presence of five anomeric proton doublets for
six anomeric protons at δ 5.16(1H), 4.60 (1H), 4.52(1H), 4.39(2H), 4.21(1H) along with
two singlet at δ 1.94 and 1.86 for two methyl groups of NHCOCH3 at 300 MHz 1H NMR
spectrum of riesose in D2O. Further the ES mass spectrum of riesose showed the highest
mass ion peaks at m/z 1134 assigned to [M+Na+K]+ and m/z 1111 assigned to [M+K]+,
it also contain the molecular ion peak at m/z 1072 confirming the molecular weight as
1072 which was in agreement of derived composition C40H68O31N2. The reducing nature
of compound was further confirmed by methylglycosylation MeOH/H+ followed by its
acid hydrolysis, which led to isolation of α and β- methyl glucosides along with Gal,
GlcNac and GalNac, suggesting the presence of glucose at the reducing end, for
convenience all six monosaccharides denoted as S-1, S-2, S-3, S-4, S-5 and S-6. The
monosaccharide constituents in compound-D were confirmed by its killiani hydrolysis
under strong acidic condition, followed by paper chromatography and TLC. In this
hydrolysis four spots were found identical with the authentic samples of Glc, Gal,

xviii
GlcNac and GalNac by co-chromatography. Thus the hexasaccharide contained four
types of monosaccharides units i.e. Glc, Gal, GlcNac and GalNac. The positions of
glycosidation in the oligosaccharide were confirmed by position of anomeric signals,
S.R.G. and comparing the signals in 1H and 13C NMR of acetylated and deacetylated
oligosaccharide. The glycosidic linkages in riesose were assigned by the cross peaks for
glycosidically linked carbons with their protons in HSQC and HMBC spectrum of
acetylated riesose. The values of glycosidic linkage in HSQC spectrum are described as
under. Cross peak of H-4 and C-4 of β-Glc (S-1) at (3.8x76) showed 1→4 linkage of S-2
and S-1. Cross peak of H-2 and C-2 of βGal(S-2) at (3.80x72.3) showed 1→2 linkage
between S-3 and S-2 and cross peak of H-3 and C-3 of β-Gal(S-2) at (4.1x70) showed
1→3 linkage between S-4 and S-2. Cross peak of H-3 and C-3 of α-GlcNAc(S-3) at
(3.46x78) showed 1→3 linkage between S-6 and S-3. Cross peak of H-3 and C-3 of
βGal(S-4) at (4.2x70.5) showed 1→3 linkage between S-5 and S-4. On the basis of the
results obtained by comparison of chemical shifts of anomeric and ring protons and
carbons in 1H and 13C NMR of riesose and riesose acetate, results obtained from chemical
degradation, chemical transformation along with 2D NMR like COSY, TOCSY, HSQC,
HMBC experiments and mass spectrometry the structure of novel oligosaccharide riesose
was assigned as under-
RIESOSE

xix
CHAPTER-IV EXPERIMENTAL
This chapter deals with the experimental details of the chemical transformation
and chemical degradation. Various conditions adopted in acid hydrolysis and
deacetylation has been given in detail. Experimental conditions and details of different
instruments used are also been described.
BIBILIOGRAPHY
In this includes literature survey of important, recent and relevant references taken
from different journals and reference books. Survey of literature covers recent references
up to year 2015

CHAPTER I
INTRODUCTION
1
INTRODUCTION
Traditionally, carbohydrates were considered to be responsible for energy storage and as
skeletal components. However, this hypothesis was challenged in 1963 when a protein
was isolated from Canavalia ensiformis that demonstrated ability to bind to carbohydrates
on erythrocytes. In 1982 the first animal carbohydrate binding protein was identified, and
this sparked interest in the wider roles of carbohydrates and carbohydrate binding
proteins within biological systems. The carbohydrate binding proteins have been termed
lectins and it is now known that they are found in varying densities on all cell-surface
membranes1-4. The lectins interact specifically with oligosaccharides and glycoconjugates
(such as glycol-lipids and glycol-proteins) on surrounding cells via hydrogen bonding,
metal coordination, vanderwaals forces and hydrophobic interactions5,6. On the other
hand the molecular diversity reside in the carbohydrate structures is extremely high, it is
due to the occurrence of the two possible anomers and to the presence of four or five
attachment points per sugar unit with different stereochemistry, affording highly diverse
or complex linear or branched structures7. Due to their relevant biological role and
molecular diversity, carbohydrates are promising candidates for drug design and disease
treatment. It is believed that favorable interactions occur between the hydroxyl groups of
the carbohydrates and the amino acid functionalities of the proteins with recent advances
in analytical methods it is possible to deduce the structure of any complex carbohydrates
and hence identify new targets for glycobiology programmes8-13. Carbohydrate-based
therapeutics have received considerable attention in recent years. Diseases where
carbohydrate-based drugs are making an impact include cancer, diabetes, AIDS,
influenza, bacterial infections and rheumatoid arthritis14-22. Due to hydrophilic nature of
carbohydrates, they are generally located on the outside of cell membranes, so it is
postulated that the first contact that many cells have with each other will be via
interaction of the carbohydrates. They are therefore widely involved in cell-cell
recognition and cell-external agent interactions23. These interaction can initiate beneficial
biological events, such as fertilization, cell growth and differentiation (e.g., during
embryogenesis) and immune response, as well as detrimental disease processes, such as
inflammation, viral and bacterial infections and cancer metastasis. For example, a range

2
of tumor-associated carbohydrate antigens are known, including the O-linked glycan TN,
the carcinoma-associated Thomsen-Freidenreich T or TF antigen and sialyl TN or STN
antigen24-26. Carbohydrate antigens serve as diagnostic markers for specific tumor cells
and in some cases the presence of these antigens has been correlated with a more
aggressive disease state27. For example, the binding of TF to the asialylglycoprotien
receptor on hepatocytes is partly responsible for tumor cell metastasis in the liver. In
addition, many human pathogens, including the influenza virus, possess surface proteins
that complex with specific membrane-bound oligosaccharides on human cells28. Soluble
forms of human cell surfaces oligosaccharides components are being investigated and
developed for rational anti-infective drug design. The anti-infective carbohydrates and
their bio-mimetic can be administered in monomeric or multivalent form in solution, or
presented immobilized on accessible surfaces, to block or arrest the targeted adhesion
event. However, Anti-infective agents that are used clinically, include kanamycin used
when penicillin or other less toxic drugs cannot be used.
Fig- Kanamycin
An analogue of this, dibekacin, has anti-tuberculosis properties. Arbekacin an
aminoglycoside antibiotic that is currently on the market has antibacterial activity against
both Gram-positive and Gram-negative bacteria and is stable in the presence of
aminoglycoside-inactivating enzymes produced by methicillin-resistance
Statphylococcus aureus29. Carbohydrates vaccines are being analysed for their
effectiveness against various cancers and these rely on the generation of monoclonal
antibodies to tumor associated carbohydrate antigens30-33. The Sialyl TN glycopeptides is
found on the surface of several types of tumor cells, such as lung, breast, colon and
ovarian cancers. The usefulness of monoclonal antibodies to the globo H antigen which is
surface carbohydrate located on prostate, colon, Human breast and pancreatic tumor cells,
has also been probed34.

3
Fig- Globo-H
Saponins are found in various plant species and e.g. ginseng, liquorice, horse chestnuts,
ivy leaves, quillaia barks, primula roots, sarsaparilla roots and others have been used as
folk medicine35. The cardiac glycoside digoxin has been used for many years to treat
congestive heart failure, some recent studies showed that digoxin also has anti-cancer
activity and can be used as a novel cancer therapeutic agent36,37 antimicrobial, especially
antifungal, activities of many steroidal saponins have also been reported38-43.
Fig- Digoxin
Some saponins such as QS-21Aapi and QS-21Axyl has been used as the potent
immunoadjuvants for vaccine. Ginseng (Panax genus) family of Araliaceae has
produced more than 30 ginsenosides, considered to be the main active compounds in the
ginseng products44,45 which have Anti-inflammatry46, anticancer47,48, anti-diabetic49,50,
activites, and can prevent neurodegeneration51,52. OSW-1(A high potent anticancer
cholestane glycoside). OSW-1 and its analogues have been isolated from the bulbs of
Ornithogalum saundersiae, a perennial grown in southern Africa where it is cultivated as
a cut flower and garden plant53. These cholestane glycosides exhibited extremely potent
cytotoxicity against human promyelocytic leukemia HL-60 cells with IC50 between 0.1
and 0.3 nM. OSW-1, the major constituent, exhibited high potent activity against various
malignant tumor cells, including leukemia, mastrocarcinoma, lung adenocarcinoma,
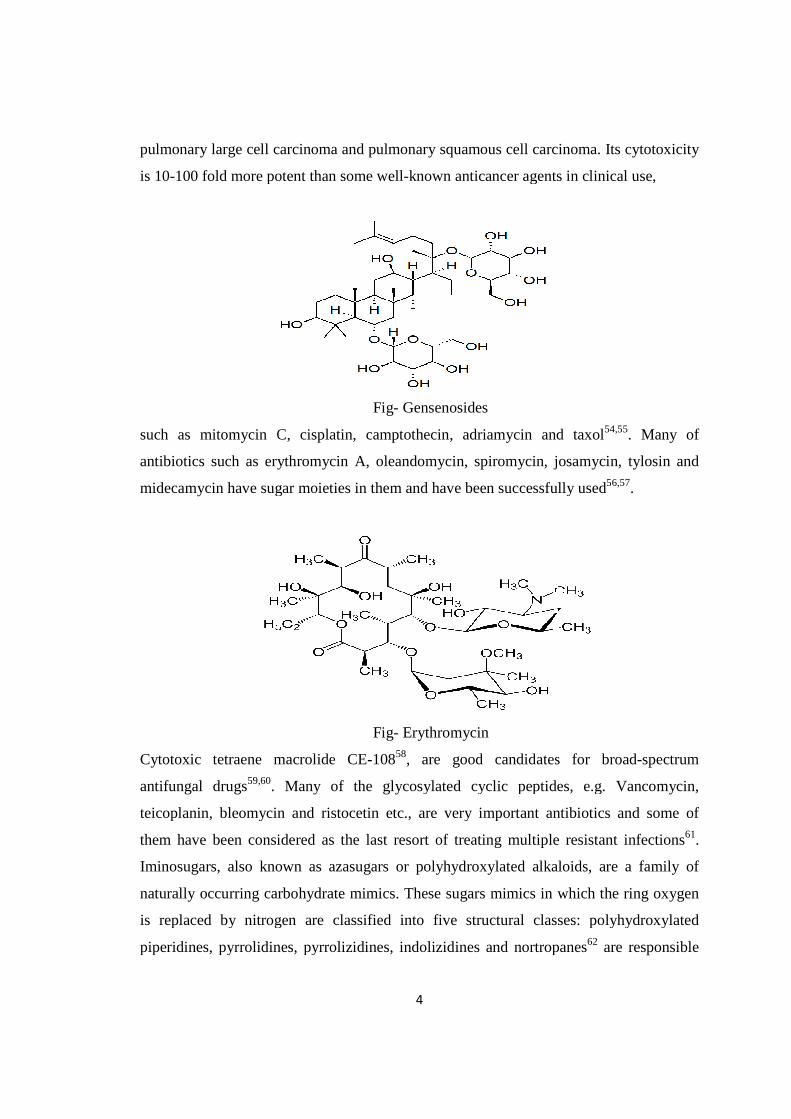
pulmonary large cell carcinoma and pulmonary squamous
is 10-100 fold more potent than some well
such as mitomycin C, cisplatin, camptothecin, adriamycin and taxol
antibiotics such as erythromycin A,
midecamycin have sugar moieties in them and
Cytotoxic tetraene macrolide CE
antifungal drugs59,60.
teicoplanin, bleomycin and ristocetin etc., are very important antibiotics and some of
them have been considered as the last resort of treating multiple resistant infections
Iminosugars, also known as azasugars or polyhydroxylated alkaloids, are a family of
naturally occurring carbohydrate mimics. These sugars mimics
is replaced by nitrogen are classified into five structural classes: polyhydroxylated
piperidines, pyrrolidines, pyrrolizidines,
4
pulmonary large cell carcinoma and pulmonary squamous cell carcinoma. Its
100 fold more potent than some well-known anticancer agents in clinical use,
Fig- Gensenosides
such as mitomycin C, cisplatin, camptothecin, adriamycin and taxol
such as erythromycin A, oleandomycin, spiromycin, josamycin, tylosin and
have sugar moieties in them and have been successfully used
Fig- Erythromycin
ytotoxic tetraene macrolide CE-10858, are good candidates for broad
. Many of the glycosylated cyclic peptides, e.g.
planin, bleomycin and ristocetin etc., are very important antibiotics and some of
them have been considered as the last resort of treating multiple resistant infections
Iminosugars, also known as azasugars or polyhydroxylated alkaloids, are a family of
naturally occurring carbohydrate mimics. These sugars mimics in
is replaced by nitrogen are classified into five structural classes: polyhydroxylated
piperidines, pyrrolidines, pyrrolizidines, indolizidines and nortropanes
cell carcinoma. Its cytotoxicity
anticancer agents in clinical use,
such as mitomycin C, cisplatin, camptothecin, adriamycin and taxol54,55. Many of
oleandomycin, spiromycin, josamycin, tylosin and
have been successfully used56,57.
, are good candidates for broad-spectrum
sylated cyclic peptides, e.g. Vancomycin,
planin, bleomycin and ristocetin etc., are very important antibiotics and some of
them have been considered as the last resort of treating multiple resistant infections61.
Iminosugars, also known as azasugars or polyhydroxylated alkaloids, are a family of
in which the ring oxygen
is replaced by nitrogen are classified into five structural classes: polyhydroxylated
indolizidines and nortropanes62 are responsible

for treating diabetes, viral infections and
isolated from Streptomyces griseus
isolated from natural sources have been widely used as antibacterial agen
against mycobacterium tuberculosis.
Recently, acrabose miglitol,
inhibit catalytic RNAs in vitro as well as to interfere with HIV replication by disruption
of essential protein-RNA
and Gaucher disease for example,
Relenza and Tamiflu were developed in recent years as competitive inhibitors against
influenza viral neuraminidase
combating the recent flu pandemic and epidemics. Cancer chemotherapy and AIDS
realated Kaposi’s sarcoma treated with Doxorubicin
adriamycinone and a sugar dauno
reducing end of the molecule i.e. fondapaarinux
Fomivirsen69 used in treatment of cytomegalovirus retinitis (CMV) in immune
compromised patients including those with AI
5
diabetes, viral infections and cancers. Streptomycin
from Streptomyces griseus63. Streptomycin and many other
isolated from natural sources have been widely used as antibacterial agen
against mycobacterium tuberculosis.
Fig- Streptomycin
acrabose miglitol, voglibiose and aminoglycosides have been demonstrated to
inhibit catalytic RNAs in vitro as well as to interfere with HIV replication by disruption
RNA contacts64,65 and used to treat diabetes, viral infections, cancers,
and Gaucher disease for example,
Fig- Acrabose
Relenza and Tamiflu were developed in recent years as competitive inhibitors against
influenza viral neuraminidase1-4 these two blockbuster “flu drugs” have important roles in
combating the recent flu pandemic and epidemics. Cancer chemotherapy and AIDS
realated Kaposi’s sarcoma treated with Doxorubicin66 i.e. a conjugat
adriamycinone and a sugar daunosamiine. A pentasaccharide with O
reducing end of the molecule i.e. fondapaarinux67,68 is used as an anticoagulant,
used in treatment of cytomegalovirus retinitis (CMV) in immune
compromised patients including those with AIDS also used as an anti
cancers. Streptomycin a amino glycoside
. Streptomycin and many other aminoglycosides
isolated from natural sources have been widely used as antibacterial agents, especially
aminoglycosides have been demonstrated to
inhibit catalytic RNAs in vitro as well as to interfere with HIV replication by disruption
to treat diabetes, viral infections, cancers,
Relenza and Tamiflu were developed in recent years as competitive inhibitors against
these two blockbuster “flu drugs” have important roles in
combating the recent flu pandemic and epidemics. Cancer chemotherapy and AIDS-
i.e. a conjugate of an antracyclin
pentasaccharide with O-methyl group at the
is used as an anticoagulant,
used in treatment of cytomegalovirus retinitis (CMV) in immune-
DS also used as an anti-viral drugs anti-

6
microbial stubs and orphan drugs. Sodium ferric gluconate70 complex iron dextran and
iron sucrose are some of the potential carbohydrate associated iron drugs used for
maintenance of iron storage in human body. Sialylated oligosaccharides appear to be an
essential receptor component for many animal virus families, such as Newcastle disease
virus (paramyxovirus), cardiovirus (picornvirus) murine and primate polyoavirus
(papovavirus), rheovirus, Helicobacter pylori, Mycaplasma pneumonia, and
enterotoxigenic and uropathogenic71-75. The oligosaccharide-containing moiety of
saponin halotoxin, which is isolated from sea cucumber stichopus japonicas exhibits
interesting antifungal properties76. β-Glycans, a branched glucose polymer found in
mushroom, yeast, bran act as a potent regulator of the immune system and have shown
anti-tumor activity, it inhibits cancer cell growth and metastasis and prevents bacterial
infection77. Recent research in the area of carbohydrate food ingredients has shown the
efficiency of oligosaccharides when they are used as prebiotics or biopreservatives78.
Milk oligosaccharides-
Oligosaccharides are natural constituents of all bacteria, fungi, plants, placental mammal
and Bovine milk79. Oligosaccharides are present in milk either in the form of free
molecules or conjugated with other compounds (e.g., as lipid-or protein-conjugated);
some of them actually represent dissolved receptors which can bind pathogens and thus
prevent their binding to the respective target receptor in GIT mucosa, and the follow-up
initiation of infection. The oligosaccharides isolated from various milk sources are
categorized in two classes i.e. sialylated oligosaccharides and non-sialylated
oligosaccharides. The majority of oligosaccharides with function are fucosylated. They
are produced through the action of enzymes encoded by genes associated with expression
of the Lewis blood system antigens. Therefore the specific antimicrobial activity of milk
fucosylated oligosaccharides is directly linked with the maternal Lewis blood group type.
The specific oligosaccharides are thus one of main innate immunological mechanism of
human milk, through which the mother protects an infant against enteric as well as other
pathogens. The knowledge of the structure and function of these protective
oligosaccharides could becomes a basis for the development of new preventive and the
therapeutically drugs against GIT pathogens80, 81. Sialyllactose is the only oligosaccharide
that, as a monovalent sugar, potently inhibits initial bacterial adhesion by detaching cell-

7
bound bacteria from human gastrointestinal monolayers in vitro82. It worth noting that a
number of anti-infective agents occur naturally, such as in human breast milk which
contains numerous soluble oligosaccharides that provide newborn babies with a
mechanism for aborting infection processes83, 84. A prominent example is the ..Galβ1-
4GlcNAcβ1-3Galβ1…trisaccharide that has proposed as a receptor for adherence of
Streptococcus pneumonia to buccal epithelial cells. At corresponding concentrations,
sialylated milk oligosaccharides strongly inhibit binding of influenza A virus and S-
fimbriated enteropathogenic Escherichia coli to their respective host cells. The milk is
rich source of bioactive oligosaccharides containing number of their origin to which
mammal they belongs. The oligosaccharides isolated from different milk exhibit potent
biological activities such as anti-tumor, immunological, anti-complimentary, anti-cancer,
anti-inflammatory, anti-coagulant, hypoglycemic and antiviral activities85, 86. Medicinal
and pharmaceutical researchers have unrevealed the importance of these oligosaccharides
and the milk of various sources, which are either used in folk medicine, or their
importance is reported in ancient medicinal system (Ayurveda and Unani). Milk
oligosaccharides which have been tested for their varied biological activities as described
as under.
The Elephant milk oligosaccharides fraction contained a high ratio of sialyl
oligosaccharide; this may be significant with respect to the formation of brain
components, such as gangliosides of the suckling calves87. N-acetylneuraminlactose
sulphate may play an important role in the nutrition of the rat pups, which is the dominant
oligosaccharide in the Dog milk88. Buffalo Milk oligosaccharides have ability to
stimulate non-immunological resistance of the host against parasitic infections89. Donkey
milk oligosaccharides have ability to stimulate non-specific and specific immunological
resistance90. Goat milk oligosaccharides play an important roles in intestinal protection
and repair after damage caused by DSS (Dextron sodium sulphate)- induced colitis and
their implication in human intestinal inflammation91. Goat milk oligosaccharides have
anti-inflammatory effects in rats with trinitrobenzenesulfonic (T) acid induced colitis and
may be useful in the management of inflammatory bowel disease92. Cow milk
oligosaccharides reduce the adhesion of enterotoxic Eschererchia coli strains of the calf93.
Bovine milk oligosaccharides have several potentially important biological activities

8
including the prevention of the pathogen binding to the intestinal epithelial and as
nutrients for beneficial bacteria79. Mare’s milk has shown anti oxidant, lipid lowering
and post heparin lipolytic activity94. Camel’s milk oligosaccharides show potent activity
against gonorrhea septic and hysteric properties. Sheep milk aggravates hiccup and
dyspnoea. It also eliminates pitta, kapha and fat. It also contains fucose in its
oligosaccharides which causes various biological activities.
SOME PHYSIOLOGICAL FUNCTIONS OF MILK OLIGOSACCHARID ES
Milk Oligosaccharides as a Pre-biotic Properties
Breast-fed infant micro biota is rich in bifido bacteria. Herein, human milk
oligosaccharides (HMOS) have ability to promote the growth of bifido bacteria and to
acidify their environment95. Pre-biotic are non-digestible food which beneficially affect
the host by selectively affecting the growth and activity of bacteria in colon and thus
improve the health of host. The human intestine lacks enzymes able to hydrolyze β-
glycosidic linkage with exception of lactose. Thus milk oligosaccharides are considered
to be indigestible96, 97 which reach the colon and are utilized by health promoting colonic
bacteria and known as prebiotic.
Milk Oligosaccharides as Immunomodulatries
Milk oligosaccharides may play a physiological role in modulating cellular
adhesion in vivo. The human milk derived acidic oligosaccharide fraction is found to
enhance the production of certain cytokines after long-term exposure (20d) in vitro in the
CD4+ as well as in the CD8+ T-cell subfraction98. Significantly oligosaccharide isolated
from buffalo milk89 possesses high degree of immunostimulant activity and proposed to
be very helpful in cure of AIDS patient.
Role of Oligosaccharides in Brain Development
Oligosaccharides along with lactose and sialic acid play role in postnatal brain
development. Gangliosides are complex glycosphingolipids, which make up 10% of the
total lipid mass in the brain and contain different numbers of negatively charged sialic
acid moieties. Brain tissue is unique in that the quantity of lipid-bound sialic acid exceeds
that of the protein-bound fraction. Gangliosides are hybrid molecules composed of a

9
hydrophilic sialyl oligosaccharide and a hydrophobic ceramide portion that consists of
sphingosine and fatty acids99. Many newborn mammals undergo a period of rapid
postnatal brain development that requires large amount of glycolipid, which are
components of cell membranes of neurons and myelin. Sialic acid present in human milk
also contribute to the increased concentration of NeuAc, present in cerebral and
cerebellar glycoconjugates of breast fed and thus play an important role in the
development of the infant brain100,101.Since elephant milk contain sialylated
oligosaccharides, it plays a definite role in brain development87.
Effect of Milk Oligosaccharides on Mineral Absorption
Several studies in animals and humans have shown positive effects of non-
digestible oligosaccharides (NDO) on mineral absorption and metabolism and bone
composition and architecture. These include inulin, oligofructose, fructooligosaccharides,
galactooligosaccharides, soybean oligosaccharide, and also resistant starches, sugar
alcohols, and di-fructose anhydride102.
Milk Oligosaccharides as Tumor marker
1-Monoclonal antibodies of several tumor cell lines and carbohydrate antigens
have provided evidence that membrane glycoprotein or glycolipid which may function as
differentiation antigens or tumor-associate antigens occur as free oligosaccharide in
human milk. 2-Two newly isolated oligosaccharides B-1 and B-2 both have the sialyl Lea
and Lex or Le-1 structure respectively. 3-The sialyl- Le structure in glycolipid or
glycoprotein has been defined as gastrointestinal tumor associated antigen. These
structures have been found in mucin type glycoprotein and glycolipid in a variety of
human cancer. Oligosaccharides having the sialyl-Lea and difucosyl Le-Le structure also
occur in human milk and Lea-Lex structure exhibits high affinity to an antibody directed
to a human squamous lung carcinoma103-105.
Factors Affecting Biological Activities in Milk
There are number of factors due to which different milk oligosaccharides show
varied biological activities. Some of the important factors Affecting Biological Activity
in milk are summarized as follows.
10
1. Milk oligosaccharides are non-digested due to the presence of β-glycosidic
linkage. So this β-glycosidic linkage plays a important role for its pre-biotic
activity106, 107.
2. Oligosaccharide mimics containing galactose and fucose specifically label tumour
cell surfaces and inhibit cell adhesion to fibronectin108.
3. Supplementation of milk formula with galacto-oligosaccharides improves
intestinal micro-flora and fermentation in term infants109.
4. Galactose and sialic acid present in milk oligosaccharide are required for optimal
development of the infant’s brain110.
5. N-and O-linked oligosaccharide causes the release of histamine and other
mediators of the allergenic response which then lead to the development of
allergenic symptoms111.
6. Human milk oligosaccharide containing α1, 2-linked fucose inhibits the stable
toxin-producing Escherichia coli in vitro, and its toxin induced secretary diarrhea
in vitro and in vivo112, 113.
7. Glycoconjugate found in human milk also inhibits binding by Campylobacter
jejuni in vitro and in vivo and also inhibit binding by calciviruses in vitro112, 113.
8. Specific fucosyl oligosaccharides of human milk have been observed to inhibit
specific pathogens112, 113.
9. Some important enteric pathogens, for example- rotavirus, are inhibited by human
milk oligosaccharide, α1, 2-linked fucosylated oligosaccharide, probably in
conjugation with other families of oligosaccharide, constitute a powerful innate
immune system of human milk112, 113.
10. Presence of sialic acid in human milk serves as anti-inflammatory components
and reduces platelet-neutrophill complex formation leading to a decrease in
neutrophill B2 integrin expression114.

11
11. Sialylated human milk oligosaccharide also inhibits binding of pathogenic strains
of Escherichia coli and ulcer-causing human pathogen H. pylori114.
12. Neutral human milk oligosaccharide may protect the intestinal tract of neonates
from Vibriocholera114.
13. The ability of rotavirus to infect MA-104 cells in culture is inhibited by human
milk, and this inhibition is due to a mucin-associated 46kDa milk glycoprotein
named lactadherin. Lactadherin from human milk also inhibits rotavirus (EDIM
strain) gastroenteritis in mice115.
Effect of Constituent Monosaccharides and Linkages on Biological Activity of Milk
Oligosaccharides
1. Human milk oligosaccharides containing α1, 2-linked fucose inhibits the stable
toxin-producing Escherichia coli in vitro and its toxin induced secretary diarrhea
in vitro and in vivo116,71. Glycoconjugates found in human milk also inhibit
binding by Campylobacter jejuni in vitro and in vivo and also inhibit binding by
calci viruses in vitro. Some specific fucosyl oligosaccharides of human milk have
been observed to inhibit specific pathogens. Thus it can be concluded that the
family of α1, 2-linked fucosylated oligosaccharides, probably in conjugation with
other families of oligosaccharide, constitute a powerful innate system of human
milk116.
2. Due to the presence of sialic acid in human milk they serve as anti-inflammatory
components and reduce platelet-neutrophill complex formation leading to a
decrease in neutophill B2 integrin expression, while neutral milk oligosaccharide
fraction has no effect. Sialylated human milk oligosaccharides also inhibit binding
of pathogenic strains of Escherichia coli and ulcer causing human pathogen H.
pylori. On the other hand neutral human milk oligosaccharide may protect the
intestinal tract of neonates from Vibrio cholera118, 119.
3. Prebiotic is non-digestible food ingredients that beneficially affect the host by
selectively affecting the growth and activity of bacteria in colon that can improve
12
the host health. Milk oligosaccharides are non-digested due to the presence of β-
glycosidic linkage. So this β-glycosidic linkage plays an important role for
prebiotic activity104, 120 of milk oligosaccharides.
4- Infection by rotavirus is responsible for much of the diarrhea in infants around the
world. The ability of rotavirus to infect MA-104 cells in culture is inhibited by
human milk, and this inhibition is due to mucin-associated 46kDa milk
glycoprotein named lactadherin121. Furthermore after sialic acid is removed from
lactadherin, its ability to inhibit rotavirus is essentially lost, which suggests that
the glycon portion of the molecule is responsible for inhibition and specific
terminal sialic acid is required for inhibition.
5. N- and O-linked oligosaccharides cause the release of histamine and other
mediators of the allergic response which then lead to the development of
allergenic symptoms. Oligosaccharides mimics containing galactose and fucose
specifically label tumor cell surface and inhibit cell adhesion to fibronectin122.
6. Supplementation of milk formula with galacto-oligosaccharides improves
intestinal micro-flora and fermentation in infants. Galactose and sialic acid
present in milk oligosaccharide are required for optimal development of the
infant’s brain 123
PROCESSES FOR ISOLATION OF MILK OLIGOSACCHARIDES:-
More than 200 milk oligosaccharides have been isolated till date and
characterized by the various workers still new oligosaccharides are being isolated from
the milk of different species, due to qualitative variation which arise due to genetic
factors, which reflected in their biosynthesis. The pioneer workers have isolated number
of milk oligosaccharides from the milk of different origins by processing the milk by
various processing techniques which were by KOBATA AND GINSBURG124, 125
URASHIMA et.al.,126 SMITH et.al.,127 EGGE et.al.128 WEIRUSZESKI et.al.129. The
method which have been used in this dissertation is modified method of Kobata and
ginsburg.
13
MODIFIED METHOD OF KOBATA AND GINSBURG FOR ISOLATIO N OF
MILK OLIGOSACCHARIDES 90
In the modified method of Kobata and Ginsberg milk was preserved with equal
amount of ethanol until used. Milk was centrifuged for 20 minutes at 5000 rpm at -4oC.
The solidified lipid layer was removed by filtration through glass wool. Ethanol was
added to clear filtrate to final concentration of 68 % and the resulting solution was left
overnight at 0oC. The white precipitate formed was mainly of Lactose and protein, was
removed by centrifugation, and washed twice with 68% ethanol at 0oC. The supernatant
and washings were combined and concentrated under reduced pressure, and passed
through a column of fine grade G-25 sephadex that had been washed with triple distilled
water overnight. The column was eluted with triple distilled water and effluents were
collected in fractions and aliquots of each fraction were analyzed for oligosaccharides
and fraction containing oligosaccharide were used for further studies.
PURIFICATION OF MILK OLIGOSACCHARIDES
Chromatography plays a major role in purification and analysis of milk
oligosaccharides. Chromatographic separations can be carried out by using a variety of
supports, including immobilized silica on glass plates (thin layer chromatography),
volatile gases (gas chromatography), paper (paper chromatography), and liquids which
may incorporate hydrophilic, insoluble molecules (liquid chromatography). High-
performance liquid chromatography (HPLC) is the most frequently used techniques for
separation of oligosaccharides. High pH anion exchange chromatography with pulsed
amperometric detection (HPAEC-PAD) is a powerful method, which is widely used for
carbohydrate analysis. The details of various chromatographic techniques used in
separation of oligosaccharides are described as below-
Thin Layer Chromatography130-132
TLC is suitable for analysis of monosaccharide’s and oligosaccharides. In TLC
plates, the stationary phase is a powdered adsorbent. The adsorbent used for separation of
oligosaccharides are magnesium silicate, alumina, silica gel that is fixed to an aluminum,
glass, or plastic plate. The resolution of mixture of compounds depends on the suitable
solvent system (mobile phase). Starting from non-polar single solvent system to highly

14
polar three solvent systems are available for thin layer chromatography. With increase in
the polarity of the solvent system, all the components of the mixture move faster (and
vice versa with lowering the polarity). Although the TLC is limited to less polar
compounds and it is not very effective for the isolation of highly polar compounds like
oligosaccharides and other glycoconjugates etc, however it could be useful in isolation of
derivatized oligosaccharides.
Paper Chromatography133
Paper Chromatography is a traditional technique used for the separation and
qualitative determination of milk oligosaccharides. Paper chromatography is a partition
chromatography in which distribution takes place between a stationary sorbed liquid
phase and a mobile fluid in intimate contact with it. Separations in Paper
Chromatography occur because of differential migration velocities through the sorbent
layer in a fixed separation time. For purification of milk oligosaccharides descending
paper chromatography was performed with following solvents on Whatman filter paper -
Upper layer of ethyl acetate-pyridine-H2O (2:1:2)
Ethyl acetate-pyridine-acetic acid-H2O (5:5:1:3)
2-propanol-H2O (4:1)
1-butanol-pyridine-H2O (6:4:3)
Lower layer of phenol- formic acid-2-propanol-H2O (8:5:1:2)
Upper layer of pyridine -ethyl actate-H2O (1:3.6:1.15)
Phenol-H2O-conc.NH4OH (150:40:1)
Upper layer of ethylacetate- acetic acid-H2O (3:1:3)
Ethanol-1M ammonium acetate pH 7.8 (5:2)
Oligosaccharides were located with AgNO3 reagent, aniline oxalate reagent or
periodate-benzidine reagent. Oligosaccharides containing N-acetyl amino sugars were
located with Morgan reagent, while sialic acid containing oligosaccharides were
developed with Thiobarbituaric acid (TBA) reagent.
Column Chromatography134
Column chromatography plays a very important role in purification of derivatized
oligosaccharides. It consists of a column of particulate material such as silica or alumina

15
and a solvent pass through it at atmospheric or low pressure. The separation can be
liquid/solid (adsorption) or liquid/liquid (partition). The sample is dissolved in suitable
solvent and applied to the column. The solvent elutes the sample through the column,
allowing the components to separate based on adsorption (alumina, silica) or partition
(cellulose, diatomaceous earth). Traditionally, the solvent was non-polar and the surface
polar, although today there are wide ranges of packing including bonded phase systems.
Bonded phase systems usually utilize partition mechanisms rather than adsorption. The
solvent is usually changed stepwise, and fractions are collected according to the
separation required, with the eluted solvent usually monitored by TLC.
High Performance Liquid Chromatography 135
High Performance Liquid Chromatography (HPLC) is one mode of
chromatography, one of the most used analytical techniques. This chromatographic
process can be defined as separation technique involving mass-transfer between
stationary and mobile phase. HPLC utilises a liquid mobile phase to separate the
components of a mixture. The stationary phase can be a liquid or a solid phase. These
components are first dissolved in a solvent, and then forced to flow through a
chromatographic column under a high pressure. In the column, the mixture separates into
its components. The amount of resolution is important, and is dependent upon the extent
of interaction between the solute components and the stationary phase. The stationary
phase is defined as the immobile packing material in the column. The interaction of the
solute with mobile and stationary phases can be manipulated through different choices of
both solvents and stationary phases. As a result, HPLC acquires a high degree of
versatility not found in other chromatographic systems and it has the ability to easily
separate a wide variety of chemical mixtures.
In recent years, HPLC has become the most important technique for separation of
complex mixture of oligosaccharides. HPLC is a technique by which molecules in
solution are separated according to differences in their molecular size, ionic properties or
affinity for column packing material. The three main techniques used in HPLC are ion
exchange chromatography, reversed phase chromatography (RPC) and affinity
chromatography. In ion exchange chromatography bonded silica and bonded glass with
ionic groups on their surfaces are used as stationary phase separation media. Ionic solute
16
molecules are attracted to the stationary phase ionic groups of the opposite charge and
during elution the retarded substances are reversibly charged for ions of the same charge.
Anion exchange HPLC has been recently developed and has exceptional resolving power
for complex oligosaccharides. Such analysis is carried out at high pH coupled with pulsed
amperometric detection (PAD), allowing separation of oligosaccharides and
polysaccharides upto DP≥ 50. The separation depends on the molecular size, sugar
composition and type of linkages between the monosaccharides units. In RPC the mobile
phase is polar (aq. solutions) and stationary phase is non-polar. By far the most frequently
used systems for separation of oligosaccharides are those using chemically bonded phase
which fractionate materials on the basis of their relative affinities for mobile phase and
bonded phase. The most important columns are those containing the aminopropyl bonded
phase. HPLC has emerged as a popular alternative method to other conventional methods
for the isolation and purification of oligosaccharides because of its speed of performance,
wide applicability, sensitivity and high resolution. For HPLC purification, a judicious
selection of operating parameters is required for achieving the desired purity and yield.
The following sequence is followed for better resolution and yield-
1. Choice of solvent system136 – The separation of different compounds from a mixture
can be achieved by choosing the solvent system appropriately. The separation of
compounds depends upon the different chemical and physical properties of the solvent. In
certain cases, TLC analysis of the sample is used as a first indication of the correct
operating conditions, silica gel plates for normal-phase column and sialylated silica gel
plates for reversed-phase columns.
2. Optimization of analytical columns of small quantities137- In order to save time,
sample and solvent required in the HPLC system a preliminary analytical search is
necessary for the right choice of conditions.
3. Optimization of analytical HPLC separation aiming for small capacity factors- A
good analytical HPLC separation is usually a prerequisite for a successful preparative
operation. Relative intention (selectively, α) is a very important parameter in determining
possible sample size and it is necessary to maximize this value.

17
4. Scaling of preparative HPLC apparatus138- In many preparative HPLC examples,
the column is actually overloaded, nonlinear absorption isotherms are obtained and peaks
are not symmetrical. Scaling-up a successful analytical separation may cause problems
associated with the solubility of the sample.
Normal Phase HPLC139
The extremely hydrophilic nature of oligosaccharides in principle makes them
eminently suitable for normal phase chromatography. However most commonly used
normal phase matrix, silica has not proven to be very useful for oligosaccharide
separations, but much success has been achieved using hydrophilic bonded phases,
especially amino propyl silica. Oligosaccharides injected onto the column in a high
organic (generally acetonitrile) aqueous solvent, are eluted from the column by an
increasing aqueous concentration gradient.
Reverse Phase HPLC (RP-HPLC)140
Reverse phase chromatography is so named because it behaves in the opposite
way to normal phase chromatography. Reverse phase chromatography is a powerful
analytical tool and involves a hydrophobic, low polarity stationary phase, which is
chemically bonded to an inert solid such as silica. The separation is essentially an
extraction operation and is useful for separating non-volatile components. Although RP-
HPLC is the most widely used HPLC technique for organic compounds due to high
chromatographic efficiency and selectivity, which leads to very weak interactions with
the column matrix. However RP-HPLC can give good separation of oligosaccharides that
have been made more hydrophobic by derivitization. Per-O-methylated and per-O-
acetylated oligosaccharides are hydrophobic and give good RP-HPLC separation.
Acetylation has the advantages of increased UV detection sensitivity and the option to
remove the acetyl group at later stage. Using water as the mobile phase, more polar
oligosaccharides elute before the less polar molecule. The retention time of underivatized
sugar in reversed phase increases with molecular mass and it is also observed that the
retention time of branched oligosaccharides is shorter than those of the linear
counterparts141,142. Sumiyoshi W et al analyzed major neutral oligosaccharides in the milk
of sixteen Japanese women by RP-HPLC and found that in colostrums and mature milk
(30 days lactation), lacto-N-fucopentose (LNFP I) was the most abundant

18
oligosaccharide, followed by 2′-focosyl lactose (2′-FL) + lacto-N-difucotetraose
(LNDFT), LNFP II + lacto-N-difucohexose (LNDFH II), and 3-focosyllactose (3-FL)143.
STRUCTURE DETERMINATION OF OLIGOSACCHARIDES
After the isolation of oligosaccharides the most important task is to elucidation
and determined the three dimensional structure of oligosaccharide. It has created new
demands for analytical tools for structure elucidation of complex oligosaccharides
comprising composition, sequence, branching and linkage analysis, including
anomericity and finally also rings size and absolute configuration. The structural analysis
of the carbohydrate is usually carried out by a combination of chemical and enzymatic
and physico-chemical methods. Some frequently used techniques are periodate oxidation,
smith degradation, permethylation analysis144-146, acetolysis, alakanine hydrolysis and
acid hydrolysis involving mild and strong acid hydrolysis. i.e. killiani hydrolysis147 gives
us the information regarding the monosaccharides constituents of oligosaccharide while
the mild acid hydrolysis i.e. mannich hydrolysis148 gives us the information of sequence
of monosaccharide in oligosaccharides. All the modern structural methods for
oligosaccharides, structure determination are NMR (1D and 2D techniques) in
combination with Mass spectroscopy yields the most complete structure of
oligosaccharides, with or without prior structural knowledge.
NMR Spectroscopy.149-153
Today, NMR has become a sophisticated and powerful analytical technology that
has found a variety of applications in many disciplines of scientific research, medicine,
and various industries. Nuclear magnetic resonance (NMR) Spectroscopy is the study of
molecular structure through measurement of the interaction of an oscillating radio
frequency electromagnetic field with a collection of nuclei immersed in a strong external
magnetic field. These nuclei are parts of atoms that, in turn, are assemble into molecules.
An NMR spectrum, therefore, can provide detailed information about molecular
structure, dynamics etc that would be difficult to obtain by any other methods. The NMR
spectra of oligosaccharides gave important information about the protons and carbons
present in the oligosaccharides. In the proton spectra of oligosaccharide, most of the
signal occur in the bulk region (3.4-4.5), hence identification of each signal is a difficult
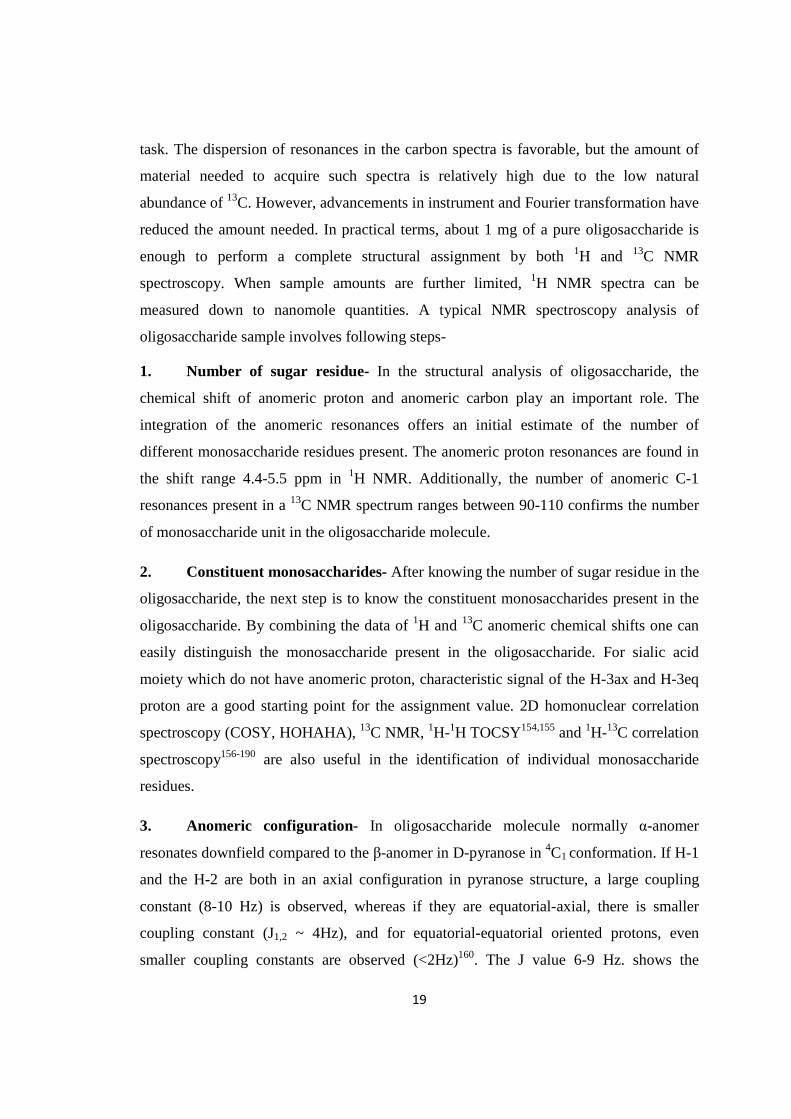
19
task. The dispersion of resonances in the carbon spectra is favorable, but the amount of
material needed to acquire such spectra is relatively high due to the low natural
abundance of 13C. However, advancements in instrument and Fourier transformation have
reduced the amount needed. In practical terms, about 1 mg of a pure oligosaccharide is
enough to perform a complete structural assignment by both 1H and 13C NMR
spectroscopy. When sample amounts are further limited, 1H NMR spectra can be
measured down to nanomole quantities. A typical NMR spectroscopy analysis of
oligosaccharide sample involves following steps-
1. Number of sugar residue- In the structural analysis of oligosaccharide, the
chemical shift of anomeric proton and anomeric carbon play an important role. The
integration of the anomeric resonances offers an initial estimate of the number of
different monosaccharide residues present. The anomeric proton resonances are found in
the shift range 4.4-5.5 ppm in 1H NMR. Additionally, the number of anomeric C-1
resonances present in a 13C NMR spectrum ranges between 90-110 confirms the number
of monosaccharide unit in the oligosaccharide molecule.
2. Constituent monosaccharides- After knowing the number of sugar residue in the
oligosaccharide, the next step is to know the constituent monosaccharides present in the
oligosaccharide. By combining the data of 1H and 13C anomeric chemical shifts one can
easily distinguish the monosaccharide present in the oligosaccharide. For sialic acid
moiety which do not have anomeric proton, characteristic signal of the H-3ax and H-3eq
proton are a good starting point for the assignment value. 2D homonuclear correlation
spectroscopy (COSY, HOHAHA), 13C NMR, 1H-1H TOCSY154,155 and 1H-13C correlation
spectroscopy156-190 are also useful in the identification of individual monosaccharide
residues.
3. Anomeric configuration- In oligosaccharide molecule normally α-anomer
resonates downfield compared to the β-anomer in D-pyranose in 4C1 conformation. If H-1
and the H-2 are both in an axial configuration in pyranose structure, a large coupling
constant (8-10 Hz) is observed, whereas if they are equatorial-axial, there is smaller
coupling constant (J1,2 ~ 4Hz), and for equatorial-equatorial oriented protons, even
smaller coupling constants are observed (<2Hz)160. The J value 6-9 Hz. shows the

20
presence of β-configuration where as J value 3-4 Hz. shows the presence of α-
configuration.
4. Linkages and sequence- The 1H and the 13C chemical shifts give an indication of
the linkage of complete oligosaccharide moiety. The effect of glycosylation depends on
the linkage type, and the changes in the chemical shift are in generally larger at the
glycosylation site than at neighboring positions. Primary information regarding the
glycosidic linkages is provided by comparison of 1H NMR chemical shift of methine
proton of natural oligosaccharide and acetylated oligosaccharide which generally shifted
about 1ppm downfield. HMBC and inter-residue NOEs experiment give information
about the glycosidic linkage. An effective way of knowing the glycosidic linkage
between two monosaccharide residues is by monitoring the nuclear overhauser effect
(NOE) from the signal for an anomeric group to the hydrogen of the substituted position
in the adjacent ring161, 162. However information obtained from COSY and TOCSY
experiments are also very useful.
5. Position of appended groups- A non-carbohydrate group like a methyl, acetyl,
sulfate, or a phosphate group shifts the proton and carbon where the appended group is
located. In the case of acetyl group attached, the proton corresponding to reducing sugar
downfield shifted by ~1.0-1.2 ppm whereas other protons downfield shifted by 0.1-0.2
ppm. In other cases downfield shifts ~ 0.2-0.5 ppm163 were observed in values for protons
where appended group is attached. This places these resonances in a less crowded area of
the spectra and helped in the identification of novel residues.
6. Structure Reporter Group- Since the NMR data of oligosaccharide are highly
complex, Vligenthart et.al. Introduced the “structural reporter group” (SRG)164-170
concept, which was based on signals outside the bulk region ( 3-4) in the 1H NMR
spectra of the oligosaccharide. This structural reporter group concept helped in the
identification of novel residues and characterization of oligosaccharides.
Different NMR Technique in Structure Elucidation of Milk Oligosaccharides
The structure of milk oligosaccharides has been determined by comparison of
NMR data of the new isolated compound with the reference data of different core units

21
found in milk oligosaccharides. While comparing the chemical shift values it is important
that the reference data is measured at the same temperature and the data are based on
same internal reference or one that can be correlated in a simple manner. Different NMR
experiments useful in structure elucidation of oligosaccharides are as below-
1H NMR Spectroscopy of Oligosaccharides
The 1H NMR is the most basic and important experiment of NMR series. It
provides maximum information regarding configuration and conformation of
monosaccharides present in the oligosaccharides. The limitation of resolution of
anomeric and ring protons is already surpassed by advances of Fourier transformation
and high frequency NMR spectrometers. The high resolution 1H NMR spectra give
valuable information about qualitative and quantitative aspects of the oligosaccharides
structure. The chemical shift of a particular anomeric proton and its splitting pattern gives
an idea of the monosaccharide units presents there in, simultaneously it also fixes the
configuration of sugar linkage and conformation of that monosaccharide unit. The proton
NMR spectroscopy of carbohydrates suffers from severe spectral overlap, because most
of the monomer residues differ only in their stereochemistry and their magnetic
properties are only little influenced by their position in chain. Since the chemical shift of
anomeric protons and methine protons of different sugars are confined to the region 4.3-
5.5 and 3.0-4.2 respectively hence it requires expert interpretation of spectra for
monosaccharide identification. The analysis of reducing oligosaccharides showed that the
anomeric configuration of the reducing end sugar also exerts its influence on the spectral
parameters of residues in its spatial neighborhood, being sometimes even the non-
reducing end sugar. To resolve the spectral complexities of oligosaccharides, Vligenthart
et.al. introduced the “structural reporter group” concept, which was based on signals
outside the bulk region (3-4) in the 1H NMR spectra of the oligosaccharide170. This
approach is used to identify individual sugars or sequence of residues. These structural
reporter groups include anomeric proton, equatorial protons, deoxy protons and that
distinct functional group such as amide group. 1H NMR gives anomeric protons at 4.3-5.9
ppm, methyl doublets of 6-deoxy sugars at 1.1-1.3 ppm, methyl singlet of acetamido
groups at 2.0-2.2 ppm and various others with distinctive chemical shift. In D-pyranoses
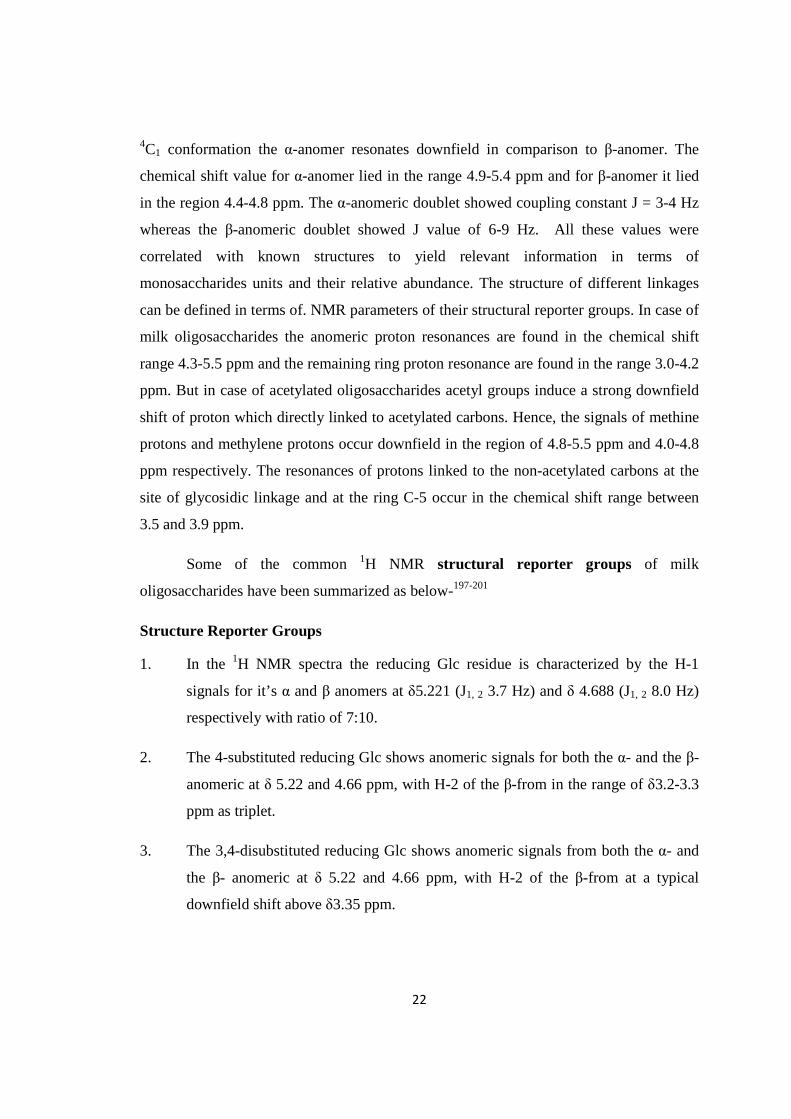
22
4C1 conformation the α-anomer resonates downfield in comparison to β-anomer. The
chemical shift value for α-anomer lied in the range 4.9-5.4 ppm and for β-anomer it lied
in the region 4.4-4.8 ppm. The α-anomeric doublet showed coupling constant J = 3-4 Hz
whereas the β-anomeric doublet showed J value of 6-9 Hz. All these values were
correlated with known structures to yield relevant information in terms of
monosaccharides units and their relative abundance. The structure of different linkages
can be defined in terms of. NMR parameters of their structural reporter groups. In case of
milk oligosaccharides the anomeric proton resonances are found in the chemical shift
range 4.3-5.5 ppm and the remaining ring proton resonance are found in the range 3.0-4.2
ppm. But in case of acetylated oligosaccharides acetyl groups induce a strong downfield
shift of proton which directly linked to acetylated carbons. Hence, the signals of methine
protons and methylene protons occur downfield in the region of 4.8-5.5 ppm and 4.0-4.8
ppm respectively. The resonances of protons linked to the non-acetylated carbons at the
site of glycosidic linkage and at the ring C-5 occur in the chemical shift range between
3.5 and 3.9 ppm.
Some of the common 1H NMR structural reporter groups of milk
oligosaccharides have been summarized as below-197-201
Structure Reporter Groups
1. In the 1H NMR spectra the reducing Glc residue is characterized by the H-1
signals for it’s α and β anomers at δ5.221 (J1, 2 3.7 Hz) and δ 4.688 (J1, 2 8.0 Hz)
respectively with ratio of 7:10.
2. The 4-substituted reducing Glc shows anomeric signals for both the α- and the β-
anomeric at δ 5.22 and 4.66 ppm, with H-2 of the β-from in the range of δ3.2-3.3
ppm as triplet.
3. The 3,4-disubstituted reducing Glc shows anomeric signals from both the α- and
the β- anomeric at δ 5.22 and 4.66 ppm, with H-2 of the β-from at a typical
downfield shift above δ3.35 ppm.
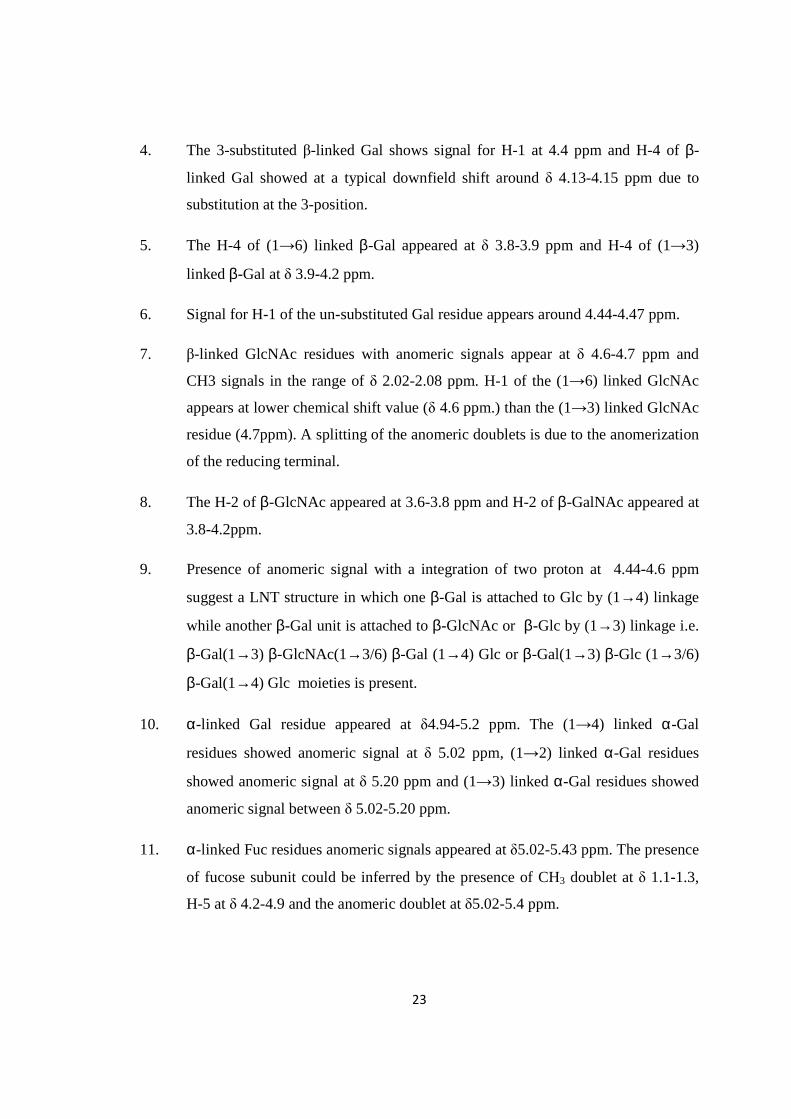
23
4. The 3-substituted β-linked Gal shows signal for H-1 at 4.4 ppm and H-4 of β-
linked Gal showed at a typical downfield shift around δ 4.13-4.15 ppm due to
substitution at the 3-position.
5. The H-4 of (1→6) linked β-Gal appeared at δ 3.8-3.9 ppm and H-4 of (1→3)
linked β-Gal at δ 3.9-4.2 ppm.
6. Signal for H-1 of the un-substituted Gal residue appears around 4.44-4.47 ppm.
7. β-linked GlcNAc residues with anomeric signals appear at δ 4.6-4.7 ppm and
CH3 signals in the range of δ 2.02-2.08 ppm. H-1 of the (1→6) linked GlcNAc
appears at lower chemical shift value (δ 4.6 ppm.) than the (1→3) linked GlcNAc
residue (4.7ppm). A splitting of the anomeric doublets is due to the anomerization
of the reducing terminal.
8. The H-2 of β-GlcNAc appeared at 3.6-3.8 ppm and H-2 of β-GalNAc appeared at
3.8-4.2ppm.
9. Presence of anomeric signal with a integration of two proton at 4.44-4.6 ppm
suggest a LNT structure in which one β-Gal is attached to Glc by (1→4) linkage
while another β-Gal unit is attached to β-GlcNAc or β-Glc by (1→3) linkage i.e.
β-Gal(1→3) β-GlcNAc(1→3/6) β-Gal (1→4) Glc or β-Gal(1→3) β-Glc (1→3/6)
β-Gal(1→4) Glc moieties is present.
10. α-linked Gal residue appeared at δ4.94-5.2 ppm. The (1→4) linked α-Gal
residues showed anomeric signal at δ 5.02 ppm, (1→2) linked α-Gal residues
showed anomeric signal at δ 5.20 ppm and (1→3) linked α-Gal residues showed
anomeric signal between δ 5.02-5.20 ppm.
11. α-linked Fuc residues anomeric signals appeared at δ5.02-5.43 ppm. The presence
of fucose subunit could be inferred by the presence of CH3 doublet at δ 1.1-1.3,
H-5 at δ 4.2-4.9 and the anomeric doublet at δ5.02-5.4 ppm.

24
12. Generally (1→4) linked fucose occur near δ4.98ppm, (1→2) linked fucose occur
near δ5.38ppm and (1→3) linked fucose occur between the two.
13. The presence of sialic acid residue could be ascertained by the characteristic
resonances of H-3 axial and equatorial protons at 1.78 and 2.75 ppm respectively.
The location of Neu5Ac residue can be deduced as follows. (a) the signal for H-3a
and H-3e of Neu5Ac residue can be used to discriminate between (2-3) and (2-6)-
α-linkage to Gal. (b) for an α-Neu5Ac(2-3)-β-Gal-(1- sequence, the signal for H-3
of Gal residue is shifted downfield by 0.6 ppm of the ring protons.
14. The 3, 6-di-substituted β-linked Gal shows signal for H-1 at 4.4ppm and H-4 at a
typical downfield shift around 4.13-4.15 ppm, due to substitution in the 3-
position by a β -linked GlcNAc residue.
15. The location of Neu5Ac residue can be deduced as follows –
(a) The signal for H-3a and H-3e of the Neu5Ac residue can be used to
discriminate between (2-3) and (2-6)-α - linkages to Gal.
(b) For an α-Neu5Ac(2-3)- -Gal-1- sequence, the signal for H-3 of the Gal
residue is shifted down field of the ring protons by 0.6 ppm. Also, in a β-
GlcNAc-(1-3)-β-Gal-1- sequence, the signal for H-4 0f the Gal residue
appears at 4.15ppm.
16. The presence of α-Gal subunit could be inferred by the presence of the anomeric
doublet at 5.14-5.25ppm and H-4 doublet at 4.09-4.25.
17. Linkage of Gal(S4) to GlcNAc(S3) in LNT and LNeoT is confirmed by the
chemical shift value of Gal(S4).If its chemical shift value is exactly similar to that
of lactose′s Gal(S2) than it would be 1-4 linked to GlcNAc(S3)otherwise it would
be 1-3 linked to GlcNac(S3).
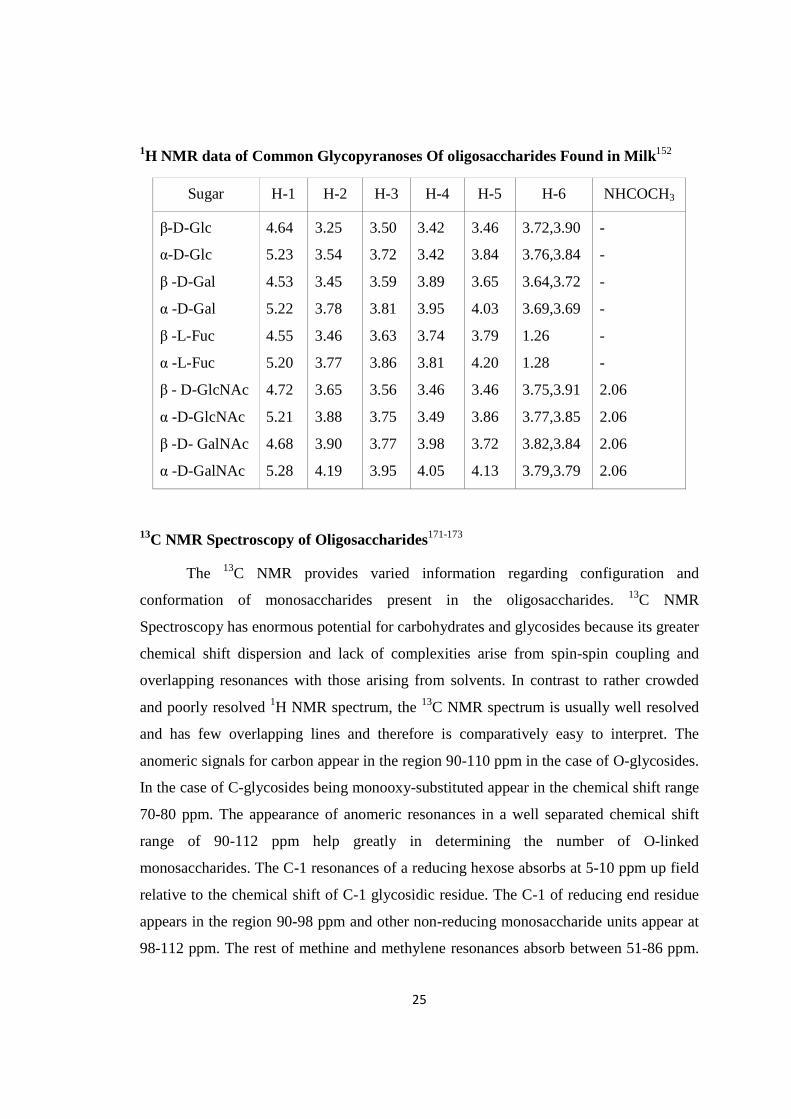
25
1H NMR data of Common Glycopyranoses Of oligosaccharides Found in Milk152
Sugar H-1 H-2 H-3 H-4 H-5 H-6 NHCOCH3
β-D-Glc
α-D-Glc
β -D-Gal
α -D-Gal
β -L-Fuc
α -L-Fuc
β - D-GlcNAc
α -D-GlcNAc
β -D- GalNAc
α -D-GalNAc
4.64
5.23
4.53
5.22
4.55
5.20
4.72
5.21
4.68
5.28
3.25
3.54
3.45
3.78
3.46
3.77
3.65
3.88
3.90
4.19
3.50
3.72
3.59
3.81
3.63
3.86
3.56
3.75
3.77
3.95
3.42
3.42
3.89
3.95
3.74
3.81
3.46
3.49
3.98
4.05
3.46
3.84
3.65
4.03
3.79
4.20
3.46
3.86
3.72
4.13
3.72,3.90
3.76,3.84
3.64,3.72
3.69,3.69
1.26
1.28
3.75,3.91
3.77,3.85
3.82,3.84
3.79,3.79
-
-
-
-
-
-
2.06
2.06
2.06
2.06
13C NMR Spectroscopy of Oligosaccharides171-173
The 13C NMR provides varied information regarding configuration and
conformation of monosaccharides present in the oligosaccharides. 13C NMR
Spectroscopy has enormous potential for carbohydrates and glycosides because its greater
chemical shift dispersion and lack of complexities arise from spin-spin coupling and
overlapping resonances with those arising from solvents. In contrast to rather crowded
and poorly resolved 1H NMR spectrum, the 13C NMR spectrum is usually well resolved
and has few overlapping lines and therefore is comparatively easy to interpret. The
anomeric signals for carbon appear in the region 90-110 ppm in the case of O-glycosides.
In the case of C-glycosides being monooxy-substituted appear in the chemical shift range
70-80 ppm. The appearance of anomeric resonances in a well separated chemical shift
range of 90-112 ppm help greatly in determining the number of O-linked
monosaccharides. The C-1 resonances of a reducing hexose absorbs at 5-10 ppm up field
relative to the chemical shift of C-1 glycosidic residue. The C-1 of reducing end residue
appears in the region 90-98 ppm and other non-reducing monosaccharide units appear at
98-112 ppm. The rest of methine and methylene resonances absorb between 51-86 ppm.

26
The appearance of methine resonances between 52-57 ppm174 is generally associated with
amino substituted carbon signals at an amino sugar residue. Low field absorption in the
region 169-178 ppm177 reflects the presence of a carboxylic group of hexapyranoic acids
or the carbonyl group of acetamido sugars. The presence of an acetaamido sugar may
further be complemented by the appearance of methyl resonances in the region 20-24
ppm. The spectral region between 57-64 ppm174 contains signals for all the un-substituted
hydroxy methylene resonances C-6, whereas methyl resonances of 6-deoxy sugars
generally appear in the region 16-19 ppm175, 176.
Since naturally occurring monosaccharides are generally hexoses or pentoses
therefore, each hexose and pentose unit introduces either six or five resonances,
respectively. Accordingly in a well-resolved 13C NMR spectrum, in most cases the
number of monosaccharide residues can be easily ascertained by simply dividing the total
number of signal absorbing between 60-85 ppm either by five or four or by combination
of both. In a hexose monosaccharide besides the anomeric signal it give rise to five
resonances whereas in case of 6-deoxy hexose and pentose it give rise to four resonances
in the above mentioned chemical shift range. The coupling pattern for GalNAc and
GlcNAc in 1H NMR is similar to Gal and Glc respectively but in 13C NMR an up-field
shift of δ C2α 55.4, δ C2 58ppm for GlcNAc and an upfield shift of δ C2α 51.4, δ C2β 54.9
ppm for GalNAc has been reported. In the chemical shift analogy method the chemical
shifts of carbon atoms in identical residues of similar oligosaccharide structure will be
influenced only by glycosylation shifts, primarily by the δ shift (approximately 8 ppm
downfield) for a substituted carbon atom and secondarily by the β shift (1-2 ppm up-
field) for those carbon atoms adjacent to the linkage position. The 13C chemical shift
reveals the anomeric configuration in a manner similar to the proton chemical shift but
most importantly the one bond 13C-1H coupling constant in pyranoses can be used to
determine the anomeric configuration. For D sugars in the 4C1 conformation a JC1, H1170
indicates an α-anomeric sugar whereas JC1, H1160 indicates an β-anomeric sugar
configuration177
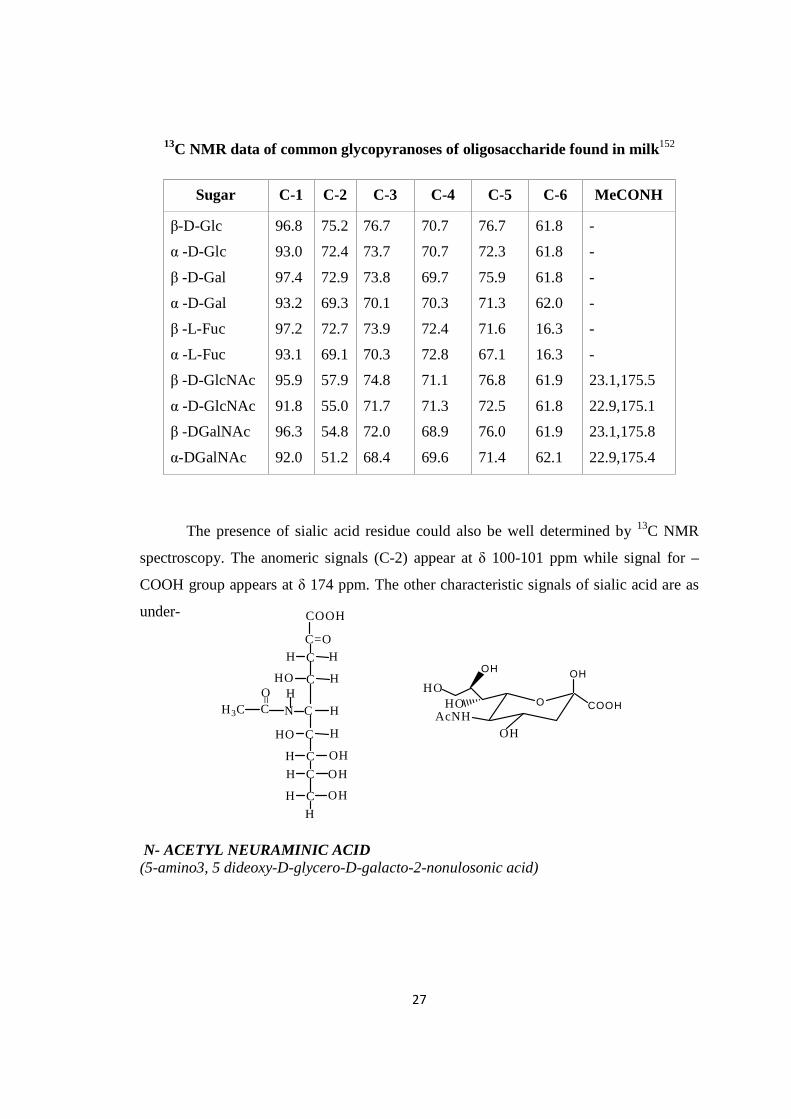
27
13C NMR data of common glycopyranoses of oligosaccharide found in milk152
Sugar C-1 C-2 C-3 C-4 C-5 C-6 MeCONH
β-D-Glc
α -D-Glc
β -D-Gal
α -D-Gal
β -L-Fuc
α -L-Fuc
β -D-GlcNAc
α -D-GlcNAc
β -DGalNAc
α-DGalNAc
96.8
93.0
97.4
93.2
97.2
93.1
95.9
91.8
96.3
92.0
75.2
72.4
72.9
69.3
72.7
69.1
57.9
55.0
54.8
51.2
76.7
73.7
73.8
70.1
73.9
70.3
74.8
71.7
72.0
68.4
70.7
70.7
69.7
70.3
72.4
72.8
71.1
71.3
68.9
69.6
76.7
72.3
75.9
71.3
71.6
67.1
76.8
72.5
76.0
71.4
61.8
61.8
61.8
62.0
16.3
16.3
61.9
61.8
61.9
62.1
-
-
-
-
-
-
23.1,175.5
22.9,175.1
23.1,175.8
22.9,175.4
The presence of sialic acid residue could also be well determined by 13C NMR
spectroscopy. The anomeric signals (C-2) appear at δ 100-101 ppm while signal for –
COOH group appears at δ 174 ppm. The other characteristic signals of sialic acid are as
under-
N- ACETYL NEURAMINIC ACID (5-amino3, 5 dideoxy-D-glycero-D-galacto-2-nonulosonic acid)
C
C
C
C
COOH
C=O
C
=
H3C
OH
OH
OH
N
C
H
H
H
C
H
H
HO
HO
CO
H
HH
H
H
O
OHOH
COOHAcNH
HOHO
OH

28
13C and 1H NMR values of Sialic acid residue found in Milk178
Sialic acid residue 1H Chemical Shift 13C Chemical Shift
- Neuraminic- 5Ac 1 2
3ax
3eq
4
5
6
7
8
9
9’
C=O CH3
-
-
1.693-1.801
2.668-2.762
3.56-3.68
3.79-3.85
3.63-3.71
3.55-3.65
3.86-3.90
3.64
3.87-3.88
-
2.025-2.038
174.0-174.6
100.2-101.0
40.5-41.0
-
69.0-69.3
52.5-52.7
73.3-73.7
69.0-69.3
72.5-72.7
63.3-63.9
-
175.7-175.8
22.8-22.9
Two Dimensional NMR Spectroscopy164
Although the one dimensional NMR experiments provides enormous information
regarding the structure of oligosaccharide but due to overcrowding in anomeric and ring
proton chemical shift region it is not possible to perform unambiguous assignments of
anomeric and ring protons. Further this substantial overlapping could be well resolved by
the two dimensional NMR experiments. The structure elucidation of oligosaccharides is
the unambiguous assignment of the 1H resonances of individual sugar residues, is poorly
resolved in the region of ring protons i.e. from 3.2-4.2 ppm. For the structure
determination, it is important to observe the individual components of the overlapping
multiplets. The general approach is to assign an isolated resonance often an anomeric
proton (4.3-5.5 ppm) or the methyl resonance (1.2-1.4 ppm) in 6-deoxy sugars, then to
correlate spins in a step-wise manner around the spin system of the ring. However, spin
correlation can be done by one-dimensional difference decoupling experiments if only
few assignments are needed. These difficulties could be overcome by the use of modern

29
two-dimensional NMR experiments because they are more efficient for the simultaneous
determination of a large number of spin correlations. 2D NMR spectroscopy provides
actual, high quality and well interpretable data of the sugar molecule. Chemical shift
correlation maps obtained by 2D NMR experiments are found to be extremely useful in
the identification of components of oligosaccharides, without relying on the analogy with
any reference data. There are two fundamental types of 2D NMR spectroscopy. The first
is correlated spectroscopy, in which both frequency axis contain chemical shift
information and the other is J resolved spectroscopy in which one frequency axis contains
spin coupling (J) and other chemical shift (δ) information. Correlated 2D NMR
spectroscopy may be divided into two groups based on the mechanism of interaction
producing the observed signals. The first group includes COSY and its descendants,
HOHAHA, HETCOR and HMQC based on scalar coupling through coherent transfer of
transverse magnetization, and reveals through bond connectivity. The second group based
on dipole couplings through incoherent transfer of magnetization and provides
information through space connectivity, the NOESY experiment is representative of this
group. Salient features of two-dimensional NMR spectroscopy applied to
oligosaccharides are described as below-
Correlated Spectroscopy (COSY)179, 180
COSY technique is also known as JEENER experiment and is one of the
important 2D NMR spectroscopic methods for structure determination. 1H-1H COSY
(correlated Spectroscopy) is useful for determining signals which arise from neighboring
protons, especially when the multiplet overlap or there is extensive second order
coupling. A COSY spectrum yields through bond correlation via spin-spin coupling.
There are two types of correlation spectroscopy i.e. HOMOCOSY and HETEROCOSY.
In homonuclear shift correlation 2D experiments, the correlation is between similar
nuclei i.e. either 1H-1H or 13C-13C. The normal NMR spectra are plotted on a two
frequency axis and the conventional 1D spectrum appears along the diagonal. The clear
representation of 2D NMR spectrum is obtained as contour plots of mutual coupling
which exists between two nuclei (1H-1H, 13C-13C), cross peak appears at the chemical
shift coordinates (X, Y) and (Y, X). Identification of monosaccharide units is first
approached by analyzing the 1H homonuclear shift-correlation spectra. COSY spectra
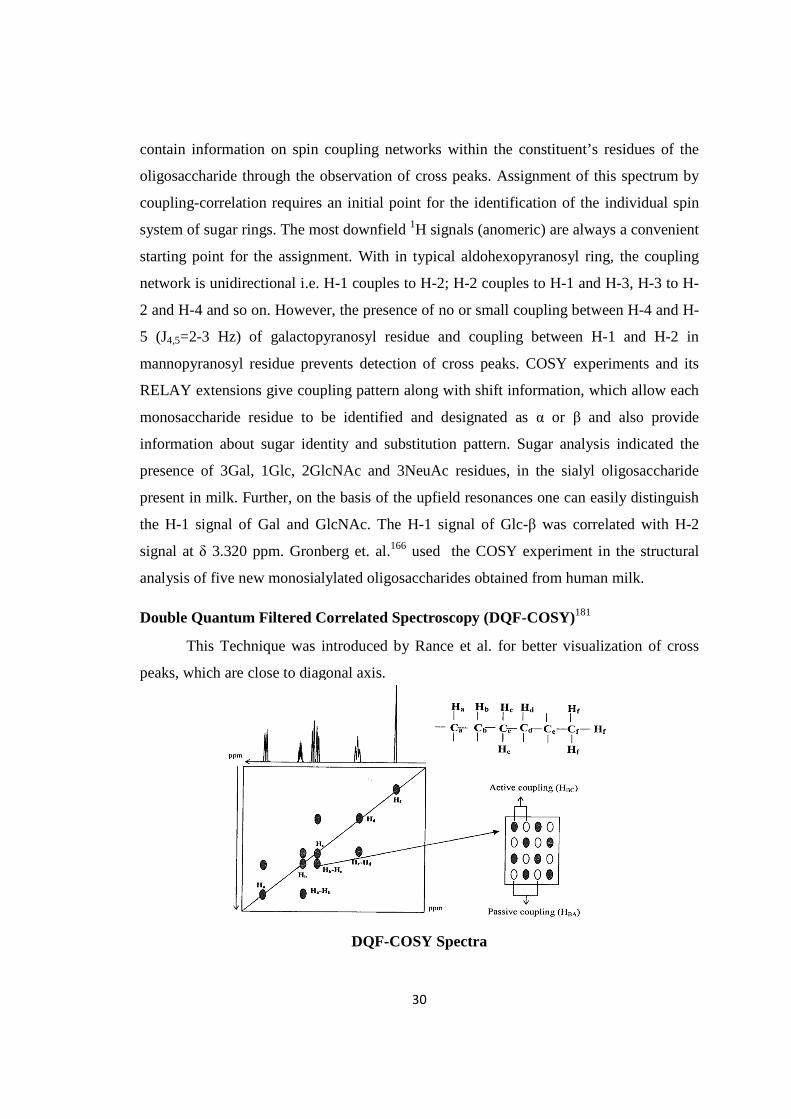
30
contain information on spin coupling networks within the constituent’s residues of the
oligosaccharide through the observation of cross peaks. Assignment of this spectrum by
coupling-correlation requires an initial point for the identification of the individual spin
system of sugar rings. The most downfield 1H signals (anomeric) are always a convenient
starting point for the assignment. With in typical aldohexopyranosyl ring, the coupling
network is unidirectional i.e. H-1 couples to H-2; H-2 couples to H-1 and H-3, H-3 to H-
2 and H-4 and so on. However, the presence of no or small coupling between H-4 and H-
5 (J4,5=2-3 Hz) of galactopyranosyl residue and coupling between H-1 and H-2 in
mannopyranosyl residue prevents detection of cross peaks. COSY experiments and its
RELAY extensions give coupling pattern along with shift information, which allow each
monosaccharide residue to be identified and designated as α or β and also provide
information about sugar identity and substitution pattern. Sugar analysis indicated the
presence of 3Gal, 1Glc, 2GlcNAc and 3NeuAc residues, in the sialyl oligosaccharide
present in milk. Further, on the basis of the upfield resonances one can easily distinguish
the H-1 signal of Gal and GlcNAc. The H-1 signal of Glc-β was correlated with H-2
signal at δ 3.320 ppm. Gronberg et. al.166 used the COSY experiment in the structural
analysis of five new monosialylated oligosaccharides obtained from human milk.
Double Quantum Filtered Correlated Spectroscopy (DQF-COSY)181
This Technique was introduced by Rance et al. for better visualization of cross
peaks, which are close to diagonal axis.
DQF-COSY Spectra

31
It can be achieved by the introduction of a double quantum filter, which generates
a COSY spectrum having both cross peaks and a diagonal multiplet antiphase structure. It
provides a clear and accurate way of obtaining chemical shift values of coupled protons.
Furthermore, DQF-COSY spectra suppress the detection of spin-isolated protons (i.e.
uncoupled protons) such as those arising from solvent or isolated methyl groups. The
suppression of these signals is useful when they occurred in crowded regions of the
spectrum. H. Fiewer et. al. used the DQF-COSY experiment182 in the structural
elucidation of octasaccharide isolated from human milk.
Triple Quantum Filtered Correlated Spectroscopy (TQF-COSY)183
In some cases COSY employing a triple quantum filter can further edit COSY
spectra of oligosaccharides. This technique is applied often to assist in the detection and
assignment of H-6 and H-6′ protons of constituent aldohexopyranosyl rings containing an
exocyclic hydroxymethyl group (isolated hydroxymethyl groups, such as those appended
to C-2 of 2-ketoses, will not be detected by TQF-COSY).
Relay Correlation Spectroscopy (RELAY-COSY)184
In this type of COSY, the anomeric proton not only correlates with H-2 proton,
but also with other intra residue protons (H-3, H-4, H-5, H-6) in a well resolved region of
2D spectrum. The assignment of H-6 is less successful in this method.
In Adequate Spectroscopy (IN ADEQUATE)185
The two dimensional ‘incredible natural abundance double quantum transfer
experiment’ provides direct information on carbon bonding and thus can be used to trace
the entire carbon skeleton of the molecule.
Spin-Echo Correlation spectroscopy (SECSY)186
The method of two-dimensional homonuclear spin-echo J correlated
spectroscopy, developed by Ernst and coworkers. 2D spin-echo correlation spectroscopy
establishes scalar coupling (J) connectivities between peaks. The data are displayed as a
counter plot. By the use of 2D-SECSY the J connectivities of oligosaccharides can be
revealed. Thus by 2D-SECSY NMR the monosaccharide composition and anomeric
configurations of oligosaccharides can be obtained.
32
Total Correlation Spectroscopy (TOCSY)187,188
A recent 2D NMR experiment for identifying extended couplings is TOCSY
which is also known as HOHAHA (Homonuclear Hartman Hahn Spectroscopy). The
TOCSY experiment uses a specific series of pulses (referred to as an isotropic mixing
sequence), to mediate oscillatory magnetization transfer between all protons in a scalar
coupled network. Inter residue bond magnetization transfer cannot occur since the
glycosidic linkage between residues in an oligosaccharide is devoid of protons. Milk
oligosaccharides anomeric proton and other sugar proton give cross peak in the region of
TOCSY spectrum. This experiment is especially helpful in sugar for which similar
chemical shifts of methine protons leads to many instances of strong coupling or
intermediate coupling. Thus TOCSY can give total correlation of all protons in a chain
with each other and serve for the identification of single residue in oligosaccharides. H.
Kogelberg et.al. used the TOCSY technique in structural elucidation of oligosaccharide
isolated from human milk.
Nuclear Overhauser Effect Spectroscopy (NOESY)189,190
The principal use of NOSEY in oligosaccharide structure determination has been
in the assessment of molecular conformation (i.e. 3D structure). Cross peaks are observed
in 2D NOESY spectra between proton pairs that are close in space (typically less than
5Å). The intranuclear distance between H-1 and H-5 (and H-3) of -D-galactopyranosyl
residue is about 2.5 Å, and thus a strong cross peak is observed between these protons in
NOESY spectrum. In α configuration, only a nuclear overhauser effect between H-1 and
H-2 is observed. In general, 1, 3 diaxial and 1, 2-eq-ax proton pairs in pyranosyl rings
will produce intra residue NOESY cross peaks. However NOESY cross peaks may be
observed between linkage sites and O-glycoside conformation in oligosaccharides.
Vicinal proton coupling, which is very useful in proton assignments for individual
pyranoside rings, is less valuable for correlating monosaccharides residue to each other.
Since the protons across the glycosidic linkage are four bonds apart they do not show
scalar coupling and thus no correlation between individual spin systems could be
observed by COSY or HOHAHA. The presence of an intra residue NOE from the
anomeric proton of a particular sugar residue to protons of other sugar residue in case of
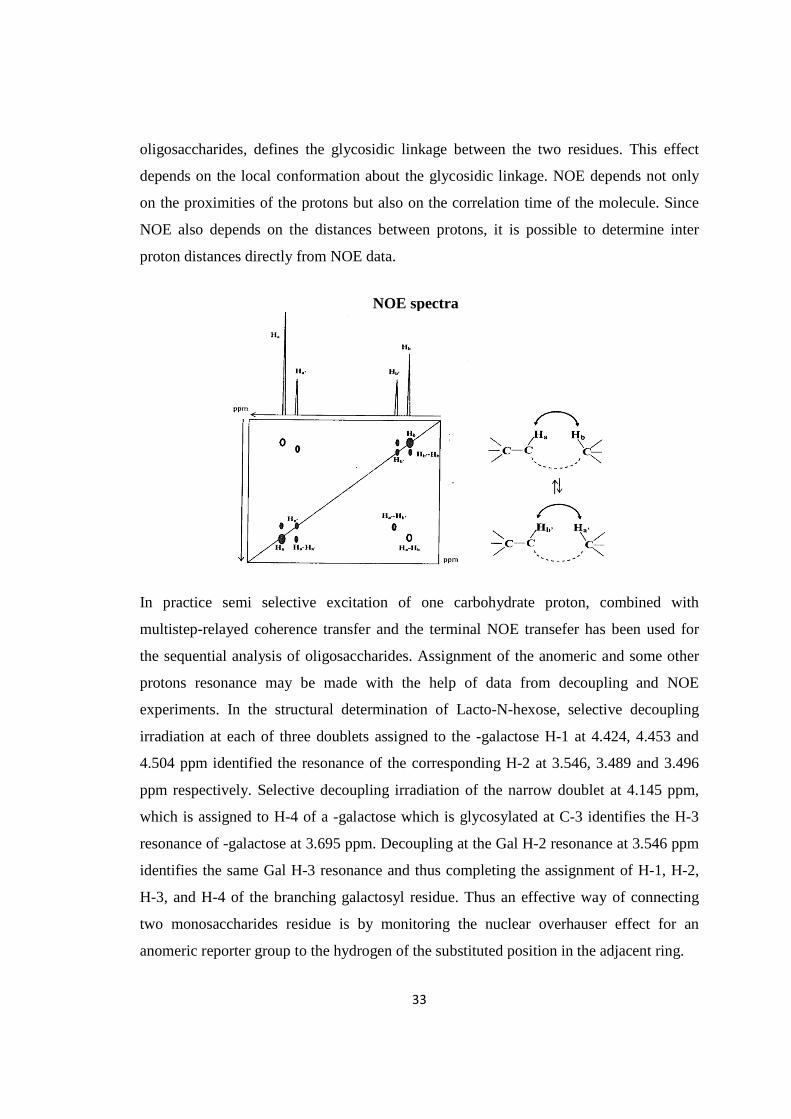
33
oligosaccharides, defines the glycosidic linkage between the two residues. This effect
depends on the local conformation about the glycosidic linkage. NOE depends not only
on the proximities of the protons but also on the correlation time of the molecule. Since
NOE also depends on the distances between protons, it is possible to determine inter
proton distances directly from NOE data.
NOE spectra
In practice semi selective excitation of one carbohydrate proton, combined with
multistep-relayed coherence transfer and the terminal NOE transefer has been used for
the sequential analysis of oligosaccharides. Assignment of the anomeric and some other
protons resonance may be made with the help of data from decoupling and NOE
experiments. In the structural determination of Lacto-N-hexose, selective decoupling
irradiation at each of three doublets assigned to the -galactose H-1 at 4.424, 4.453 and
4.504 ppm identified the resonance of the corresponding H-2 at 3.546, 3.489 and 3.496
ppm respectively. Selective decoupling irradiation of the narrow doublet at 4.145 ppm,
which is assigned to H-4 of a -galactose which is glycosylated at C-3 identifies the H-3
resonance of -galactose at 3.695 ppm. Decoupling at the Gal H-2 resonance at 3.546 ppm
identifies the same Gal H-3 resonance and thus completing the assignment of H-1, H-2,
H-3, and H-4 of the branching galactosyl residue. Thus an effective way of connecting
two monosaccharides residue is by monitoring the nuclear overhauser effect for an
anomeric reporter group to the hydrogen of the substituted position in the adjacent ring.
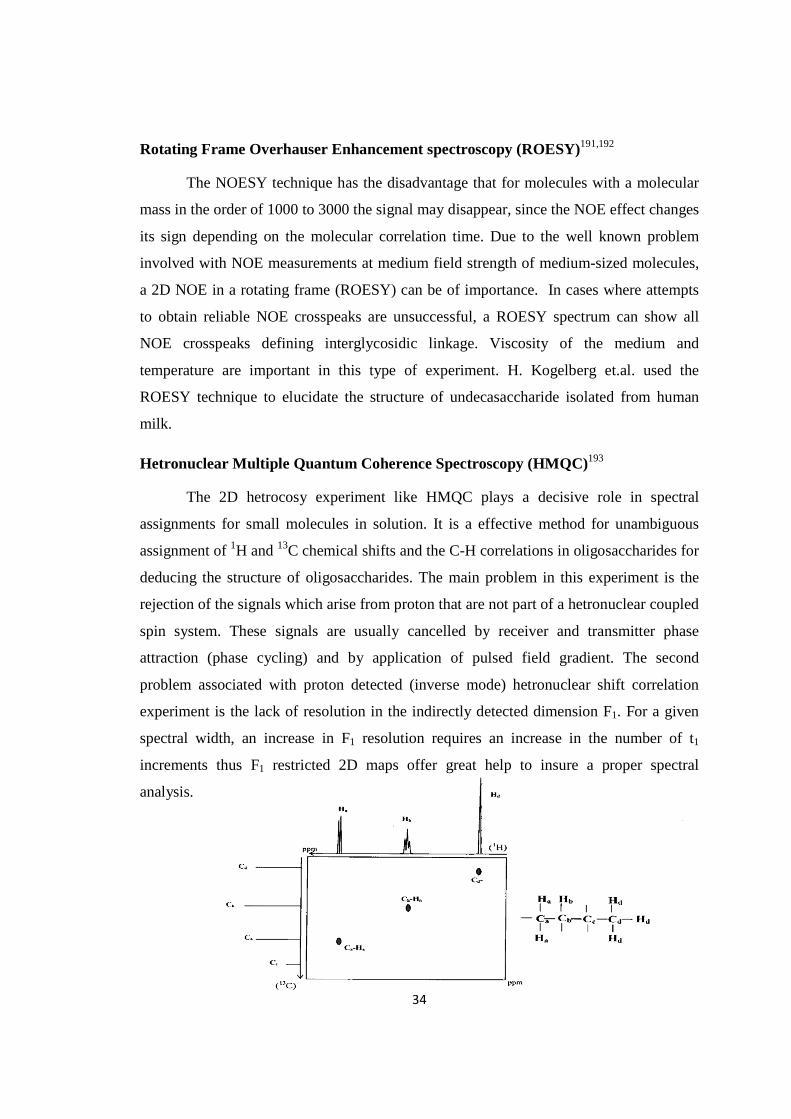
34
Rotating Frame Overhauser Enhancement spectroscopy (ROESY)191,192
The NOESY technique has the disadvantage that for molecules with a molecular
mass in the order of 1000 to 3000 the signal may disappear, since the NOE effect changes
its sign depending on the molecular correlation time. Due to the well known problem
involved with NOE measurements at medium field strength of medium-sized molecules,
a 2D NOE in a rotating frame (ROESY) can be of importance. In cases where attempts
to obtain reliable NOE crosspeaks are unsuccessful, a ROESY spectrum can show all
NOE crosspeaks defining interglycosidic linkage. Viscosity of the medium and
temperature are important in this type of experiment. H. Kogelberg et.al. used the
ROESY technique to elucidate the structure of undecasaccharide isolated from human
milk.
Hetronuclear Multiple Quantum Coherence Spectroscopy (HMQC) 193
The 2D hetrocosy experiment like HMQC plays a decisive role in spectral
assignments for small molecules in solution. It is a effective method for unambiguous
assignment of 1H and 13C chemical shifts and the C-H correlations in oligosaccharides for
deducing the structure of oligosaccharides. The main problem in this experiment is the
rejection of the signals which arise from proton that are not part of a hetronuclear coupled
spin system. These signals are usually cancelled by receiver and transmitter phase
attraction (phase cycling) and by application of pulsed field gradient. The second
problem associated with proton detected (inverse mode) hetronuclear shift correlation
experiment is the lack of resolution in the indirectly detected dimension F1. For a given
spectral width, an increase in F1 resolution requires an increase in the number of t1
increments thus F1 restricted 2D maps offer great help to insure a proper spectral
analysis.
HMQC Spectra
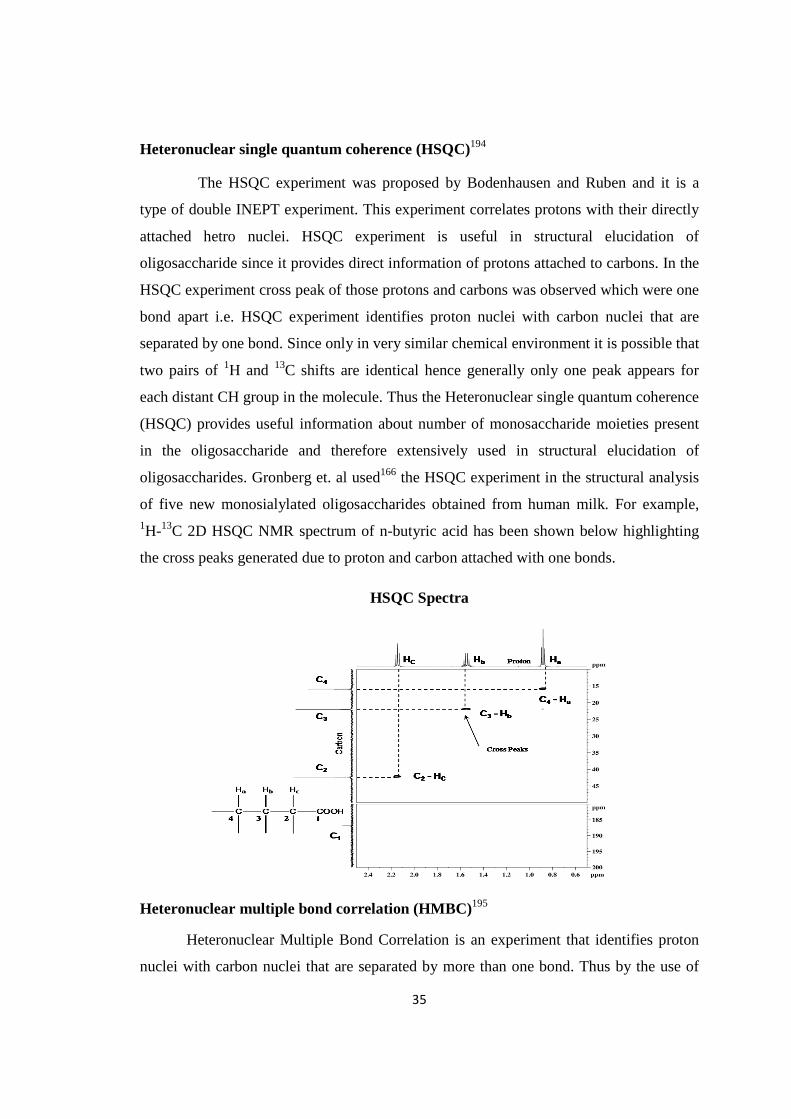
35
Heteronuclear single quantum coherence (HSQC)194
The HSQC experiment was proposed by Bodenhausen and Ruben and it is a
type of double INEPT experiment. This experiment correlates protons with their directly
attached hetro nuclei. HSQC experiment is useful in structural elucidation of
oligosaccharide since it provides direct information of protons attached to carbons. In the
HSQC experiment cross peak of those protons and carbons was observed which were one
bond apart i.e. HSQC experiment identifies proton nuclei with carbon nuclei that are
separated by one bond. Since only in very similar chemical environment it is possible that
two pairs of 1H and 13C shifts are identical hence generally only one peak appears for
each distant CH group in the molecule. Thus the Heteronuclear single quantum coherence
(HSQC) provides useful information about number of monosaccharide moieties present
in the oligosaccharide and therefore extensively used in structural elucidation of
oligosaccharides. Gronberg et. al used166 the HSQC experiment in the structural analysis
of five new monosialylated oligosaccharides obtained from human milk. For example, 1H-13C 2D HSQC NMR spectrum of n-butyric acid has been shown below highlighting
the cross peaks generated due to proton and carbon attached with one bonds.
HSQC Spectra
Heteronuclear multiple bond correlation (HMBC)195
Heteronuclear Multiple Bond Correlation is an experiment that identifies proton
nuclei with carbon nuclei that are separated by more than one bond. Thus by the use of
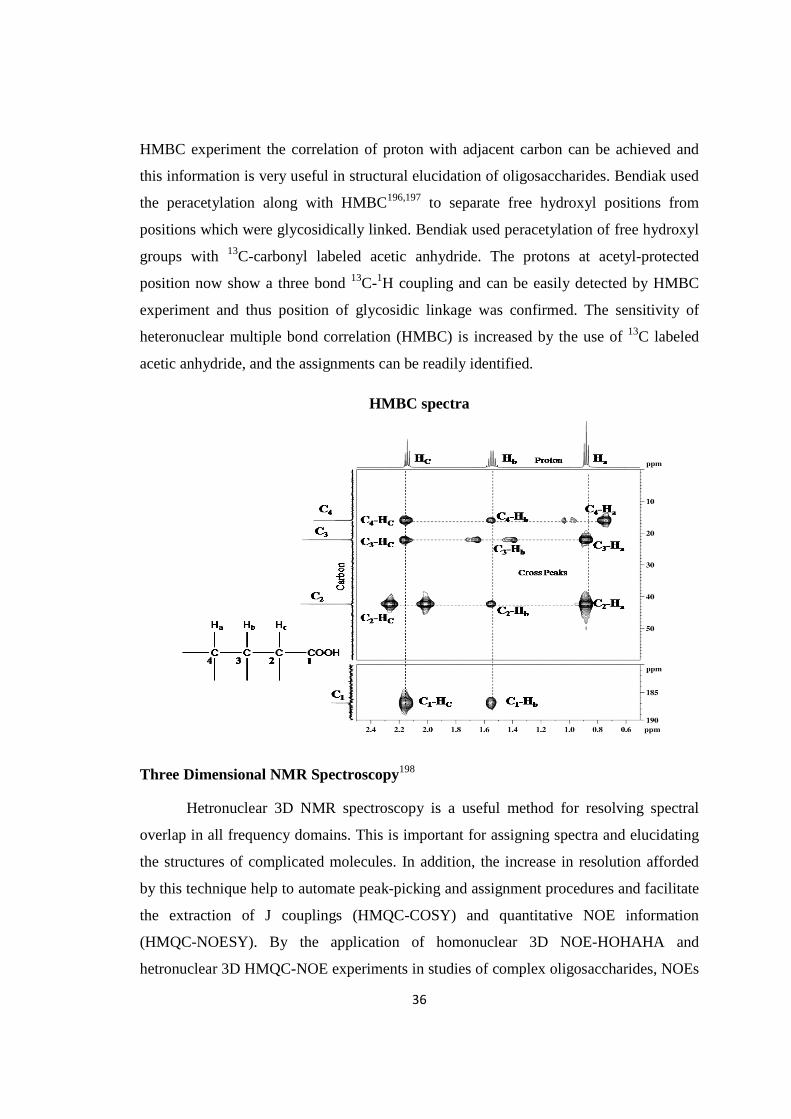
36
HMBC experiment the correlation of proton with adjacent carbon can be achieved and
this information is very useful in structural elucidation of oligosaccharides. Bendiak used
the peracetylation along with HMBC196,197 to separate free hydroxyl positions from
positions which were glycosidically linked. Bendiak used peracetylation of free hydroxyl
groups with 13C-carbonyl labeled acetic anhydride. The protons at acetyl-protected
position now show a three bond 13C-1H coupling and can be easily detected by HMBC
experiment and thus position of glycosidic linkage was confirmed. The sensitivity of
heteronuclear multiple bond correlation (HMBC) is increased by the use of 13C labeled
acetic anhydride, and the assignments can be readily identified.
HMBC spectra
Three Dimensional NMR Spectroscopy198
Hetronuclear 3D NMR spectroscopy is a useful method for resolving spectral
overlap in all frequency domains. This is important for assigning spectra and elucidating
the structures of complicated molecules. In addition, the increase in resolution afforded
by this technique help to automate peak-picking and assignment procedures and facilitate
the extraction of J couplings (HMQC-COSY) and quantitative NOE information
(HMQC-NOESY). By the application of homonuclear 3D NOE-HOHAHA and
hetronuclear 3D HMQC-NOE experiments in studies of complex oligosaccharides, NOEs
37
can be investigated which are hidden in conventional 2D NOE spectra. In the 3D NOE-
HOHAHA spectrum omega three cross sections were considered to be most suitable for
assignment of NOEs. In 3D HMQC-NOE spectroscopy the larger chemical shift
displacement of the carbon spectrum can be used to find NOEs hidden in the bulk region
of spectra.
Mass Spectroscopy
The structural analysis of the carbohydrate is usually carried out by a combination
of chemical and enzymatic methods .The structure determination of oligosaccharides is a
difficult task because of their presence in meager quantity and low resolution on
chromatography. In earlier days the structural studies of oligosaccharides depend upon
paper chromatography, sequential exoglucosidase digestion and quantitative methylation
analysis etc. Some frequently used techniques is periodate oxidation, Smith degradation,
permethylation analysis, acetolysis, alkaline degradation (β- elimination), and sequential
degradation with glycosidases. In recent years with the advent of modern
chromatographic techniques (HPLC) and recent physicochemical techniques like NMR 1H, 13C and 2D NMR and Mass spectroscopy FAB, MALDI and ES-MS, most of the
problems that are unattended previously seem to be resolved. Despite the high degree of
sophistication reached by these methods, it is evident that still some uncertainty remains
even with regard to the monosaccharide composition. Of all the modern structural
methods for oligosaccharides/oligoglycosides, NMR (lD & 2D techniques) in
combination with Mass spectrometry (FAB, MALDI & ES) yields the complete
stereoscopic structure of oligosaccharides/oligoglycosides, with or without prior
structural knowledge. Besides the NMR, the Mass spectrometry is the most basic and a
developed technique which is used in the structural elucidation of glycol compounds i.e.
glycosides, glycoprotein and oligosaccharide. In the present study we have used the Mass
spectrometry as a bench tool in the structural elucidation of various glycol-compounds.
The history of Mass spectrometry and various techniques used in structure determination
of oligosaccharides are as under.
Various methods of mass spectrometry were used in the structural determination
of natural products which are as follows-

38
1- Electron Ionisation (EI), 2- Chemical Ionisation (CI), 3- Field desorption (FD)
field desorption ionization, 4- Plasma desorption ionization, 5- Fast Atom Bombardment
(FAB), 6- Laser desorption (LD)/ionization, 7- Matrix-assisted Laser
Desorption/Ionization (MALDI), 8- Atmospheric Pressure Chemical Ionization (APCI),
9-Electrospray Ionization (ESI) and 10- Nanospray Ionization.
In initial stages it was only the electron impact mass spectroscopy199. Which was
being used in the structure elucidation of oligosaccharides but its limitation was that only
the lower fragments were observed200 .Further after the innovation of field desorption
mass spectrometry this problem was solved but the information obtained from FD-MS
was limited to higher fragments only and at that time chemists were coupling the results
of EI-MS and FD-MS for complete interpretation of mass spectrometry data. But a major
revolutionizing breakthrough was achieved with the development of soft or cold
ionization techniques (FAB-MS, MALDI-MS, thermo-spray and electro-spray MS) that
allowed the ionization and desorption of large polar compounds like intact proteins,
glycoconjugates and nucleic acids without prior evaporization from liquid or solid
masses,[hence expanded the utility of MS for analysis of large biopolymers. The
sensitivity is often in the picomol range or better. While MS methods can provide very
accurate masses of molecular or fragment ions. The details of various mass techniques
are described as under.
Electron Ionisation (EI)201
In Electron ionization technique the analyte must be vaporized; this is usually
achieved by heating the probe tip containing a droplet of the analytic in solution. If the
sample is thermally unstable, this will often be the first cause of sample fragmentation.
Once in the gas-phase, the analyte passes into an EI chamber. Where it interacts with a
homogeneous beam of electrons typically at 70 electron volts energy. The electron beam
is produced by a filament (rhenium or tungsten wire) and steered across the source
chamber to the electron trap. A fixed magnet is placed, with opposite poles slightly off-
axis, across the chamber to create a spiral in the electron beam. This is to increase the
chance of interactions between the beam and the analytic gas. There are no actual
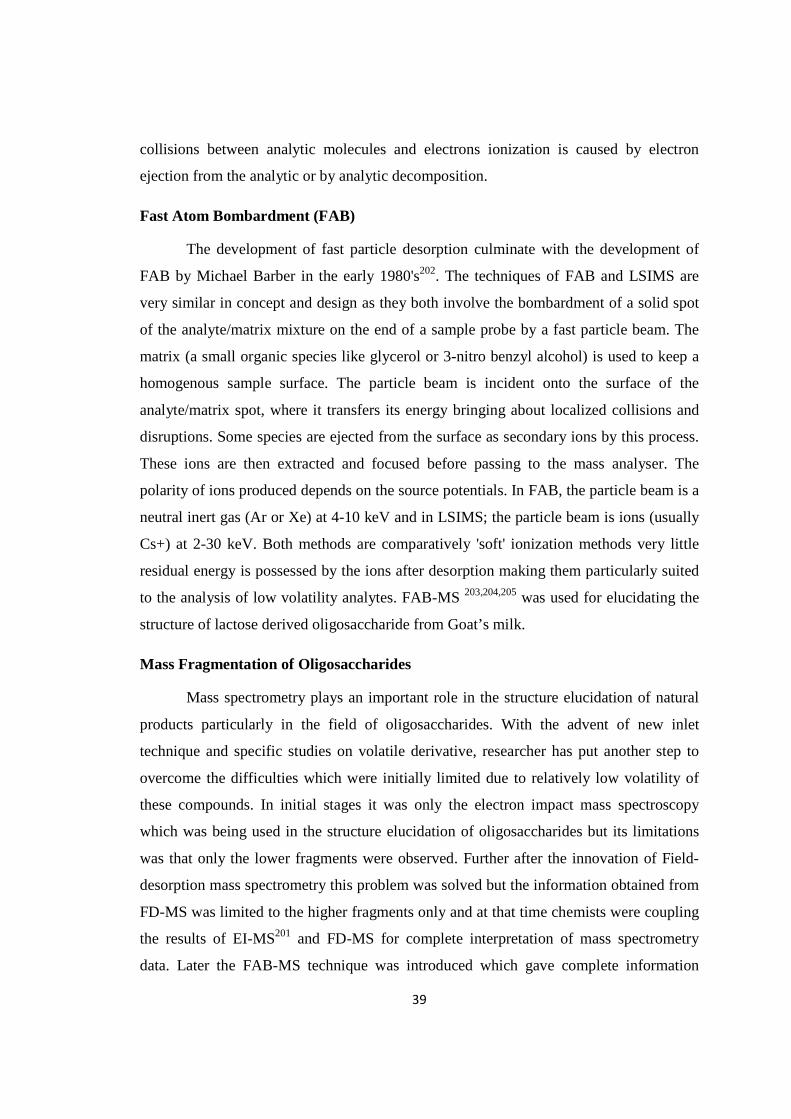
39
collisions between analytic molecules and electrons ionization is caused by electron
ejection from the analytic or by analytic decomposition.
Fast Atom Bombardment (FAB)
The development of fast particle desorption culminate with the development of
FAB by Michael Barber in the early 1980's202. The techniques of FAB and LSIMS are
very similar in concept and design as they both involve the bombardment of a solid spot
of the analyte/matrix mixture on the end of a sample probe by a fast particle beam. The
matrix (a small organic species like glycerol or 3-nitro benzyl alcohol) is used to keep a
homogenous sample surface. The particle beam is incident onto the surface of the
analyte/matrix spot, where it transfers its energy bringing about localized collisions and
disruptions. Some species are ejected from the surface as secondary ions by this process.
These ions are then extracted and focused before passing to the mass analyser. The
polarity of ions produced depends on the source potentials. In FAB, the particle beam is a
neutral inert gas (Ar or Xe) at 4-10 keV and in LSIMS; the particle beam is ions (usually
Cs+) at 2-30 keV. Both methods are comparatively 'soft' ionization methods very little
residual energy is possessed by the ions after desorption making them particularly suited
to the analysis of low volatility analytes. FAB-MS 203,204,205 was used for elucidating the
structure of lactose derived oligosaccharide from Goat’s milk.
Mass Fragmentation of Oligosaccharides
Mass spectrometry plays an important role in the structure elucidation of natural
products particularly in the field of oligosaccharides. With the advent of new inlet
technique and specific studies on volatile derivative, researcher has put another step to
overcome the difficulties which were initially limited due to relatively low volatility of
these compounds. In initial stages it was only the electron impact mass spectroscopy
which was being used in the structure elucidation of oligosaccharides but its limitations
was that only the lower fragments were observed. Further after the innovation of Field-
desorption mass spectrometry this problem was solved but the information obtained from
FD-MS was limited to the higher fragments only and at that time chemists were coupling
the results of EI-MS201 and FD-MS for complete interpretation of mass spectrometry
data. Later the FAB-MS technique was introduced which gave complete information
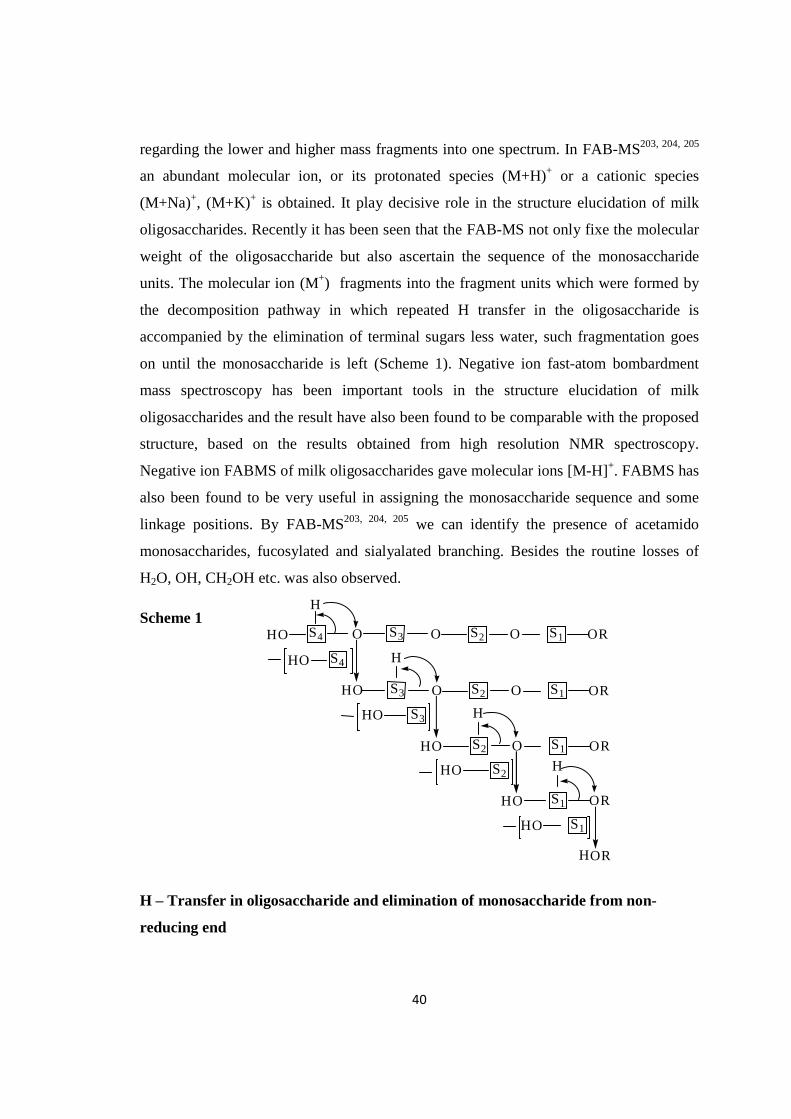
40
regarding the lower and higher mass fragments into one spectrum. In FAB-MS203, 204, 205
an abundant molecular ion, or its protonated species (M+H)+ or a cationic species
(M+Na)+, (M+K)+ is obtained. It play decisive role in the structure elucidation of milk
oligosaccharides. Recently it has been seen that the FAB-MS not only fixe the molecular
weight of the oligosaccharide but also ascertain the sequence of the monosaccharide
units. The molecular ion (M+) fragments into the fragment units which were formed by
the decomposition pathway in which repeated H transfer in the oligosaccharide is
accompanied by the elimination of terminal sugars less water, such fragmentation goes
on until the monosaccharide is left (Scheme 1). Negative ion fast-atom bombardment
mass spectroscopy has been important tools in the structure elucidation of milk
oligosaccharides and the result have also been found to be comparable with the proposed
structure, based on the results obtained from high resolution NMR spectroscopy.
Negative ion FABMS of milk oligosaccharides gave molecular ions [M-H]+. FABMS has
also been found to be very useful in assigning the monosaccharide sequence and some
linkage positions. By FAB-MS203, 204, 205 we can identify the presence of acetamido
monosaccharides, fucosylated and sialyalated branching. Besides the routine losses of
H2O, OH, CH2OH etc. was also observed.
Scheme 1
H – Transfer in oligosaccharide and elimination of monosaccharide from non-
reducing end
O O O ORS4 S3 S2HO
H
S1
O O OR
S4
S3 S2
HO H
S1
O OR
S3
S2HO
H
S1
OR
S2HO H
S1
HO
HO
HO
ORH
HO S1

CHAPTER II
ISOLATION

41
ISOLATION
Sheep (Ovis aries) are quadrupedal, ruminant mammals typically kept as livestock.
sheep are members of the order Artiodactyla. Although the name "sheep" applies to
many species in the genus Ovis, in everyday usage it almost always refers to Ovis
aries. Numbering a little over one billion, domestic sheep are also the most numerous
species of sheep. An adult female sheep is referred to as a ewe an intact male as a ram
or occasionally a tup, a castrated male as a wether, and a younger sheep as a lamb.
Classification (Zoological description)
Kingdom- Animalia
Phylum- Chordata
Subphylum- Vertebrata
Class- Mammalia
Order- Artiodactyla
Family- Bovidae
Subfamily- Caprinae
Genus- Ovis
Species- O. aries
Fig- SHEEP

42
Description
Depending on breed, sheep show a range of heights and weights. Their rate of growth
and mature weight is a heritable trait that is often selected for in breeding. Ewes
typically weigh between 45 to 100 kilograms, and rams between 45 to160 kilograms.
When all deciduous teeth have erupted, the sheep has 20 teeth. Mature sheep have 32
teeth. As with other ruminants, the front teeth in the lower jaw bite against a hard,
toothless pad in the upper jaw. These are used to pick off vegetation, and then the rear
teeth grind it before it is swallowed. There are eight lower front teeth in ruminants,
but there is some disagreement as to whether these are eight incisors, or six incisors
and two incisor-shaped canines. This means that the dental formula for sheep is either
0.0.3.3/4.0.3.3 or 0.0.3.3/3.1.3.3 there is a large diastema between the incisors and the
molars. Sheep have a gestation period of about five months, and normal labour takes
one to three hours. Although some breeds regularly throw larger litters of lambs, most
produce single or twin lambs.
Properties of sheep milk
Sheep milk is delicious and healthy alternative to cow’s milk it is particularly
popular among those with lactose intolerance because of sheep milk’s low lactose
properties. Nearly 75% of the world’s population is considered to have a lactose
allergy or “lactose intolerant” those with a lactose allergy have difficulty digesting
cow’s milk causing symptoms such as gas and diarrhoea. The fats in sheep milk are
mono-saturated and poly-unsaturated, which are both having healthy essential fats.
Sheep milk also contains medium high chain triglycerides that help the body in
reducing high cholesterol levels. Sheep milk is white in colour as compared with Cow
milk which is yellowish due to the presence of carotene. The gross composition of
Goat and Sheep milk is similar, but sheep milk contains more fat, solids, non-fat,
proteins, caseins, whey-proteins and total ash as compared with goat milk. These
differences make the rennet coagulation time for sheep milk shorter and curd firmer
owing to the differences in the caseins. Solids in sheep milk range from 15 to 20%
and proteins are between 5 to 6%. There are many significant differences in the amino
acids of goat and sheep milk proteins and also in the relative proportions of the
various milk proteins and their genetic polymorphism. K-casein has been isolated and
characterized from goat. K-casein has been isolated and characterized from goat milk
and sheep milk and both were similar to cow K-casein in many respect.

43
Constituents unit Cow Goat Water Buffalo Sheep
Water g 87.8 88.9 81.1 83.0 Protein g 3.2 3.1 4.5 5.4 Fat g 3.9 3.5 8.0 6.0 Carbohydrate g 4.8 4.4 4.9 5.1 Energy kcal 66 60 110 95 kJ 275 253 463 396 Sugars (Lactose) g 4.8 4.4 5.1 4.9 Fatty Acids:
Saturated g 2.4 2.3 4.2 3.8 Mono-unsaturated g 1.1 0.8 1.7 1.5 Polyunsaturated g 0.1 0.1 0.2 0.3 Cholesterol mg 14 10 8 11 Calcium IU 120 100 195 170
Table-1: Comparison of sheep milk and other animals milk properties.
ISOLATION OF SHEEP MILK OLIGOSACCHARIDES BY MODIFIED
METHOD OF KOBATA AND GINSBURG
10 litter of sheep milk was collected in 38 days in normal milking condition from a
single domestic sheep from district Ghazipur, (Vill-Gausabad) Uttar Pradesh, India.
After milking the milk was fixed immediately by addition of equal amount of ethanol.
The preserved milk was taken in to the laboratory for further experiments. It was
filtered then it was centrifuged on C-25 centrifuging machine at 5500 rpm at -4oC,
after centrifugation the solidified layer was removed by filtration through glass wool.
After filtaration lipid layer was discarded and supernatant was precipitated by
addition of 68% ethanol and separated by centrifugation and after removing protein
and lactose supernatant was filtered through a micro filter (0.2 µ) to remove
remaining lactose. It was then lyophilized (mixture of oligosaccharides). Lyophilized
material was then fractionated on a sephadex G-25 column, eluted with triple distilled
water at flow rate 3ml/min. Fractions were analyzed for sugars by phenol-sulphuric
acid reagent.

44
Isolation of Milk oligosaccharides by modified method of Kobata and Ginsburg
Sheep Milk
Carbohydrate containing fractions (Fractions were pooled, lyophilized and analyzed by HPLC)
Deacetylation
Analytical HPLC The carbohydrate fractions were eluted with TDW (containing 0.1%TFA & CH3CN) at a flow rate 1ml/min., to check homogeneity of the oligosaccharide mixture. The elution was monitored by UV absorbance at 220 nm.
Chemical transformation Oligosaccharide mixture was acetylated with Ac2O and pyridine converting free sugar into non-polar acetyl derivatives which were resolved nicely on TLC and were separated by column chromatography over silica gel which resulted in the isolation of chromatographically pure compounds
The chromatographically pure acetylated Milk oligosaccharides were deacetylated by dissolving then in acetone & NH4OH and left overnight. Ammonia was removed under reduced pressure and the compound was washed with CHCl3 and was finally freeze dried giving the deacetylated milk oligosaccharides.
Lipid Layer (Discarded)
Was precipitated by addition of 68% ethanol and separated by centrifugation
Supernatant Was filtered through a micro filter (0.2µ) to remove remaining lactose. It was then lyophilized
Supernatant
Protein and Lactose Residue (Discarded)
Lyophilized material (Mixture of oligosaccharides)
Was then fractionated on a sephadex G-25 column, eluted with triple distilled water at flow rate 3ml/min. Fractions were analyzed for sugars by phenol-sulphuric acid reagent
Equal amount of ethanol was added and filtered followed by centrifugation (5500 rpm) at -4oC, and filtered through a loosely packed glass wool

45
Sephadex G-25 Gel filtration of Sheep milk Oligosaccharide Mixture
The repeated gel filtration was performed by Sephadex G-25 chromatography
of crude Sheep milk oligosaccharide mixture. Sheep milk oligosaccharide mixture
was packed in a column (1.6 x 40 cm) (void volume = 25 ml) equilibrated with glass
triple distilled water (TDW) and it was left for 10-12 hrs to settle down. The material
was applied on a Sephadex G-25 column and was eluted for separation of protein and
glycoprotein from oligosaccharide (low molecular weight component). Presence of
neutral sugars was monitored in all eluted fractions by phenol-sulphuric acid test. In
this U.V. monitored Sephadex G-25 chromatography of Sheep milk oligosaccharide
mixture showed four peaks i.e. I, II, III and IV. A substantial amount of proteins,
glycoproteins and serum albumin were eluted in the void volume which was
confirmed by positive coloration with p-dimethylaminobenzaldehyde reagent and
phenol-sulphuric acid reagent. Fractions under peaks II and III gave a positive phenol-
sulphuric acid test for sugars which showed the presence of oligosaccharide mixture
in Sheep milk. These fractions (peak II and III) were pooled and lyophilized.
Graph-1: Spehadex G-25 chromatography of Sheep Milk Oligosaccharides
Detected by Phenol Sulphuric Acid Method. Elution was Made with TDW
0.1 -
0.0 -
Vo
IV I
II
III
10 30 50 70 90 110
Fraction Numbers
Absorbance 280 nm
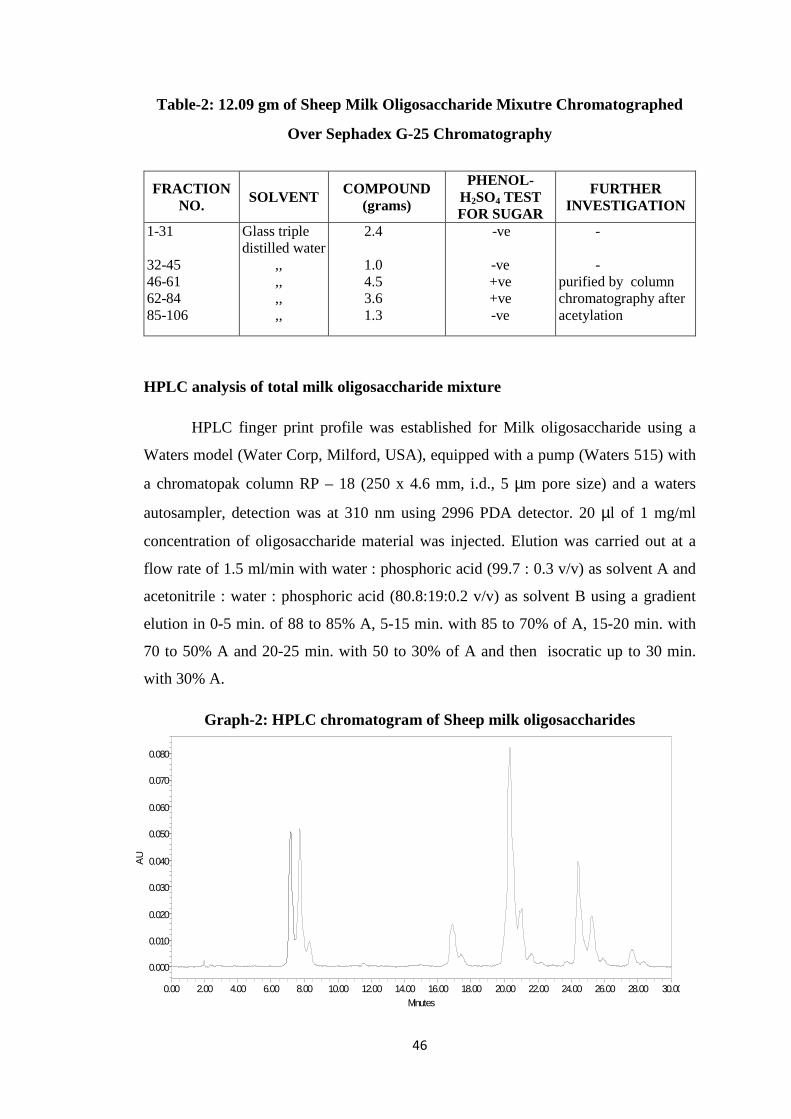
46
Table-2: 12.09 gm of Sheep Milk Oligosaccharide Mixutre Chromatographed
Over Sephadex G-25 Chromatography
FRACTION NO. SOLVENT COMPOUND
(grams)
PHENOL-H2SO4 TEST FOR SUGAR
FURTHER INVESTIGATION
1-31 32-45 46-61 62-84 85-106
Glass triple distilled water ,, ,, ,, ,,
2.4 1.0 4.5 3.6 1.3
-ve
-ve +ve +ve -ve
- - purified by column chromatography after acetylation
HPLC analysis of total milk oligosaccharide mixture
HPLC finger print profile was established for Milk oligosaccharide using a
Waters model (Water Corp, Milford, USA), equipped with a pump (Waters 515) with
a chromatopak column RP – 18 (250 x 4.6 mm, i.d., 5 µm pore size) and a waters
autosampler, detection was at 310 nm using 2996 PDA detector. 20 µl of 1 mg/ml
concentration of oligosaccharide material was injected. Elution was carried out at a
flow rate of 1.5 ml/min with water : phosphoric acid (99.7 : 0.3 v/v) as solvent A and
acetonitrile : water : phosphoric acid (80.8:19:0.2 v/v) as solvent B using a gradient
elution in 0-5 min. of 88 to 85% A, 5-15 min. with 85 to 70% of A, 15-20 min. with
70 to 50% A and 20-25 min. with 50 to 30% of A and then isocratic up to 30 min.
with 30% A.
Graph-2: HPLC chromatogram of Sheep milk oligosaccharides
AU
0.000
0.010
0.020
0.030
0.040
0.050
0.060
0.070
0.080
Minutes0.00 2.00 4.00 6.00 8.00 10.00 12.00 14.00 16.00 18.00 20.00 22.00 24.00 26.00 28.00 30.00

47
Table-3: HPLC Table of crude Sheep milk oligosaccharides
S.No. Retention Time % compound
1. 7.21 11.11
2. 7.63 12.07
3. 8.45 5.29
4. 17.21 8.81
5. 17.41 3.32
6. 20.58 20.92
7. 21.39 10.79
8. 21.78 3.21
9. 24.69 12.33
10. 25.42 8.99
11. 25.97 3.22
12. 27.51 2.88
Acetylation of Oligosaccharide mixture
9.48 gm Oligosaccharides mixture was acetylated with pyridine and acetic anhydride
at 60oC and solution was stirred overnight. The mixture was evaporated under water
bath and reduced pressure and viscous residue was taken in CHCl3 (200 ml) and
washed twice in ice cold water, evaporated to dryness yielding the acetylated mixture.
The acetylation converted the free sugars into their non polar acetyl derivatives which
were resolved nicely on TLC, giving 9 spots i.e. a, b, c, d, e, f, g, h and i of which six
compounds were finally separated by column chromatography over silica gel using
varying proportions of hexane, chloroform and methanol as eluants.
CHCl3: MeOH (98:2) CHCl3: MeOH (95:5)
TLC of acetylated oligosaccharides mixture at different polarity proportions

48
PURIFICATION OF ACETYLATED MILK OLIGOSACCHARIDES ON SILICA GEL COLUMN
Column Chromatography -1
Separation of the acetylated product (6.0 g.) was carried out over silica gel (200 g.)
using varying proportion of Hex: CHCl3, CHCl3, CHCl3: MeOH as eluants, collecting
fraction of 200 ml each. All these fractions were checked on TLC and those showing
similar spots were taken together for further investigations. The chromatographic
details are given in the table No-1 as below.
Table 1
6.0 g Mixture Chromatographed Over 200 g SiO2
Fraction No.
Solvent Eluted Residue Amorphous
Spots on TLC
Further Investigation
1-25 CHCl3 500 mg Streaking -
26-48
CHCl3:MeOH
99.9 : 0.1
400 mg
streaking -
49-83 CHCl3:MeOH
99.5 : 0.5
300 mg a with streaking
-
84-103 CHCl3:MeOH 99 : 1
180 mg a and b CC-2
104-137 CHCl3:MeOH
98 : 2
1.270 mg b, c, d, e CC-3, CC-4
137-147
CHCl3:MeOH
95: 5
1.883 mg
CC-5
148-157
CHCl3:MeOH
95 : 5
400 mg
f with streaking
-
158-170
CHCl3:MeOH
90 : 10
700 mg
washing
-
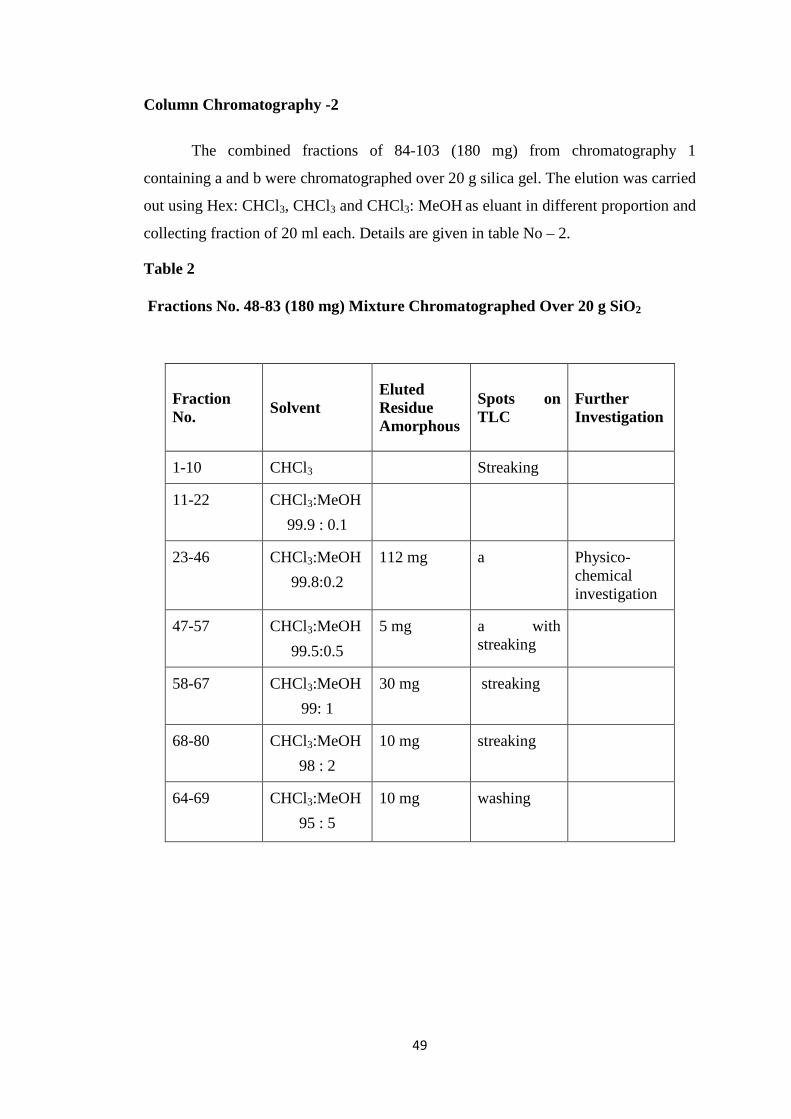
49
Column Chromatography -2
The combined fractions of 84-103 (180 mg) from chromatography 1
containing a and b were chromatographed over 20 g silica gel. The elution was carried
out using Hex: CHCl3, CHCl3 and CHCl3: MeOH as eluant in different proportion and
collecting fraction of 20 ml each. Details are given in table No – 2.
Table 2
Fractions No. 48-83 (180 mg) Mixture Chromatographed Over 20 g SiO2
Fraction No.
Solvent Eluted Residue Amorphous
Spots on TLC
Further Investigation
1-10 CHCl3 Streaking
11-22 CHCl3:MeOH
99.9 : 0.1
23-46 CHCl3:MeOH
99.8:0.2
112 mg a Physico-chemical investigation
47-57 CHCl3:MeOH
99.5:0.5
5 mg a with streaking
58-67 CHCl3:MeOH
99: 1
30 mg streaking
68-80 CHCl3:MeOH
98 : 2
10 mg streaking
64-69
CHCl3:MeOH
95 : 5
10 mg washing
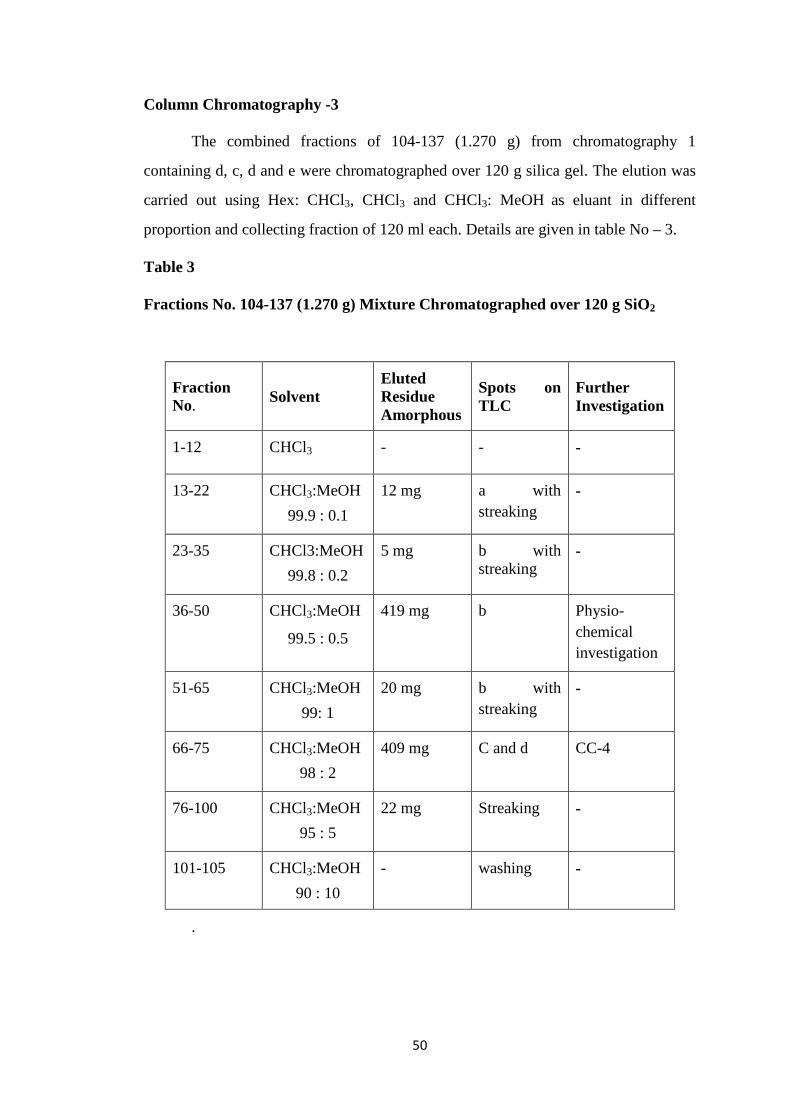
50
Column Chromatography -3
The combined fractions of 104-137 (1.270 g) from chromatography 1
containing d, c, d and e were chromatographed over 120 g silica gel. The elution was
carried out using Hex: CHCl3, CHCl3 and CHCl3: MeOH as eluant in different
proportion and collecting fraction of 120 ml each. Details are given in table No – 3.
Table 3
Fractions No. 104-137 (1.270 g) Mixture Chromatographed over 120 g SiO2
Fraction No. Solvent
Eluted Residue Amorphous
Spots on TLC
Further Investigation
1-12 CHCl3 - - -
13-22
CHCl3:MeOH
99.9 : 0.1
12 mg
a with streaking
-
23-35
CHCl3:MeOH
99.8 : 0.2
5 mg
b with streaking
-
36-50 CHCl3:MeOH
99.5 : 0.5
419 mg b Physio-chemical investigation
51-65
CHCl3:MeOH
99: 1
20 mg
b with streaking
-
66-75 CHCl3:MeOH
98 : 2
409 mg
C and d CC-4
76-100 CHCl3:MeOH
95 : 5
22 mg
Streaking -
101-105 CHCl3:MeOH
90 : 10
- washing -
.

51
Column Chromatography -4
The combined fractions of 66-75 (409 mg) from chromatography 3 containing
c and d were chromatographed over 50 g silica gel. The elution was carried out using
Hex: CHCl3, CHCl3 and CHCl3: MeOH as eluant in different proportion and
collecting fraction of 50 ml each. Details are given in table No – 4.
Table 4
Fractions No. 66-75 (409 mg) Mixture Chromatographed Over 50 gm SiO2
Fraction No. Solvent
Eluted Residue Amorphous
Spots on TLC
Further Investigation
1-15 Hex : CHCl3
25 : 75
65 mg -
16-35 CHCl3 95 mg -
35-50 CHCl3:MeOH
99.8 : 0.2
88 mg -
51-60 CHCl3:MeOH
99.5 : 0.5
10 mg -
61-75
CHCl3:MeOH
99: 1
46 mg
c
Physico-chemical investigation
76-85 CHCl3:MeOH
99 : 1
32mg
c with streaking
86-105 CHCl3:MeOH
98 : 2
62 mg d Physici-chemical investigation
106-115 CHCl3:MeOH
95 : 5
5 mg - -
116-120 CHCl3:MeOH
90 : 10
10 mg Washing -
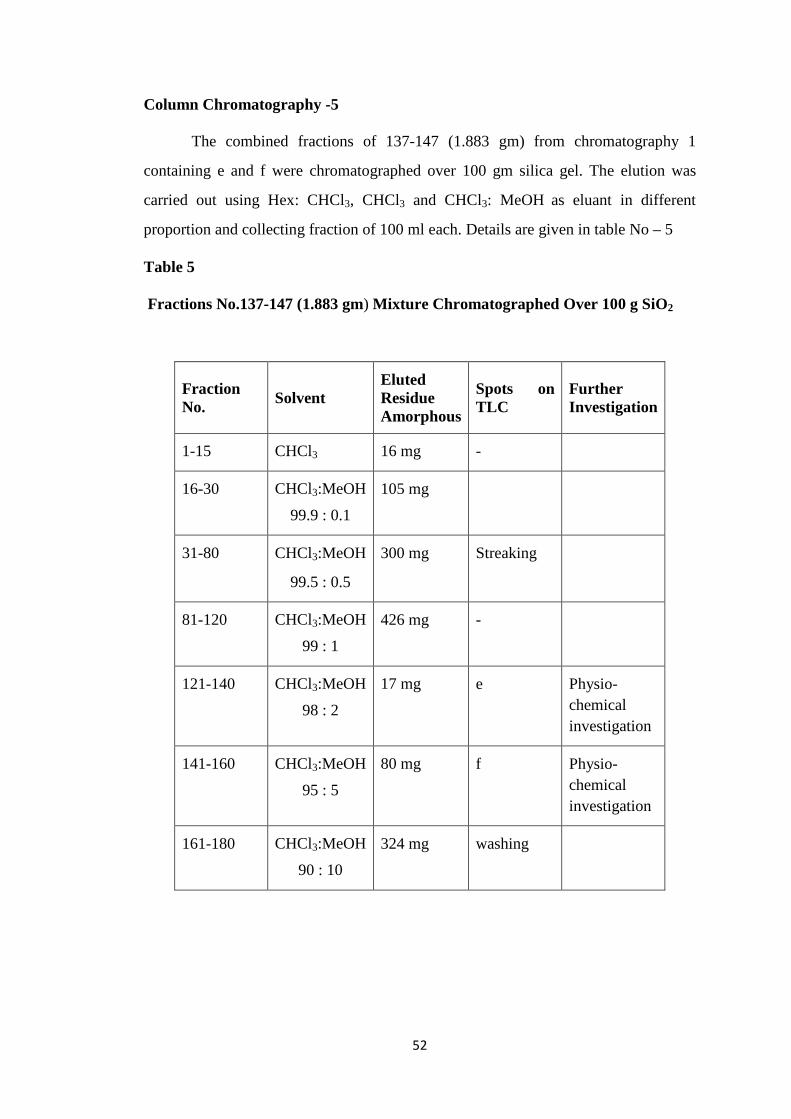
52
Column Chromatography -5
The combined fractions of 137-147 (1.883 gm) from chromatography 1
containing e and f were chromatographed over 100 gm silica gel. The elution was
carried out using Hex: CHCl3, CHCl3 and CHCl3: MeOH as eluant in different
proportion and collecting fraction of 100 ml each. Details are given in table No – 5
Table 5
Fractions No.137-147 (1.883 gm) Mixture Chromatographed Over 100 g SiO2
Fraction No. Solvent
Eluted Residue Amorphous
Spots on TLC
Further Investigation
1-15 CHCl3 16 mg -
16-30 CHCl3:MeOH
99.9 : 0.1
105 mg
31-80 CHCl3:MeOH
99.5 : 0.5
300 mg Streaking
81-120 CHCl3:MeOH
99 : 1
426 mg -
121-140 CHCl3:MeOH
98 : 2
17 mg
e Physio-chemical investigation
141-160
CHCl3:MeOH
95 : 5
80 mg
f Physio-chemical investigation
161-180 CHCl3:MeOH
90 : 10
324 mg washing

53
DEACETYLATION OF ISOLATED COMPOUNDS
The acetylated compounds a, b, c and d were obtained from column
chromatography. On deacetylation they gave native oligosaccharides A, B, C, and D
respectively.
Table 8
Acetylated and Deacetylated Oligosaccharides Obtained from Sheep Milk
Acetylated Compound Deacetylated Compound
Alphabetical name
Analytical notation
Quantity (mg) Alphabetical name
Analytical notation
Quantity (mg) Obtained by
column taken for deacetylation
a ARSM-1A 112 40 A ARSM-1 35
b ARSM-2A 419 50 B ARSM-2 45
c ARSM-3A 46 32 C ARSM-3 24
d ARSM-4A 62 52 D ARSM-4 44
DESCRIPTION OF ISOLATED COMPOUNDS
Compound A (ARSM-1) CAPRIOSE:
Compound a (112 mg) was obtained from fraction 23-46 of column
chromatography 2. On deacetylation of 40 mg of substance a with NH3/acetone, it
afforded substance A (35.0 mg) ��� ���
+41.01o (c 1% H2O). For experimental analysis,
this compound was dried over P2O5 at 100oC and 0.1 mm pressure for 8 hr. It gave
positive Phenol-sulphuric acid test, Feigl test and Morgan-Elson test.
C34H58O25N2 %C %H %N
Calculated 45.63 6.48 3.13
Found 45.64 6.49 3.13 1H NMR of Comound-A Capriose Acetate in CDCl3 at 300 MHz
6.37[d, 1H, J=3.0 Hz, α-Glc(S-1) H-1], 5.72[d, 1H, J=8.0Hz, β-Glc(S-1) H-1], 5.19
[d, 1H, J=8.7Hz, β-Gal(S-2) H-1)], 5.4 [d, 1H, J=3.0Hz, α-FucNAc(S-3) H-1], 4.48
[d, 2H, J=7.2, β-Gal(S-4), H-1, β-GalNAc(S-5) H-1], 4.12[d, 1H, βGal(S-2), H-1],
3.6[m, 1H, βGlc(S-1), H-4], 1.23[d, 3H, αFucNAc(S-3), H-6].

54
13C NMR of Comound-A Capriose Acetate in CDCl3 at 300 MHz
89.68[1C, α-Glc(S-1) C-1], 91.66[2C, β-Glc(S-1) & α-FucNAc(S-3), C-1],
101.05[3C, β-Gal(S-2), β-Gal (S-4) & β-GalNAc(S-5) C-1]. 1H NMR of Comound-A Capriose in D2O at 300 MHz
5.57[d, 1H, J=3.0Hz, α-Glc(S-1) H-1], 4.64[d,1H, J=8.0Hz, β-Glc(S-1) H-1], 5.3[d,
1H, J=3.0Hz, α-FucNAc(S-3), H-1], 4.35[d,1H, J=8.0Hz, β-Gal(S-4) H-1 and β-
GalNac(S-5)], 1.91[S, 3H, 2(NHCOCH3), β-GalNAc(S-5)], 1.2[d, 3H, α-FucNAc(S-
3)].
ES Mass
879 [894-CH3], 862[879-OH], 833[862-CHO], 747[833-NHCOCH3], 691[894-S-5],
633[691-NHCOCH3], 616[633-OH], 585[616-CH2OH], 567[585-H2O], 674[691-
OH], 657[674-OH], 641[674-H2O, CH3], 609[641-CH2OH, H+], 529[691-S4],
342[488-S3], 324[342-H2O], 180[342-S2].
Compound B (ARSM-2) VIESOSE:
Compound b (419 mg) was obtained from fraction 36-50 of column chromatography
3. On deacetylation of 50 mg of substance b with NH3 / acetone it afforded substance
B (45.0 mg) ��� ���
+72.02o (c 1% H2O). For experimental analysis, this compound was
dried over P2O5 at 100oC and 0.1 mm pressure for 8 hr. It gave positive Phenol-
sulphuric acid test, Feigl test and Morgan-Elson test.
C34H58O26N2 %C %H %N
Calculated 44.84 6.38 3.07
Found 44.83 6.39 3.08 1H NMR of Compound-B Viesose in CDCl3 at 300 MHz
δ 6.22[d, 1H, J= 3.0 Hz, α-Glc(S-1) H-1], 5.64[d,1H, J= 8.4 Hz, β-Glc(S-1) H-1 5.22
[d,1H, J = 8.0 Hz, β-GlcNAc(S-5), H-1)], 4.97[d, 1H, J=9.6 Hz, β-Gal(S-3) H-1],
4.56[d, 2H, J = 8.0 Hz, β-Gal(S-2), H-1, β-GalNAc(S-4) H-1], 4.01[d, 1H, βGal(S-3),
H-3], 3.8[m, 1H, βGlc(S-1), H-3], 3.72[d, 1H, βGal(S-3), H-2], 3.6[d, 1H, βGlc(S-1),
H-4]. 13C NMR of Compound-B Viesose in CDCl3 at 300 MHz
89.10[1C, α-Glc (S-1) C-1], 91.56[2C, β-Glc (S-1) C-1, β-Gal(S-3), C-1)], 101.97[1C,
β-GlcNAc (S-5) C-1], 101.84[2C, β-Gal(S-2), C-1, β-GalNAc (S-4) C-1].
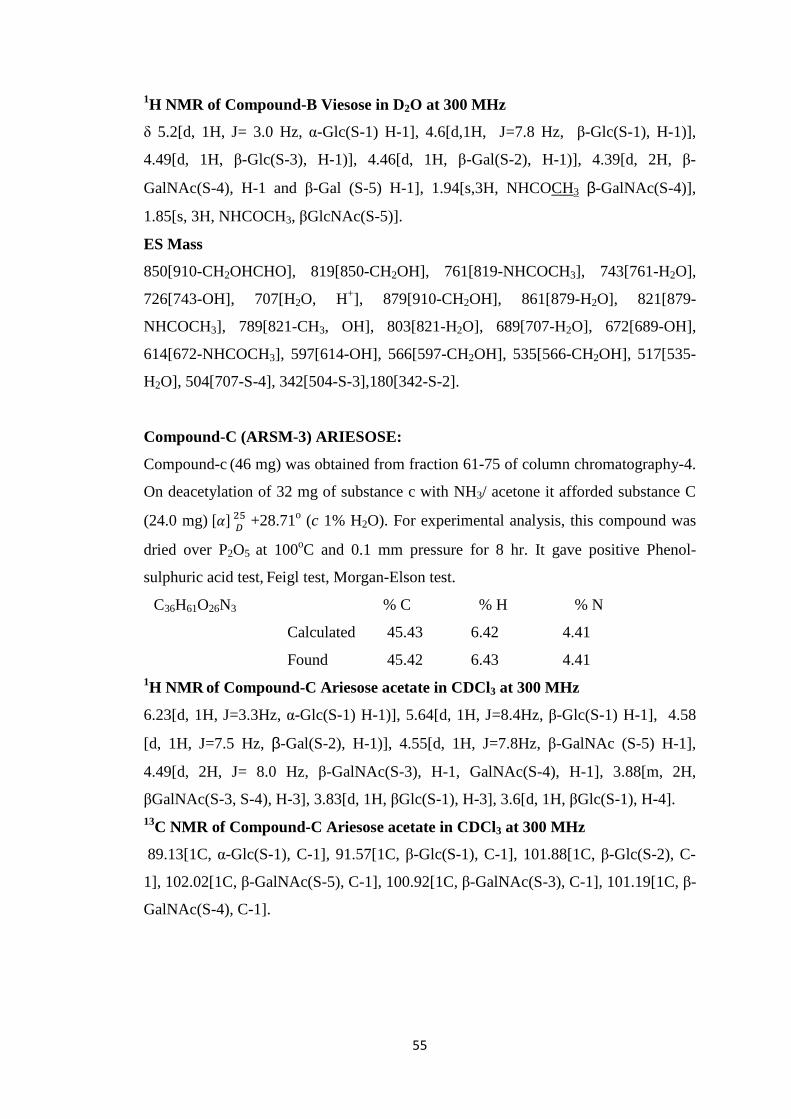
55
1H NMR of Compound-B Viesose in D2O at 300 MHz
δ 5.2[d, 1H, J= 3.0 Hz, α-Glc(S-1) H-1], 4.6[d,1H, J=7.8 Hz, β-Glc(S-1), H-1)],
4.49[d, 1H, β-Glc(S-3), H-1)], 4.46[d, 1H, β-Gal(S-2), H-1)], 4.39[d, 2H, β-
GalNAc(S-4), H-1 and β-Gal (S-5) H-1], 1.94[s,3H, NHCOCH3 β-GalNAc(S-4)],
1.85[s, 3H, NHCOCH3, βGlcNAc(S-5)].
ES Mass
850[910-CH2OHCHO], 819[850-CH2OH], 761[819-NHCOCH3], 743[761-H2O],
726[743-OH], 707[H2O, H+], 879[910-CH2OH], 861[879-H2O], 821[879-
NHCOCH3], 789[821-CH3, OH], 803[821-H2O], 689[707-H2O], 672[689-OH],
614[672-NHCOCH3], 597[614-OH], 566[597-CH2OH], 535[566-CH2OH], 517[535-
H2O], 504[707-S-4], 342[504-S-3],180[342-S-2].
Compound-C (ARSM-3) ARIESOSE:
Compound-c (46 mg) was obtained from fraction 61-75 of column chromatography-4.
On deacetylation of 32 mg of substance c with NH3/ acetone it afforded substance C
(24.0 mg) ��� ���
+28.71o (c 1% H2O). For experimental analysis, this compound was
dried over P2O5 at 100oC and 0.1 mm pressure for 8 hr. It gave positive Phenol-
sulphuric acid test, Feigl test, Morgan-Elson test.
C36H61O26N3 % C % H % N
Calculated 45.43 6.42 4.41
Found 45.42 6.43 4.41 1H NMR of Compound-C Ariesose acetate in CDCl3 at 300 MHz
6.23[d, 1H, J=3.3Hz, α-Glc(S-1) H-1)], 5.64[d, 1H, J=8.4Hz, β-Glc(S-1) H-1], 4.58
[d, 1H, J=7.5 Hz, β-Gal(S-2), H-1)], 4.55[d, 1H, J=7.8Hz, β-GalNAc (S-5) H-1],
4.49[d, 2H, J= 8.0 Hz, β-GalNAc(S-3), H-1, GalNAc(S-4), H-1], 3.88[m, 2H,
βGalNAc(S-3, S-4), H-3], 3.83[d, 1H, βGlc(S-1), H-3], 3.6[d, 1H, βGlc(S-1), H-4]. 13C NMR of Compound-C Ariesose acetate in CDCl3 at 300 MHz
89.13[1C, α-Glc(S-1), C-1], 91.57[1C, β-Glc(S-1), C-1], 101.88[1C, β-Glc(S-2), C-
1], 102.02[1C, β-GalNAc(S-5), C-1], 100.92[1C, β-GalNAc(S-3), C-1], 101.19[1C, β-
GalNAc(S-4), C-1].

56
1H NMR of Compound-C Ariesose in D2O at 300 MHz
5.15[d, 1H, J=3.3 Hz, α-Glc(S1), H-1], 4.59[d, 1H, J=7.8Hz, β-Glc(S1), H-1], 4.47 [d,
1H, J= 7.5 Hz, β-Gal(S-2), H-1], 4.45[d, 1H, J=7.8 Hz, β-Gal(S-5), H-1], 4.38[d, 1H,
J= 8.0 Hz, β-GalNAc(S-3), H-1 and β-GalNAc(S-4), H-1].
ES Mass:
892 [951- CH2OHCHO (59)], 848 [892-CH3CO,H (44),], 893 [951-NHCOCH3 (58)],
916 [951- H2O, OH (35)], 730 [748- H2O (18), 687 [730-CH3O (43)], 686 [687- H
(1)], 668 [686-H2O (18)], 510 [545-H2O, OH (35)], 467 [510-CH3CO (43)], 487[545-
NHCOCH3 (58)], 405 [465-CH2OHCHO (60)].
Compound -D (ARSM-4) RIESOSE
Compound d (62 mg) was obtained from fraction 86-105 of column chromatography
4. On deacetylation of 52 mg of substance d with NH3 / acetone it afforded substance
D (44 mg) ��� ���
+113.88o (c 1% H2O). For experimental analysis, this compound was
dried over P2O5 at 100o C and 0.1 mm ��� ���
+28.71ofor 8 hrs. It gave positive Phenol-
sulphuric acid test, Feigl test, Morgan-Elson test.
C40H68O31N2 %C %H %N
Calculated 44.84 6.38 3.08
Found 44.83 6.37 3.08 1H NMR of Compound-D Riesose acetate in CDCl3 at 300 MHz
δ 6.17[d, 1H, J=3.0, αGlc (S-1)], 5.37[d, 2H, βGlc (S-1) H-1 and αGlcNAc(S-3), H-
1)], 4.77[d, 1H, J=7.2 Hz, βGalNAc (S-5) H-1], 4.59 [d, 1H, J= 8.4 Hz, βGal(S-6),
H-1] 4.52[d, 2H, J=7.5 Hz, βGal(S-4), H-1 and βGal(S-2), H-1], 4.2[d, 1H, βGal(S-2),
H-2], 4.1[d, 1H, βGal(S-4), H-3], 3.8[d, 1H, βGlc(S-1), H-4, βGal(S-2), H-3], 3.46[d,
1H, βGalNAc(S-3), H-3]. 13C NMR of Compound-D Riesose acetate in CDCl3 at 300 MHz
90.24[ 1C, αGlc (S-1) C-1], 90.12[1C, βGlc (S-1) C-1], 90.12[1C, αGlcNAc (S-3) C-
1], 95.26[1C, βGalNAc (S-5), C-1)], 101.90[1C, β-Gal (S-6), C-1)], 101.05[1C, βGal
(S-4) C-1], 100.96[1C, βGal(S-2) C-1]. 1H NMR of Compound-D Riesose in D2O at 300 MHz
δ 5.16[d, 1H, J=3.0Hz, α-Glc(S-1), H-1], 4.60[d, 2H, J= 7.8 Hz, βGlc(S-1), H-1,
βGlcNAc(S-3), H-1], 4.52[d, 2H, J=7.8 Hz, β-Gal(S-4), β-Gal(S-6), H-1], 4.39[d,
2H, J=7.5 Hz, β-GalNAc(S-5), H-1)].
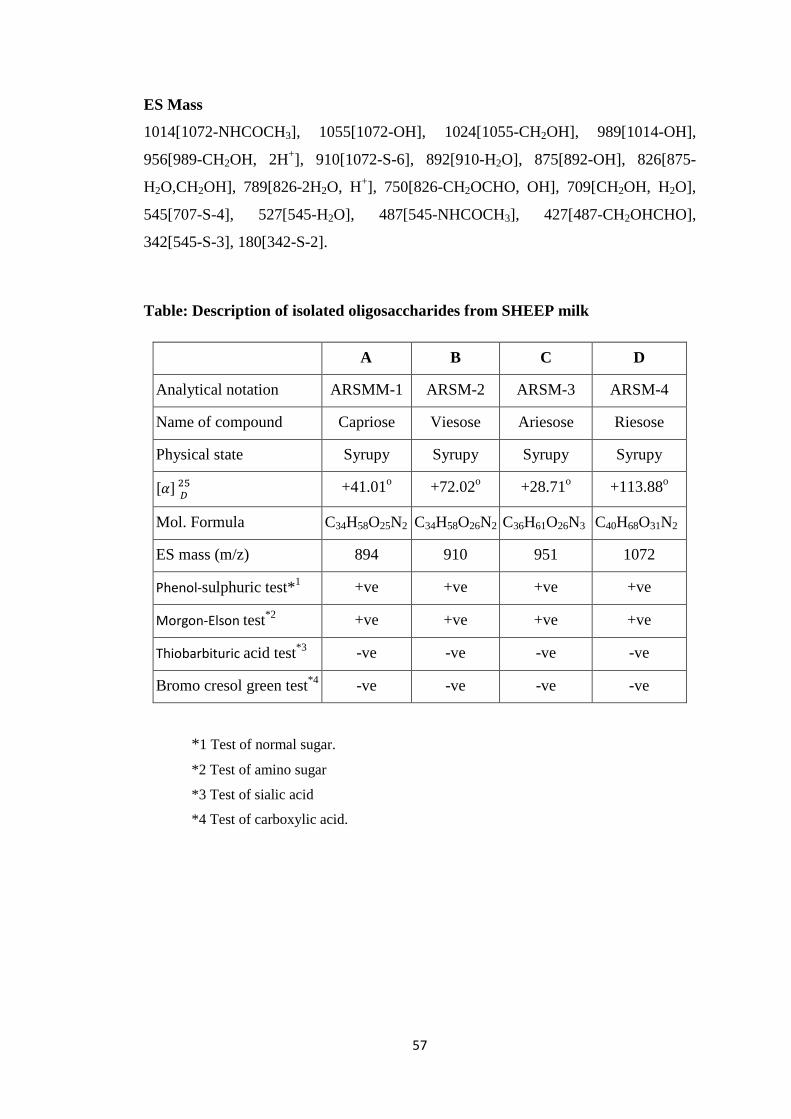
57
ES Mass
1014[1072-NHCOCH3], 1055[1072-OH], 1024[1055-CH2OH], 989[1014-OH],
956[989-CH2OH, 2H+], 910[1072-S-6], 892[910-H2O], 875[892-OH], 826[875-
H2O,CH2OH], 789[826-2H2O, H+], 750[826-CH2OCHO, OH], 709[CH2OH, H2O],
545[707-S-4], 527[545-H2O], 487[545-NHCOCH3], 427[487-CH2OHCHO],
342[545-S-3], 180[342-S-2].
Table: Description of isolated oligosaccharides from SHEEP milk
A B C D
Analytical notation ARSMM-1 ARSM-2 ARSM-3 ARSM-4
Name of compound Capriose Viesose Ariesose Riesose
Physical state Syrupy Syrupy Syrupy Syrupy
��� ���
+41.01o +72.02o +28.71o +113.88o
Mol. Formula C34H58O25N2 C34H58O26N2 C36H61O26N3 C40H68O31N2
ES mass (m/z) 894 910 951 1072
Phenol-sulphuric test*1 +ve +ve +ve +ve
Morgon-Elson test*2 +ve +ve +ve +ve
Thiobarbituric acid test*3 -ve -ve -ve -ve
Bromo cresol green test*4 -ve -ve -ve -ve
*1 Test of normal sugar.
*2 Test of amino sugar
*3 Test of sialic acid
*4 Test of carboxylic acid.

CHAPTER III
RESULTS AND DISCUSSION

58
RESULTS AND DISCUSSION
COMPOUND-A CAPRIOSE
Compound A, C34H58O25N2, �����
� +41.01o gave positive Phenol-sulphuric acid test206,
Fiegl test207 and Morgan-Elson test208 showing the presence of normal and amino sugars
moietie(s) in the compound A. The HSQC spectrum of acetylated capriose showed the
presence of five cross peaks of six anomeric protons doublets and carbons in their
respective region at 6.37x89.68, 5.72x91.66, 5.40x91.66, 5.19x101.05, 4.48x101.05(2H),
suggesting the presence of six anomeric protons and carbon in it. Further the presence of
six anomeric peaks of protons were separately confirmed by five 1H NMR doublets at δ
6.37(1H), 5.72(1H), 5.40(1H), 5.19(1H) 4.48(2H) in the acetylated spectrum of Capriose
in CDCl3 at 300 MHz. The presence of six anomeric carbons were confirmed by the
presence of three peaks at δ 89.68(1C), 91.66(2C), 101.05(3C) in the 13C NMR spectrum
of acetylated compound-A in CDCl3 at 300 MHz. These data suggested that compound
capriose may be a pentasccharides in its reducing form. In 1H NMR spectrum of
acetylated capriose out of 6 anomeric proton signals, signal at δ 6.37 and δ 5.72 were
assigned for downfield shifted α and β anomeric protons at the reducing end suggesting
that was in its reducing form and suggested that compound-A ‘capriose’ may be a
pentasccharide in reducing form. Further the ES mass spectrum of capriose showed the
highest mass ion peaks at m/z 956 assigned to [M+Na+K]+ and m/z 933 assigned to
[M+K] +, it also contain the molecular ion peak at m/z 894 confirming the molecular
weight as 894 which was in agreement with derived composition C34H58O25N2. The
reducing nature of compound-A was further confirmed by its methylglycosylation
MeOH/H+ followed by its acid hydrolysis, which led to the isolation of α and β- methyl
glucosides, suggesting the presence of glucose at the reducing end, for convenience all
five monosaccharides were denoted as S-1, S-2, S-3, S-4 and S-5. The monosaccharides
constituents in compound-A were confirmed by its killiani hydrolysis147 under strong
acidic condition, followed by paper chromatography and TLC. In this hydrolysis four
spots were found identical with the authentic samples of Glc, Gal, GlcNac and FucNac by
co-chromatography. Thus the pentasaccharide contained four types of monosaccharides
units i.e. Glc, Gal, GlcNac and FucNac. The pentasccharide nature of capriose was
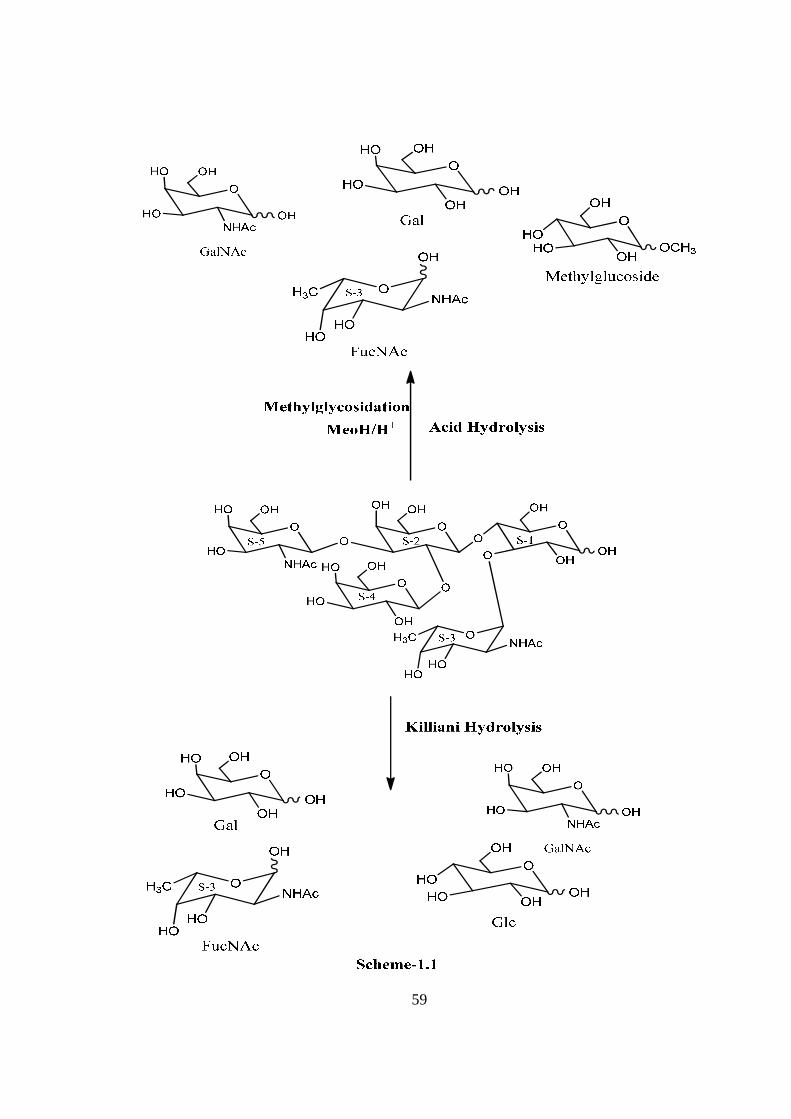
59
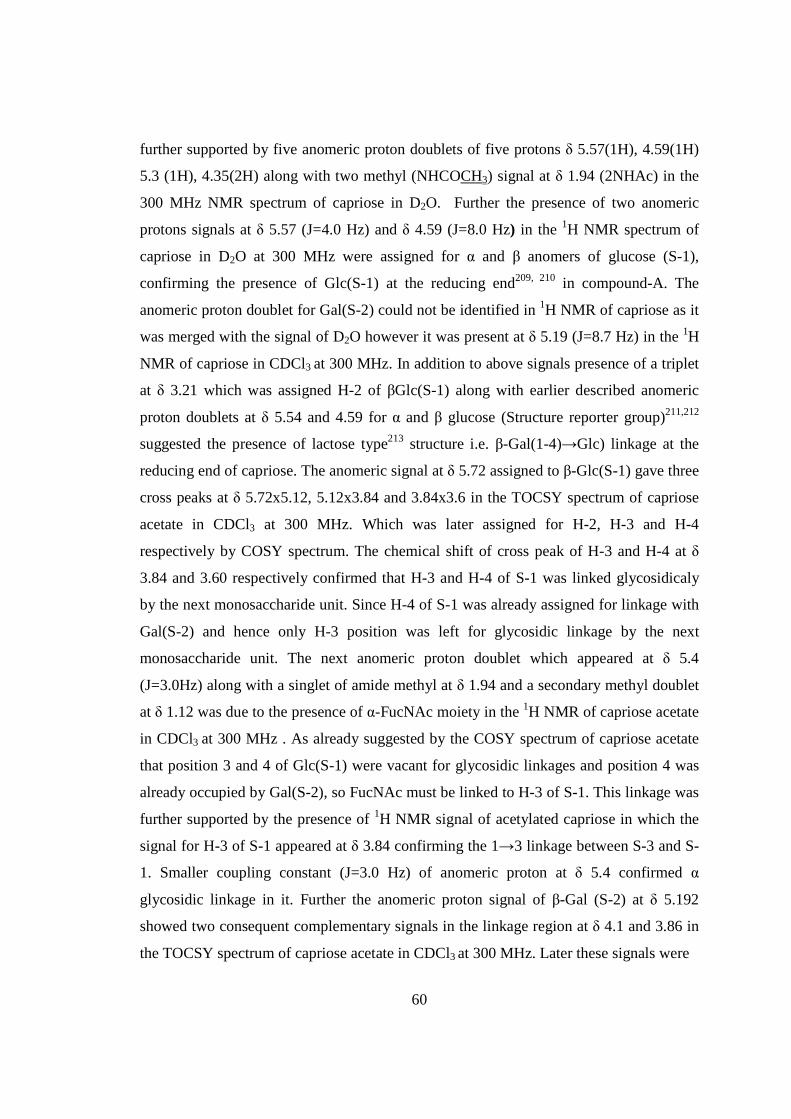
60
further supported by five anomeric proton doublets of five protons δ 5.57(1H), 4.59(1H)
5.3 (1H), 4.35(2H) along with two methyl (NHCOCH3) signal at δ 1.94 (2NHAc) in the
300 MHz NMR spectrum of capriose in D2O. Further the presence of two anomeric
protons signals at δ 5.57 (J=4.0 Hz) and δ 4.59 (J=8.0 Hz) in the 1H NMR spectrum of
capriose in D2O at 300 MHz were assigned for α and β anomers of glucose (S-1),
confirming the presence of Glc(S-1) at the reducing end209, 210 in compound-A. The
anomeric proton doublet for Gal(S-2) could not be identified in 1H NMR of capriose as it
was merged with the signal of D2O however it was present at δ 5.19 (J=8.7 Hz) in the 1H
NMR of capriose in CDCl3 at 300 MHz. In addition to above signals presence of a triplet
at δ 3.21 which was assigned H-2 of βGlc(S-1) along with earlier described anomeric
proton doublets at δ 5.54 and 4.59 for α and β glucose (Structure reporter group)211,212
suggested the presence of lactose type213 structure i.e. β-Gal(1-4)→Glc) linkage at the
reducing end of capriose. The anomeric signal at δ 5.72 assigned to β-Glc(S-1) gave three
cross peaks at δ 5.72x5.12, 5.12x3.84 and 3.84x3.6 in the TOCSY spectrum of capriose
acetate in CDCl3 at 300 MHz. Which was later assigned for H-2, H-3 and H-4
respectively by COSY spectrum. The chemical shift of cross peak of H-3 and H-4 at δ
3.84 and 3.60 respectively confirmed that H-3 and H-4 of S-1 was linked glycosidicaly
by the next monosaccharide unit. Since H-4 of S-1 was already assigned for linkage with
Gal(S-2) and hence only H-3 position was left for glycosidic linkage by the next
monosaccharide unit. The next anomeric proton doublet which appeared at δ 5.4
(J=3.0Hz) along with a singlet of amide methyl at δ 1.94 and a secondary methyl doublet
at δ 1.12 was due to the presence of α-FucNAc moiety in the 1H NMR of capriose acetate
in CDCl3 at 300 MHz . As already suggested by the COSY spectrum of capriose acetate
that position 3 and 4 of Glc(S-1) were vacant for glycosidic linkages and position 4 was
already occupied by Gal(S-2), so FucNAc must be linked to H-3 of S-1. This linkage was
further supported by the presence of 1H NMR signal of acetylated capriose in which the
signal for H-3 of S-1 appeared at δ 3.84 confirming the 1→3 linkage between S-3 and S-
1. Smaller coupling constant (J=3.0 Hz) of anomeric proton at δ 5.4 confirmed α
glycosidic linkage in it. Further the anomeric proton signal of β-Gal (S-2) at δ 5.192
showed two consequent complementary signals in the linkage region at δ 4.1 and 3.86 in
the TOCSY spectrum of capriose acetate in CDCl3 at 300 MHz. Later these signals were
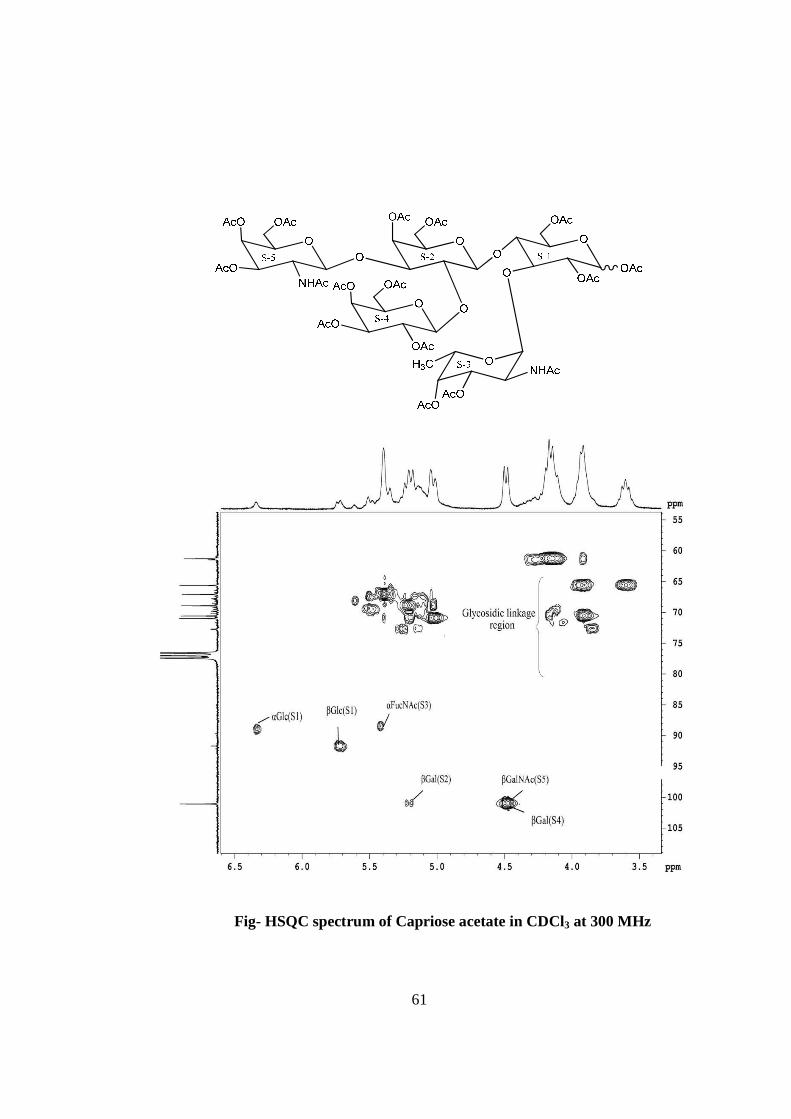
61
Fig- HSQC spectrum of Capriose acetate in CDCl3 at 300 MHz

62
OAcO
OAc
NHAc
S-5
AcO
O
O
OAc
S-2
AcO
O
OAc
S-4
OAc O
AcO
OAc
O
OAc
S-1OO OAc
OAc
O
OAc
H3C
AcO
NHAcS-3

63
OAcO
OAc
NHAc
S-5
AcO
O
O
OAc
S-2
AcO
O
OAc
S-4
OAc O
AcO
OAc
O
OAc
S-1OO OAc
OAc
O
OAc
H3C
AcO
NHAcS-3

64
OHO
OH
NHAc
S-5
HO
O
O
OH
S-2
HO
O
OH
S-4
OH O
HO
OH
O
OH
S-1OO OH
OH
O
OH
H3C
HO
NHAcS-3

65
OA cO
OAc
NHAc
S-5
AcO
O
O
OAc
S-2
AcO
O
OAc
S-4
OAc O
AcO
OAc
O
OAc
S-1OO OAc
OAc
O
OAc
H3C
AcO
NHAcS-3

66
OAcO
OAc
NHAc
S-5
AcO
O
O
OAc
S-2
AcO
O
OAc
S-4
OAc O
AcO
OAc
O
OAc
S-1OO OAc
OAc
O
OAc
H3C
AcO
NHAcS-3
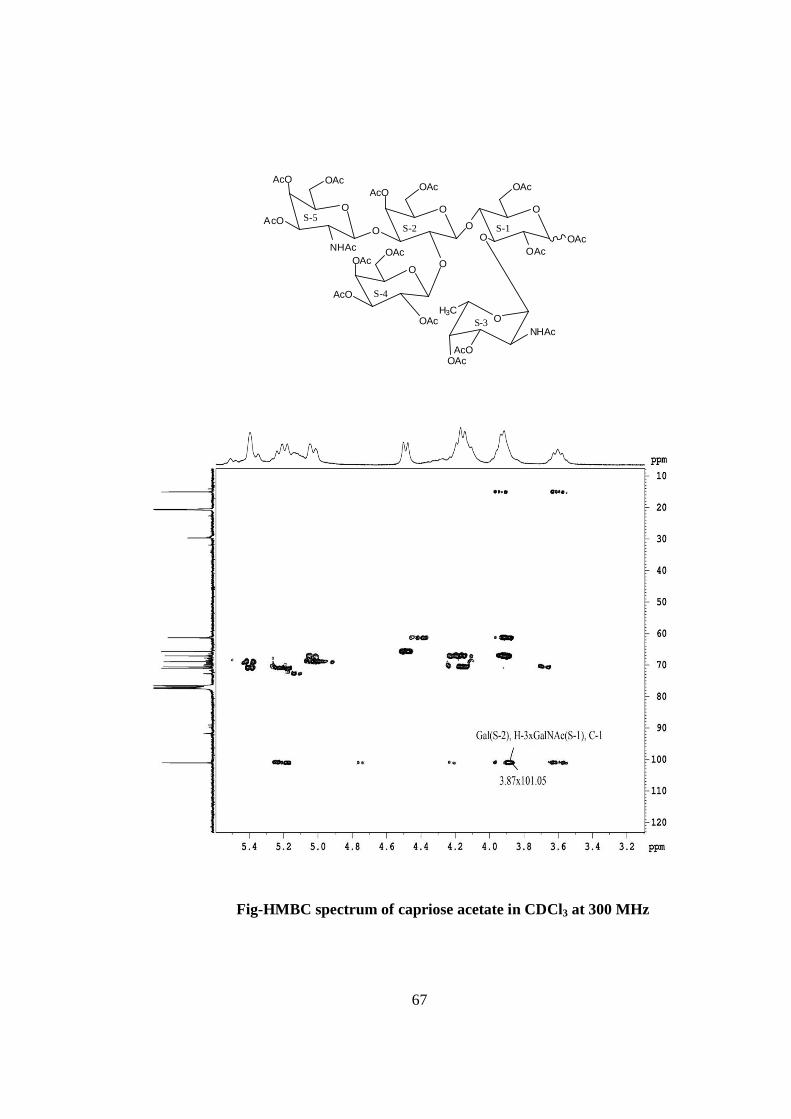
67
Fig-HMBC spectrum of capriose acetate in CDCl3 at 300 MHz
OAcO
OAc
NHAc
S-5
AcO
O
O
OAc
S-2
AcO
O
OAc
S-4
OAc O
AcO
OAc
O
OAc
S-1OO OAc
OAc
O
OAc
H3C
AcO
NHAcS-3

68
Table-1: 1H NMR values of CAPRIOSE in D2O at 300 MHz
identified as H-2 and H-3 of β-Gal (S-2) by the COSY spectrum of capriose aceteate
suggesting that H-2 and H-3 of S-2 were available for glycosidic linkage by the next
monosaccharide units. Another anomeric proton signal which appeared as doublet at δ
4.48 (J=7.2 Hz) along with a singlet of amide methyl was due to the presence of β-
GalNAc moiety. The anomeric proton signal present at δ 4.48 has its complementary
signal at 101.05 in HSQC spectrum of capriose acetate. The anomeric carbon further
gave cross peak at 3.86 in HMBC spectrum of capriose acetate confirming the 1→3
linkage between S-5 and S-2. The large coupling constant of anomeric signal (S-5) with J
value 7.2 Hz confirmed the β-configuration of the β-GalNAc (S-5). The absence of
methine protons in linkage region of β-GalNAc (S-5) confirm that β-GalNAc (S-5) was
present at non-reducing end, which was confirmed by the TOCSY and COSY
experiments of capriose acetate in CDCl3 at 300 MHz. Since it was ascertained by the
COSY and TOCSY spectrum of capriose acetate that the position of H-2 and H-3 of
Gal(S-2) were available for glycosidic linkages and position H-3 of Gal(S-2) was already
linked with β-GalNAc (S-5), the left over H-2 position of Gal (S-2) must be linked with
β-Gal (S-4) which was further confirmed by the appearance of H-2 signal of S-2 at δ 4.1
in 1H NMR of capriose acetate at 300 MHz. The next anomeric proton signal which
appeared at δ 4.88 (J=7.2 Hz) was due to the presence of β-Gal (S-4) moiety. Further the
presence of a double doublet at δ 4.1 in the 1H NMR of capriose acetate which has its
complimentary signal at δ 70 in the HSQC spectrum of capriose acetate suggested that
the H-2 of S-2 was vacant for glycosidic linkage and was glycosidicaly linked to S-4.
The large coupling constant of anomeric signal of (S-4) with J value 7.2 Hz confirmed
Moieties 1H NMR (δ) Coupling cons. (J)
α-Glc (S-1) β-Glc (S-1)
β-Gal (S-2)
β-FucNAc (S-3) β -Gal (S-4) β-GalNAc (S-5)
5.57 4.59 n.d. 5.3 4.35 4.35
4.0 Hz 8.0 Hz n.d.
3.0 Hz 8.0 Hz 8.0 Hz
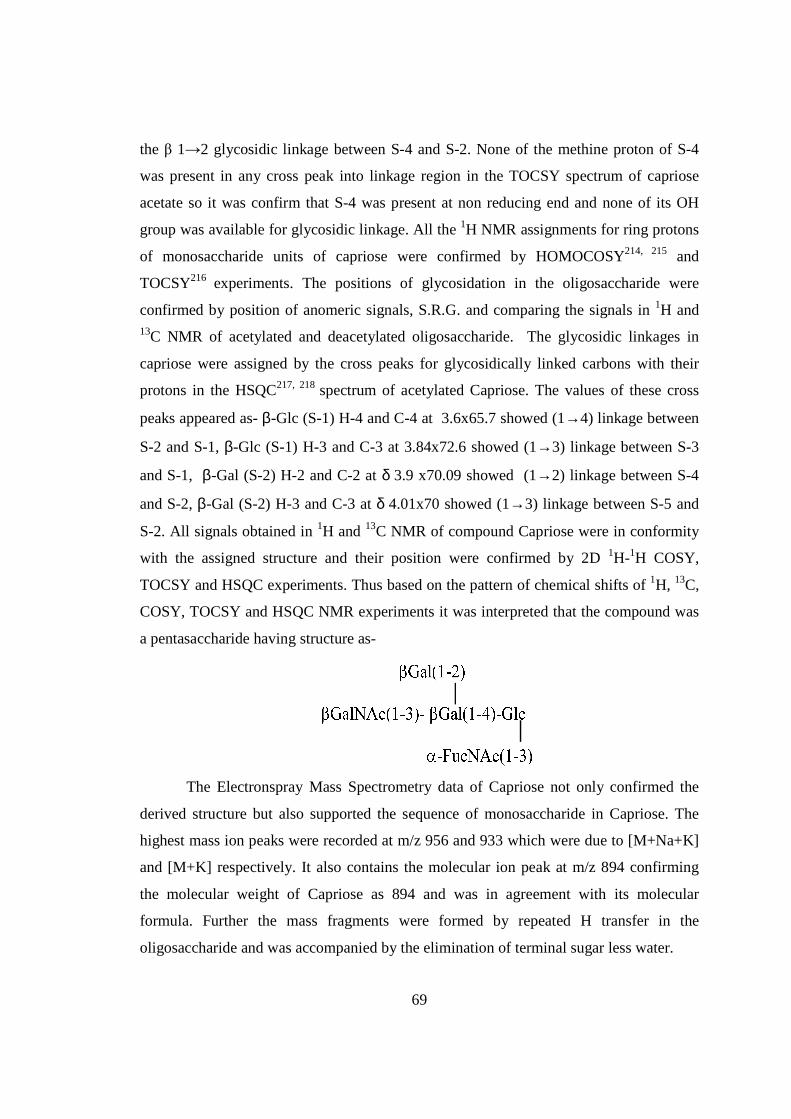
69
the β 1→2 glycosidic linkage between S-4 and S-2. None of the methine proton of S-4
was present in any cross peak into linkage region in the TOCSY spectrum of capriose
acetate so it was confirm that S-4 was present at non reducing end and none of its OH
group was available for glycosidic linkage. All the 1H NMR assignments for ring protons
of monosaccharide units of capriose were confirmed by HOMOCOSY214, 215 and
TOCSY216 experiments. The positions of glycosidation in the oligosaccharide were
confirmed by position of anomeric signals, S.R.G. and comparing the signals in 1H and 13C NMR of acetylated and deacetylated oligosaccharide. The glycosidic linkages in
capriose were assigned by the cross peaks for glycosidically linked carbons with their
protons in the HSQC217, 218 spectrum of acetylated Capriose. The values of these cross
peaks appeared as- β-Glc (S-1) H-4 and C-4 at 3.6x65.7 showed (1→4) linkage between
S-2 and S-1, β-Glc (S-1) H-3 and C-3 at 3.84x72.6 showed (1→3) linkage between S-3
and S-1, β-Gal (S-2) H-2 and C-2 at δ 3.9 x70.09 showed (1→2) linkage between S-4
and S-2, β-Gal (S-2) H-3 and C-3 at δ 4.01x70 showed (1→3) linkage between S-5 and
S-2. All signals obtained in 1H and 13C NMR of compound Capriose were in conformity
with the assigned structure and their position were confirmed by 2D 1H-1H COSY,
TOCSY and HSQC experiments. Thus based on the pattern of chemical shifts of 1H, 13C,
COSY, TOCSY and HSQC NMR experiments it was interpreted that the compound was
a pentasaccharide having structure as-
The Electronspray Mass Spectrometry data of Capriose not only confirmed the
derived structure but also supported the sequence of monosaccharide in Capriose. The
highest mass ion peaks were recorded at m/z 956 and 933 which were due to [M+Na+K]
and [M+K] respectively. It also contains the molecular ion peak at m/z 894 confirming
the molecular weight of Capriose as 894 and was in agreement with its molecular
formula. Further the mass fragments were formed by repeated H transfer in the
oligosaccharide and was accompanied by the elimination of terminal sugar less water.

70

71

72

73

74
The pentasaccharide m/z 894 (I) fragmented to give mass ion at m/z 691(II) [894-S5], this
fragment was arised due to the loss of terminal β-GlcNAc(S5) moiety from
pentasaccharide indicating the presence of β-GlcNAc(S5) at the non -reducing end. It
further fragmented to give mass ion peak at m/z 488 (III) [894-S4] which was due to loss
of β-Gal (S-4) moiety from tetrasaccharide. This fragment of 488 further fragmented to
give mass ion peak at m/z 342 (IV) [488-S3] which was due to loss of α-Fuc (S3) moiety
from the trisaccharide. This disaccharide unit again fragmented to give mass ion peak at
m/z 180(V) [342-S2], which was due to loss of Gal (S2) moiety from disaccharide. These
four mass ion peak II, III, IV and V were appeared due to the consequent loss of S-5, S-4,
S-3 and S2 from original molecule. The mass spectrum also contain the mass ion peak at
are m/z 366, 539, and 529 correspond to the mass ion fragment A, B, C, Which confirm
the position of S1, S2, S3 ,S4 and S5. The other fragmentation pathway in ES Mass spectrum
of compound A m/z 894 shows the mass ion peak at 879 [894-CH3], 862[879-OH],
833[862-CHO], 747[833-NHCOCH3], 691[894-S-5], 633[691-NHCOCH3], 616[633-
OH], 585[616-CH2OH], 567[585-H2O], 674[691-OH], 657[674-OH], 641[674-H2O,
CH3], 609[641-CH2OH, H+], 529[691-S4], 342[488-S3], 324[342-H2O], 180[342-S2].
Based on result obtained from chemical degradation/acid hydrolysis, Chemical
transformation, Electro spray mass spectrometry and 1H, 13C NMR and HOMOCOSY,
TOCSY, HMBC and HSQC 2D NMR techniques of acetylated Capriose and Capriose
the structure and sequence of isolated Novel oligosaccharide Capriose structure was
deduced as-
CAPRIOSE

75
COMPOUND-B VIESOSE
Compound B, C34H58O26N2, �����
� +72.02o gave positive Phenol-sulphuric acid test206,
Fiegl test207 and Morgan-Elson test208 showing the presence of normal and amino sugars
moietie(s) in the compound C. The HSQC spectrum of acetylated viesose showed the
presence of five cross peaks for six anomeric protons and six anomeric carbons in their
respective region at 6.22x89.10, 5.64x91.56, 4.976x91.56, 5.22x101.97,
4.56x100.84(2H), suggesting the presence of six anomeric doublet and carbon in it.
Further the presence of six anomeric peaks of anomeric protons were confirmed by
presence of five doublets at δ 6.22(1H), 5.64(1H), 5.22(1H), 4.97(1H), 4.56(2H) in the 1H
NMR spectrum of acetylated viesose in CDCl3 at 300 MHz. The presence of six
anomeric carbons were confirmed by the presence of four signals of anomeric carbons at
δ 89.10(1C), 91.56(2C), 100.97(1C), 100.84(2C) in 13C spectrum of viesose acetate in
CDCl3 at 300 MHz. These data suggested that viesose may be a pentasccharides in its
reducing form. In 1H NMR spectrum of acetylated viesose out of 6 anomeric proton
signal, signal at δ 6.22 and 5.64 contained downfield shifted α and β anomeric protons
suggested that it was in its reducing form and compound-B ‘viesose’ may be a
pentasccharide in its reducing form. Further the ES mass spectrum of viesose showed the
highest mass ion peaks at m/z 972 assigned to [M+Na+K]+ and m/z 949 assigned to
[M+K] +, it also contain the molecular ion peak at m/z 910 confirming the molecular
weight as 910 which was in agreement of derived composition i.e. C34H58O26N2. The
reducing nature of compound-B viesose was confirmed by its methylglycosylation
MeOH/H+ followed by its acid hydrolysis, which led to the isolation of α and β- methyl
glucosides, suggesting the presence of glucose at the reducing end, for convenience all
five monosaccharides were denoted as S-1, S-2, S-3, S-4 and S-5 respectively from the
reducing end. The monosaccharides constituents in compound-B were confirmed by its
killiani hydrolysis147 under strong acidic condition, followed by paper chromatography
and TLC. In this hydrolysis four spots were found identical with the authentic samples of
Glc, Gal, GlcNac and GalNac by co-chromatography. Thus the pentasaccharide
contained four types of monosaccharides units i.e. Glc, Gal, GlcNac and GalNac. The
pentasccharide nature of viesose was further supported by the presence of five anomeric
proton doublets for six anomeric protons at δ 5.20(1H), 4.6(1H), 4.49(1H), 4.46(1H),
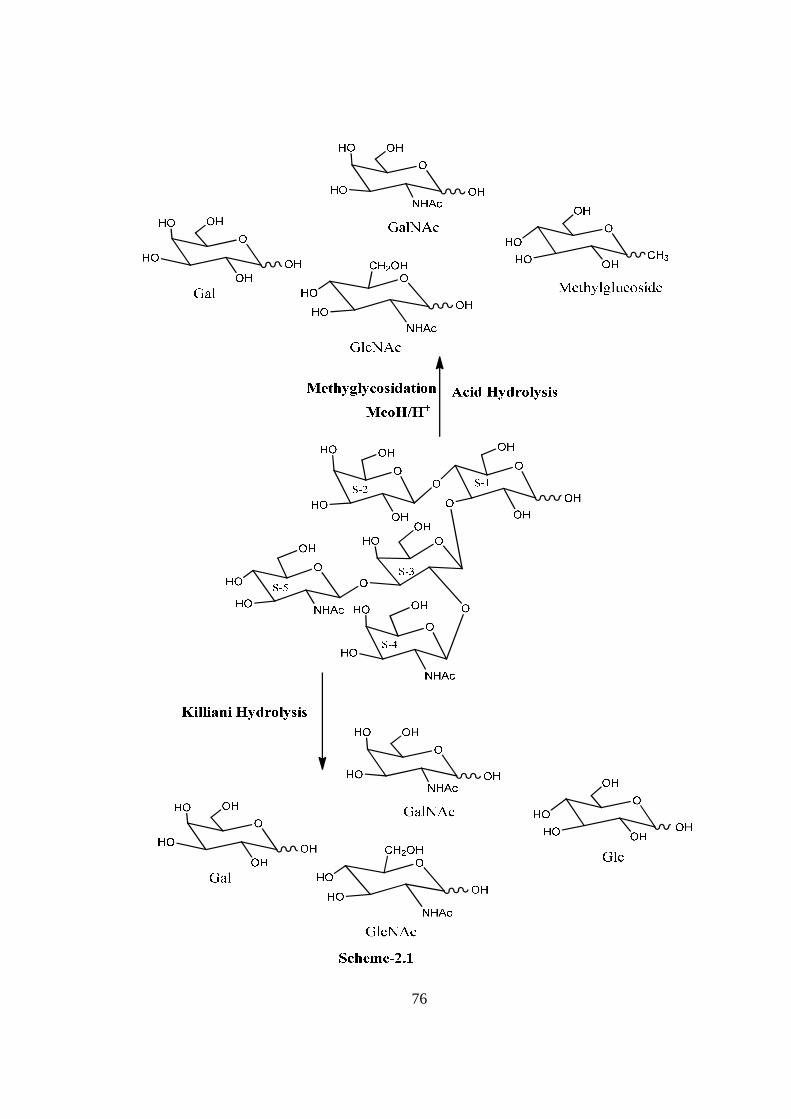
76

77
4.39(2H) in 1H NMR spectrum of viesose in D2O at 300 MHz, it also contain a singlet of
six protons for (NHCOCH3) group at δ 1.94 also supported by its 13C NMR in D2O which
contain two peaks for carbonyl (C=O) of NHCOCH3 at δ 173.67 and 177.39 confirming
the presence of the NHCOCH3 group in Compound-B. Presence of two anomeric protons
signals at δ 5.20 (J=3.0 Hz) and δ 4.6 (J=7.8 Hz) in the 1H NMR spectrum of viesose in
D2O at 300 MHz were assigned for α and β anomers of glucose (S-1), confirming the
presence of Glc(S-1) at the reducing end209, 210 in compound-B. Further the presence of
another anomeric doublet at δ4.56 (J=8.0 Hz) showed the presence of β-Gal residue as
the next monosaccharide. In addition to above signals presence of a triplet at δ 3.20 which
was assigned for H-2 of βGlc(S-1) along with earlier described anomeric proton doublets
at δ 5.2 and 4.6 for α and β glucose (Structure reporter group)211, 212 suggested the
presence of lactose213 type structure i.e. β-Gal(1-4)→Glc) linkage at the reducing end of
viesose. The anomeric proton doublet at δ 5.64 assigned to β-Glc(S-1) in the TOCSY
spectrum of viesose acetate gave three cross peaks i.e. at δ 3.6, 3.80 and 5.02 out of
which signals present at δ 3.6 and δ 3.80 were predicted for the linkage region which was
later assigned as H-4 and H-3 respectively of β-Glc(S-1) by the COSY spectrum of
viesose actetate confirming that H-4 and H-3 of β-Glc (S-1) was involved in glycosidic
linkage. Therefore it was confirmed that H-4 and H-3 β-Glc(S-1) were linked with next
monosaccharide units. As described earlier the presence of lactose type structure i.e. β-
Gal (S-2) was glycosidicaly linked by 1→4 linkage with the reducing Glc and it was
confirmed by the chemical shift of H-4 of S-1 at δ 3.60 in 1H NMR of acetylated viesose.
The 1→4 linkage between S-1 and S-2 was further confirmed by HMBC spectrum of
viesose acetate at 300 MHz which contain the cross peak signal of H-4 of Glc(S-1) and
C-1 of Gal(S-2) at δ 3.60x101.84. Since the anomeric proton of β-Gal(S-2) was appeared
at δ 4.56 in the 1H NMR of viesose acetate at 300 MHz and this anomeric signal in its
TOCSY spectrum does not gave any cross peak with methine proton in linkage region
confirmed that β-Gal(S-2) was present at non-reducing end and none of its OH group was
glycosidically linked. Since H-4 of S-1was already assigned for linkage with Gal(S-2)
and hence only H-3 position was Left for glycosidic linkage by the next monosaccharide
unit. The next anomeric proton signal which appeared at δ 4.97 (J=9.6 Hz) in 1H NMR of
compound viesose in CDCl3 was assigned for β-Gal(S-3).
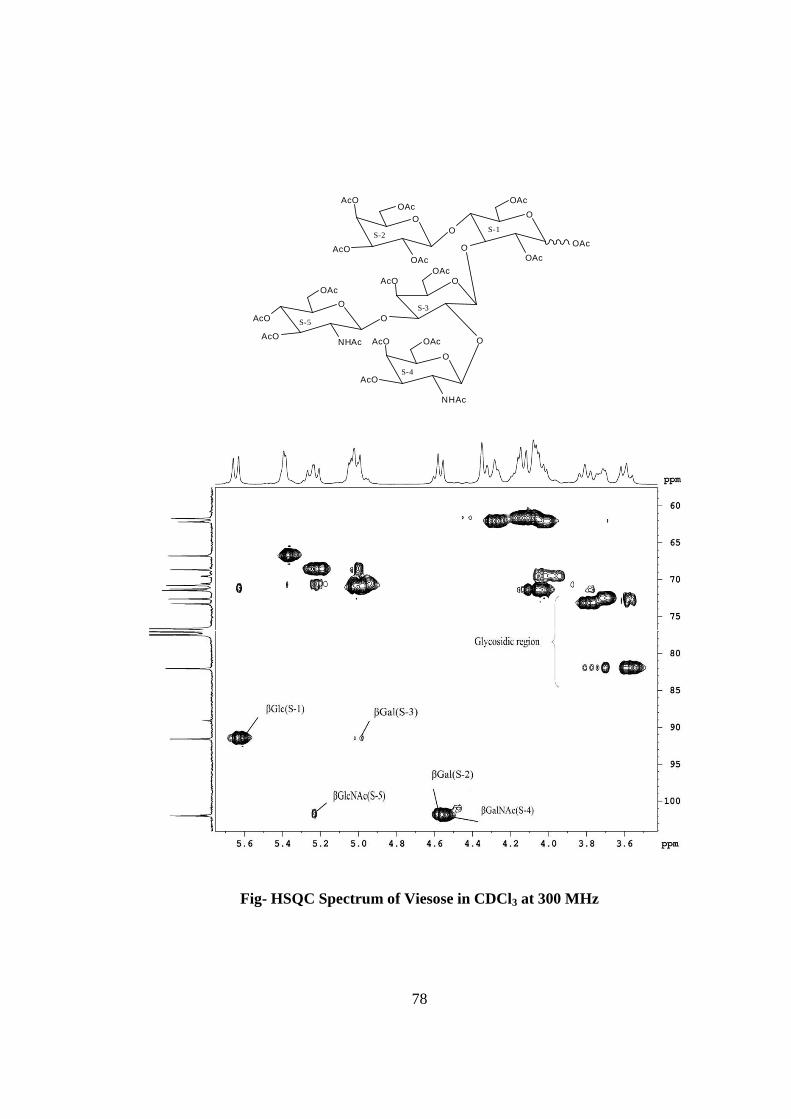
78
Fig- HSQC Spectrum of Viesose in CDCl3 at 300 MHz
O
O
OOAc
OAc
O
AcO
AcOOAc
OAcO
O
O
S-1S-2
S-3
O
AcO
AcO
NHAc
S-4
O
AcO
AcONHAc
S-5
OAcOAc
OAc
OAc
OAc
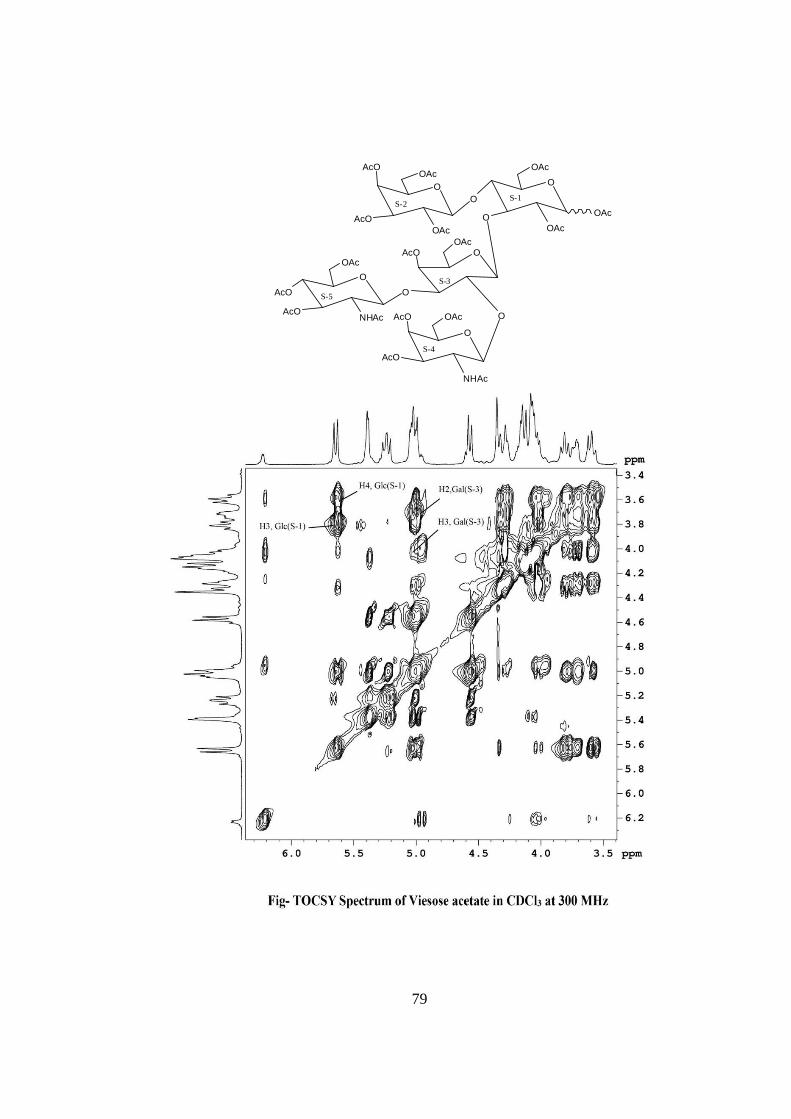
79
O
O
OOAc
OAc
O
AcO
AcOOAc
OAcO
O
O
S-1S-2
S-3
O
AcO
AcO
NHAc
S-4
O
AcO
AcONHAc
S-5
OAcOAc
OAc
OAc
OAc

80
O
O
OOAc
OAc
O
AcO
AcOOAc
OAcO
O
O
S-1S-2
S-3
O
AcO
AcO
NHAc
S-4
O
AcO
AcONHAc
S-5
OAcOAc
OAc
OAc
OAc

81
Table-2: 1H NMR values of VIESOSE in D2O at 300 MHz
The coupling constant of anomeric signal β-Gal (S-3) with larger value of 9.0 Hz showed
the β configuration of the β-Gal(S-3). This linkage was further confirmed by the presence
of 1H NMR of acetylated viesose in which the signal for H-3 of S-1 was appeared at δ
3.80 confirming the 1→3 linkage between S-1 and S-3. Further the anomeric proton
signal of β-Gal(S-3) at δ 4.97 in the 1H NMR of viesose acetate in CDCl3 showed three
consequent complementary signals at δ 3.72, 4.01 and 4.35 respectively in TOCSY
spectrum of viesose acetate, out of which two signals at δ 3.72 and δ 4.01were assigned
for the linkage by the next monosaccharide units. Later These signals were identified as
H-2 and H-3 of β-Gal(S-3) by the COSY spectrum of viesose acetate showing that two
OH groups of β-Gal(S-3) were available for glycosidic linkage by the next
monosaccharide units. The next anomeric proton which appeared at δ5.22 (J=8.0 Hz)
along with a singlet of amide methyl at δ 1.9 was due to presence of β-GlcNAc moiety in
the pentasaccharide was identified as β-GlcNAc (S-5). The anomeric proton signal of S-5
at δ 5.22 gave its complimentary signal at δ 101.97 in the HSQC spectrum which further
gave cross peak with 1H NMR signal at 4.10 in the HMBC spectrum of viesose acetate
suggesting the 1→3 linkage between S-5 and S-3. The position of linkage H-3 of S-3 was
confirmed by the H-3 signal at δ 4.01 in the 1H NMR spectrum of compound viesose.
Since the anomeric proton of β-GlcNAc(S-5) at δ 5.22 in TOCSY spectrum of compound
viesose acetate does not show any methine proton signal in linkage region confirming
that β-GlcNAc(S-5) was present at non-reducing end and none of its OH group was
available for glycosidic linkage. The next anomeric proton signal which appeared as a
doublet at δ 4.56 (J=8.0 Hz) in pentasaccharide was due to the presence of β-GalNAc
Moieties 1H NMR (δ) Coupling cons. (J)
α-Glc (S-1) β-Glc (S-1)
β-Gal (S-2)
β-Gal (S-3) β -GalNAc (S-4) β-GlcNAc (S-5)
5.2 4.6 4.39 4.46 4.39 4.49
3.0 Hz 7.8 Hz 8.0 Hz. 9.0 Hz 8.0 Hz 8.0 Hz

82
O
O
OOAc
OAc
O
AcO
AcOOAc
OAcO
O
O
S-1S-2
S-3
O
AcO
AcO
NHAc
S-4
O
AcO
AcONHAc
S-5
OAcOAc
OAc
OAc
OAc

83
O
O
OOA c
O A c
O
A cO
A cOO A c
OA cO
O
O
S-1S-2
S-3
O
A cO
A cO
N H A c
S-4
O
A cO
A cON HA c
S-5
O A cOA c
O A c
OA c
O A c
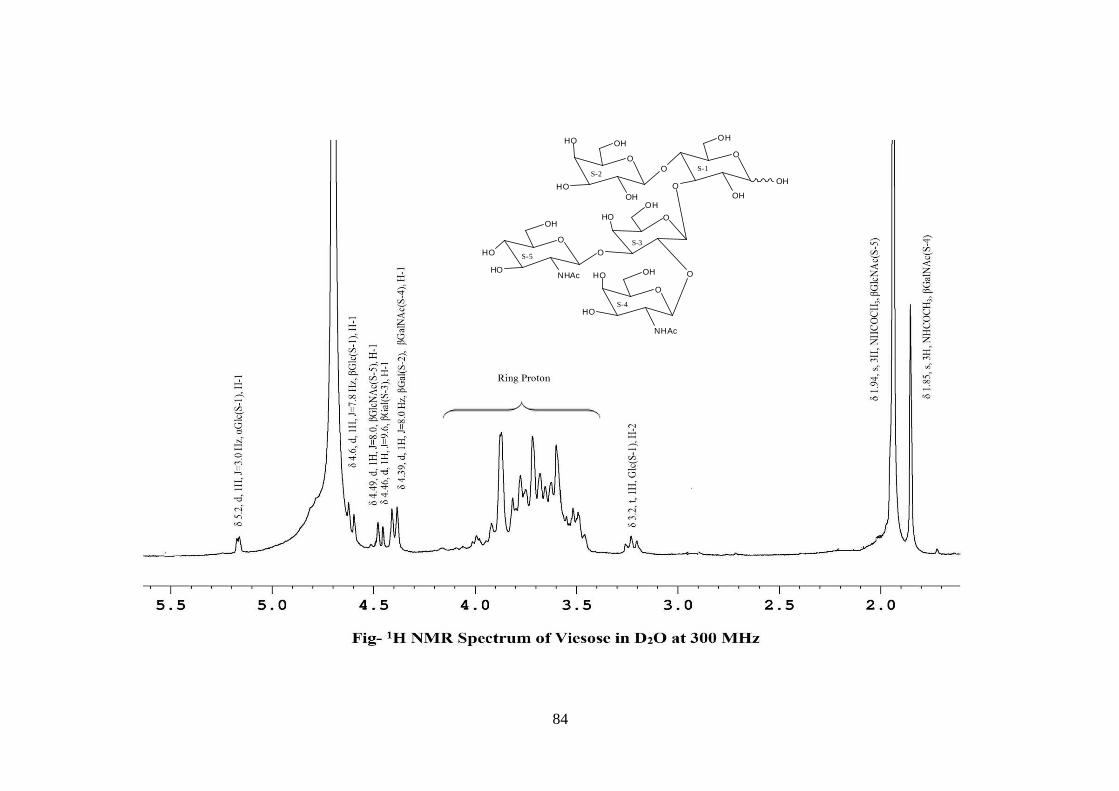
84
O
O
OOH
OH
O
HO
HOOH
OHO
O
O
S-1S-2
S-3
O
HO
HO
NHAc
S-4
O
HO
HONHAc
S-5
OHOH
OH
OH
OH
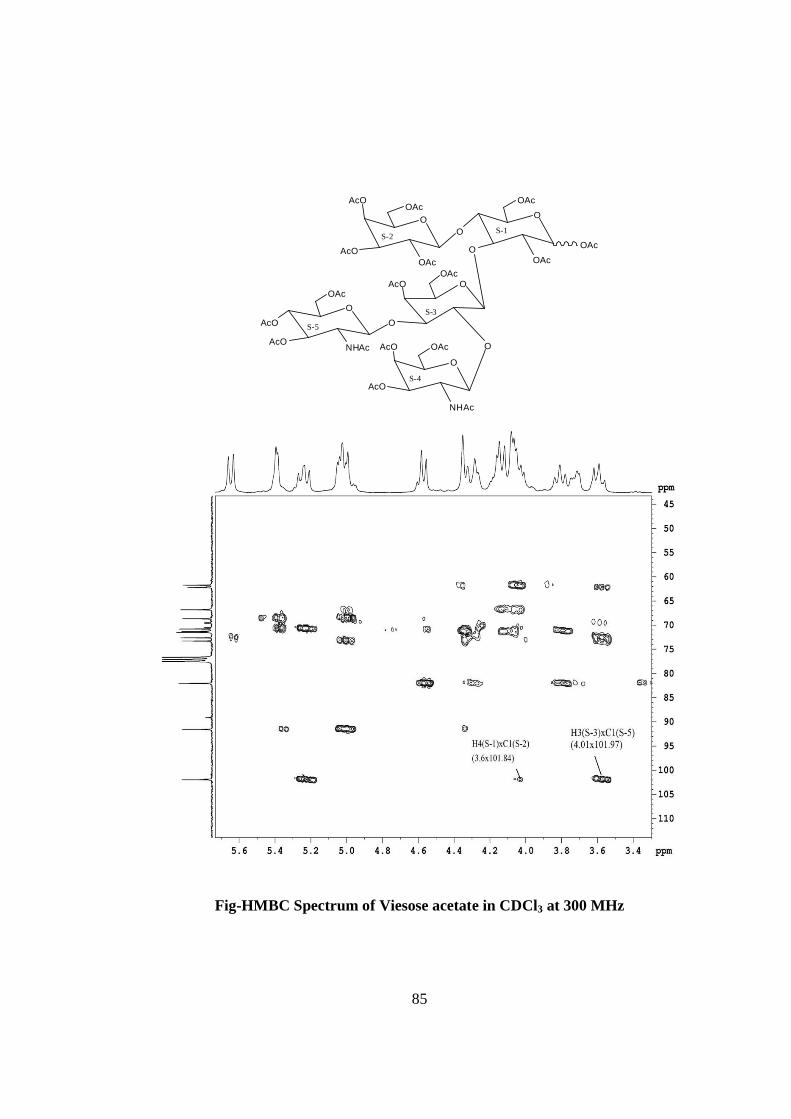
85
Fig-HMBC Spectrum of Viesose acetate in CDCl3 at 300 MHz
O
O
OOAc
OAc
O
AcO
AcOOAc
OAcO
O
O
S-1S-2
S-3
O
AcO
AcO
NHAc
S-4
O
AcO
AcONHAc
S-5
OAcOAc
OAc
OAc
OAc

86
moiety (S-4). As already suggested by TOCSY spectrum of viesose that position 2 and 3
of Gal(S-3) were vacant for glycosidic linkages and position 3 was already occupied by
GlcNAc(S-5), and leftover position of H-2 of Gal (S-3) may be linked with β-GalNAc(S-
4). The linkage between S-4 and S-3 was further supported by the presence of 1H NMR
signal of acetylated viesose in which the signal for H-2 of S-3 appeared at δ 3.72
confirming the 1→2 linkage between S-4 and S-3. The position of GalNAc(S-4) was also
confirmed at non-reducing end by TOCSY spectrum of viesose in which the anomeric
proton signal of GalNAc (S-4) at δ 4.56 does not contain any of its ring protons in
glycosidic region. The pentasaccharide nature of compound viesose was further
confirmed by the spectral studies of acetylated derivative of this compound. The
heteronuclear single quantum coherence (HSQC)217, 218 spectrum of acetylated compound
confirmed the position of glycosidic linkages by cross peaks of β-Glc(S-1) H-4 and C-4
at (δ 3.6x72.50) showed 1→4 linkage of S-2 and S-1 and β-Glc(S-1) H-3 and C-3 at (δ
3.8x73.1) showed 1→3 linkage of S-3 and S-1i.e. its H-4 and H-3 positions of Glc(S-1)
was involved in linkage. β-Gal(S-3) H-2 and C-2 at (δ 3.72x72.40) showed 1→2 linkage
of S-4 and S-3, β-Gal(S-3) H-3 and C-3 showed 1→3 linkage of S-5 and S-3. These
chemical shifts obtained from cross peaks of HSQC were consistent with the COSY and
TOCSY. On the basis of 1H NMR assignments for ring protons of monosaccharide units
of compound-B were confirmed by HOMOCOSY214, 215 and TOCSY216 experiments it
was interpreted that the compound-B ‘viesose’ was pentasaccharide having the structure:
The Electronspray Mass spectrometry data of Compound-B not only confirmed
the derived structure but also supported the sequence of monosaccharide units in
compound-B. The highest mass ion peaks were recorded at m/z 972 and 949 which were
due to [M+Na+K] and [M+K] respectively. It also contains the molecular ion peak at m/z
910 confirming the molecular weight of compound-B viesose as 910 and was agreement
with its molecular formula i.e. C34H58O26N2. Further the mass fragments were formed by
repeated H transfer in the oligosaccharide and were accompanied by the elimination by-

87

88
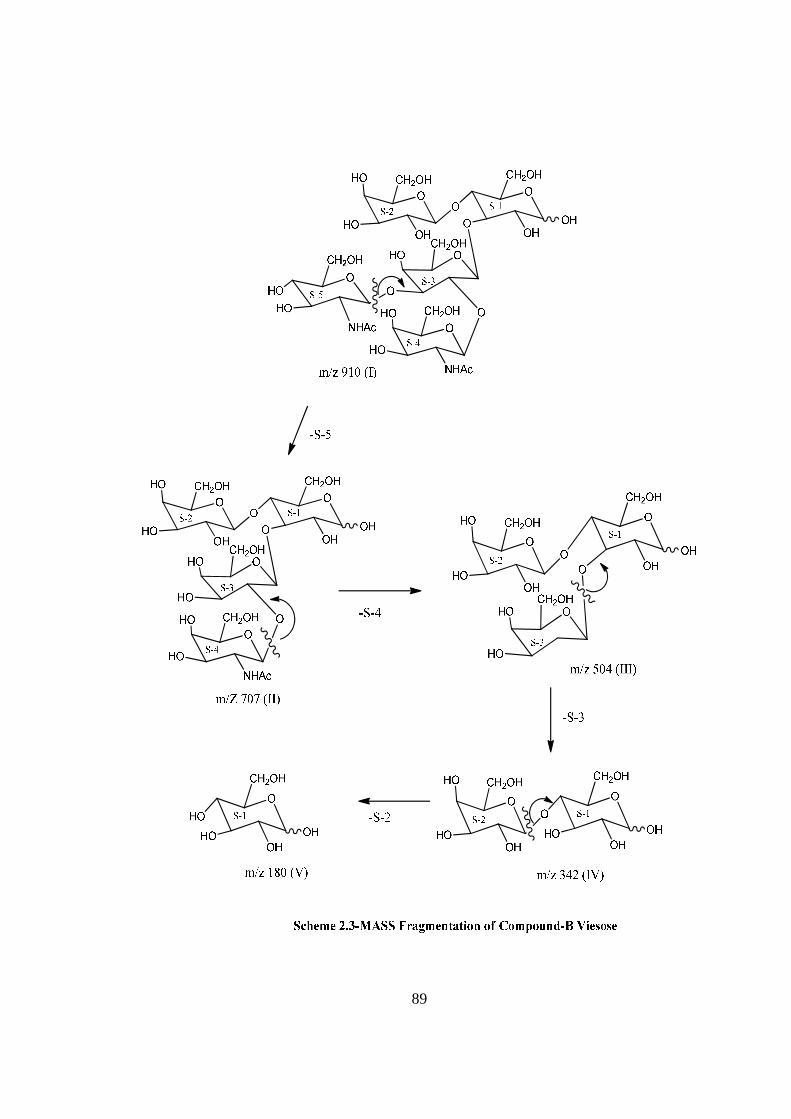
89
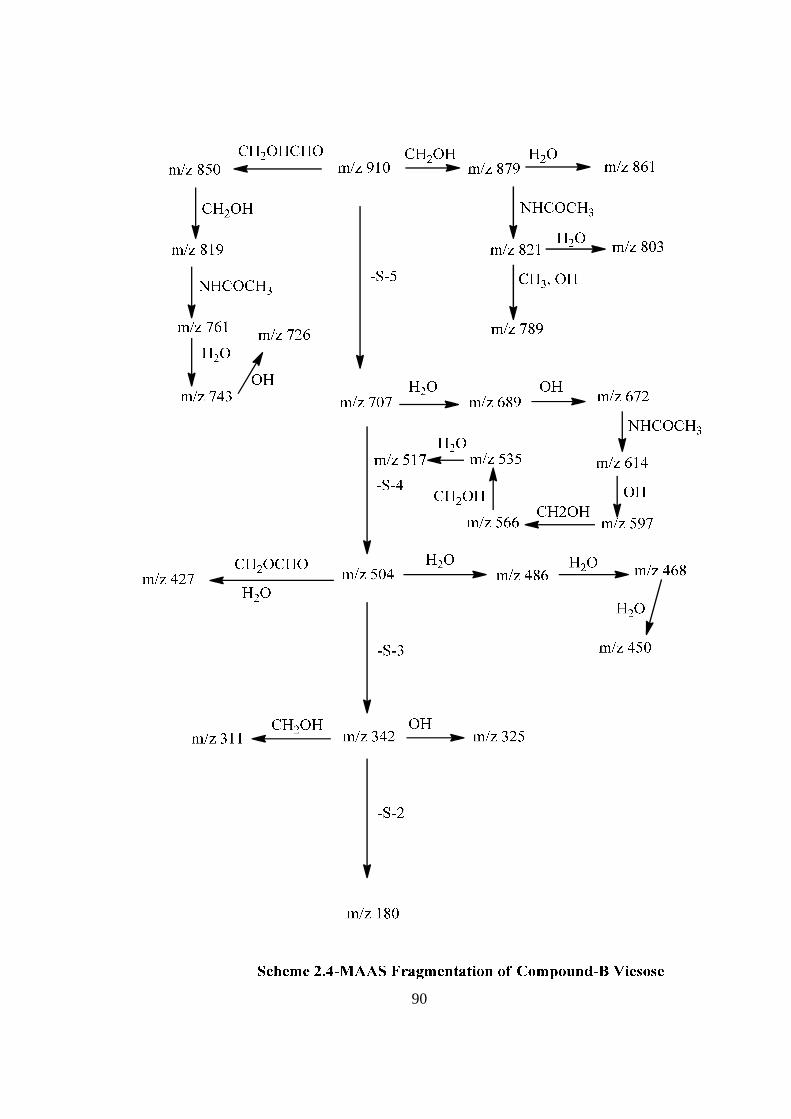
90
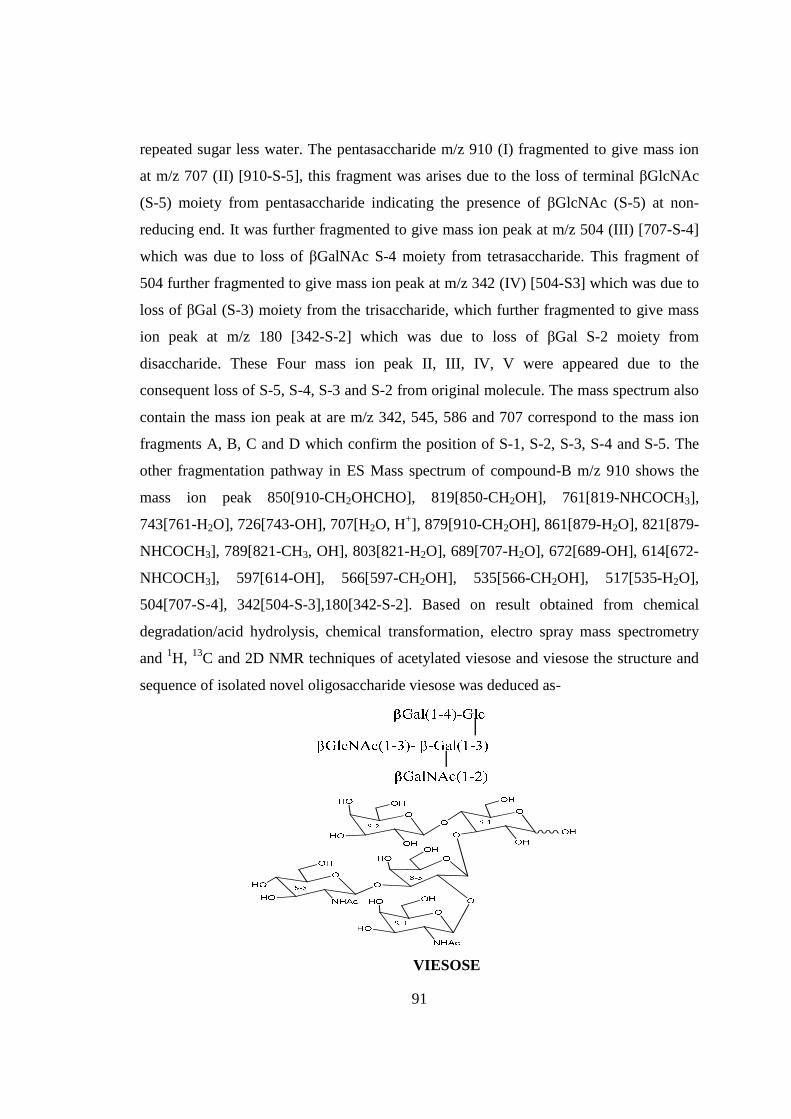
91
repeated sugar less water. The pentasaccharide m/z 910 (I) fragmented to give mass ion
at m/z 707 (II) [910-S-5], this fragment was arises due to the loss of terminal βGlcNAc
(S-5) moiety from pentasaccharide indicating the presence of βGlcNAc (S-5) at non-
reducing end. It was further fragmented to give mass ion peak at m/z 504 (III) [707-S-4]
which was due to loss of βGalNAc S-4 moiety from tetrasaccharide. This fragment of
504 further fragmented to give mass ion peak at m/z 342 (IV) [504-S3] which was due to
loss of βGal (S-3) moiety from the trisaccharide, which further fragmented to give mass
ion peak at m/z 180 [342-S-2] which was due to loss of βGal S-2 moiety from
disaccharide. These Four mass ion peak II, III, IV, V were appeared due to the
consequent loss of S-5, S-4, S-3 and S-2 from original molecule. The mass spectrum also
contain the mass ion peak at are m/z 342, 545, 586 and 707 correspond to the mass ion
fragments A, B, C and D which confirm the position of S-1, S-2, S-3, S-4 and S-5. The
other fragmentation pathway in ES Mass spectrum of compound-B m/z 910 shows the
mass ion peak 850[910-CH2OHCHO], 819[850-CH2OH], 761[819-NHCOCH3],
743[761-H2O], 726[743-OH], 707[H2O, H+], 879[910-CH2OH], 861[879-H2O], 821[879-
NHCOCH3], 789[821-CH3, OH], 803[821-H2O], 689[707-H2O], 672[689-OH], 614[672-
NHCOCH3], 597[614-OH], 566[597-CH2OH], 535[566-CH2OH], 517[535-H2O],
504[707-S-4], 342[504-S-3],180[342-S-2]. Based on result obtained from chemical
degradation/acid hydrolysis, chemical transformation, electro spray mass spectrometry
and 1H, 13C and 2D NMR techniques of acetylated viesose and viesose the structure and
sequence of isolated novel oligosaccharide viesose was deduced as-
VIESOSE
92
COMPOUND-C ARIESOSE
Compound C, C36H61O26N3, �����
� +28.71o gave positive Phenol-sulphuric acid test206,
Fiegl test207 and Morgan-Elson test208 showing the presence of normal and amino sugars
moietie(s) in the compound C. The HSQC spectrum of acetylated Ariesose showed the
presence of six cross peaks of anomeric protons and carbons in their respective region at
6.23x89.13, 5.64x91.57, 4.58x101.88, 4.55x102.02, 4.49x100.92, 4.49x101.19
suggesting the presence of six anomeric protons and carbons into it. Presence of five
anomeric peaks for six protons doublets were separately confirmed by 1H NMR of
acetylated ariesose at 300 MHz i.e. δ 6.23(1H), 5.64(1H), 4.58(1H), 4.55(1H), 4.49(2H).
The presence of six carbons were also confirmed by the presence of six anomeric carbons
peaks at δ 89.13(1C), 91.57(1C), 101.88(1C), 102.02(1C), 100.92(1C), 101.19(1C) in the
acetylated spectrum of Ariesose at 300 MHz. Further the anomeric proton singlet at δ6.23
and δ5.64 in the 1H NMR of acetylated compound-C showed downfield shifted α and β
anomeric protons showing its was in its reducing form and suggested that compound
Ariesose may be a pentasccharide in its reducing form. Further the ES mass spectrum of
Ariesose showed the highest mass ion peaks at m/z 1013 assigned to [M+Na+K]+ and
m/z 990 assigned to [M+K]+, it also contain the moleculer ion peak at m/z 951
confirming the moleculer weight of ariesose was 951 which was in agreement to derived
composition i.e.C36H61O26N3. The reducing nature of compound was further confirmed
by methylglycosylation MeOH/H+ followed by its acid hydrolysis, which led to isolation
of α and β- methyl glucosides, suggesting the presence of glucose at the reducing end, for
convenience all five monosaccharides were denoted as S-1, S-2, S-3, S-4 and S-5. The
monosaccharides constitute in compound–C were confirmed by its killiani147 hydrolysis
under strong acidic condition, followed by paper chromatography and TLC. In this
hydrolysis four spots were found identical with the authentic samples of Glc, Gal,
GlcNac and GalNac by co-chromatography. Thus the pentasaccharide contained four
types of monosaccharides units i.e. Glc, Gal, GlcNac and GalNac. The pentasccharide
nature of Ariesose was further supported by five anomeric peaks for six protons doublets
i.e. δ5.15 (1H), δ4.59 (1H), δ4.47 (1H), δ4.44 (1H), 4.38 (2H) in 1H NMR spectrum of
Ariesose in D2O at 300 MHz. The 1H NMR also contain three methyl signals of
NHCOCH3 at δ 1.85 and δ 2.01(2NHAc) showing out of five

93
94
three monosaccharides was N-acetylated sugars. Further the presence of two anomeric
protons signals at δ 5.15 (J=3.3 Hz) and δ 4.59 (J=7.8 Hz) in the 1H NMR spectrum of
Ariesose in D2O at 300 MHz were assigned for α and β anomers of glucose (S-1),
confirming the presence of Glc(S-1) at the reducing end209, 210 in compound-C ariesose.
Further the presence of another anomeric doublet at δ4.58 (J=7.5 Hz) suggested the
presence of β-Gal residue as the next monosaccharide unit. In addition to above signals
presence of a triplet at δ 3.20 which was assigned for H-2 of βGlc(S-1) along with earlier
described anomeric proton doublets at δ 5.15 and 4.59 for α and β glucose (Structure
reporter group)211, 212 suggested the presence of lactose213 type structure i.e. β-Gal(1-
4)→Glc linkage at the reducing end of ariesose. The anomeric proton doublet present at δ
5.64 assigned to β-Glc(S-1) in the TOCSY spectrum of ariesose acetate gave three cross
peaks at δ 3.6, 3.84 and 5.02 respectively out of which signal present at δ 3.6 and δ 3.84
were suggested in linkage region which was further assigned as H-4 and H-3 of β-Glc(S-
1) by the COSY spectrum showing that H-4 and H-3 of β-Glc (S-1) were available for
glycosidic linkage by next monosaccharide units. The earlier suggested 1→4 linkage
between Glc(S-1) and Gal(S-2) was further confirmed by HMBC spectrum at 300 MHz
which contain the cross peak signal of H-4 of S1 and C-1of β-Gal(S-2) at δ 3.6x101.88.
As suggested by the TOCSY spectra ariesose acetate that anomeric proton present at δ
4.58 assigned to βGal(S2) does not showed any cross peak in the linkage region
confirming that β-Gal(S-2) was present at non-reducing end and none of its OH group
were available for glycosidic linkage. Since the S-1 has its vacant positions i.e. H-3 and
H-4 and it was confirmed the H-4 was linked with Gal(S-2) therefore the H-3 of S-1 was
vacant and was available for glycosidic linkage by the next monosaccharide unit. The
next anomeric proton signal which appeared at δ 4.49 (J=8.0 Hz) in CDCl3 along with a
singlet of amide methyl (-NHCOCH3) at δ 1.85 in the 1H NMR of Ariesose in D2O was
assigned as β-GalNAc(S-3). The coupling constant of anomeric signal β-GalNAc (S-3)
with larger value of 8.0 Hz showed that β configuration of the β-GalNAc(S-3). The
linkage between S-1 and S-3 was ascertained by the presence of 1H NMR signal present
in acetylated Ariesose in which the signal for H-3 of S-1 appeared at δ3.84 which was
confirmed by the TOCSY and COSY spectrum. The 1→3 linkage between S-1 and S-3

95
Table-1: 1H NMR values of ARIESOSE in D2O at 300 MHz
was further confirmed by HMBC spectrum in acetylated Ariesose from cross peak signal
of β-Glc(S-1) H-3 and β-GalNAc(S-3) C-1 at δ3.83x100.92 at 300 MHz. Further the
anomeric proton signal of β-GalNAc(S-3) at δ 4.49 in the 1H NMR of acetate in CDCl3
was showed two consequent complementary signals in the linkage region at δ 4.14 and δ
3.85 in TOCSY spectrum out of which signal at δ 4.14 was assigned to H-2 of S-3 in
NHCOCH3 while the signal of 3.85 was assigned to glycosidic position of (S-3), showing
that one OH groups of β-GalNAc(S-3) was available for Glycosidic linkage. This signal
was identified for H-3 of β-GalNAc(S-3) by the COSY spectrum of Ariesose acetate,
suggesting that he H-3 postion of β-GalNAc(S-3) was linked with next monosaccharide
units. The next anomeric proton which also appeared at δ4.49 (J=8.0 Hz) along with a
singlet of amide methyl (NHCOCH3) at δ 2.01 in the 1H NMR of Ariesose was due to the
presence of β-GalNAc(S-4). The coupling constant of anomeric signal β-GalNAc (S-4)
with larger value of 8.0 Hz showing that β configuration of the β-GalNAc(S-4). The
linkage between S-3 and S-4 was ascertained by the presence of 1H-NMR signal in
acetylated Ariesose spectrum in which the signal for H-3 of S-3which was the only
position vacant at S3 appeared at 3.85 which was confirmed by the TOCSY and COSY in
CDCl3 at 300 MHz. The 1→3 linkage between S-3 and S-4 was further confirmed by the
cross peak of β-GalNAc(S-3)H-3 and β-GalNAc(S-4)C-1 at 3.851x101.19 in HMBC
spectrum of acetylated Ariesose at 300 MHz. The anomeric proton signal of β-
GalNAc(S4) which was also at δ 4.49 in the 1H NMR of acetate in CDCl3 was showed
two consequent complementary signals in the linkage region at δ 4.14 and δ 3.85 in
TOCSY spectrum out of which signal at δ 4.14 was assigned to H-2 of S-3 while the
Moieties 1H NMR (δ) Coupling cons. (J)
α-Glc (S-1)
β-Glc (S-1)
β-Gal (S-2)
β-GalNAc (S-3) β -GalNAc (S-4) β-GlcNAc (S-5)
5.15 4.59 4.47 4.45 4.38 4.38
3.3 Hz 7.8 Hz 7.5 Hz. 7.8 Hz 8.0 Hz 8.0 Hz

96
signal of 3.85 was assigned to glycosidic linkage of Areisose showing that one OH
groups of β-GalNAc(S-4) was available for Glycosidic linkage. This signal was further
identified for H-3 of β-GalNAc(S-4) by the COSY spectrum of Ariesose acetate in CDCl3
at 300 MHz. The H-3 postion of β-GalNAc(S-4) linked with next monosaccharide unit.
Another anomeric proton signal which appeared as a doublet at δ 4.55 (J=7.8 Hz) in 1H
NMR spectrum of Ariesose in CDCl3 along with singlet of amide methyl (NHCOCH3) at
δ 2.001was due to β-GalNAc(S-5). The1→3 linkage between S-4 and S-5 Further
confirmed by the cross peak signal of β-GalNAc(S-4)H-3 and β-GalNAc(S-5)C-1 at δ
3.85x102.02 by HMBC spectrum of acetylated ariesose at 300 MHz. Further the absence
of all the methine protons in linkage region of β-GalNAc(S-5) confirmed that β-
GalNAc(S-5) was present at non-reducing end and none of the OH group was available
for glycosidic linkage, which was confirmed by TOCSY and COSY in acetylated
ariesose at 300 MHz. All the 1H NMR assignments for ring protons of monosaccharide
units of Ariesose were confirmed by HOMOCOSY214, 215 and TOCSY216 experiments.
The positions of glycosidation in the oligosaccharide were confirmed by position of
anomeric signals, S.R.G. and comparing the signals in 1H and 13C NMR of acetylated and
deacetylated oligosaccharide. The glycosidic linkages in Ariesose were assigned by the
cross peaks for glycosidically linked carbons with their protons in the HSQC217, 218
spectrum of acetylated Ariesose. The values of these cross peaks appeared as- β-Glc (S-
1) H-4 and C-4 at (3.6x82) showed 1→4 linkage of S-2 and S-1 and β-Glc (S-1) H-3 and
C-3 at (3.83x73.50) showed 1→3 linkage i.e. its H-4 and H-3 positions of Glc(S-1) was
involved in linkage region. β-GalNAc(S-3) H-3 and C-3 at (3.85x73) showed 1→3
linkage between S-4 and S-3 i.e. its H-3 position of β-GalNAc(S-3) was involved in
linkage region. β-GalNAc(S-4) H-3 and C-3 at (3.85x73) showed 1→3 linkage between
S-5 and S-4 i.e. its H-3 position of β-GalNAc(S-4) was involved in linkage region. On
the basis of above data, it was interpreted that the compound-C was pentasaccharide
having the structure:
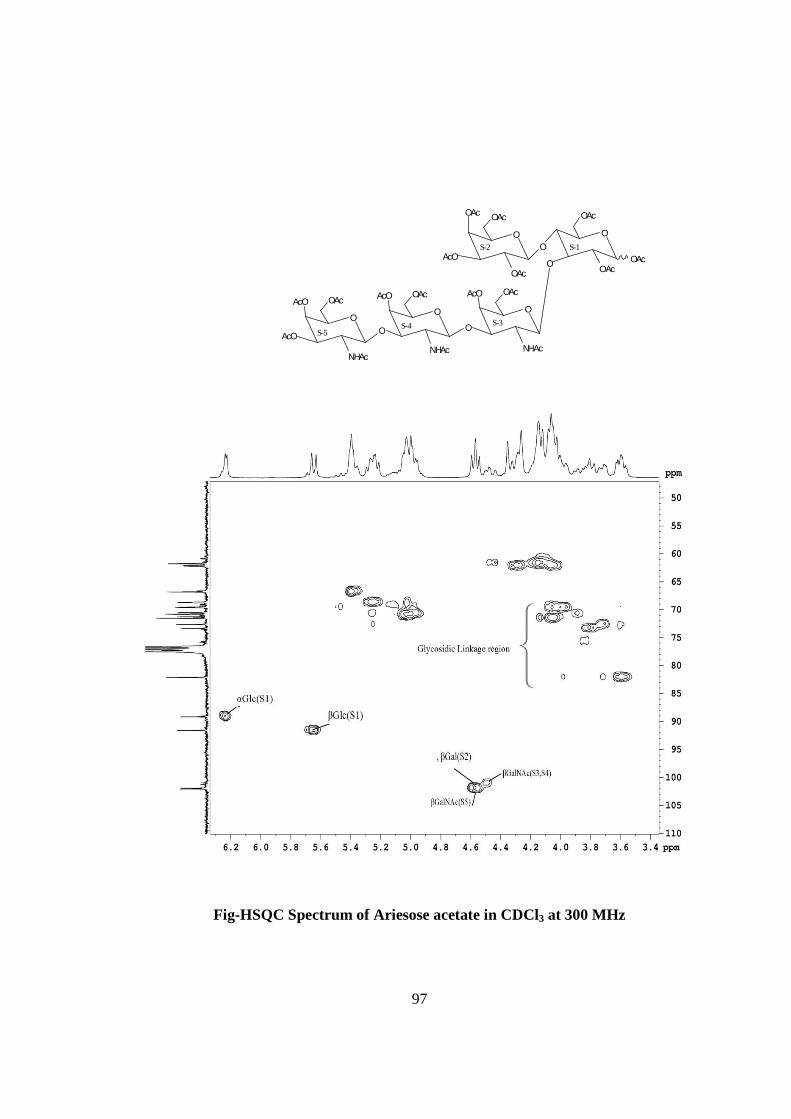
97
Fig-HSQC Spectrum of Ariesose acetate in CDCl3 at 300 MHz
OO O
OAcO OAc
OAcOAcOAc
AcO
OAc
O
OAcAcO
O
NHAc
O
OAcAcO
O
NHAc
O
OAcAcO
AcO
NHAc
S-1S-2
S-3S-4S-5

98
OO O
OAcO OAc
OAcOAcOAc
AcO
OAc
O
OAcAcO
O
NHAc
O
OAcAcO
O
NHAc
O
OAcAcO
AcO
NHAc
S-1S-2
S-3S-4S-5

99
OO O
OAcO OAc
OAcOAcOAc
AcO
OAc
O
OAcAcO
O
NHAc
O
OAcAcO
O
NHAc
O
OAcAcO
AcO
NHAc
S-1S-2
S-3S-4S-5
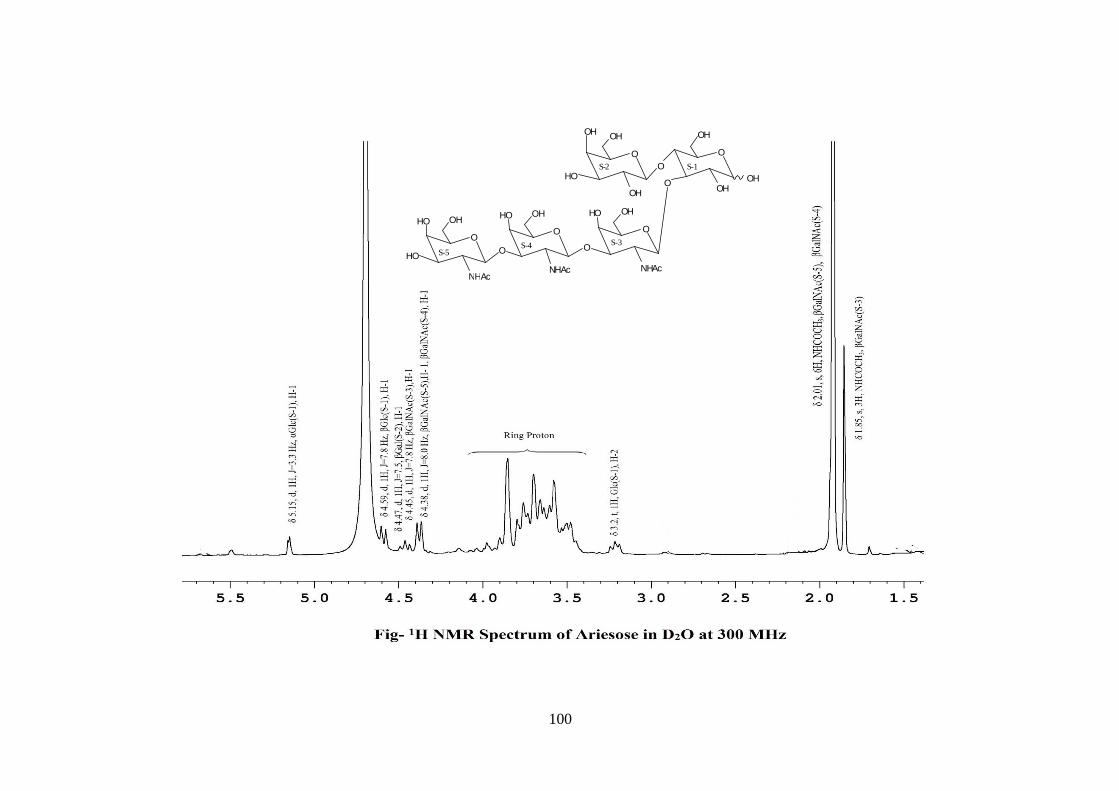
100
OO O
OHO OH
OHOHOH
HO
OH
O
OHHO
O
NHAc
O
OHHO
O
NHAc
O
OHHO
HO
NHAc
S-1S-2
S-3S-4S-5

101
OO O
OAcO OAc
OAcOAcOAc
AcO
OAc
O
OAcAcO
O
NHAc
O
OAcAcO
O
NHAc
O
OAcAcO
AcO
NHAc
S-1S-2
S-3S-4S-5

102
OO O
OAcO OAc
OAcOAcOAc
AcO
OAc
O
OAcAcO
O
NHAc
O
OAcAcO
O
NHAc
O
OAcAcO
AcO
NHAc
S-1S-2
S-3S-4S-5
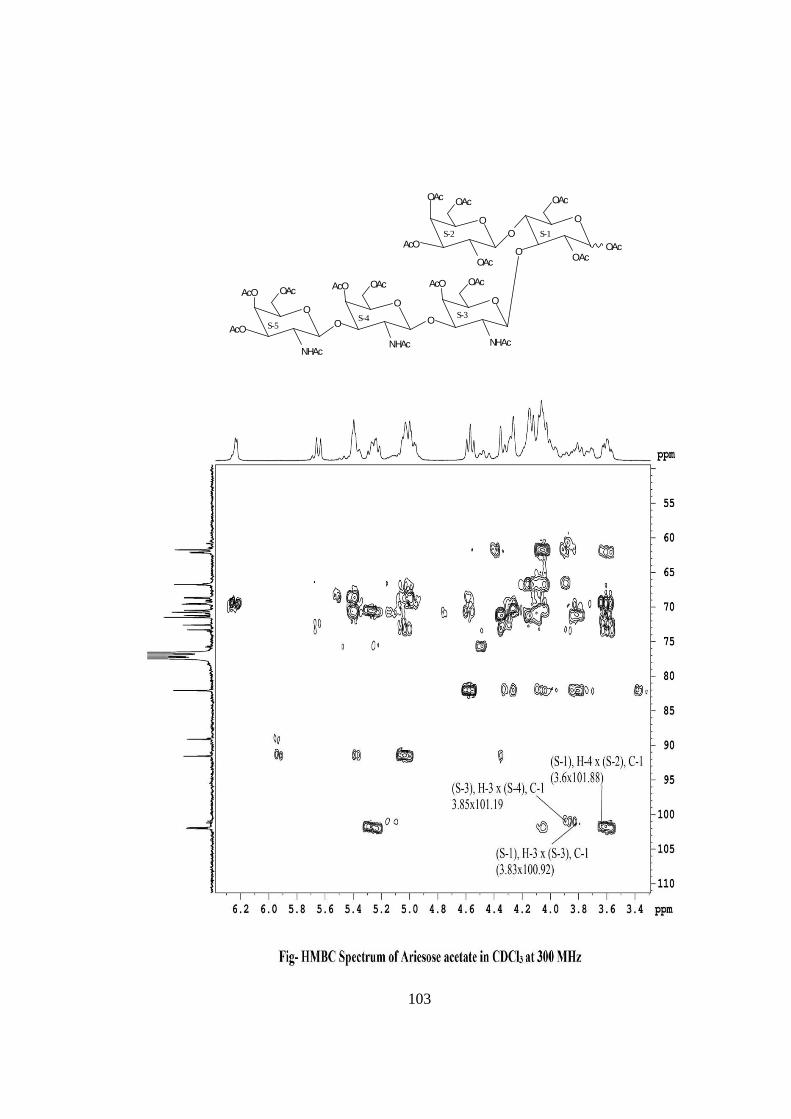
103
OO O
OAcO OAc
OAcOAcOAc
AcO
OAc
O
OAcAcO
O
NHAc
O
OAcAcO
O
NHAc
O
OAcAcO
AcO
NHAc
S-1S-2
S-3S-4S-5

104

105

106

107

108
The Electronspray Mass Spectrometry data of Ariesose not only confirmed the
derived structure but also supported the sequence of monosaccharide in Ariesose. The
highest mass ion peaks were recorded at m/z 1013 assigned to [M+Na+K]+ and m/z 974
assigned to [M+Na]+, it also contain the molecular ion peak at m/z 951 confirming the
molecular weight as 951 which was in agreement with its molecular formula
C36H61O26N3. The mass fragments were formed by repeated H transfer in the
oligosaccharide and was accompanied by the elimination of terminal sugar less water.
The pentasaccharide m/z 951 (I) fragmented to give mass ion at m/z 748 (II) [951-(S-5)],
this fragment was arised due to the loss of β-GalNAc (S-5) moiety from pentasaccharide.
After this, it (II) fragmented to give mass ion peak at m/z 545(III) [748-(S-4)] which was
due to the loss of β-GalNAc (S-4) moiety from tetrasaccharide. This trisaccharide of m/z
545 is then fragmented to give mass ion peak at m/z 342 (IV) [545-(S-3)] which was a
disaccharide(IV), due to loss of β-GalNAc (S-3) moiety. This disaccharide unit again
fragmented to give monosaccharide mass ion peak at m/z 180 [342- (S-2)] which was due
to loss of β-Gal (S-2). These four mass ion peak II, III, IV, and V, were appeared due to
the consequent loss of S-5, S-4, S-3, and S-2 from original molecule. The mass spectrum
also contain the mass ion peak at are m/z 342, 546, and 629 correspond to the mass ion
fragment A, B, C, Which confirm the position of S1, S2, S3 ,S4 and S5.The other
fragmentation pathway in ES Mass spectrum of compound C m/z 951 shows the mass
ion peak at 892 [951- CH2OHCHO (59)], 848 [892-CH3CO,H (44),], 893 [951-
NHCOCH3 (58)], 916 [951- H2O, OH (35)], 730 [748- H2O (18), 687 [730-CH3O (43)],
686 [687- H (1)], 668 [686-H2O (18)], 510 [545-H2O, OH (35)], 467 [510-CH3CO (43)],
487[545-NHCOCH3 (58)], 405 [465-CH2OHCHO (60)]. Based on result obtained from
chemical degradation/acid hydrolysis, Chemical transformation, Electro spray mass
spectrometry and 1H, 13C NMR and HOMOCOSY, TOCSY and HSQC 2D NMR
techniques of acetylated and Deacetylated Ariesose the structure and sequence of isolated
Novel oligosaccharide molecule was deduced as-

109
ARIESOSE
110
COMPOUND-D RIESOSE
Compound-D, C40H68O31N2, �����
� +113o gave positive Phenol-sulphuric acid test206,
Fiegl test207 and Morgan-Elson test208 showing the presence of normal and amino sugar
moietie(s) in the compound-D. The HSQC spectrum of acetylated riesose showed the
presence of six cross peaks for seven anomeric protons doublets and carbons in their
respective region at 6.17x90.24, 5.37x90.12, 4.77x95.26, 4.59x101.90, 4.52x101.05,
4.52x100.96 suggesting the presence of six anomeric protons and carbons in it. The
presence of seven anomeric proton doublets were confirmed by five anomeric signals in 1H NMR i.e. at δ 6.17(1H), 5.37(2H), 4.77(1H), 4.59(1H), 4.52(2H) in the 1H NMR
spectrum of riesose acetate in CDCl3 at 300 MHz. The presence of seven anomeric
carbons were confirmed by the presence of six anomeric signals in 13C spectrum at δ
90.12(2C), 90.24(1C), 95.26(1C), 100.96(1C), 101.05(1C), 101.90(1C), of acetylated
riesose in CDCl3 at 300 MHz. These data suggested that compound riesose may be a
Hexasccharide in its reducing form. In 1H NMR spectrum of riesose acetate which
contains seven anomeric signals, out of which signal at δ 6.17 and 5.37 were assigned for
downfield shifted α and β anomeric protons of monosaccharide present at the reducing
end suggested that compound-D ‘riesose’ may be a hexasccharide in its reducing form.
The hexaasccharide nature of riesose was further supported by presence of five anomeric
proton doublets for six anomeric protons at δ 5.16(1H), 4.60 (1H), 4.52(1H), 4.39(2H),
4.21(1H) along with two singlet at δ 1.94 and 1.86 for two methyl groups of NHCOCH3
at 300 MHz 1H NMR spectrum of riesose in D2O suggested that out of six
monosccharides two monosaccharides having N-acetyl groups. Further the ES mass
spectrum of riesose showed the highest mass ion peaks at m/z 1134 assigned to
[M+Na+K]+ and m/z 1111 assigned to [M+K]+, it also contain the molecular ion peak at
m/z 1072 confirming the molecular weight as 1072 which was in agreement of derived
composition C40H68O31N2. The reducing nature of compound was further confirmed by
methylglycosylation MeOH/H+ followed by its acid hydrolysis, which led to isolation of
α and β- methyl glucosides, suggesting the presence of glucose at the reducing end209, 210,
for convenience all six monosaccharides denoted as S-1, S-2, S-3, S-4, S-5 and S-6. The
monosaccharides constitutes in compound were confirmed by its killiani hydrolysis147
under strong acidic condition, followed by paper chromatography and TLC. In this

111

112
hydrolysis four spots were found identical with the authentic samples of Glc, Gal,
GlcNac and GalNac by co-chromatography. Thus the hexasaccharide contained four
types of monosaccharides units i.e. Glc, Gal, GlcNac and GalNac. Further the presence
of two anomeric protons signals at δ 5.16 (J=3.0 Hz) and δ 4.60 (J=8.1 Hz) in the 1H
NMR spectrum of riesose in D2O at 300 MHz were assigned for α and β anomers of
glucose (S-1), confirming the presence of Glc(S-1) at the reducing end in compound-D
riesose. Further the presence of another anomeric doublet at δ 4.52 (J=7.5 Hz) suggested
the presence of β-Gal residue as the next monosaccharide unit. In addition to above
signals presence of a triplet at δ 3.20 which was assigned for H-2 of Glc(S-1) along with
earlier described anomeric proton doublets at δ 5.16 and 4.60 for α and β glucose
(Structure reporter group)211, 212 suggested the presence of lactose213 type structure i.e. β-
Gal(1-4)→Glc linkage at the reducing end of riesose. Further in the 1H NMR of riesose
acetate the anomeric proton signal at δ 6.17 assigned to Glc(S-1) gave one cross peaks at
δ 3.80 in the TOCSY spectrum of riesose acetate in CDCl3 at 300 MHz. This signal was
further identified as H-4 of β-Glc(S-1) by the COSY spectrum of riesose acetate showed
that H-4 of β-Glc(S-1) was available for glycosidic linkage by the next monosaccharide
unit. The earlier suggested 1→4 linkage between Glc(S-1) and Gal(S-2) by SRG was
further confirmed by the cross peak signal of H-4 of Glc(S-1) and C-1 of βGal(S-2) at
δ3.8x100.96 in HMBC spectrum at 300 MHz. The coupling constant of anomeric signal
at δ 4.52 for βGal(S-2) with J value of 7.5 Hz confirmed the β configuration of the
βGal(S-2) moiety and hence β 1→4 glycosidic linkage between S-2 and S-1 was
confirmed. Further the anomeric proton signal of βGal(S-2) at δ 4.52 in the 1H NMR of
riesose acetate in CDCl3 showed two consequent complementary signals in the linkage
region at δ 3.8 and 4.2 in the TOCSY spectrum of riesose acetate showing that two OH
groups of βGal(S-2) were available for glycosidic linkage. These signals were identified
for H-2 and H-3 respectively of βGal(S-2) by the COSY spectrum of riesose acetate
suggesting that H-2 and H-3 of βGal(S-2) were available for glycosidic linkages by the
next monosaccharide units. The next anomeric proton signal which appeared as a doublet
at δ 4.52 (J=7.5) in the 1H NMR spectrum of acetylated riesose was assigned to βGal(S-
4). The appearance of H-3 signal of S-2 at δ 4.2 in the 1H NMR of riesose acetate was
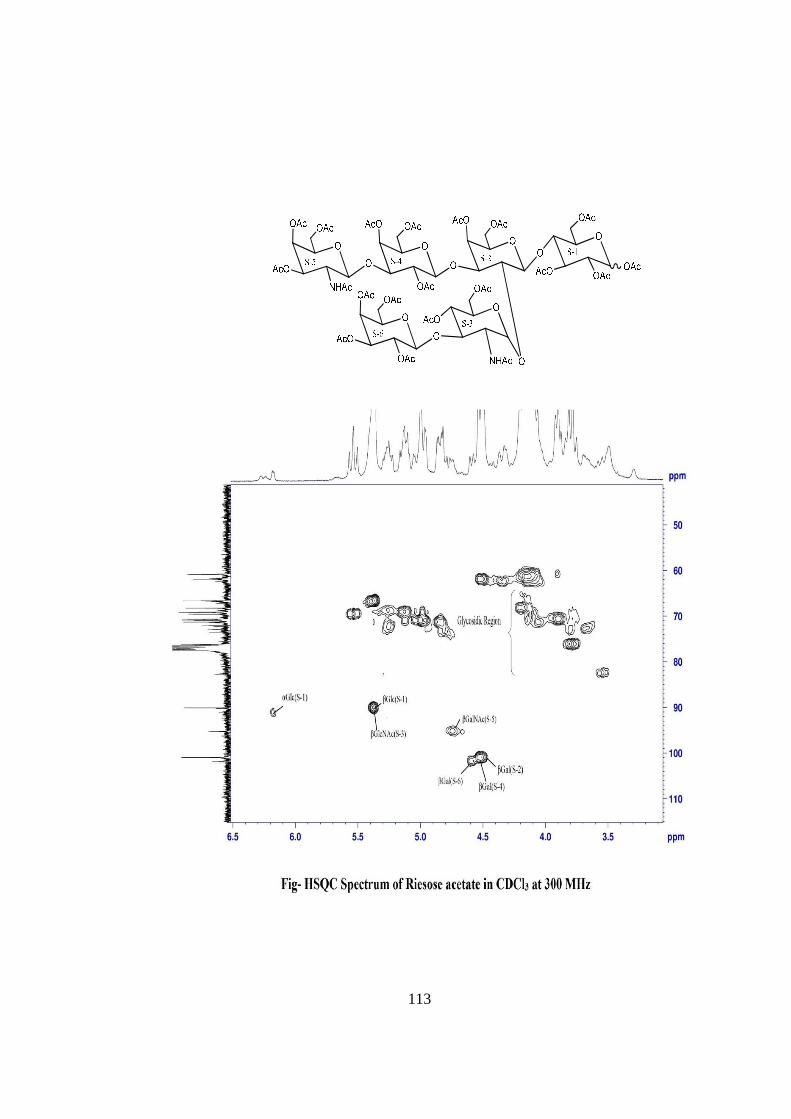
113

114

115

116
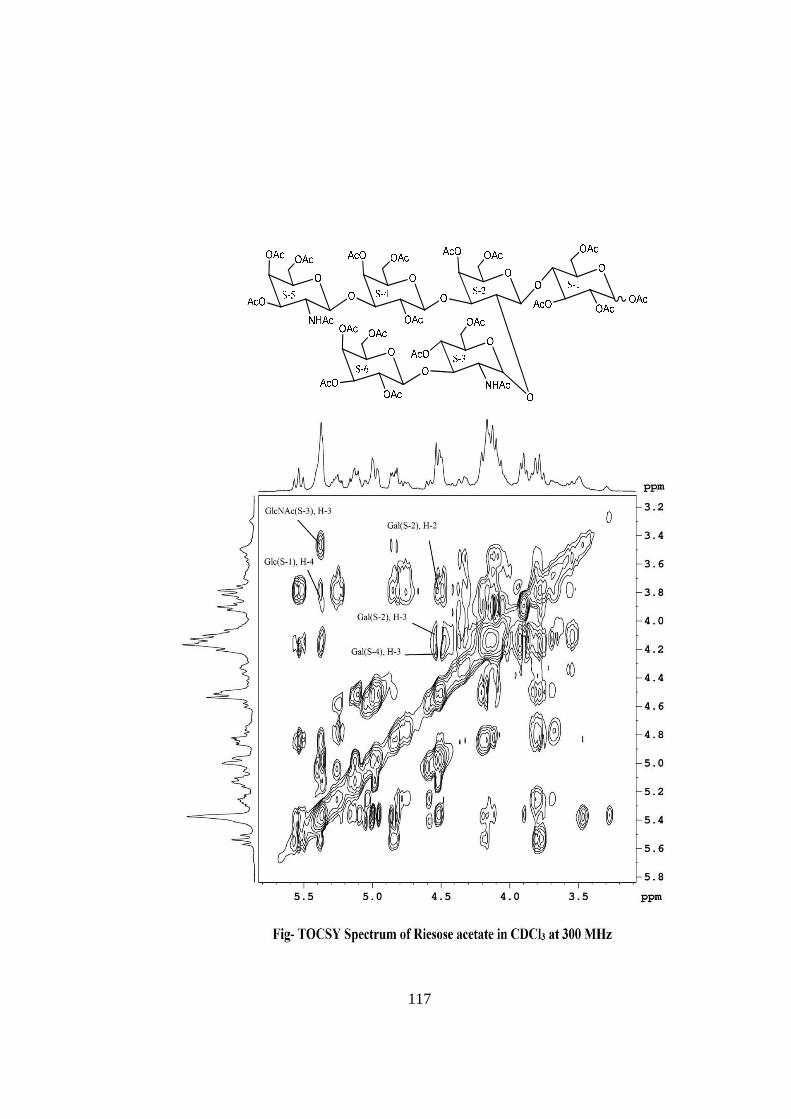
117

118
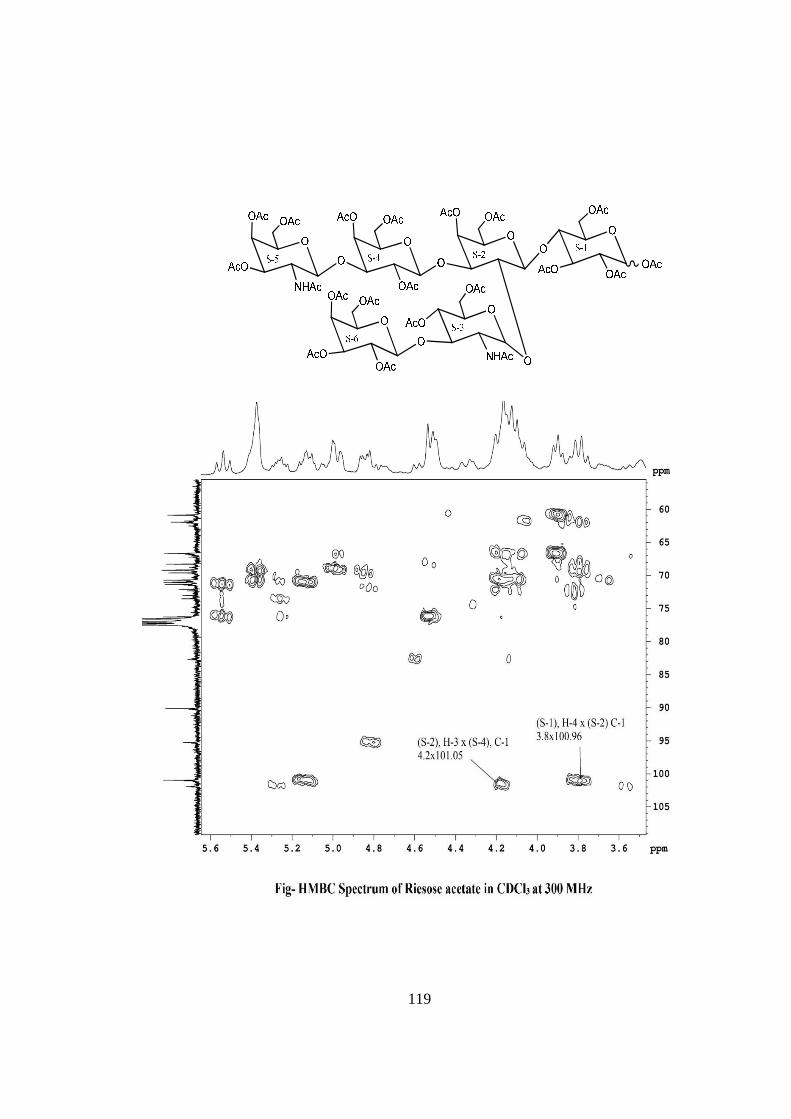
119
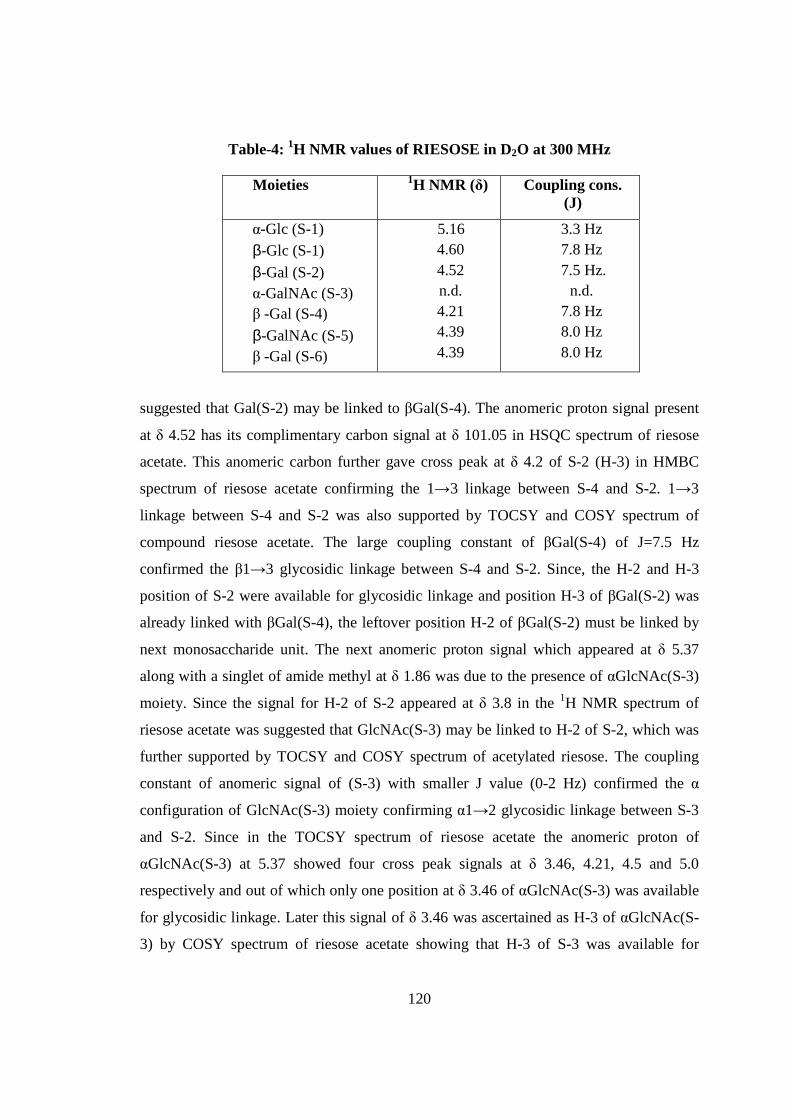
120
Table-4: 1H NMR values of RIESOSE in D2O at 300 MHz
suggested that Gal(S-2) may be linked to βGal(S-4). The anomeric proton signal present
at δ 4.52 has its complimentary carbon signal at δ 101.05 in HSQC spectrum of riesose
acetate. This anomeric carbon further gave cross peak at δ 4.2 of S-2 (H-3) in HMBC
spectrum of riesose acetate confirming the 1→3 linkage between S-4 and S-2. 1→3
linkage between S-4 and S-2 was also supported by TOCSY and COSY spectrum of
compound riesose acetate. The large coupling constant of βGal(S-4) of J=7.5 Hz
confirmed the β1→3 glycosidic linkage between S-4 and S-2. Since, the H-2 and H-3
position of S-2 were available for glycosidic linkage and position H-3 of βGal(S-2) was
already linked with βGal(S-4), the leftover position H-2 of βGal(S-2) must be linked by
next monosaccharide unit. The next anomeric proton signal which appeared at δ 5.37
along with a singlet of amide methyl at δ 1.86 was due to the presence of αGlcNAc(S-3)
moiety. Since the signal for H-2 of S-2 appeared at δ 3.8 in the 1H NMR spectrum of
riesose acetate was suggested that GlcNAc(S-3) may be linked to H-2 of S-2, which was
further supported by TOCSY and COSY spectrum of acetylated riesose. The coupling
constant of anomeric signal of (S-3) with smaller J value (0-2 Hz) confirmed the α
configuration of GlcNAc(S-3) moiety confirming α1→2 glycosidic linkage between S-3
and S-2. Since in the TOCSY spectrum of riesose acetate the anomeric proton of
αGlcNAc(S-3) at 5.37 showed four cross peak signals at δ 3.46, 4.21, 4.5 and 5.0
respectively and out of which only one position at δ 3.46 of αGlcNAc(S-3) was available
for glycosidic linkage. Later this signal of δ 3.46 was ascertained as H-3 of αGlcNAc(S-
3) by COSY spectrum of riesose acetate showing that H-3 of S-3 was available for
Moieties 1H NMR (δ) Coupling cons. (J)
α-Glc (S-1) β-Glc (S-1)
β-Gal (S-2) α-GalNAc (S-3) β -Gal (S-4)
β-GalNAc (S-5) β -Gal (S-6)
5.16 4.60 4.52 n.d. 4.21 4.39 4.39
3.3 Hz 7.8 Hz 7.5 Hz.
n.d. 7.8 Hz 8.0 Hz 8.0 Hz

121
glycosidically linked with next monosaccharide unit. The next anomeric proton signal
which appeared at δ 4.59 (J=8.4) assigned for βGal(S-6). Since the signal for H-3 of S-3
appeared at δ 3.46 in the 1H NMR spectrum of riesose acetate supported that 1→3
linkage between S-6 and S-3 which was further confirmed by TOCSY and COSY
spectrum of acetylated riesose. The large coupling constant of βGal(S-6) of J=8.4 Hz
confirmed the β-glycosidic linkage between βGal(S-6) and GlcNAc(S-3). The critical
studies of TOCSY spectrum of riesose acetate revealed that anomeric signal for βGal(S-
6) at δ 4.59 not give any cross peak in the linkage region have confirming the presence of
S-6 at non-reducing end. Since the presence of Gal(S-4) was confirmed the presence of
anomeric signal at δ 4.52 in 1H NMR of riesose acetate. The anomeric signal at δ 4.52
gave one cross peak at δ 4.1 in linkage region in TOCSY spectrum which was later
assigned as H-3 of Gal(S-4) in COSY spectrum of riesose acetate, which was available
for glycosidic linkage with next monosaccharide unit. The next anomeric proton signal
which appeared at δ 4.77 (J=7.2 Hz) along with a singlet of amide methyl at δ 1.94 was
due to presence of βGalNAc moiety in the hexasaccharide was assigned as βGalNAc(S-
5). The linkage between S-5 and S-4 was supported by presence of H-3 signal of S-4 at δ
3.8 in 1H NMR of acetylated riesose. The large coupling constant J=7.2 Hz confirmed the
β1→3 glycosidic linkage between S-5 and S-4. Since the anomeric proton of
βGalNAc(S-5) at δ 4.77 does not show any methine proton signal in linkage in its
TOCSY region confirming that βGalNAc(S-5) was present at non-reducing end and none
of its OH group was available for glycosidic linkage. All the 1H NMR assignments for
ring protons of monosaccharide units of riesose were confirmed by HOMOCOSY214, 215
and TOCSY216 experiments. The positions of glycosidation in the oligosaccharide were
confirmed by position of anomeric signals, S.R.G. and comparing the signals in 1H and 13C NMR of acetylated and deacetylated oligosaccharide. The glycosidic linkages in
riesose were assigned by the cross peaks for glycosidically linked carbons with their
protons in the HSQC217, 218 spectrum of acetylated riesose. The values of these cross
peaks appeared as- β-Glc (S-1) H-4 and C-4 at (3.8x76) showed 1→4 linkage of S-2 and
S-1 i.e. its H-4 positions of Glc(S-1) was involved in linkage region. βGal(S-2) H-2 and
C-2 at (3.80x72.3) showed 1→2 linkage between S-3 and S-2 and β-Gal(S-2) H-3 and C-
3 at (4.1x70) showed 1→3 linkage between S-4 and S-2 i.e. its H-3 and H-2 position of

122

123

124
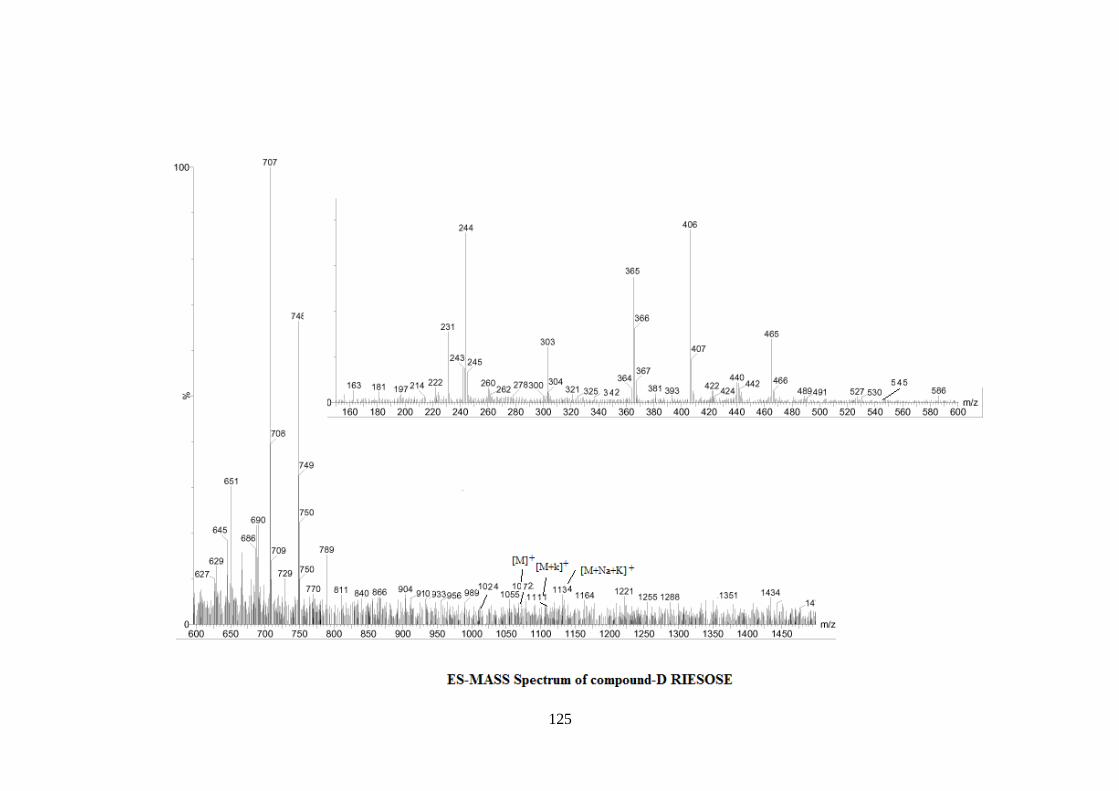
125
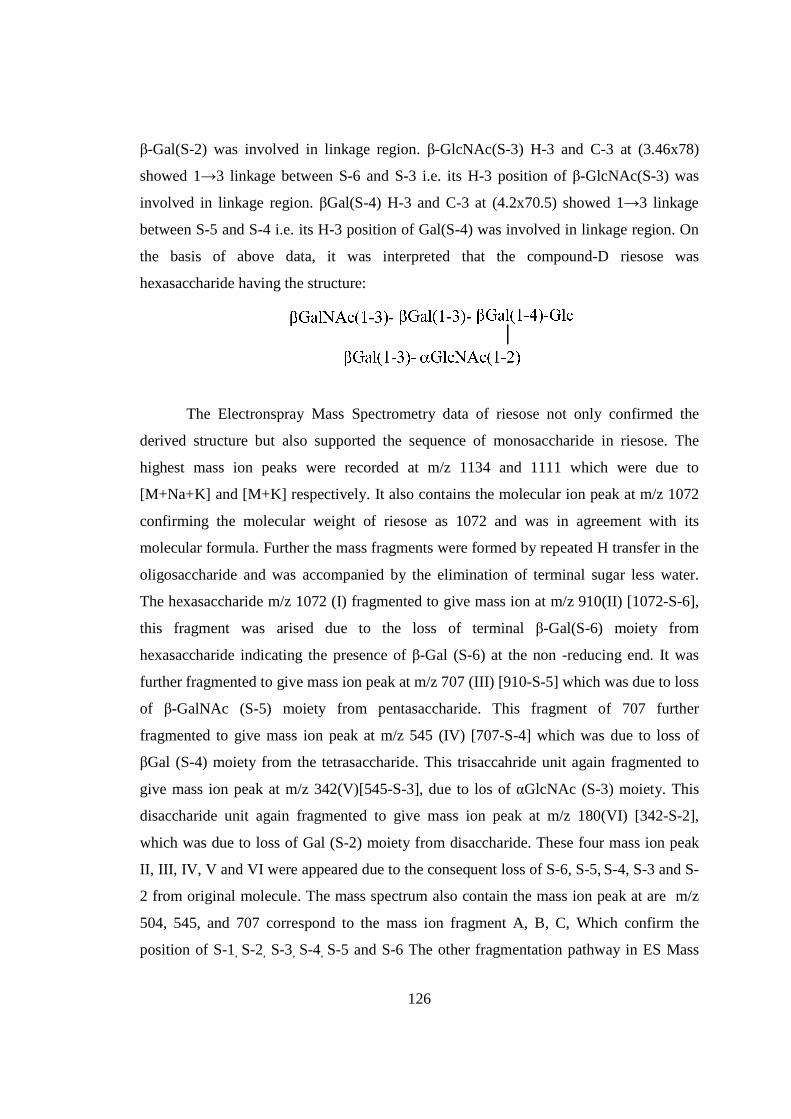
126
β-Gal(S-2) was involved in linkage region. β-GlcNAc(S-3) H-3 and C-3 at (3.46x78)
showed 1→3 linkage between S-6 and S-3 i.e. its H-3 position of β-GlcNAc(S-3) was
involved in linkage region. βGal(S-4) H-3 and C-3 at (4.2x70.5) showed 1→3 linkage
between S-5 and S-4 i.e. its H-3 position of Gal(S-4) was involved in linkage region. On
the basis of above data, it was interpreted that the compound-D riesose was
hexasaccharide having the structure:
The Electronspray Mass Spectrometry data of riesose not only confirmed the
derived structure but also supported the sequence of monosaccharide in riesose. The
highest mass ion peaks were recorded at m/z 1134 and 1111 which were due to
[M+Na+K] and [M+K] respectively. It also contains the molecular ion peak at m/z 1072
confirming the molecular weight of riesose as 1072 and was in agreement with its
molecular formula. Further the mass fragments were formed by repeated H transfer in the
oligosaccharide and was accompanied by the elimination of terminal sugar less water.
The hexasaccharide m/z 1072 (I) fragmented to give mass ion at m/z 910(II) [1072-S-6],
this fragment was arised due to the loss of terminal β-Gal(S-6) moiety from
hexasaccharide indicating the presence of β-Gal (S-6) at the non -reducing end. It was
further fragmented to give mass ion peak at m/z 707 (III) [910-S-5] which was due to loss
of β-GalNAc (S-5) moiety from pentasaccharide. This fragment of 707 further
fragmented to give mass ion peak at m/z 545 (IV) [707-S-4] which was due to loss of
βGal (S-4) moiety from the tetrasaccharide. This trisaccahride unit again fragmented to
give mass ion peak at m/z 342(V)[545-S-3], due to los of αGlcNAc (S-3) moiety. This
disaccharide unit again fragmented to give mass ion peak at m/z 180(VI) [342-S-2],
which was due to loss of Gal (S-2) moiety from disaccharide. These four mass ion peak
II, III, IV, V and VI were appeared due to the consequent loss of S-6, S-5, S-4, S-3 and S-
2 from original molecule. The mass spectrum also contain the mass ion peak at are m/z
504, 545, and 707 correspond to the mass ion fragment A, B, C, Which confirm the
position of S-1, S-2, S-3, S-4, S-5 and S-6 The other fragmentation pathway in ES Mass

127
spectrum of compound D m/z 1072 shows the mass ion peak at 1014[1072-NHCOCH3],
1055[1072-OH], 1024[1055-CH2OH], 989[1014-OH], 956[989-CH2OH, 2H+], 910[1072-
S-6], 892[910-H2O], 875[892-OH], 826[875-H2O,CH2OH], 789[826-2H2O, H+],
750[826-CH2OCHO, OH], 709[CH2OH, H2O], 545[707-S-4], 527[545-H2O], 487[545-
NHCOCH3], 427[487-CH2OHCHO], 342[545-S-3], 180[342-S-2]. Based on result
obtained from chemical degradation/acid hydrolysis, Chemical transformation, Electro
spray mass spectrometry and 1H, 13C NMR and HOMOCOSY, TOCSY, HMBC and
HSQC 2D NMR technique of acetylated riesose and riesose the structure and sequence of
isolated Novel oligosaccharide molecule riesose was deduced as-
RIESOSE

CHAPTER IV
EXPERIMENTAL

128
EXPERIMENTAL
General Procedure
The sugars were visualized on TLC with 30% aqueous H2SO4 reagent and on paper
chromatography sugars were visualized with acetyl acetone and p-dimethyl amino
benzaldehyde reagents. The absorbent for TLC was silica gel G (SRL) and CC silica
gel (SRL, 60-120 mesh). Freeze drying of the compound was done with the help of
CT 60e (HETO) Lyophylizer and centrifuged by a cooling centrifuge Remi
instruments C-25 at 5500 rpm. To check the homogeneity of the compounds reverse
phase HPLC system was used equipped with Perkin Elmer 250 solvent delivering
system, 235 diode array detector and G.P. 100 printer plotter. Authentic samples of
glucosamine, galactosamine, galactose, glucose, fucose and sialic acid were
purchased from Aldrich Chemicals. The 1H and 13C NMR spectra of oligosaccharides
were recorded in CDCl3 and the spectra of deacetylated oligosaccharides were
recorded in D2O at 25oC on a Bruker AM 300 NMR spectrometer. The electro spray
mass spectra were recorded on a MICROMASS QUATTRO II triple quadruple mass
spectrometer. The optical rotations of oligosaccharides were measured with AA-5
series automatic apolarimeter in 1 cm tube. The sample (dissolved in suitable solvents
such as methanol/acetonitrile/water) was introduced into the ESI source through a
syringe pump at the rate 5µl per min. The ESI capillary was set at 3.5 KV and the
cone voltage was 40 V.
Chromatography
Following chromatographic techniques have been used for the isolation and
identification of the oligosaccharides
Paper Chromatography (PC)
Paper chromatography was performed on whatman paper No.1 by the use of a
three solvent system of toluene, butanaol and water and spots were detected by
appropriate reagent for specific moieties.
Thin Layer Chromatography (TLC)
The glass plates coated with slurry of silica gel G (SRL) in distilled water were used
which were dried at room temperature for about 24 hrs and activated at 100-110oC.

129
Phenol-sulphuric acid test206 for sugars
To each fraction (0.1ml) distilled water (1ml), 5% phenol (1ml) and conc.
H2SO4 (25 ml) was added and the mixture was vigorously shaken. After 30 min the
carbohydrate rich fractions showed yellow colour.
Feigl test207 for sugars
The test sample (0.1 mg) was placed in a micro-crucible and one drop of
syrupy phosphoric acid was added. The crucible was covered with filter paper
moistened with 10% solution of aniline in AcOH (10%). A small watch glass was
used as a paper weight. The bottom of the crucible was cautiously heated for 30-60
min with micro burner, avoiding excess heating. A pink to red colour was imparted on
filter paper for normal sugars and 6-deoxy sugars exhibited brown coloration. The 2-
deoxy sugars did not give any colour under this test.
P-Dimethyl amino benzaldehyde test219 for proteins
The presence of protein in a sample was tested by p-dimethyl amino
benzaldehyde test. The sample (solid or in solution) was mixed in a micro-crucible
with several drops of saturated glacial acetic acid solution of p-
dimethylaminobenzaldehyde and one drop of fuming hydrochloric acid. A violet
colour indicated the presence of proteins.
Partridge reagent220 for sugars
Freshly distilled aniline (0.93 g) in water saturated with butanol (100 ml) was
mixed with phthalic acid (1.66 g) and was shaken till dissolve. The reagent was
sprayed on the paper on which a spot of test sample was applied and then heated at
100-118oC for 3-5 min. A pink-brown colour indicated the presence of normal
hexoses.
Morgan-Elson test208 for sugars
Acetyl-acetone reagent I: Solution A- 0.5 ml of acetyl-acetone was dissolved in
butanol (50 ml). Solution B- 50% (w/v) aq. KOH (5 ml) was dissolved in ethanol
(20ml). For formation of reagent I, 10 ml of Solution A was added in 0.5 ml of
solution B.

130
p-Dimethyl amino benzaldehyde reagent II: 1 gm of p-dimethyl amino
benzaldehyde was dissolved in the mixture of 30 ml of ethanol and 30 ml of conc.
HCl and solution was then diluted with 180 ml of distilled butanol to get reagent II.
Chromatograms were sprayed with reagent I and heated in the oven for 5 min
at 105°C. The dry paper strips were then sprayed with reagent II and returned to the
oven for 5 min at 90°C. The appearance of purple-violet colour indicated the presence
of amino sugars.
Thiobarbituric acid assay (Warren assay)221 for sialic acid
Reagent A: 1.07 g of sodium metaperiodate was dissolved in 1.0 ml of water. It was
added in 14.5 ml of concentrated ortho phosphoric acid and water was added to make
it 25 ml.
Reagent B: 10 g of sodium arsenite and 0.71 g of sodium sulphate was dissolved in
0.1M sulphuric acid (made by diluting 0.57 ml concentrated sulphuric acid with 100
ml of water) to a total volume of 10 ml.
Reagent C: 0.12 g of thiobarbituric acid and 142 g of sodium sulphate was dissolved
in water and the volume was made up to 20ml.
In the sample (0.05µ mole in a volume of 0.2 ml) 0.1 ml of reagent A was
added. The tube was shaken and allowed to stand at room temperature for 20 minutes.
1 ml of reagent B was then added and the tube was shaken until a yellow-brown
colour disappears. 3 ml of reagent C was added in the tube with shaking; it was
capped with a glass bead and then heated in a vigorously boiling water bath for 15
minutes. The tube was then removed and placed in cold water for 5 minutes. During
cooling the colour faded and the solution becomes cloudy. From this solution, 1 ml
was transferred to another tube which contained 1 ml of cyclohexanone. The tube was
shaken and then centrifuged for 3 minutes. The clear upper cyclohexanone phase was
red and the colour was more intense than it was when in water.
Bromocresol green test222
Spraying reagent Bromocresol green (0.04 g) was dissolved in ethanol (96%,
100 ml) Drops of 0.1 N NaOH were added until a blue coloration just appeared. A
spot of the test sample when applied on a paper moistened with this reagent (blue)
give a yellow coloration which indicated the presence of a carboxylic group.

131
Acetylation of oligosaccharide mixture
9.48 gm of pooled fractions (peak II and III) which gave positive phenol-
sulphuric acid test were acetylated with pyridine (9.50 ml) and acetic anhydride (9.50
ml) at 60°C and the solution was stirred overnight. The mixture was evaporated under
reduced pressure and the viscous residue was taken in CHCl3 (250 ml) and it was
washed in sequence with 2N-HCl (1 x 25 ml), ice cold 2N-NaHCO3 (2 x 25 ml) and
finally with H2O (2 x 25 ml). The organic layer was dried over anhydrous Na2SO4,
filtered and evaporated to dryness yielding the acetylated mixture (9.49 gm).
Deacetylation of compound ‘a’
Compound ‘a’ (112 mg) was obtained from column chromatography 2 of
acetylated oligosaccharide mixture. 40 mg of compound-a was dissolved in acetone (3
ml) and 3.2 ml of NH3 was added in it and was left overnight in a stoppered
hydrolysis flask. After 24 hrs ammonia was removed under reduced pressure and the
compound was washed with (3 x 5 ml) CHCl3 (to remove acetamide) and the water
layer was finally freeze dried giving the deacetylated oligosaccharide A (35 mg).
Methyl glycosidation/Acid hydrolysis of compound A
Compound A (8 mg) was ref1uxed with absolute MeOH (2 ml) at 70°C for 18
hrs in the presence of cation exchange IR-120 (H) resin. The reaction mixture was
filtered while hot and filtrate was concentrated. In the solution of methylglycoside of
A, 1, 4-dioxane (1 ml), and 0.1N H2S04 (1 ml) was added and the solution was
warmed for 30 minutes at 50oC. The hydrolysis was complete after 24 hrs. The
hydrolysate was neutralized with freshly prepared BaCO3 filtered and concentrated
under reduced pressure to afford α-and β-methylglucosides along with the Glc,
GalNAc and GlcNAc. Their identification was confirmed by comparison with
authentic samples (TLC, PC).
Kiliani hydrolysis of compound A
Compound A (5 mg) was dissolved in 2 ml Kiliani mixture (AcOH-H2O-HCI, 7:11:2) and
heated at 100oC for 1 h followed by evaporation under reduced pressure. It was dissolved in 2
ml of H2O and extracted twice with 3 ml CHCl3. The aqueous residual solution was made
neutral by addition of 1-2 drops of 2N NaOH and was evaporated under reduced pressure to

132
afford glucose, GalNAc and GlcNAc on comparison with authentic samples of glucose,
GalNAc and GlcNAc.
Deacetylation of compound ‘b’
Compound ‘b’ (419 mg) was obtained from column chromatography 3 of
acetylated oligosaccharide mixture. 50 mg of compound b was dissolved in acetone (3
ml) and 3.5 ml of NH3 was added in it and was left overnight in a stoppered
hydrolysis flask. After 24 hrs ammonia was removed under reduced pressure and the
compound was washed thrice with CHCl3 (5 ml) (to remove acetamide) and the water
layer was finally freeze dried giving the deacetylated oligosaccharide B (45 mg).
Methyl glycosidation/Acid hydrolysis of compound B
Compound B (8 mg) was ref1uxed with absolute MeOH (2 ml) at 70°C for 18
h in the presence of cation exchange IR-l20 (H) resin. The reaction mixture was
filtered while hot and filtrate was concentrated. In the solution of methylglycoside of
B, 1, 4-dioxane (1 ml), and 0.1N H2S04 (1 ml) was added and the solution was
warmed for 30 minutes at 50oC. The hydrolysis was complete after 24 hrs. The
hydrolysate was neutralized with freshly prepared BaCO3 filtered and concentrated
under reduced pressure to afford α-and β-methylglucosides along with the Glc, Gal,
GalNAc and GlcNAc. Their identification was confirmed by comparison with
authentic samples (TLC, PC).
Kiliani hydrolysis of compound B
Compound B (5 mg) was dissolved in 2 ml Kiliani mixture (AcOH-H2O-HCI,
7:11:2) and heated at 100oC for 1 h followed by evaporation under reduced pressure.
It was dissolved in 2 ml of H2O and extracted twice with 3 ml CHCl3. The aqueous
residual solution was made neutral by addition of 1-2 drops of 2N NaOH and was
evaporated under reduced pressure to afford Glc, Gal, GalNAc and GlcNAc on
comparison with authentic samples of Glc, Gal, GalNAc and GlcNAc.
Deacetylation of compound ‘c’
Compound ‘c’ (46 mg) was obtained from column chromatography 6 of
acetylated oligosaccharide mixture. 32 mg of compound C was dissolved in acetone
(2 ml) and 3 ml of NH3 was added in it and was left overnight in a stoppered
hydrolysis flask. After 24 hrs ammonia was removed under reduced pressure and the
133
compound was washed thrice with CHCl3 (5 ml) (to remove acetamide) and water
layer was finally freeze dried giving the deacetylated oligosaccharide C (24 mg).
Methyl glycosidation/Acid hydrolysis of compound C
Compound C (8 mg) was ref1uxed with absolute MeOH (2 ml) at 70°C for 18
h in the presence of cation exchange IR-120 (H) resin. The reaction mixture was
filtered while hot and filtrate was concentrated. In the solution of methylglycoside of
C, 1, 4-dioxane (1 ml), and 0.1N H2S04 (1 ml) was added and the solution was
warmed for 30 minutes at 50oC. The hydrolysis was complete after 24 hrs. The
hydrolysate was neutralized with freshly prepared BaCO3 filtered and concentrated
under reduced pressure to afford α-and β-methylglucosides along with the Glc, Gal
and GlcNAc. Their identification was confirmed by comparison with authentic
samples (TLC, PC).
Kiliani hydrolysis of compound C
Compound C (5 mg) was dissolved in 2 ml Kiliani mixture (AcOH-H2O-HCI,
7:11:2) and heated at 100oC for 1 h followed by evaporation under reduced pressure.
It was dissolved in 2 ml of H2O and extracted twice with 3 ml CHCl3. The aqueous
residual solution was made neutral by addition of 1-2 drops of 2N NaOH and was
evaporated under reduced pressure to afford glucose, Gal and GlcNAc on comparison
with authentic samples of glucose, Gal and GlcNAc.
Deacetylation of compound‘d’
Compound‘d’ (62 mg) was obtained from column chromatography 4 of
acetylated oligosaccharide mixture. 52 mg of compound d was dissolved in acetone (3
ml) and 3.5 ml of NH3 was added in it and was left overnight in a stoppered
hydrolysis flask. After 24 hrs ammonia was removed under reduced pressure and the
compound was washed thrice with CHCl3 (5 ml) (to remove acetamide) and water
layer was finally freeze dried giving the deacetylated oligosaccharide D (44 mg).
Methyl glycosidation/Acid hydrolysis of compound D
Compound D (8 mg) was ref1uxed with absolute MeOH (2 ml) at 70°C for 18
h in the presence of cation exchange IR-120 (H) resin. The reaction mixture was
filtered while hot and filtrate was concentrated. In the solution of methylglycoside of
D, 1, 4-dioxane (1 ml), and 0.1N H2S04 (1 ml) was added and the solution was

134
warmed for 30 minutes at 50oC. The hydrolysis was complete after 24 h. The
hydrolysate was neutralized with freshly prepared BaCO3 filtered and concentrated
under reduced pressure to afford α-and β-methylglucosides along with the Glc, Gal
and GlcNAc. Their identification was confirmed by comparison with authentic
samples (TLC, PC).
Kiliani hydrolysis of compound D
Compound D (5 mg) was dissolved in 2 ml Kiliani mixture (AcOH-H2O-HCI,
7:11:2) and heated at 100oC for 1 hrs followed by evaporation under reduced pressure.
It was dissolved in 2 ml of H2O and extracted twice with 3 ml CHCl3. The aqueous
residual solution was made neutral by addition of 1-2 drops of 2N NaOH and was
evaporated under reduced pressure to afford glucose, Gal and GlcNAc on comparison
with authentic samples of glucose, Gal and GlcNAc.

BIBILOGRAPHY

135
BIBILOGRAPHY
1. Feizi, T. Curr. Opin. Struct. Biol. 1993 3: 701–710
2. Simanek, E. E., McGarver, G. J., Jablonowski, J. A., Wong, C. H. Chem. Rev. 1998, 98:
833–862.
3. Singh, R. S., Tiwary, A. K., Kennedy, J. F. Crit. Rev. Biotechnol. 1999, 19: 145–178.
4. Somers, W. S., Tang, J., Shaw, G. D., Camphausen, R. T. Cell. 2000, 103: 467–479.
5. Crocker, P. R., Feizi, T. Curr. Opin. Struct. Biol. 1996, 6: 679–691.
6. Lis, H., Sharon, N. (1998) Chem. Rev. 1998, 98: 637–674.
7. Werz, D.B.; Ranzinger, R.; Herget, S.; et al. ACS Chem. Biol. 2007, 2: 685-691.
8. Koeller, K. M., Wong, C.-H. Nature Biotechnol. 2000, 18: 835–841.
9. Bertozzi, C. R., Kiessling, L. L. Science 2001, 291: 2357–2364.
10. Dove, A. Nature. 2001, 19: 913–917.
11. Davis, B. G., Robinson, M. A. Curr. Opin. Drug Discov. Dev. 2002, 5: 279–288.
12. Dwek, R. A., Butters, T. D. Chem. Rev. 2002, 102: 283–284.
13. Gruner, S. A. W., Locardi, E., Lohof, E., Kessler, H. Chem. Rev. 2002, 102: 491–514.
14. Musser, J. H. Medicinal chemistry and drug discovery. 6th edn, Volume 2, John Wiley &
Sons, New York, pp 2003, 203–248.
15. Hounsell, E. F., Young, M., Davies, M. J. Clin. Sci.1997, 93: 287–293.
16. McAuliffe, J. C., Hindsgaul, O. Chem. Ind. 1997, 170–174.
17. Yarema, K. J., Bertozzi, C. R. Curr. Opin. Chem. Biol. 1998, 2: 49–61.
18. Barchi, J. J. Current Pharm. Des. 2000, 6: 485–501.
19. Lloyd, K. O. Drug News Perspect. 2000, 13: 463–470.
20. Vogel, P. Chimia. 2001, 55: 359–365.
21. Nygren, P., Larsson, R. J. Intern. Med. 2003, 253: 46–75.
22. Wong, C.-H. (2003) Carbohydrate-based drug discovery. Wiley-VCH, Weinheim.
23. Varki, A. Glycobiology. 1993, 3: 97–130.
24. Kim, Y. J., Varki, A. Glycoconj. j. 1997, 14: 569–576.
25. Brockhausen, I. Biochim. Biophys. Acta 1999, 1473: 67–95.
26. Dennis, J. W., Granovsky, M., Warren, C. E. Biochim. Biophys. Acta 1999, 1473: 21–34.
27. Shigeoka, H., Karsten, U., Okuno, K., Yasutomi, M. Tumor Biol. 1999, 20: 139–146.
28. Wiley, D. C., Skehel, J. J. Rev. Biochem. 1987, 56: 365–394.
29. Lee, D. G., Chun, H. J., Yim, D.-S., Choi, S.-M., Choi, J.-H., Yoo, J.-H., Shin, W.-S.,
Kang, M.-W. Antimicrob. Agents Chemother. 2003, 47: 3768–3773.

136
30. Koganty, R. R., Reddish, M. A., Longenecker, B. M. Drug Discovery Today. 1996,
1:190–198.
31. Bitton, R. J., Guthmann, M. D., Gabri, M. R., Carnero, A. J. L., Alonso, D. F., Fainboim,
L., Gomez, D. E. Oncol. Rep. 2002, 9: 267–276.
32. Cunto-Amesty, G., Monzavi-Karbassi, B., Luo, P., Jousheghany, F., Kieber-Emmons, T.
Int. J. Parasitol. 2003, 33: 597–613
33. Vichier-Guerre, S., Lo-Man, R., BenMohamed, L., Deriaud, E., Kovats, S., Leclerc, C.,
Bay, S. J. Pept. Res. 2003, 62: 117–124.
34. Slovin, S. F., Ragupathi, G., Adluri, S., Ungers, G., Terry, K., Kim, S., Spassova,
M.,Bornmann,W. G.,Fazzari,M.,Dantis,L., Olkiewicz, K.,Lloyd,K. O.,Livingston, P. O.,
Danishefsky, S. J., Scher, H. I Proc. Natl Acad. Sci. USA 1999, 96: 5710–5715.
35. Sparg, S.G., Light, M.E., van Staden, J. Journal of Ethnopharmacology, 2004, 94, 219.
36. Schoner, W., Scheiner-Bobis, G. Am J Cardiovasc Drug, 2007, 7, 173.
37. Newman, R.A., Yang, P.Y., Pawlus, A.D., Block, K.I. Mol. Interv., 2008, 8, 36
38. Saleem, M., Nazir, M., Ali, M.S., Hussain, H., Lee, Y.S., Riaz, N., Jabbar, A. Natural
product reports, 2010, 27, 238.
39. Abbasolu, U., Turkoz, S. Pharm. Biol., 1995, 33, 293.
40. Zhang, J.D., Xu, Z., Cao, Y.B., Chen, H.S., Yan, L., An, M.M., Gao, P.H., Wang, Y.,
Jia, X.M., Jiang, Y.Y. J Ethnopharmacol., 2006, 103, 76.
41. Zhang, Y., Li, H.Z., Zhang, Y.J., Jacob, M.R., Khan, S.I., Li, X.C., Yang, C.R. Steroids,
2006, 71, 712.
42. Renault, S., De Lucca, A.J., Boue, S., Bland, J.M., Vigo, C.B., Selitrennikoff, C.P. Med
Mycol., 2003, 41, 75.
43. Kuete, V., Eyong, K.O., Folefoc, G.N., Beng, V.P., Hussain, H., Krohn, K., Nkengfack,
A.E. Pharmazie, 2007, 62, 552.
44. Hou, J.P. Comparative Medicine East and West, 1977, 5, 123.
45. Coleman, C.I., Hebert, J.H., Reddy, P. J. Clin. Pharm. Ther., 2003, 28, 5.
46. Park, J., Cho, J.Y. Afr. J. Biotechnol., 2009, 8, 3682.
47. Liu, J., Shiono, J., Shimizu, K., Yu, H.S., Zhang, C.Z., Jin, F.X., Kondo, R. Bioorg. Med.
Chem. Lett., 2009, 19, 3320.
48. Wang, W., Rayburn, E.R., Hang, J., Zhao, Y.Q., Wang, H., Zhang, R.W. Lung Cancer-J
Iaslc, 2009, 65, 306.
49. Xie, J.T., Mehendale, S.R., Li, X.M., Quigg, R., Wang, X.Y., Wang, C.Z., Wu, J.A.,
Aung, H.H., Rue, P.A., Bell, G.I., Yuan, C.S. Bba-Mol Basis Dis., 2005, 1740, 319.

137
50. Lee, W.K., Kao, S.T., Liu, I.M., Cheng, J.T. Horm Metab Res., 2007, 39, 347.
51. Cheng, Y., Shen, L.H., Zhang, J.T. Acta Pharmacol. Sin., 2005, 26, 143.
52. Kennedy, D.O., Scholey, A.B. Pharmacol. Biochem. Behavior, 2003, 75, 687.
53. Kubo, S., Mimaki, Y., Terao, M., Sashida, Y., Nikaido, T., Ohmoto, T. Phytochemistry,
1992, 31, 3969.
54. Mimaki, Y., Kuroda, M., Kameyama, A., Sashida, Y., Hirano, T., Oka, K., Maekawa, R.,
Wada, T., Sugita, K., Beutler, J.A. Bioorg. Med. Chem. Lett., 1997, 7, 633.
55. Kensil, C. R. Critical Reviews in Therapeutic Drug Carrier Systems, 1996; 13(1):1-55.
56. Nagao, T., Adachi, K., Sakai, M., Nishijima, M., Sano, H. The Journal of antibiotics,
2001, 54, 333.
57. Jaruchoktaweechai, C., Suwanborirux, K., Tanasupawatt, S., Kittakoop, P., Menasveta, P.
J. Nat. Prod., 2000, 63, 984.
58. Perez-Zuniga, F.J., Seco, E.M., Cuesta, T., Degenhardt, F., Rohr, J., Vallin, C., Iznaga,
Y., Perez, M.E., Gonzalez, L., Malpartida, F. The Journal of antibiotics, 2004, 57, 197.
59. Kren, V., Rezanka, T. Fems Microbiology Reviews, 2008, 32, 858.
60. Debbie, Y., Erik, G. Use of polypeptides having antimicrobial activity. US Pat., IPC8
class: AA61K3816FI, USPC class: 514 12.
61. Oyston, P.C.F., Fox, M.A., Richards, S.J., Clark, G.C. J. Med. Microbiol., 2009, 58, 977.
62. Asano, N. Cellular and Molecular Life Sciences, 2009, 66, 1479.
63. Dewick, P.M. Medicinal natural products 2nd Ed. John Wiley & Sons, LTD 2001.
64. Silva, J.G., Carvalho, I. Curr. Med. Chem., 2007, 14, 1101.
65. Hainrichson, M., Nedelman, I., Baasov, T. Org. Biomol. Chem., 2008, 6, 227.
66. Arcamon F., Animati F., Bigioni M., Capranico G., Caserini C., Cipollone A., De Cesare
M., Ettorre A., Guano F., Manzini S., Monteagudo E., Pratesi G., Salvatore C., Supino
R., Zumino F., Biochem Pharmacol. May (1999) 15; 57 (10): 1133-9.
67. Kusmer, Ken. "3rd Ind. preemie infant dies of overdose", Fox News (Associated Press),
2006-09-20. Retrieved on 2007-01-08
68. Guyton, A.C.; Hall, J. E. (2006). Textbook of Medical Physiology. Elsevier Saunders,
464.
69. Katzung, B.G. Basic and Clinical Pharmacology 10th ed., 2007. McGraw-Hill Co.,Inc.
70. Edwards J. H., Nurs J., 2003, 30: 70-3.
71. Svensoonl; J Virol, 1992, 66, 5582-5585.
72. Pacitti A. F., Gentsch J.R. J. Virol. 1987, 61: 1407-1415.
73. Kunj C & Rudloff S. Acta Paeditriaca; 1993, 82, 903-912.

138
74. Silfverdal-Sa et al. Pediatric Infectious Disease Journal. 2002; 21(9): 816-821.
75. Martin-Sosa S, Martin MJ, Hueso P.; J Nutr. 2002, 132(10); 3067-72.
76. Taguchi, T., Furue, H., Kimura, T., Kondo, T., Hattori, T., Itoh, I. and Ogawa, N., Jpn.
Cancer Chemother. 1985, 12, 366.
77. Roberfroid M.B. and Delzenne N.M. ‘Dietary fructans’, Ann Rev Nutr, 1998, 18, 117–
143.
78. H. Bareteau et al Food Technol. Biotechnol, 2006 44(3) 323-333).
79. T. Urishima, E. Taufic, K. Fukuda, S. Asakuma, Biosci Biotechnol.Biochem. 2013, 77(3):
455.
80. Morrow, E.H., Stewart, A.D., Rice, W.R. Evolution. 2005, 59(12): 2608-2615.
81. Newburg et al. 2005.
82. Simon, P. M. Drug Discovery Today 1996, 1: 522–528.
83. Coppa, G. V., Gabrielli, O., Giorgi, P., Catassi, C., Montanari, M. P., Varaldo, P. E.,
Nichols, B. L. Lancet 1990, 335: 569–571.
84. Kunz, C., Rudloff, S. Acta Paediatr.1993, 82: 903–912.
85. Weymouth-Wilson, A.C.; Natural Product Reports, 1997, 97.
86. Deepak, D.; Srivastava, S.; Khare, N. K.; Khare, A. Fortschritte Der Chemie Organischer
Naturstoffe, 1996, 69: 71-155.
87. G. Osthoff, M. de wit, A. Hugo, B.I. Kamara., Biochemistry and Physiology, part B.
2007, 148: 1-5.
88. William A. Bubb, Tadasu urishma, Kuniaki Kohso, Tadashi Nakamura, Ikichi Arai,
Tadao Saito. Carbohydrate research. 1999, 318: 123-128.
89. Rina saksena, Desh Deepak, Anakshi Khare, Ragini Sahai, L. M. Tripathi and V.M.L.
Srivastava, Biochemica et. Biophysica Acta. 1999, 1428: 433-445.
90. Deepak D., Saksena R., Khare A., Indian patent no 3044/oct/98, serial no. 189748.
91. Federico Lara-villosladaa, Elisabeth Debrasb, Ana nietoc, Angel Conchad, Julio Galveze,
Eduardo Lopez-Huertasa, Julio Bozaa, Christiane Obledb, Jordi Xausa,. Clinical Nutrion,
2006, 25: 477-488.
92. Hakkarainen J, Toivanen M, Leinonen A, Frangsmyr L, Stromberg N, Lapinjoki S, Nassif
X, Tikkanen-Kaukanen C. J. Nutr. 2005, 135(10): 2445-8.
93. Johansson P, Nilson J, Angtrom J, Miller-Podraza H,. Glycobiology. 2005, 15(6), 625-36.
94. Amit Srivastava, Rama Tripathi, Gitika Bhatia, Ashok Kumar Khanna, Desh Deepak.,
Asian Pacific Journal of Tropical Biomedicine., 2012, 1-6.
139
95. Yu ZT, Chen C, Kling DE, Liu B, McCoy JM, Merighi M, Heidtman M, Newburg DS,.
Glycobiology. 2013, 23(2):169-77
96. Mark, J., Gnoth, Clemens Kunz, Evamaria Kinne-Saffran and Silvia Rudloff, J. Nutr.
2000. 130: 3014–3020.
97. Buddington, R.K., Kelly-Quagliana, K., Buddington, K.K., Kimura, Y., Br. J. Nutrition.
2002. 87(2): 231-239.
98. Federico Lara-Villoslada, Elisabeth Debras, Ana Nieto,Angel ConchaJulio Gálvez,
Eduardo López-Huertas, Julio Boza, Christiane Obled, Jordi Xaus,. Clin Nutr. 2005.
25(3): 477-488.
99. Svennerholm et al, Designation and schematic structure of gangliosides and allied
glycosplingolipids., in prog. Brain. Res. 1994, 101:11-19.
100. Boehm, G. & Stahl, B., Oligosaccharides, Functional Dairy Product. Woodhead Publ.
Ltd., Cambridge, England. 2003, 203-243.
101. Nakamura, T., Kawase, H., Kimura, K., Watanabe, Y., Ohtani, M., Arai, I., Urashima, T.,
J.Dairy Sci. 2003, 86:1315- 1320.
102. Katharina E, Scholz-Ahrens, Peter Ade, Berit Marten, Petra Weber, Wolfram Timm,
Yahya Aςil, Claus-C. Glüer, and Jürgen Schrezenmeir., J. Nutr. March 2007, 137(3):
838-846.
103. Scholz-Ahrens, K, Schaafsma, G., Van Den Heuvel, M.H. & Schrezenmeir, J., Effects of
prebiotics on mineral metabolism. The Am. J. of Clin. Nutr. 2001. 73(2): 459–464.
104. Chonan, O. & Watanuki, M., Int. J. Vitam. Nutr. Res. 1996 (66): 244–249.
105. Greger, J.L., Gutkowski, C.M., Khazen, R.R., Journal of Nutrition. 2002.119(11): 1691-
7.
106. Kim EY, Gronewold C, Chatterjee A, von der Lieth CW, Kliem C, Schmauser B,
Wiessler M, Frei E. Chembiochem. 2005, 6(2):422-31.
107. Ben XM, Zhou XY, Zhao WH, Yu WL, Pan W, Zhang WL, Wu SM, Van Beusekom
CM, Schaafsma A.Chin Med J (Engl).2004, 117(6):927-31.
108. Boehm, G., & Stahl, B. Oligosaccharides. Woodhead Publishing Limited. (2003), 203-
243.
109. Kay Fo¨tisch and Stefan Vieths, Glycoconjugate Journal 2001, 18, 373–390.
110. Sharon N, Ofek I. Glycoconj J. 2000, 17(7-9):659-64.
111. Newburg D.S., Ruiz-Palacios G.M., Altaye M., Chaturvedi P., Meinzen-Derr J., Guerrero
M.F., Morrow A.L., Glycobiology. 2004, 14(3):253-63.

140
112. Kunz C., Rudloff S., Baier W., Klein N. and Strobel S. Ann Rev Nutr, 2000, 20, 699–
722.
113. Guillermo M. Ruiz-Palacios, Luz Elena Cervantes, Pilar Ramos, Bibiana Chavez-
Munguia and David S. Newburg. J. Biol. Chem., 2003, 278(16): 14112-14120.
114. Mikkelsen, Trine L; Bakman, Susanne; Sørensen, Esben S; Barkholt, Vibeke; Frøkiaer,
Hanne,. J Agric Food Chem. 2005, 53(20): 7673-80.
115. Zhu L, Cao X, Chen W, Zhang G, Sun D, Wang PG. Bioorg Med Chem. 2005, 13(23):
6381-7.
116. Brennan P.J. Review, Infect Dis., 1989, 11, 5420.
117. Sharon, N., Ofek, I., Glycoconj. J. 2000, 17(7-9): 659-64.
118. Kunz, C., Rudloff, S., Baier, W., Klein, N., & Strobe, S., Annu. Rev. Nutr. 2000, 20: 699–
722.
119. Mehra, R., Kelly, P. Review,. International Dairy Journal. 2006, 16:1334-1340.
120. Kitagawa H, Nakada H, Kurosaka A, Hiraiwa N, Numata Y, Fukui S, Funakoshi I,
Kawasaki T, Yamashina I, Shimada I, et al. Biochemistry. 1989, 28(22): 8891-7
121. Newburg, D.S., Ruiz palacios, G., Morrow, A., Annu. Rev. Nutr. 2005. 25: 37-58.
122. Kay Fo¨tisch and Vieths Stefan, Glycoconjugate Journal. 2001. 18: 373–390.
123. Ben, X.M., Zhou, X.Y., Zhao, W.H., Yu, W.L., Pan, W., Zhang, W.L., Wu, S.M., Van
Beusekom, C.M., Schaafsma, A., Chin Med J (Engl). 2004, 117(6): 927-31.
124. Kobata, A. and Ginsburg V., J. Biol. Chem., 1970, 245, 1484
125. Chaturvedi, P. and Sharma, C.B., Biochim. Biophys. Acta, 1988, 967: 115- 221.
126. Urashima, T.; Kusaka, Y.; Nakamura, T.; Saito, T.; Maeda, N.; Messer, M., Biochim.
Biophys. Acta. 1997, 1334:247-255
127. Smith, D.F.; Zopf, D.A.; Ginsburg, V. Analytical Biochemistry, 1978, 85: 602-608
128. Egge, h.; Dell, A.; Von Nicoli, H. Arch. Biochem. Biophys. 1983, 224, 235
129. Weiruszeski, J.M.; Chekkor, A.; Bouquelt, S.; Montreuil, J.; Strecker, G.; Peter-Katalinic,
J.; Egge, H. Carbohydrate Research, 1985, 137: 127-138.
130. Dreisewerd, K., Kolbl, S., Peter-Katalinic, J., Berkenkamp, S., Pohlentz, G., J. Am. Soc.
Mass Spectrom. 2006. 17(2): 139-50.
131. Jain, R., Sherma, J., John Wiley and sons Ltd. Chichester. 2000, 1583-1603.
132. Chaplin, M.F., Monosaccharide In : Carbohydrate Analysis, A Practical Approach
(chaplin, M.F.and Kennedy, J.F.eds.), p 9, IRL Press, Oxford, England. 1986, 2-36.
133. Wilson, K. & Goulding, K.H., In the biologists guide to principle and techniques of
practical biochemistry, Edward Amold, Landon. 1986.

141
134. Gronberg Gunnar, Lipniunas Peter, Lundgren Torgny, Lindh Frank & Nilsson Bo,
Archives of Biochemistry and Biophysics. 1990. 278(2): 546-555.
135. Marston, A. & Hostettman, Naturalpruduct reports, 1991, 8:391-413.
136. Verzele, M., Anal. Chem. 1990, 62: 265.
137. Synder, L.R., Glajch, J.L., Kirland, J., Practical HPLC Method Development Wiley-
Interscience, New York. 1988.
138. Gareil, P. and Rosset, R., Analysis. 1988. 10: 445.
139. Mechref ,Y., Novotny, M.V. Chem. Rev. 2002, 102(2): 321-370.
140. Shirly, C. Chrrums., Journel of Chromatography. 1996, 720: 75-91.
141. Virendra K. Dua, B. Narasinga, R. Shing-Shing, WuS Volker, E. Dubs, C. Allen Bush,
Journal of biological chemistry. 1986, 261(4): 1599-1608.
142. Cheetham, N.W.H., Dube, V.E., Journal of chromatography. 1983. 262: 426-430.
143. Sumiyoshi, W., Urashima, T., Nakamura, T., Arai, I., Saito, T., British Journal of
Nutrition. 2003, 89(1): 61-69.
144. Dunand, J., Gagnaire, D., Odier, L., Vincendon, M., Org. Magn. Reson. 1972, 4: 523.
145. Hall, L.D., Sukumar, S., J. Chem. Soc. Chem. Commun. 1979, 292.
146. Utille, J., Vottero, J.A., Carbohydrate Research. 1981, 98: 1.
147. Killiani, H., Uber digitalinum verum. ber. Deutsch Chem.ges. 1930, 63: 2866.
148. Mannich C., Siewart G. Uber g- strophanthin and g-strophanthin. ber. Deutsch Chem.ges.
1942, 75: 737.
149. Jimenez, J., Barbero & Peters, T., NMR Spectroscopy of Glycoconjugates. Wiley-vch,
Weinheim, 2002.
150. Hounsell, E. F., Nuclear Magnetic Resonance. 2005, 34: 212.
151. Agrawal, P.K., Phytochemistry. 1992, 31(10): 3307-3330.
152. Hermansson, K., Jansson, P.E., Kenne, L., Widmain, G. & Lindh, F., Carbohydrate
Research. 1992, 235: 69.
153. Duus, J.Q., Gotfredsen, C.H., Bock, K., Chem. Rev. 2000, 100: 4589-4614.
154. Roumestand, C., Delay, C., Gavin, J.A., Canet, D., Magn. Reson. Chem. 1999, 37: 451-
478.
155. Uhrin, D., Elsveir : Amsterdom. 1997, 3: 51-89.
156. Bodenhausen, G., Ruben, D., J. Chem. Phys. Lett. 1980, 69: 185-189.
157. Muller, L., J. Am. Chem. Soc. 1979, 101: 4481-4484.
158. Bax, A., Griffey, R.H., Hawkins, B.L., J. Magna. Reson. 1983, 55: 301-315.
159. Bax, A., Summers, M.F., J. Am. Chem. Soc. 1986, 108: 2093-2094.

142
160. Jansson, P., Kenne, L., Widmalm, G. Carbohydrate Research. 1987, 168: 67-77.
161. Lemieux, R.U., Buck, K., Delbaree, L., Koto, S., Rao, V.S., Can. J. Chem. 1980, 58: 631-
653.
162. Vinogradov, E., Peterson, B.O., Thomous-Oetus, J.E., Duas, J., Brade, H., Holst, O., J.
Biol. Chem. 1998, 273: 28122-28131.
163. Van Halbeek, H.,John Willey & Sons Ltd. Chichester. 1996, 1107-1137.
164. Fournet, B., Vliegenthart, J.F.G., Halbeek, H.V., Binette, J.P., Schmidt, K., Biochemistry.
1978, 17(24): 5206.
165. Vliegenthart, J.F.G., Halbeek, H.V., Dorland, L., Pur. Appl. Chemistry. 1981, 53: 45.
166. Gronberg, G., Lipniunas, P., Lundgren, T., Lindh, F., Nilsson, B., Archives of Biochem.
Biophys. 1992, 296(2): 597-610.
167. Dabrowski, U., Egge, H., Dabrowski, J., Archives of Biochem. Biophys. 1983, 224(1):
254-260.
168. Wengang Chai, Vladimir E. Piskarev , Yibing Zhang, Alexander M. Lawson and Heide
Kogelberg N., Archives of Biochem. Biophys. 2005, 434(1): 116-127.
169. Kogelberg, H., Piskarev, V.E., Zhang, Y., Lawson, A.M., Chai, W., European Journal of
Biochemistry. 2004, 271(6): 1172-1186.
170. Bailey, D., Davies, M.J., Routier, F.H., Bauer, C., Feeney, J., Hounsell, E.F.,
Carbohydrate Research. 1997, 300(4): 289-300.
171. Urashima, T., Bubb, W.A., Messer, M., Tsuji, Y., Taneda, Y., Carbohydrate Research.
1994, 262(2): 173-184.
172. Itokawa, H., Xu, J., Takey, K., Chem. Pharma. Bull. 1988, 36: 4441.
173. Kitagava, I., Zhang, R., Park, J.D., Baek, N.I., Takeda, Y., Yoshikawa, M., Shibuya, H.,
Chem. Pharma. Bull. 1992, 40: 4872.
174. Idaka, K., Hirai, Y., Shoji, J., Chem. Pharma. Bull. 1988, 36: 1783.
175. Tanaka, T., Tsukumoto, S., Hayashi, K., Phytochemistry. 1990, 29: 229.
176. Mitsuhashi, H., Hayashi, K., Chem. Abstr. 1985, 103: 109804.
177. Bock, K., Pederson, C., J. Chem. Soc. Perkin Trans. 1974, 2: 293-297.
178. Johannes, F.G.Vlegenthart, L. Dorland, H. VanHalbeek, J. Haverkamp, acid Cell Biology
Monographs. 1982, 1:127-172.
179. Bodenhausen, G., Freeman, R., J. Magnetic Resonance. 1971, 28: 471.
180. Aue, W.P., Bartholdi, E., Ernst, R., J. Chem. Phys. 1976, 64: 2229-2246.
181. Piantini, U., Soreson, O., Ernst, R., J. Am. Chem. Soci. 1982, 104: 6800-6801.

143
182. Sophie, H.F., Wieruzski, J.M., Planke, Y., Michalski, J.C., Montreuil, J., Strecker, G.,
Eur. Journal of Biochemistry. 1993, 215: 361-371.
183. Davis, A.L., Laue, E.D., Keeler, J., Moskou, D., Lohman, J., Journal of Magnetic
Resonance. 1991, 94: 637-644.
184. Findlay, J.A., Yayli, N., Radics, L., J. Natural Product. 1972, 55(1): 93-101.
185. Dunkel, R., Mayne, C.L., Pugmire, R.J., Grant, D.M., Analytical Chemistry. 1992, 64:
3133-49.
186. Ong, R.L., Yu, R.K., Arch. Biochem. Biophys. 1986, 245(1): 157-166.
187. Bax, A., Davis, D.G., J. Magn. Reson. 1985, 65: 335-360.
188. Braunschweiler, L., Ernst, R., J. Magn. Reson. 1983, 53: 521-528.
189. Jeener, J., Meier, B.H., Bachmann, P., Ernst, R., J. Chem. Phys. 1979, 71: 4546-4553.
190. Kumar, A., Ernst, R., Wutrich, K., Biochem. Biophys. Res. Commun. 1980, 95: 1-6.
191. Bothner, A., Stephens, R.L., Lee, J., Warren, C.D., Jeanloz, R.W., J. Am. Chem. Soci.
1984, 106: 811-813.
192. Bax, A., Davis, D.G., J. Magna. Reson. 1985, 63: 207-213.
193. Hurd, R.E., John, B.K., J. Magna. Reson. 1991, 91: 648-653.
194. Key, L.E., Keifer, P., Saarinen, T., J. Am. Chem. Soc. 1992, 114: 10663-10665.
195. Willer, W., Leibfritz, D., Kersebaum, R., Bermal, W., Magn. Reson. Chem. 1993, 31:
287-292.
196. Bendick, B., Carbohydrate Research. 1999, 315: 206-221.
197. Bendik, B., Carbohydrate Research. 1999, 321: 139.
198. Waard, P., Leefang, B.R., Vliegenthart, J.F., Boelens, R., Vuisiter, G.W., Kaptein, R., J.
Biomol. NMR. 1992, 2(3): 211-226.
199. Qiduan, J., Qianlan, Z. and Quanzhang, M. Phytochemistry, 1989, 28, 1273.
200. Derome, A.E., Pergamonn Press, Phytochemistry, 1992, 3: 3307-3330.
201. Fales HM, Milne GW, Pisano JJ, Brewer HB, Blum MS, MacConnell JG, Brand J, Law
N., Recent Prog. Horm. Res.1972, 28: 591-626.
202. M. Barber et al., Analytical Chemistry, 1982, 54: 645.
203. Antonio Martinez-Fereza, Silvia Rudloffb, Antonio Guadixa, Cordula A. Henkelb,
Gottfried Pohlentzc, Julio J. Bozaa, Emilia M. Guadixa, Clemens Kunzb., International
Dairy Journal. 2006, 16: 173–181
204. Danièle Viverge, Louis Grimmonprez, Maryse Solere., Biochimica et Biophysica Acta,
1997, 1336: 157–164.
205. Bruno Domon, Catherine E Costello., Glycoconjugate J. 1988, 5:397-409.

144
206. Dubois, M., Gilles, K.A., Hamilton, J.K., Rebers, P.A., Smith, F., Analytical Chemistry.
1956, 28: 350.
207. Fiegl, F., Elsvier Publication, Amsterdam. 1975, 337.
208. Warren, L., Nature. 1960, 186: 237.
209. Dorland, F., Schut, B.L., Vliegenthart, J.F.G., Strecker, G., Fournet, B., Spik, G.,
Montreuil, J., Eur. J. Biochem. 1977, 73: 93.
210. Prasoon Chaturvedi, Chandra B. Sharma, Carbohydrate Research. 1990, 203: 91-101.
211. Gronberg Gunnar, Lipniunas Peter, Lundgren Torgny, Lindh Frank & Nilsson Bo,
Archives of Biochemistry and Biophysics. 1990, 278(2): 546-555.
212. Virendra K. Dua, C. Allen Bush, Analytical Biochemistry. 1983, 133: 1-8.
213. Uemura, Y., Asakuma, S., Yon, L., Saito, T., Fuuda, K., Arai, I., Urashima, T.,
Comparative Biochemistry and Physiology-Part Molecular & Integrative Physiology.
2006, 145(4): 468-478.
214. Gronburg, G.; Lipniunas, P.; Lundgren, T. C. Carbohydrate Research. 1989, 191, 261-
278.
215. Gronburg, G.; Lipniunas, P.; Lundgren, T. C.; Lindh, F.; Nilsson, B Arch. Biochem.
Biophys. 1992, 296(2): 597-610.
216. Kover, K.E.; Fehar, K.; szilagyi, L.; Borbas, A.; Herczegh, P.; Liptak, A, Tetrahedron
Letters, 2000, 41, 393
217. Strecker, G., Fievre, S., Wieruszeski, J.M., Michalski, J.C., Montreuil, J., Carbohydr.
Res. 1992, 226: 1-14.
218. Bodenhausen, G.; Freeman, R., J. Magn. Reson. 1971, 28, 471.
219. Freeden, O., Goldschmidt, L., Mikrochim Acta. 1937. 1: 351.
220. Partridge, S.M., Nature. 1949. 164: 443.
221. Warren, L., J. Biol. Chem. 1959. 234: 1971-1975.
222. Bryant, F., Overell, B.T., Biochimica et Biophysica Acta. 1953 10: 471.
145
APPENDIX-I
List of Publications /seminars
Publications:
1. Ashok Kr. Ranjan and Desh Deepak, Isolation and purification of sheep milk
oligosaccharide as therapeutic agents, Journal of biological and chemical research. 2015,
32(2), 455-465.
2. Ramendra S Rathore, Ashok Kumar Ranjan, Desh Deepak, Anakshi Khare, Ragini
Sahai, V. M. L. Srivastava., Isolation of Novel Hexa and Heptasaccharide from
Immunostimulant Oligosaccharide Fraction of Donkey’s Milk., Journal of molecular
structure. (communicated)
Seminars/Conferences
1. Poster presented in National seminar on “Newer trends in physico-chemical techniques”
at Chemistry department, university of Lucknow, Lucknow on 7th Aug. 2013. Published
in proceeding on p. no. 23
“Isolation of novel compounds from oligosaccharide fraction of Chauri Cow milk by
physico-chemical techniques”
2. Poster presented in “international carbohydrate symposium” at Indian institute of science,
Bangalore on 12th -17th Jan. 2014. Published in proceeding on p. no. 265
“Isolation of two novel oligosaccharides from yak milk”
3. Poster presented in International seminar on “recent advances in analytical science” at
BHUIIT, Varanasi on 27th -29th March, 2014. Published in proceeding on p. no. 87
“Structure elucidation of milk oligosaccharide by MASS spectrometry”
4. Poster presented in National seminar on “Trends in carbohydrate” at (IISER) Mohali on
29th -31st Dec. 2014. Published in proceeding on p. no. 106
“ Identification of novel Sheep milk oligosaccharide by NMR”
5. Poster presented in “Indian science congress” at Mumbai University, Mumbai on 3rd to
7th Jan. 2015. Published in proceeding on p. no. 136
“Novel oligosaccharide isolated from Sheep’s milk”