issue and direction of energy network optimization in ...iiesi.org/assets/pdfs/daejeon_kim.pdf ·...
TRANSCRIPT

Version 2.0
Issue and direction of Energy Network Optimization
in Petrochemical Industry
Infotrol Technology, Co., Ltd. since 2004

Revision History
Date Version Author Comment
2015. 10. 15 1.0 KTW Presentation Content Scheme
2015. 10. 16 1.7 KTW Presentation Content Scheme update
2015. 10. 19 2.0 WHK Review and update

Energy Network in Process Industry
3
q Definition: Network of energy production, distribution and consumption
q Network composition: Furnace, Boiler, gas turbine, HRSG, turbine, heat exchanger, electrical/steam
motor, let down equipment, heat pump, header line and users, etc.
q Application area: Process industry such as petrochemicals, refinery and chemical companies etc
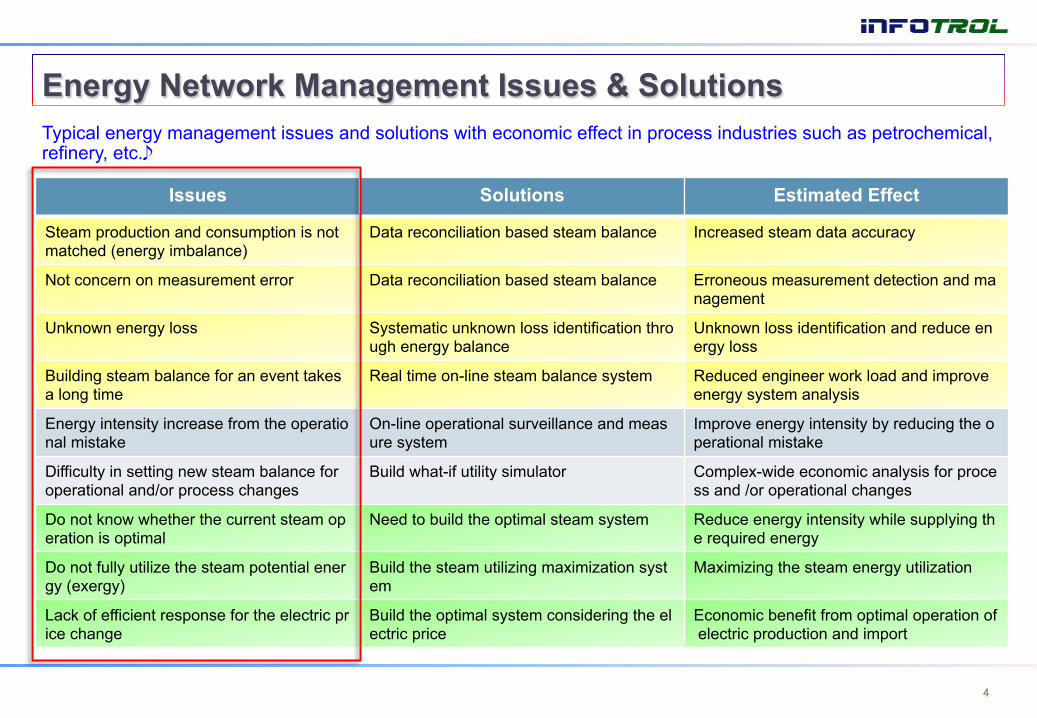
Energy Network Management Issues & Solutions
4
Issues Solutions Estimated Effect
Steam production and consumption is not matched (energy imbalance)
Data reconciliation based steam balance Increased steam data accuracy
Not concern on measurement error Data reconciliation based steam balance Erroneous measurement detection and management
Unknown energy loss Systematic unknown loss identification through energy balance
Unknown loss identification and reduce energy loss
Building steam balance for an event takes a long time
Real time on-line steam balance system Reduced engineer work load and improve energy system analysis
Energy intensity increase from the operational mistake
On-line operational surveillance and measure system
Improve energy intensity by reducing the operational mistake
Difficulty in setting new steam balance for operational and/or process changes
Build what-if utility simulator Complex-wide economic analysis for process and /or operational changes
Do not know whether the current steam operation is optimal
Need to build the optimal steam system Reduce energy intensity while supplying the required energy
Do not fully utilize the steam potential energy (exergy)
Build the steam utilizing maximization system
Maximizing the steam energy utilization
Lack of efficient response for the electric price change
Build the optimal system considering the electric price
Economic benefit from optimal operation of electric production and import
Typical energy management issues and solutions with economic effect in process industries such as petrochemical, refinery, etc.
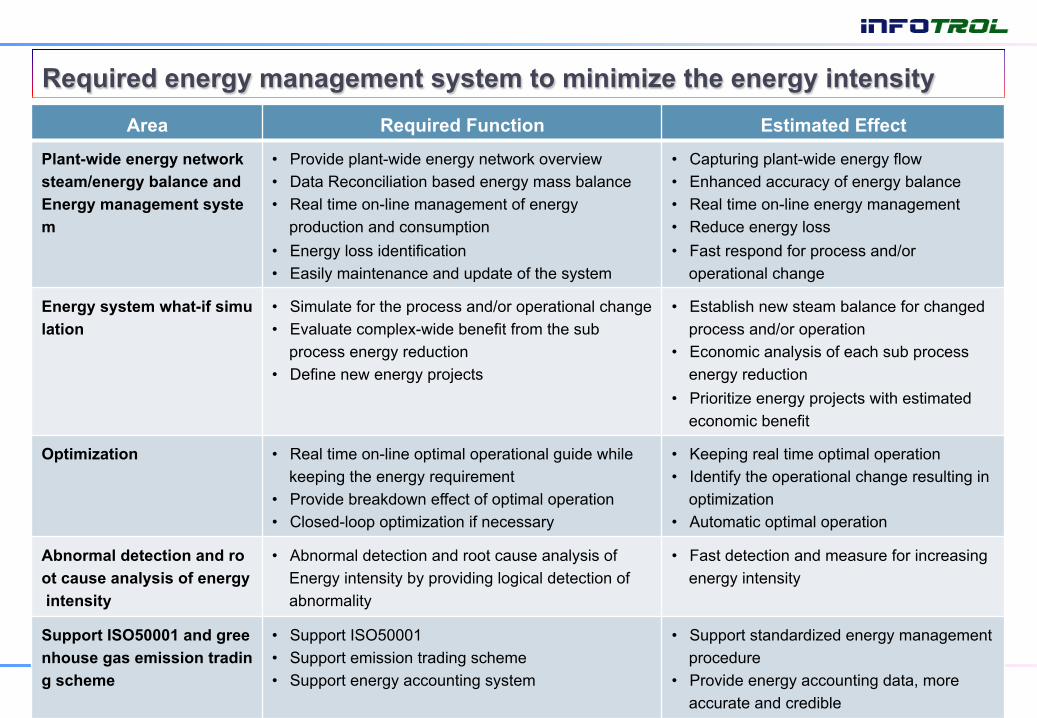
Required energy management system to minimize the energy intensity
5
Area Required Function Estimated Effect
Plant-wide energy network steam/energy balance and Energy management system
• Provide plant-wide energy network overview • Data Reconciliation based energy mass balance • Real time on-line management of energy
production and consumption • Energy loss identification • Easily maintenance and update of the system
• Capturing plant-wide energy flow • Enhanced accuracy of energy balance • Real time on-line energy management • Reduce energy loss • Fast respond for process and/or
operational change
Energy system what-if simulation
• Simulate for the process and/or operational change • Evaluate complex-wide benefit from the sub
process energy reduction • Define new energy projects
• Establish new steam balance for changed process and/or operation
• Economic analysis of each sub process energy reduction
• Prioritize energy projects with estimated economic benefit
Optimization • Real time on-line optimal operational guide while keeping the energy requirement
• Provide breakdown effect of optimal operation • Closed-loop optimization if necessary
• Keeping real time optimal operation • Identify the operational change resulting in
optimization • Automatic optimal operation
Abnormal detection and root cause analysis of energy intensity
• Abnormal detection and root cause analysis of Energy intensity by providing logical detection of abnormality
• Fast detection and measure for increasing energy intensity
Support ISO50001 and greenhouse gas emission trading scheme
• Support ISO50001 • Support emission trading scheme • Support energy accounting system
• Support standardized energy management procedure
• Provide energy accounting data, more accurate and credible

Project Objective
• Complex-wide Energy Balance
• Complex-wide Energy Network Optimization
• Main Energy Equipment Efficiency Management
• What-if simulation of energy network
• Energy intensity management by plant or process
• Energy Network optimization and management system
• Energy balance and optimization report
• Energy Usage Management by quantity and price base Note : Induce energy innovation by sharing company-wide information sharing using Web technology
Construct Energy Management system to optimize complex-wide energy network and minimize plant energy intensity
▣ Energy Network Optimization System
▣ Complex-wide Energy Management System

q EMS q ENetOPT Proposed Solution
7
q Energy balance l Steam production and consumption
balance l Analyze erroneous measurement l Analyze the energy & mass loss
identification (steam, trap, tracing) q Simulation
l Simulate Effect of New energy equipment installation
ü Boiler, HSRG, Turbine investment effect
l Simulate Effect of Plant Operation Condition
ü MP, LP usage change (change due to product output or process revamp)
q Energy equipment efficiency l Boiler, Turbine, Pump, Heat exchanger
efficiency calculation and analysis q Optimization
l Load balance considering boiler efficiency l Optimize Turbine exhaust, condensing and
electricity
q Energy Network Monitoring l Complex wide summary and detailed plant energy
network l Steam/Condensate measured, balance and
optimization q Inter-company utility trading history
l Histories utility trading and reports via various diagram
l Calculates optimum trade amount q Greenhouse emission management
l Histories and report green house gas emission q Energy Intensity
l Analyze the cause of plant energy intensity increase
q Optimization l Display and Report energy optimization condition
and result q Equipment Efficiency
l Equipment Efficiency calculation and monitoring l Analyze abnormal operation cause

ENetOPT: Functional Configuration
8
Visual Modeling l Drag & Drop based visual
modeling of energy network l Equation-based system
The image cannot be displayed. Your computer may not have enough memory to open the image, or the image may have been corrupted. Restart your computer, and then open the file again. If the red x still appears, you may have to delete the image and then insert it again.
Monitoring Balance Optimization
Reporting Simulation
DB
ENetOpt System
Field data Interface l OPC (DA3.0, UA) l RTDB (PHD, CIM I/O, INSQL, PI) l RDB (Oracle, SQL) l XML
Optimization l Minimize energy cost l Maximize the utilization of high
value energy l Mixed Integer Linear
Programming
Simulation l Energy Production and
distribution simulation for the changed operational change
l Simulation for the new or changed facilities
l Extend to operator training
Report l Steam /condensate balance l Energy Network optimization l Database of the all the input and
result l Connect to the database for the
customized report
DCS SCADA
On-line Energy Balance l Energy balance for each
equipment, unit, plant and complex-wide
l Data reconciliation with standard deviation of each measurement
Efficiency
Efficiency and Energy Intensity
l Equipment efficiency calculation l Unit and plant energy intensity
definition and calculation l Abnormal and inefficiency
operation detection

ENetOPT Applied Technology
9

ENetOPT: Visual Modeling
10
" Mathematical modeled energy equipment stencil " Multi-layer configuration " Steam and Coolant equipment modeled template " Can provide the custom specific energy equipment " Can fully utilize MS VISIO functions such as hyperlink to user documents
q Easily build the Energy Network by drag & drop energy equipment stencil l Easily build and modify the energy network without any hard coding program l ENetOPT creates automatically equation based code
Drag & Drop

ENetOPT: Plant-wide Energy Balance
" Data Reconciled material balance and energy calculation based on the status of the flow " Balance report created " Automatic periodic running at the frequency given by user " Use to analyze the energy loss identification, erroneous measurement, etc.

ENetOPT: What-if Simulation
12 12
" Simulation for the change of operational conditions and/or energy equipment arrangement " Analyze the effect of load change, new energy consumption and production facility, etc. " Analysis report created

13
ENetOPT: Equipment Efficiency Management
13
" Calculation and management of each equipment and unit section’s performance efficiency " Early detection of inefficient equipment or unit section " Analyze the performance trend of each equipment daily, monthly and yearly " With logical flow chart program such as Infotrol’s IPOES to detect the source of efficiency deterioration
and to suggest the improvement
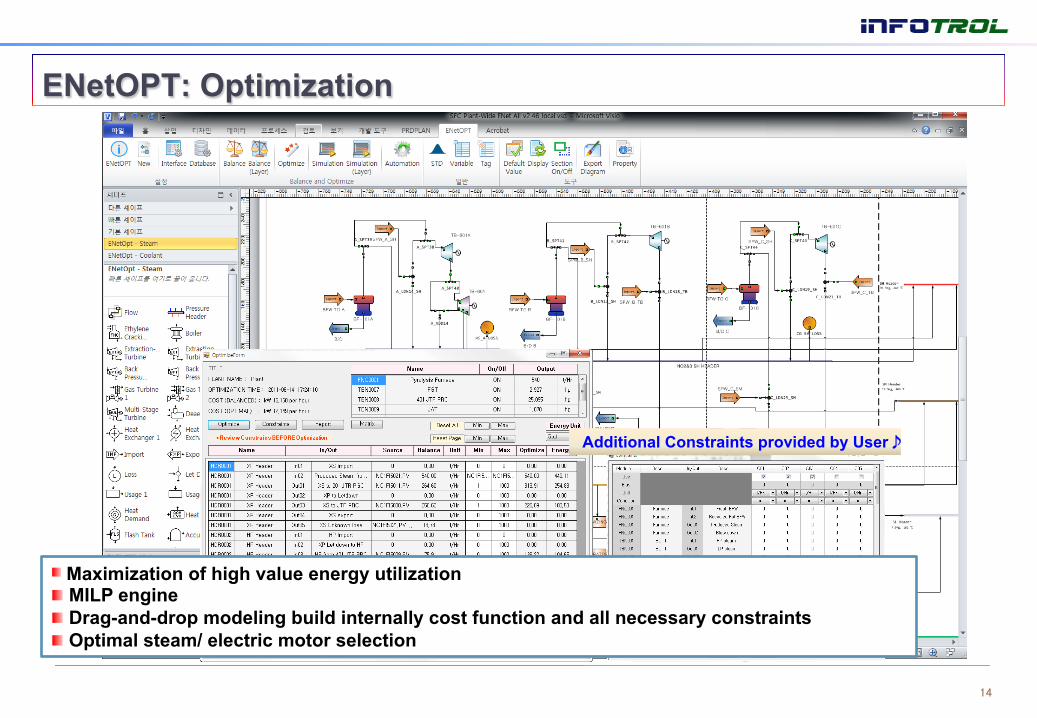
ENetOPT: Optimization
14
" Maximization of high value energy utilization " MILP engine " Drag-and-drop modeling build internally cost function and all necessary constraints " Optimal steam/ electric motor selection
Additional Constraints provided by User
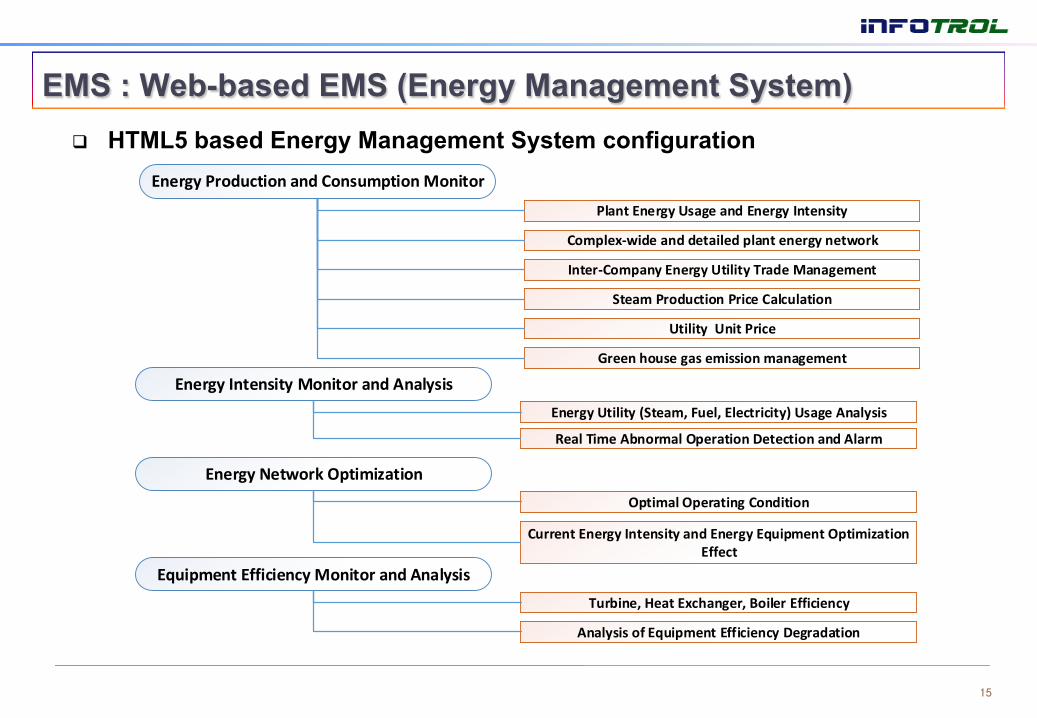
EMS : Web-based EMS (Energy Management System) q HTML5 based Energy Management System configuration
15
Energy Production and Consumption Monitor
Plant Energy Usage and Energy Intensity
Complex-‐wide and detailed plant energy network
Utility Unit Price
Energy Intensity Monitor and AnalysisEnergy Utility (Steam, Fuel, Electricity) Usage Analysis
Real Time Abnormal Operation Detection and Alarm
Equipment Efficiency Monitor and AnalysisTurbine, Heat Exchanger, Boiler Efficiency
Analysis of Equipment Efficiency Degradation
Steam Production Price Calculation
Green house gas emission management
Energy Network OptimizationOptimal Operating Condition
Current Energy Intensity and Energy Equipment Optimization Effect
Inter-‐Company Energy Utility Trade Management
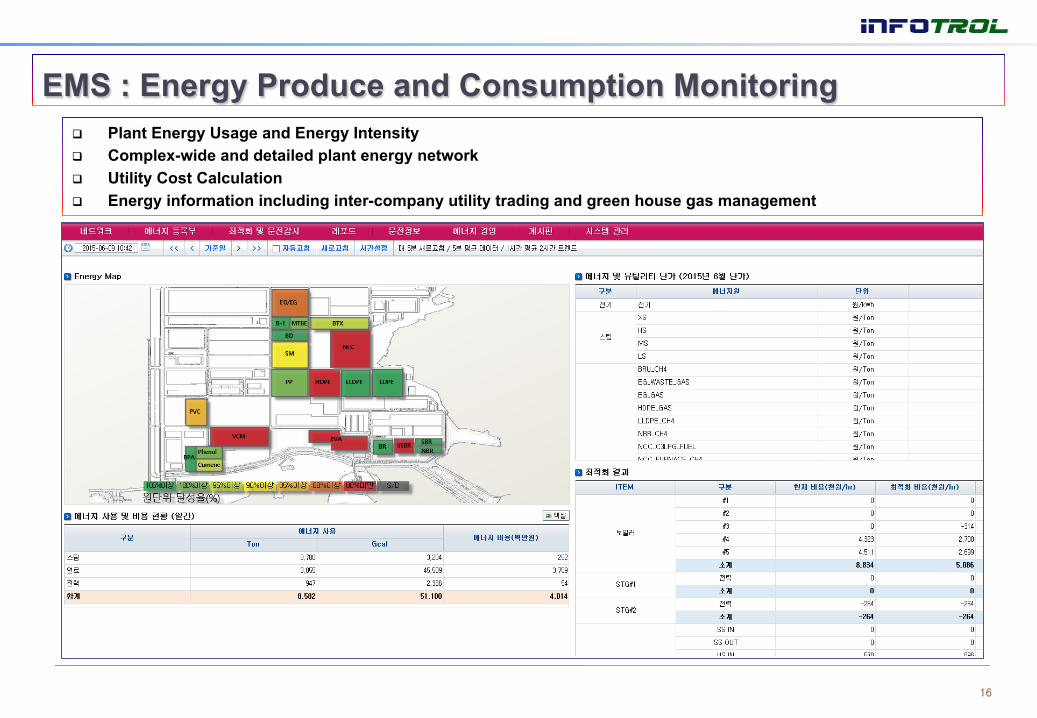
EMS : Energy Produce and Consumption Monitoring q Plant Energy Usage and Energy Intensity q Complex-wide and detailed plant energy network q Utility Cost Calculation q Energy information including inter-company utility trading and green house gas management
16

EMS : Plant Energy Network Monitoring q Report current fuel, steam, electricity usage, and trend q Monitors the cost of energy utility and Greenhouse gas emission q Induce energy usage reduction
17

EMS : Energy Network Monitoring
18
q Complex wide overview energy network summary q Detailed plant energy network q Steam/condensate measured, balance and optimization result
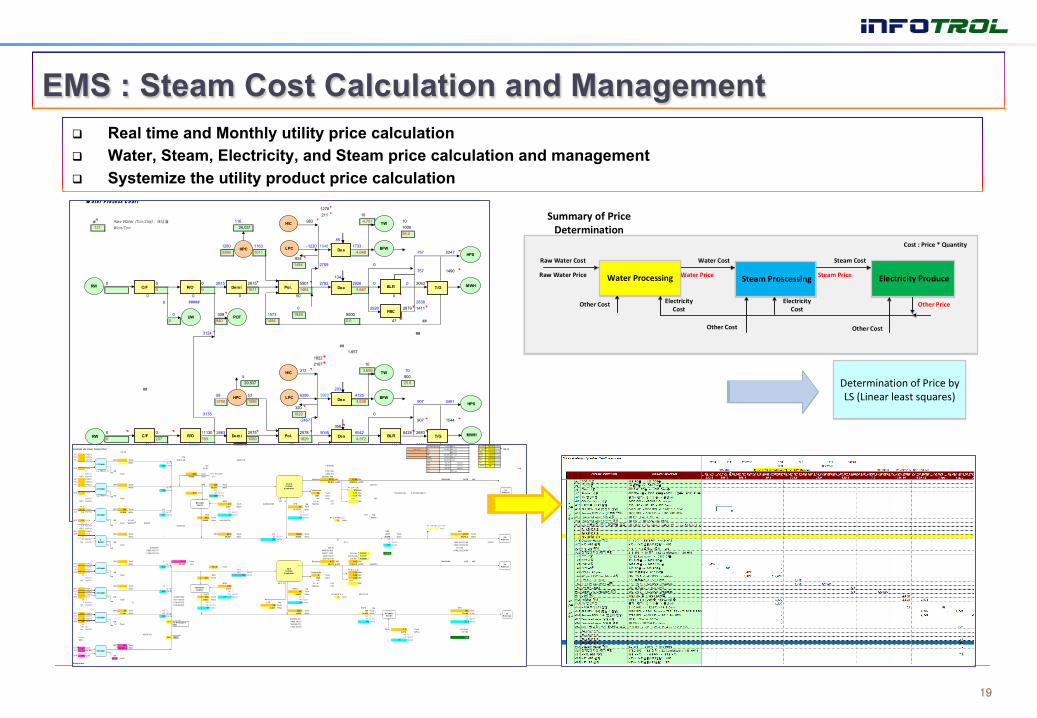
EMS : Steam Cost Calculation and Management q Real time and Monthly utility price calculation q Water, Steam, Electricity, and Steam price calculation and management q Systemize the utility product price calculation
19
W a te r P ro ce ss C h a r t
# Raw Water (Ton/Day) : 해당월
Won/Ton
0
##
##
##
##
FW3159
11130
42.9
0
1484
283
2663
#####
831
940
29,837
312
29.3
5
1829
1233
6396
809
783
8320
18776500144
#####
309
0
28150
00 0
0
1278211
116 983
-1220
1484824
1648
2709
1011
85
0
50
0134
550114840
757
1829 9000
30633,667
131
1011328611631280
26,031
757 1490
2247
141128792838
907
10
131
2575
907 1544
2838
2451
2683
-831
474
357
0.0
203
0
47
3,639 4125
5006
0
94756
10
0
3124
2815
0237
#####
0
3178 0
101000
0
2926
0
36.4
10
17334,648
2926 0
4,751
0
64284,572
120
358
25.6900
1,657
3,696
0
5045
47526.0820
6542
0
50
1829
2578
5000
1829
96
1139
7.3
114
50004900
5006
0
856
8091422
-2467
3201829
2792
392252
18222107
1573
58
144 0
3700
88
1086
1086
UW POT
POT
BFW
MWH
HPSLPC
#1CW
HPC
H/C
RW
RW
HPC LPC
H/C
BFW
MWH
HPS
#2CW
BTXCW
Co-genCW
UW
TW
TW
RW from R/O
C/F R/O Demi Pol.
Dea
Dea BLR
FBC
T/G
C/F R/O Demi Pol. Dea BLR T/G
Dea
#2 BFW (Boiler) 4,572 \₩/ton #1 HPS 760.00 kcal/kg
E le ct r ic i t y a n d S te am P ro ce ss C h a rt Fuel 단가 BC 131,853 \₩/FOEB #2 HPS 751.50 kcal/kg 7 5 5 .7 5
192.29 PFO - \₩/FOEB HPC 192.00 kcal/kg
BC - FOEB/hr PN 155,395 \₩/FOEB MPS 704.50 kcal/kg
PFO - FOEB/hr 179 COKE 116,658 \₩/ton MPC 153.60 kcal/kg
PN - FOEB/hr SPS - Ton/h - ℃ 30,819.25 28,094.10 KEPCO 109,492 VMW LPS 676.20 kcal/kg
- \₩/ton - Kg/cm2 HPS 755.75 kcal/kg LPC 100.00 kcal/kg
826 Kcal/kg 120 1,816,926 MPS 704.50 kcal/kg BFW 35 kcal/kg
BFW - Ton/h 127.67 LPS 676.20 kcal/kg 0.48- ℃ 효율 #DIV/0! % BD PFO - \₩/FOEB
- Kg/cm2 - Ton/h 58.8 Ton/h From #2 Cogen 3,838,312 139.0 Kcal/Kg 36,380 \₩/ton SPS 3935622.958
BC - FOEB/hr Electricity 23.70 MW 23.55 MW E le c t r ic it y 23.70 MWPFO - FOEB/hr 85,302 \₩/MW 85,842.0 \₩/MWPN - FOEB/hr SPS - Ton/h - ℃ SPS 128 Ton/h 2021312
- \₩/ton - Kg/cm2 30,826 \₩/ton #1 발전 사용
826 Kcal/kg 494 ℃ Condensate 5.34 MWBFW - Ton/h 51.1 Ton/h 103 Kg/cm2 66 Ton/h 0.15 MW 1,584,330,094 6,352,909,298.73
- ℃ 효율 #DIV/0! % BD 799 Kcal/kg 1,484 \₩/ton 5.19 MW- Kg/cm2 - Ton/h 효율 538 Kcal Loss 560
138.0 Kcal/Kg BFW 100 % 회수율 0.51 MW3.1 Ton/h 0.486422388 HPS tag MW/Ton 2.77
11.7 3,667 \₩/ton 62 Ton/hCoke 11.7 TON/hr SPS 120 Ton/h 499 ℃ 150 ℃ 29,256.42 \₩/tonB-C 0.2 FOEB/hr 28,094 \₩/ton 108 Kg/cm2 110 Kg/cm2 370 ℃
797 Kcal/kg HPS 124 Kcal/kg 43 Kg/cm2 69.1 19254.2 Ton/h 752 Kcal/kg #1 발전 HPS 사용 #REF!
BFW 122 Ton/h 효율 90 % BD 57.407 29,256 \₩/ton 0.061320755 23 Ton/h141 ℃ 2 Ton/h #DIV/0! #DIV/0!119 Kg/cm2 29,256.42 Loss #1 발전 (MP, LP 사용)
139.0 Kcal/Kg - Ton/h - Ton/h
BFO - FOEB/hr HPS HPSBFW - Ton/h SPS - Ton/h - HPS 54.2 Ton/h 378 ℃ 116.30 Ton/h 93.71 Ton/h 93.71 Ton/h
22 ℃ - \₩/ton - 29,256 \₩/ton 42 Kg/cm2 29,256 \₩/ton 29,256 \₩/ton 29,256.4 \₩/ton41 Kg/cm2 760 Kcal/kg 23 378 ℃
150 Kcal/Kg BD 31.3 42 Kg/cm2 1,842,304,572.58 225.03 효율 - % Ton/h 760 Kcal/kg 2,926,274,632.09
8,686,684 538.35 215.1256,462,892,770 4066368.432 36,312 4,768,579,204.68
11,925,972,330 336071.2753 JVC Elec #NAME? 29,256 3,428,140.15 JVC R-cogen #NAME?3,764,211.42 JVC Mu #NAME?
SPS - Ton/h 91 ℃ 144.4 Ton/h Electricity 4.17 MW 4.11 MW E le c t r ic it y 4.17 MWBFO - FOEB/hr - \₩/ton - Kg/cm2 36,380 \/ton 80,618 \₩/MW 81,856.0 \₩/MW 336322.5PFO - FOEB/hr 825 Kcal/kg 111.8 Ton/hPN - FOEB/hr 500.0 ℃ #2 발전 사용
BFW - Ton/h 효율 #DIV/0! % BD 94.0 Kg/cm2 Condensate 7.71 MW22 ℃ - Ton/h SPS 822 Kcal/kg 4 Ton/h 0.06 MW
- Kg/cm2 32.7 Ton/h 1829 \₩/ton 7.65 MW139 Kcal/Kg 효율 545 Loss
BFW 90.3 % 회수율 0.03 MWSPS - Ton/h 99 ℃ 1.65 MW/Ton 0.84
BFO - FOEB/hr - \₩/ton - Kg/cm2 4,572 HHPS tagPFO - FOEB/hr 825 Kcal/kg 150 ℃ 98 Ton/hPN - FOEB/hr HHPS 110 Kg/cm2 34,852 \₩/ton #2 HHPS 발전 4321014.2
BFW - Ton/h 효율 #DIV/0! % BD 1188627.554 34.3 Ton/h 135 Kcal/kg 420 ℃ 9 Ton/h24 ℃ - Ton/h 7537.723753 34,852 \₩/ton 44 Kg/cm2
0 Kg/cm2 72 1196165.278 420 ℃ LPS tag 788 Kcal/kg Loss140 Kcal/Kg 1196165.278 44 Kg/cm2 9.9 Ton/h - Ton/h
789 Kcal/kg 29,837 \₩/Ton HHPS tag HPSSPS 72 Ton/h 529 ℃ 132.7 Ton/h 124 Ton/h 131 Ton/h
BFO 35.5 FOEB/hr 73,501 \₩/ton 105 Kg/cm2 34,852 \₩/ton 34,852 \₩/ton 33,160 \₩/TonPFO - FOEB/hr 822 Kcal/kg 420 ℃ 370 ℃
PN 0 FOEB/hr 4624305.427 44 Kg/cm2 43 Kg/cm2
BFW 74 Ton/h 효율 91.1 % BD 123.4 3,428,140.15 788 Kcal/kg 751.5 Kcal/kg
128 ℃ 1.4 Ton/h 1196165.278107 Kg 4,624,305.43 36,732
134 Kcal/Kg BFW 7.3 Ton/h 33,159.90 4,572 \₩/Ton 47,763
36379.728 150 ℃ 34,934 137.6666667 64.6 110 Kg/cm2 256 6551 135 Kcal/kg
SPS 195 Ton/hCoke 18.44189007 Ton/h 22,644 \₩/tonB-C 0 FOEB/hr
BFW 199 Ton/h BD3 Ton/h
A s s u m p t io n s
2,021,386
#1 B o i le r
#2 B o i le r
#3 B o i le r
EB o i le r
#4 B o i le r
#5 B o i le r
#6 B o i le r
D e s u p e rh e a te r
#1/2/3T u rb in e
G e n e ra to r
#4/5T u rb in e
G e n e ra to r
D e s u p e rh e a te r
D e s u p e rh e a te r
T oP ro c e s s
T oP ro c e s s
To #1 Header +HOU
T oP ro c e s s
T oP ro c e s s
#8 B o i le r
HOU
Other Cost Electricity Cost
Electricity Cost
Other Price
Steam CostWater Cost
Raw Water Price
Raw Water Cost
Cost : Price * Quantity
Summary of Price Determination
Steam PriceWater Price
Other Cost Other Cost
Determination of Price by LS (Linear least squares)
Water Processing Steam Proscessing Electricity Produce
EMS : Inter-company energy utility history
20
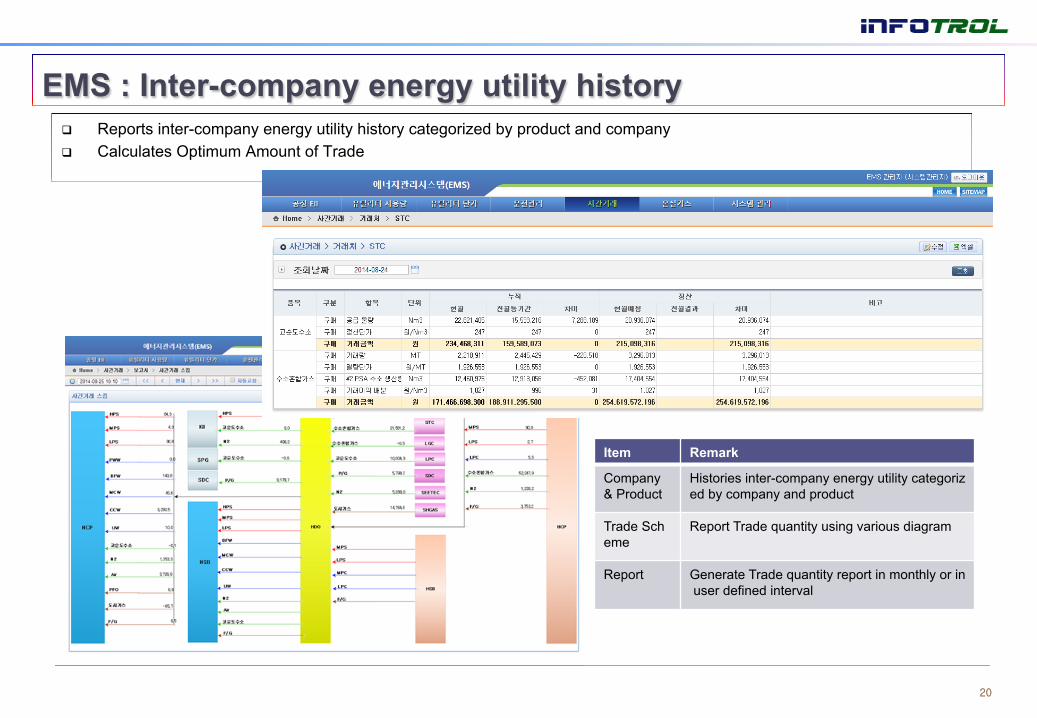
q Reports inter-company energy utility history categorized by product and company q Calculates Optimum Amount of Trade
Item Remark
Company & Product
Histories inter-company energy utility categorized by company and product
Trade Scheme
Report Trade quantity using various diagram
Report Generate Trade quantity report in monthly or in user defined interval
EMS : Green house gas emission management
21
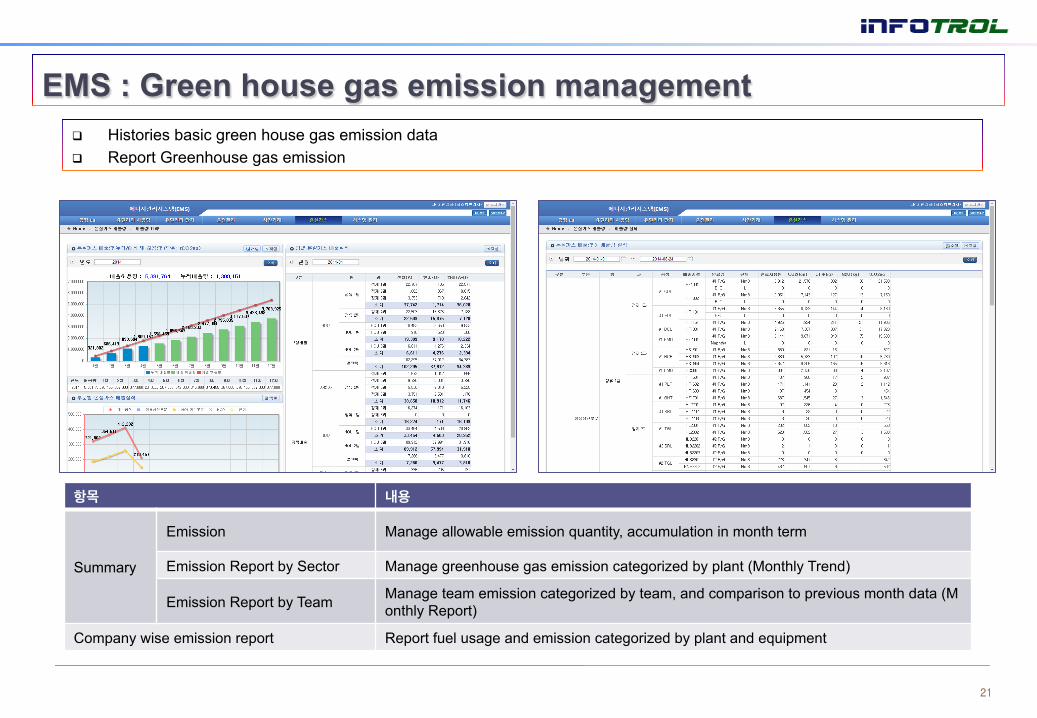
q Histories basic green house gas emission data q Report Greenhouse gas emission
항목 내용
Summary
Emission Manage allowable emission quantity, accumulation in month term
Emission Report by Sector Manage greenhouse gas emission categorized by plant (Monthly Trend)
Emission Report by Team Manage team emission categorized by team, and comparison to previous month data (Monthly Report)
Company wise emission report Report fuel usage and emission categorized by plant and equipment

EMS : Energy Network Optimization q Displays the result of energy network operating cost optimization q Report Optimum Operating Cost q Optimization can be interfaced to DCS
22

Typical System Configuration
23
Web based Energy Monitoring & Management: - Field Data, Balance and Optimization
Optional: Energy Intensity Analysis
ENetOPT server o ENetOPT o Web - based energy map
IPOES Server o IPOES 3 . 0 o Executable SOP
DCS
Infotrol DA ( OPC , PHD Interface ) Infotrol DA
( OPC , PHD Interface ) 서버 WorkStation
IPOES Design PC
Energy monitoring station
• One license for server - Used to plant-wide on-line
energy optimization system • Two license for PC
- Used normally for design, simulation and off-line optimization

Issues and direction
q Steam mass balance l For mass (steam/condensate) imbalance, it is not so sure whether it is caused by measurement
error, or any loss, or tracing and/or tracking, etc. l Unmeasured value is estimated, but the balanced value for the estimated value is changed
significantly according to the operational condition. l Gross error detection is very difficult since in most cases, measurement redundancy is not so
sufficient à Input data analysis for erroneous measurement à Gross error detection with logical analysis, statistical approach, and any neural and artificial
approach
q Optimization l It is necessary to include the planning functionality for On/Off and swing operation and minimum
operating and standby times of the equipment l It is frequently asked to show the bottleneck constraint à Integrate utility planning and optimization à Search for active constraints
24
q ENetOPT

Issues for the site application
25
q Energy Intensity l Root cause for energy intensity change of the plant is asked from clients l It is necessary to compare the utility diagram and Process diagram à Statistical approach
q Equipment performance l User asked what is the main reason for the performance depreciation à Logical analysis for possible reason
q Steam price l It is necessary to calculate the steam price for each unit in real time à Real time estimation of steam value
q EMS

EMS : Energy Intensity Analysis
26
q Analyze the cause of plant energy intensity increase q Reduced dimensional analysis by statistics
Real Time Reduced Dimensional Analysis
Hotelling T2 95% confidence limit

EMS : Energy Equipment Efficiency Monitoring and Analysis q Main Energy Equipment Efficiency Calculation q Main Energy Equipment Efficiency Monitoring q Analyze Abnormal Operation Cause
27
Abnormal Operation Monitoring
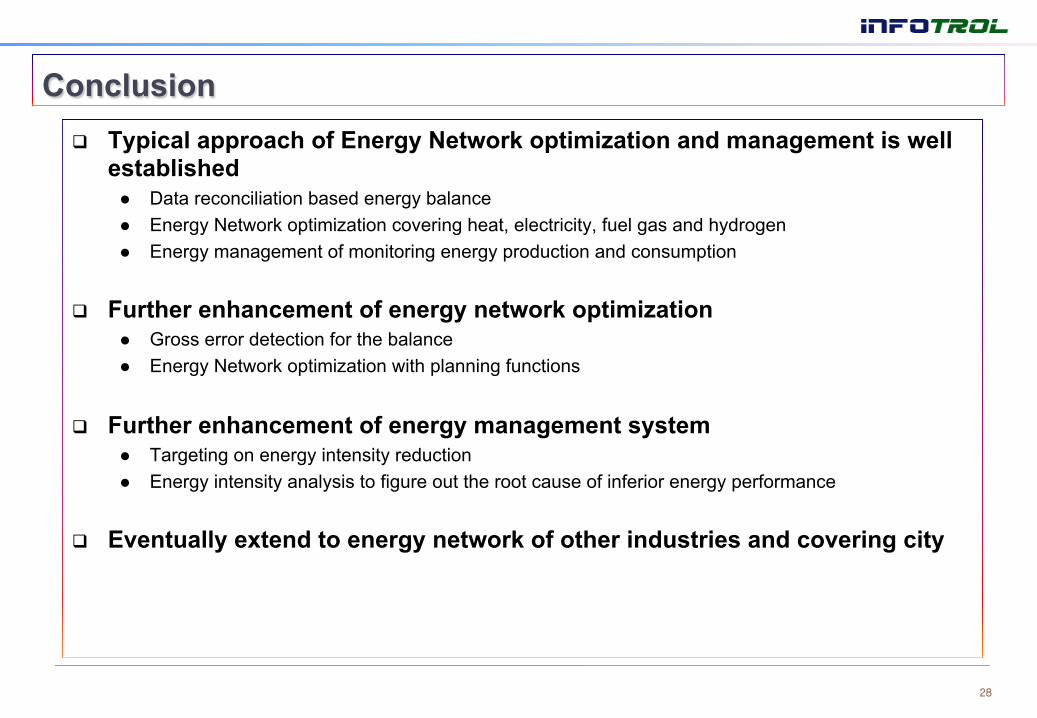
Conclusion q Typical approach of Energy Network optimization and management is well
established l Data reconciliation based energy balance l Energy Network optimization covering heat, electricity, fuel gas and hydrogen l Energy management of monitoring energy production and consumption
q Further enhancement of energy network optimization l Gross error detection for the balance l Energy Network optimization with planning functions
q Further enhancement of energy management system l Targeting on energy intensity reduction l Energy intensity analysis to figure out the root cause of inferior energy performance
q Eventually extend to energy network of other industries and covering city
28
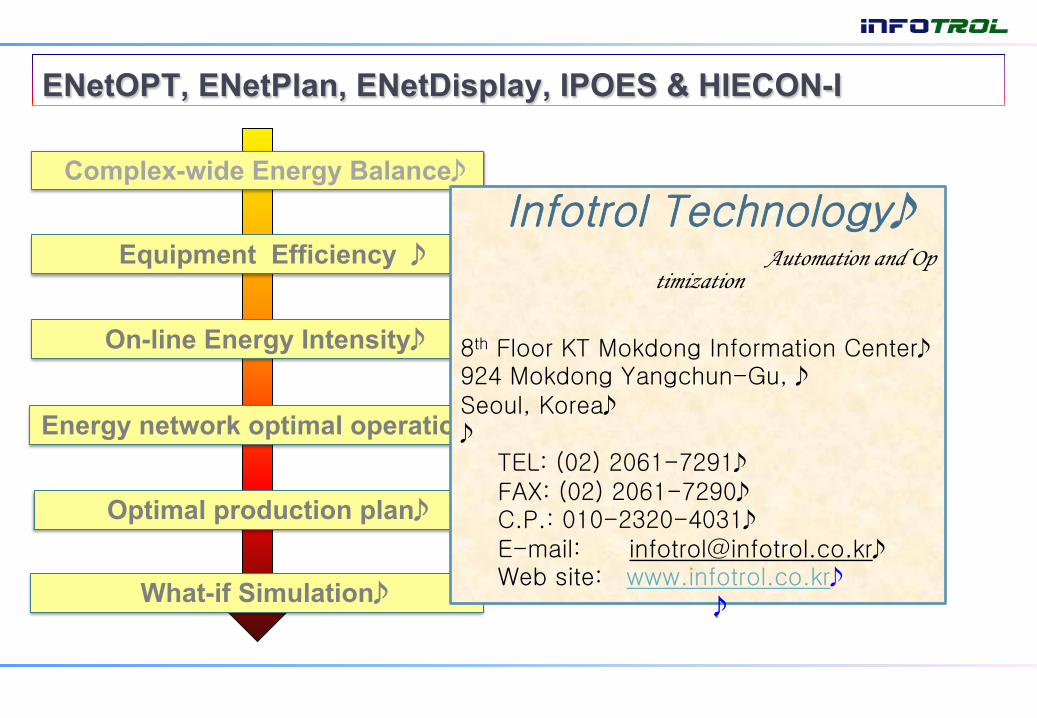
ENetOPT, ENetPlan, ENetDisplay, IPOES & HIECON-I
Complex-wide Energy Balance
Equipment Efficiency
On-line Energy Intensity
Energy network optimal operation
Optimal production plan
What-if Simulation
Infotrol Technology Automation and Op
timization
8th Floor KT Mokdong Information Center 924 Mokdong Yangchun-Gu, Seoul, Korea
TEL: (02) 2061-7291 FAX: (02) 2061-7290 C.P.: 010-2320-4031 E-mail: [email protected] Web site: www.infotrol.co.kr