it org design & staffing assessment...
TRANSCRIPT

Stark Industries, Inc. 108 Respondents
Created On: 2016-12-12
IT Org. Design &Staffing Assessment

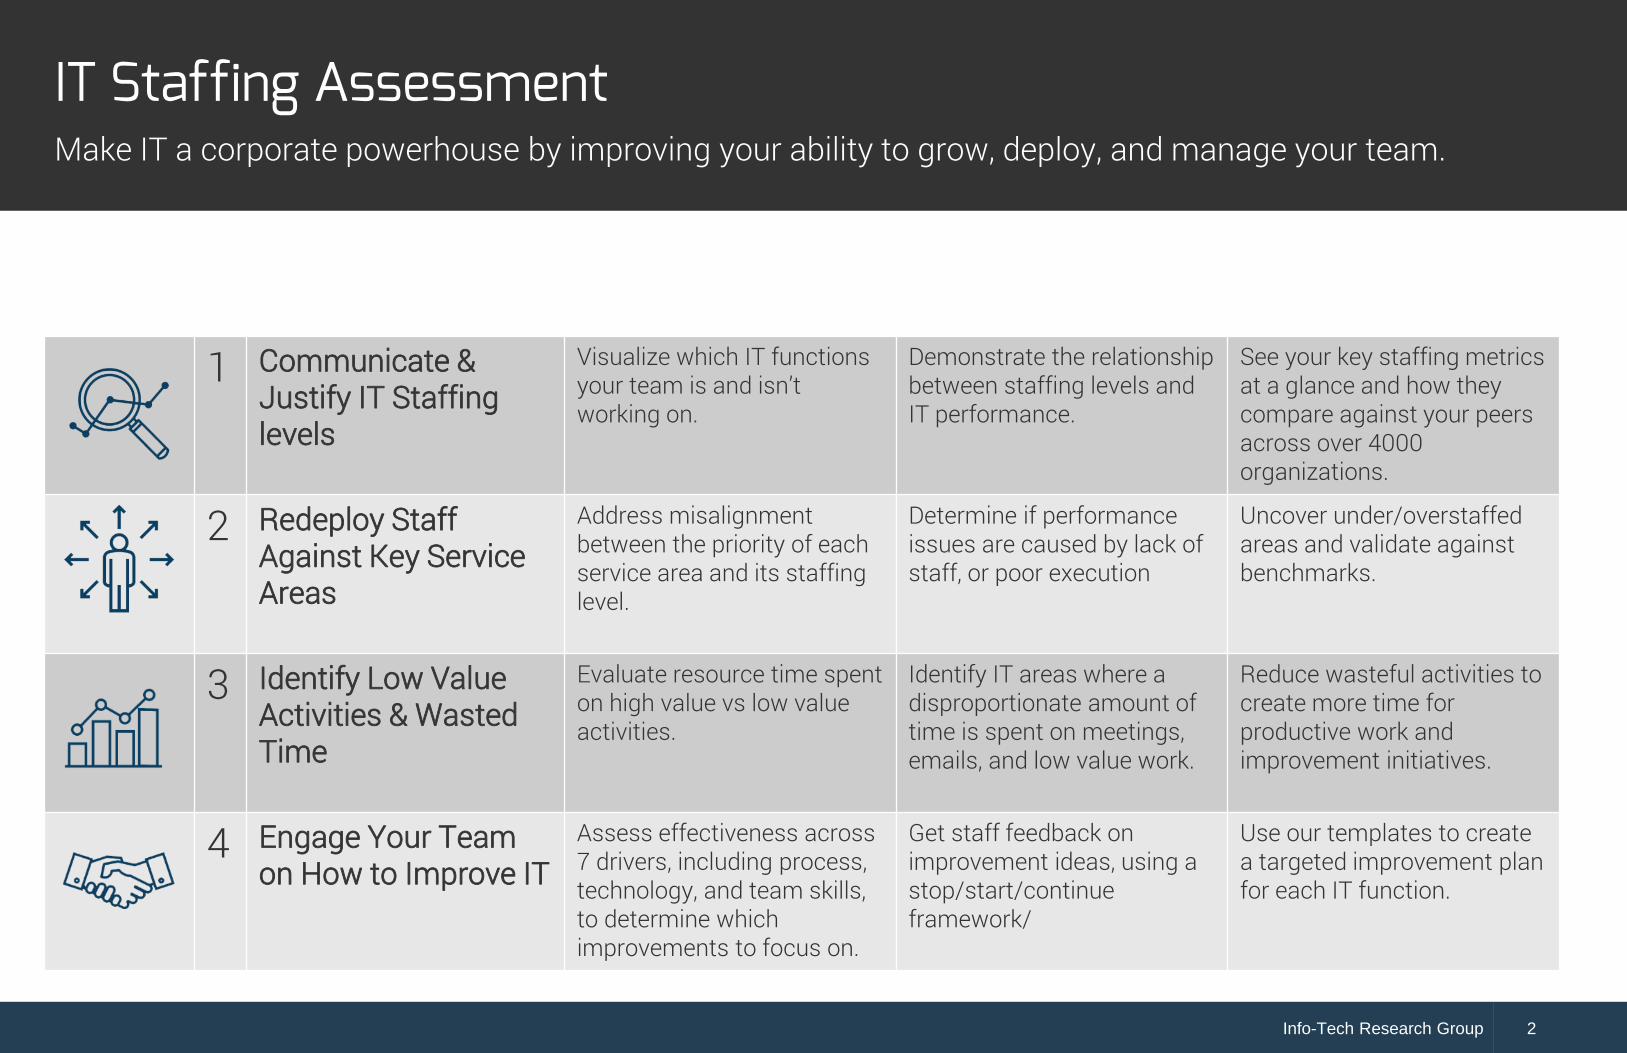
IT Staffing AssessmentIT Staffing AssessmentMake IT a corporate powerhouse by improving your ability to grow, deploy, and manage your team.
Communicate & Justify IT’s HeadcountDemonstrate the relationship between staffing levels and IT performance.
Reallocate Staff Against Key Service AreasAddress misalignment between the priority of each service area and its staffing level.
Identify Low Value Activities & Wasted TimeEvaluate where time can be reclaimed from administrative activities and time sinks.
Engage Your Team on How to Improve ITManage teams better by gathering feedback about how your staff want to be managed across the 7 drivers of effective teams.
Info-Tech Research Group 2Info-Tech Research Group 2
1 Communicate & Justify IT Staffing levels
Visualize which IT functions your team is and isn’t working on.
Demonstrate the relationship between staffing levels and IT performance.
See your key staffing metrics at a glance and how they compare against your peers across over 4000 organizations.
2 Redeploy StaffAgainst Key Service Areas
Address misalignmentbetween the priority of each service area and its staffing level.
Determine if performance issues are caused by lack of staff, or poor execution
Uncover under/overstaffed areas and validate against benchmarks.
3 Identify Low Value Activities & Wasted Time
Evaluate resource time spent on high value vs low value activities.
Identify IT areas where a disproportionate amount of time is spent on meetings, emails, and low value work.
Reduce wasteful activities to create more time for productive work and improvement initiatives.
4 Engage Your Team on How to Improve IT
Assess effectiveness across 7 drivers, including process, technology, and team skills, to determine which improvements to focus on.
Get staff feedback on improvement ideas, using a stop/start/continue framework/
Use our templates to create a targeted improvement plan for each IT function.
IT Staffing AssessmentMake IT a corporate powerhouse by improving your ability to grow, deploy, and manage your team.

Stark Industries, Inc.
Table of ContentsStaffing Overview 3
Time Allocation by Function 4
Staffing vs. Effectiveness 5
Staff Allocation Worksheet 6
Time Allocation by Activity 7
Time Allocation by Function & People 8
Function Effectiveness 9
Top Team Suggestions 10
Department Forecast Exercise 15
Function Scorecards 18
How to Use this ScorecardThe IT Org. Design & Staffing is designed to help you understand, assess and improve key IT staffingand organizational design issues. Instructions on each page will help you understand the data andwhat you can do with it.
Once you have consumed the report yourself, Info-Tech recommends the following discretionary steps:
1. Share Results with Your IT TeamsWalk through this report with your team. Cover overall results and key areas, encouraging them to review the full report ifinterested. Beyond understanding the data, communicating the importance of measuring and improving business satisfactionwith IT is critical.
2. Communicate Results and Planned Action with Business LeadersShare this report with executives or the management stakeholder (group) ultimately concerned with the effective use oforganization data. Highlight key issue areas, proposed solutions, and get direction on goals and issues to address.
3. Determine Key IT Functions and Effectiveness Drivers to TargetUsing the data, management preferences, and input from your team, determine where to focus improvement efforts.
4. Execute Targeted IT Improvements and Staff ReallocationsPull together improvement initiatives from your team, executives, and stakeholders. Create plans for undertaking them and haveyour team begin to execute them.
5. Repeat this Program as NeededComplete this program annually or as desired to measure and communicate improvement, as well as receive ongoing feedback.
IT Org. Design & Staffing Assessment / Stark Industries, Inc.

IT Org. Design & Staffing Assessment / Stark Industries, Inc.
IT DEPARTMENTStaffing OverviewSee your Key Staffing Metrics at a glance and how they compare against your peers.
Use this data to determine whether you are in line with benchmarks and if/how to course-correct.
Peer benchmarks are based on data from over 4,000 participating organizations so we canprovide meaningful results relevant to your organization.
The left column focuses on high level staff and budget ratios to provide visibility as well asan assessment of appropriateness based on benchmarking data.
The right column focuses on IT’s management structure, including span of control,seniority ratios and experience ratios. Use these to determine if more managers orexperienced hires are appropriate.
The following data represents a summary of your IT staffing situation as compared with theInfo-Tech benchmark. See if you’re over or underperforming the benchmark. Your data is basedon direct question answers by the survey administrator as well as averaging individualresponses from your IT staff.
Stark Industries, Inc. IT Department
Total IT Budget as % of Revenue IT Staff as % of Supported Users
0.6%IndustryMedian
1.6%
1.0%Under
1.4%IndustryMedian
2.1%
0.7%Under
Total # of IT EmployeesIT Managers/Leaders# of FTE Focused on Strategy
1663863
Company RevenueIT Budget
$8,200,000,000$50,000,000
# Users SupportedAverage Experience
12,00015.6 Years
IT Salary as % of Operating Budget % of IT Outsourced
N/A%IndustryMedian
40%
--.-%Under
25%IndustryMedian
10%
15%Over
Span of ControlResearch suggests 4-7 direct reports is the optimal number for any manager. More than 7 isdifficult to adequately manage while less than 4 may be inefficient. Use this data to determine ifthere are opportunities to reorganize management relationships.
DIRECT REPORTS # % INDUSTRYBENCHMARK
0 Direct Reports 79 68% --
1-3 Direct Reports 24 21% --
4-7 Direct Reports 14 12% --
8-10 Direct Reports 0 0% --
11+ Direct Reports 0 0% --
Seniority of IT StaffIT departments can suffer both from being too top-heavy and too bottom-heavy. Determine ifyour seniority profile is in line with your peers and appropriate for your organization, or if thereare opportunities to make staffing changes.
SENIORITY # % INDUSTRYBENCHMARK Gap
C-Level 1 1%
VP 5 5%
Director 5 5%
13% 3% Under
Manager 22 20% 19% 1% Over
Front-Line 75 69% 67% 2% Over
Years of IT ExperienceSuccessful IT departments have employees with a range of experience. Determine if yourdepartment could benefit from adding senior or junior employees.
YEARS # % INDUSTRYBENCHMARK Gap
0-2 Years 11 10% 8% 2% Over
2-5 Years 7 6% 17% 11% Under
6-10 Years 12 11% 29% 18% Under
10+ Years 78 72% 47% 25% Over
IT Management Profile
23%IT Managers as %of IT Staff
IndustryMedian
24%
1%Under
3
Industry Benchmark: Large Manufacturing Companies (Revenue >$1B)n = 56

IT Staff Allocation
AREA # OFSTAFF
% OFTOTAL
OVERALLBENCHMARK BENCHMARK
Applications 34.5 32% -- --
Application Maintenance 21.2 20% -- --
Customer-Facing Technology 8.4 7% -- --
Application Development 4.5 4% -- --
DevOps 0.4 1% -- --
Infrastructure and Operations 32.5 29% -- --
Service Desk 13.2 12% -- --
Network & Telephony Infrastructure 7.6 7% -- --
Device Management 8.1 7% -- --
Servers, Storage & Data Center Ops 3.6 3% -- --
Projects & PPM 12.7 12% -- --
Project Management 7.1 7% -- --
Requirements 5.6 5% -- --
Data & BI 8.8 8% -- --
Business Reports 4.8 4% -- --
Data Management 4.0 4% -- --
Financial Management 6.3 6% -- --
IT Finance & Admin 3.9 4% -- --
Vendor Management 2.4 2% -- --
Strategy & Governance 6.1 6% -- --
IT Governance & Strategy 4.2 4% -- --
Innovation 1.9 2% -- --
People & Resources 4.4 4% -- --
Talent Management 3.1 3% -- --
IT Org Design & Culture 1.3 1% -- --
Security & Risk 1.7 2% -- --
Security 1.7 2% -- --
Service & Architecture 1.0 1% -- --
IT Architecture 1.0 1% -- --
24% Of IT Staff Contribute Directly to Project &Development Capacity
IT TimeAllocation
by FunctionIT is responsible for providing many different business services.
Explore how each area is staffed and whether the staffing make-upis appropriate given business priorities. Look for areas seemingly
over- or under-staffed and validate with the benchmark.
20%
7%4%
1%
12%
7%
7%
3%
7%
5%4%4%
4%
2%
4%
2%
3%
1%
2%
1%
IT Org. Design & Staffing Assessment / Stark Industries, Inc.
OrganizationChart
IT Org. Design &Staffing Assessment
StaffingOverview
Time Allocationby Function
Time AllocationBy Function & People
TeamEngagement
Key Drivers Function Effectiveness
Staff AllocationWorksheet
Top Team SuggestionsTo Improve IT
Time AllocationBy Activity Type
Staffing Levelsvs. Effectiveness
ScorecardResults
Time AllocationAppendix
DepartmentalForecast Exercise 4

Staffing Levels Compared to EffectivenessMake sure your critical IT areas are effective and sufficiently staffed. Explore staffing andeffectiveness by area. Consider redeploying staff from high satisfaction areas to thosewith lower satisfaction if they are important to the business.
TeamScore
IT DeptScore
Business Score& Importance
IT Governance& Strategy 4.2 67 70 -- | --
IT Finance &Admin 3.9 69 70 -- | --
TalentManagement 3.2 65 67 -- | --
VendorManagement 2.4 59 62 -- | --
Innovation 1.8 58 67 65 | 7th
IT Org Design& Culture 1.2 62 72 -- | --
IT Architecture 1 48 68 -- | --
Average 62 68 65
Strategy FTE Count TeamScore
IT DeptScore
Business Score& Importance
ApplicationMaintenance 21.2 74 66 72 | 4th
Customer-Facing
Technology8.3 70 72 62 | 8th
ProjectManagement 7.1 64 72 67 | 9th
Requirements 5.7 71 76 67 | 11th
BusinessReports 4.9 72 74 73 | 6th
ApplicationDevelopment 4.6 71 71 72 | 4th
DataManagement 4 67 72 78 | 3rd
DevOps 0.5 40 65 -- | --
Average 69 71 70
Applications FTE Count TeamScore
IT DeptScore
Business Score& Importance
Service Desk 13.2 77 75 78 | 2nd
DeviceManagement 8.1 74 71 80 | 5th
Network &Telephony
Infrastructure7.5 69 71 73 | 1st
Servers,Storage & Data
Center Ops3.5 64 72 -- | --
Security 1.7 59 66 76 | 10th
Average 71 71 77
Infrastructure FTE Count
IT FTE Count
Infrastructure: 34.0Applications: 56.3Strategy: 17.7
IT Org. Design & Staffing Assessment / Stark Industries, Inc.
OrganizationChart
IT Org. Design &Staffing Assessment
StaffingOverview
Time Allocationby Function
Time AllocationBy Function & People
TeamEngagement
Key Drivers Function Effectiveness
Staff AllocationWorksheet
Top Team SuggestionsTo Improve IT
Time AllocationBy Activity Type
Staffing Levelsvs. Effectiveness
ScorecardResults
Time AllocationAppendix
DepartmentalForecast Exercise 5
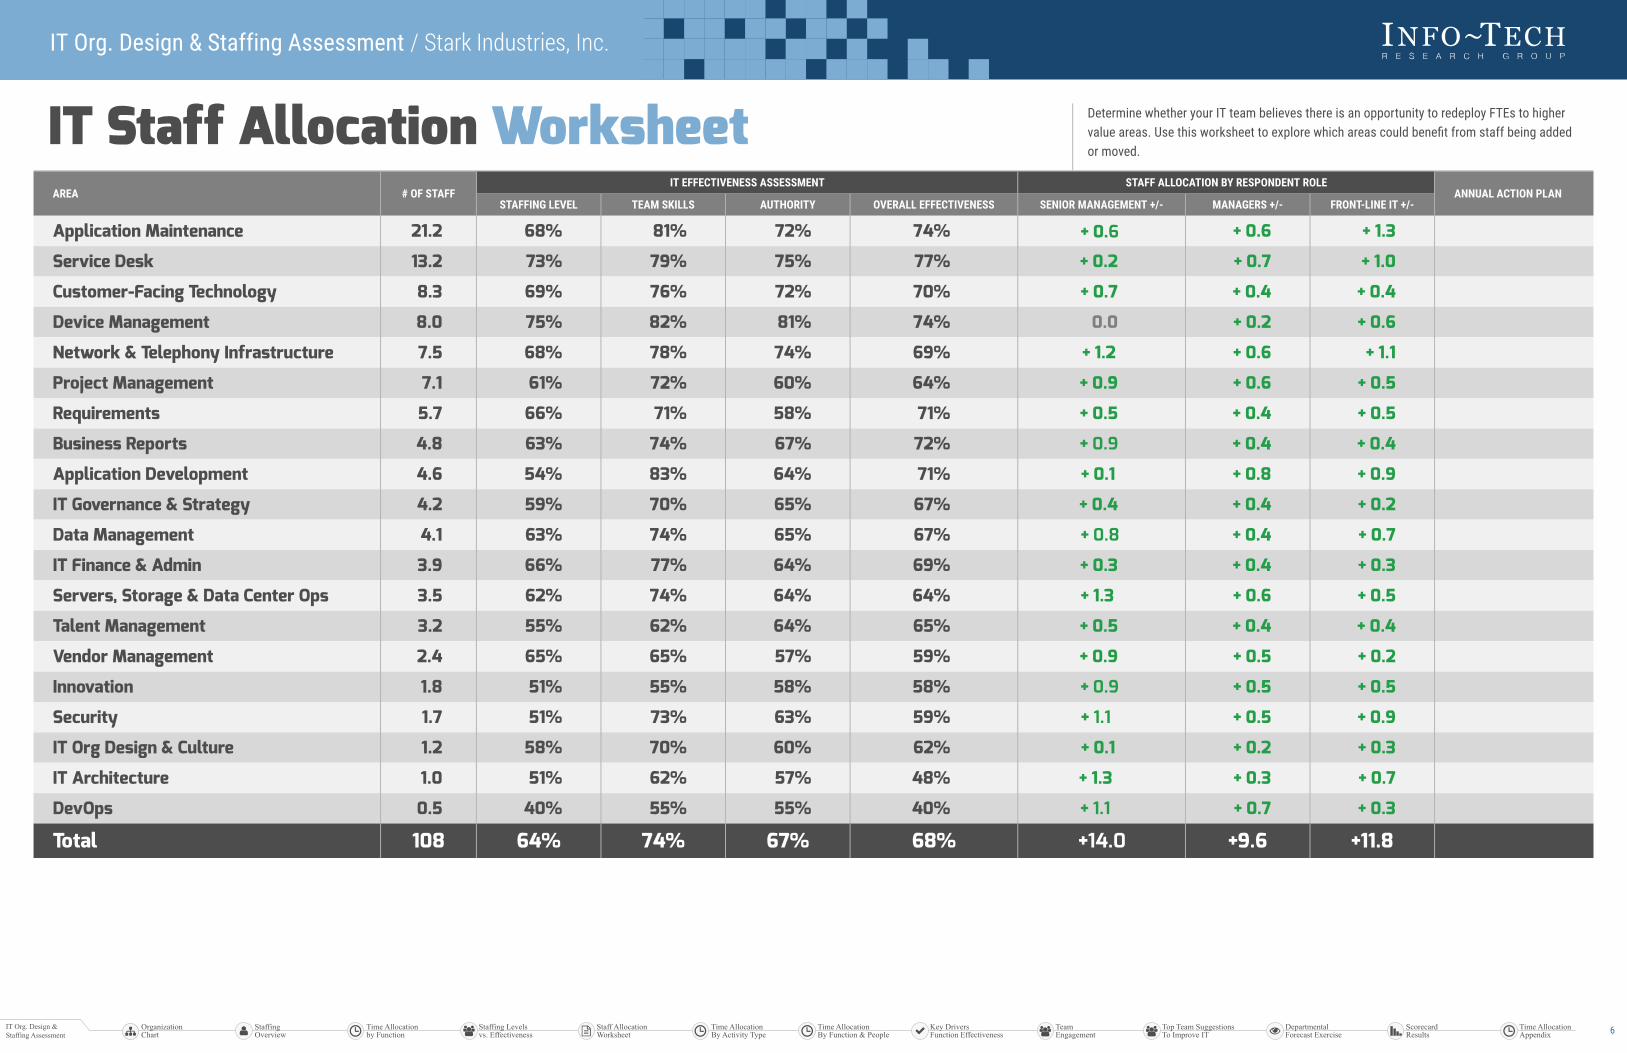
IT EFFECTIVENESS ASSESSMENT STAFF ALLOCATION BY RESPONDENT ROLEAREA # OF STAFF
STAFFING LEVEL TEAM SKILLS AUTHORITY OVERALL EFFECTIVENESS SENIOR MANAGEMENT +/- MANAGERS +/- FRONT-LINE IT +/-ANNUAL ACTION PLAN
Application Maintenance 21.2 68% 81% 72% 74% + 0.6 + 1.3
Service Desk 13.2 73% 79% 75% 77% + 0.2 + 0.7 + 1.0
Customer-Facing Technology 8.3 69% 76% 72% 70% + 0.7 + 0.4 + 0.4
Device Management 8.0 75% 82% 81% 74% 0.0 + 0.2 + 0.6
Network & Telephony Infrastructure 7.5 68% 78% 74% 69% + 1.2 + 0.6 + 1.1
Project Management 7.1 61% 72% 60% 64% + 0.9 + 0.6 + 0.5
Requirements 5.7 66% 71% 58% 71% + 0.5 + 0.4 + 0.5
Business Reports 4.8 63% 74% 67% 72% + 0.9 + 0.4 + 0.4
Application Development 4.6 54% 83% 64% 71% + 0.1 + 0.8 + 0.9
IT Governance & Strategy 4.2 59% 70% 65% 67% + 0.4 + 0.4 + 0.2
Data Management 4.1 63% 74% 65% 67% + 0.8 + 0.4 + 0.7
IT Finance & Admin 3.9 66% 77% 64% 69% + 0.3 + 0.4 + 0.3
Servers, Storage & Data Center Ops 3.5 62% 74% 64% 64% + 1.3 + 0.6 + 0.5
Talent Management 3.2 55% 62% 64% 65% + 0.5 + 0.4 + 0.4
Vendor Management 2.4 65% 65% 57% 59% + 0.9 + 0.5 + 0.2
Innovation 1.8 51% 55% 58% 58% + 0.9 + 0.5 + 0.5
Security 1.7 51% 73% 63% 59% + 1.1 + 0.5 + 0.9
IT Org Design & Culture 1.2 58% 70% 60% 62% + 0.1 + 0.2 + 0.3
IT Architecture 1.0 51% 62% 57% 48% + 1.3 + 0.3 + 0.7
DevOps 0.5 40% 55% 55% 40% + 1.1 + 0.7 + 0.3
Total 108 64% 74% 67% 68% +14.0 +9.6 +11.8
IT Staff Allocation Worksheet Determine whether your IT team believes there is an opportunity to redeploy FTEs to highervalue areas. Use this worksheet to explore which areas could benefit from staff being addedor moved.
IT Org. Design & Staffing Assessment / Stark Industries, Inc.
OrganizationChart
IT Org. Design &Staffing Assessment
StaffingOverview
Time Allocationby Function
Time AllocationBy Function & People
TeamEngagement
Key Drivers Function Effectiveness
Staff AllocationWorksheet
Top Team SuggestionsTo Improve IT
Time AllocationBy Activity Type
Staffing Levelsvs. Effectiveness
ScorecardResults
Time AllocationAppendix
DepartmentalForecast Exercise 6
+ 0.6
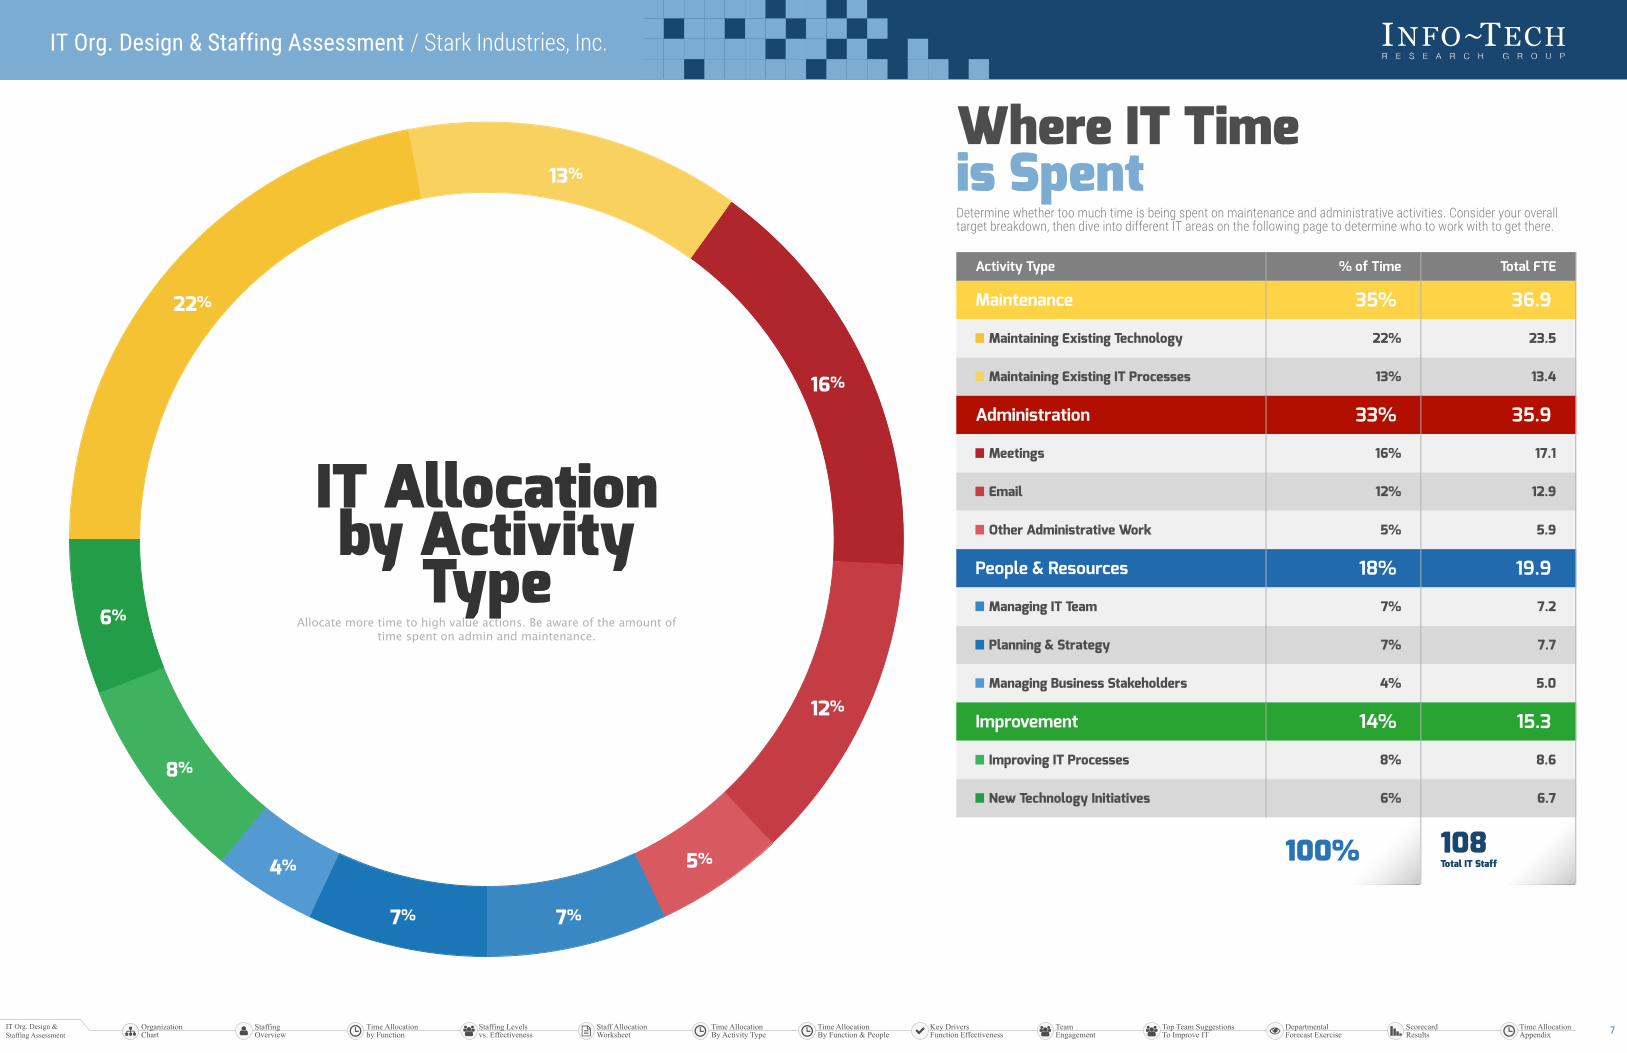
Where IT Timeis SpentDetermine whether too much time is being spent on maintenance and administrative activities. Consider your overalltarget breakdown, then dive into different IT areas on the following page to determine who to work with to get there.
Activity Type % of Time Total FTE
Maintenance 35% 36.9
Maintaining Existing Technology 22% 23.5
Maintaining Existing IT Processes 13% 13.4
Administration 33% 35.9
Meetings 16% 17.1
Email 12% 12.9
Other Administrative Work 5% 5.9
People & Resources 18% 19.9
Managing IT Team 7% 7.2
Planning & Strategy 7% 7.7
Managing Business Stakeholders 4% 5.0
Improvement 14% 15.3
Improving IT Processes 8% 8.6
New Technology Initiatives 6% 6.7
100% 108Total IT Staff
IT Allocationby Activity
TypeAllocate more time to high value actions. Be aware of the amount of
time spent on admin and maintenance.
22%
13%
16%
12%
5%
7%7%
4%
8%
6%
IT Org. Design & Staffing Assessment / Stark Industries, Inc.
OrganizationChart
IT Org. Design &Staffing Assessment
StaffingOverview
Time Allocationby Function
Time AllocationBy Function & People
TeamEngagement
Key Drivers Function Effectiveness
Staff AllocationWorksheet
Top Team SuggestionsTo Improve IT
Time AllocationBy Activity Type
Staffing Levelsvs. Effectiveness
ScorecardResults
Time AllocationAppendix
DepartmentalForecast Exercise 7

TimeAllocationby Function& PeopleThis page explores how time is spent across IT areasand individuals.
Each area is sorted descending by the amount of timespent on new initiatives.
Assess whether each area is spending an appropriateamount of time on each activity category and workwith individuals to determine how to change workassignments and mandates to optimize the balance.
Strategy &Governance
PEOPLE IMPROVE MANAGE MAINTAIN ADMIN
C-Level 15% 40% 5% 40%
Applications
PEOPLE IMPROVE MANAGE MAINTAIN ADMIN
VP 17% 54% 7% 22%
Director 20% 36% 19% 25%
Manager 12% 32% 16% 41%
Front-Line 13% 12% 43% 32%
Infrastructure andOperations
PEOPLE IMPROVE MANAGE MAINTAIN ADMIN
VP 12% 20% 29% 39%
Manager 25% 25% 16% 34%
Projects & PPM
PEOPLE IMPROVE MANAGE MAINTAIN ADMIN
VP 15% 40% 10% 35%
Manager 24% 24% 8% 45%
Data & BI
PEOPLE IMPROVE MANAGE MAINTAIN ADMIN
Front-Line 14% 0% 52% 35%
Security & Risk
PEOPLE IMPROVE MANAGE MAINTAIN ADMIN
Front-Line 25% 15% 30% 30%
Service &Architecture
No staff in area
PEOPLE IMPROVE MANAGE MAINTAIN ADMIN
-- -- -- --
FinancialManagement
No staff in area
PEOPLE IMPROVE MANAGE MAINTAIN ADMIN
-- -- -- --
Improvement 15%
People 40%
Maintenance 5%
Admin 40%
Improvement 14%
People 18%
Maintenance 36%
Admin 33%
Improvement 19%
People 23%
Maintenance 23%
Admin 37%
Improvement 22%
People 27%
Maintenance 8%
Admin 43%
Improvement 14%
People 0%
Maintenance 52%
Admin 35%
Improvement 25%
People 15%
Maintenance 30%
Admin 30%
IT Org. Design & Staffing Assessment / Stark Industries, Inc.
OrganizationChart
IT Org. Design &Staffing Assessment
StaffingOverview
Time Allocationby Function
Time AllocationBy Function & People
TeamEngagement
Key Drivers Function Effectiveness
Staff AllocationWorksheet
Top Team SuggestionsTo Improve IT
Time AllocationBy Activity Type
Staffing Levelsvs. Effectiveness
ScorecardResults
Time AllocationAppendix
DepartmentalForecast Exercise 8

Function EffectivenessKEY DRIVERSIT Staff have assessed each IT area across 7 drivers of effectiveness. Before diving into these for each IT area, assess how you are performingacross each at a high level. Determine if there are any low performing areas that can be improved across IT rather than in a single area.
For each satisfaction breakdown:“Satisfied” is the % of respondents who scored the area 8/10 or above. “Neutral” is the % of respondents who scored the area 7/10. “NotSatisfied” is the % of respondents who scored the area 6/10 or below. Each person represents 10% of respondents. If 2 people are shown under“Satisfied”, it means 20% of respondents scored the area 8/10 or higher.
Processes &ProceduresThe Processes & Procedures I workwith enable me to do my jobeffectively
DEGREE OF SATISFACTION
Not Satisfied
Neutral
Satisfied
AVERAGE SCORE
65%40% of staff rated it 8 or above
TechnologyThe Technology I work with enablesme to do my job effectively
DEGREE OF SATISFACTION
Not Satisfied
Neutral
Satisfied
AVERAGE SCORE
68%60% of staff rated it 8 or above
SkillsMy team has the right Skills toexecute effectively
DEGREE OF SATISFACTION
Not Satisfied
Neutral
Satisfied
AVERAGE SCORE
74%70% of staff ratedit 8 or above
Absence of Org.BarriersMy team is able to executeeffectively without organizationalor Political Barriers
DEGREE OF SATISFACTION
Not Satisfied
Neutral
Satisfied
AVERAGE SCORE
67%50% of staff rated it 8 or above
Staffing LevelMy team has the appropriateStaffing Level to executiveeffectively
DEGREE OF SATISFACTION
Not Satisfied
Neutral
Satisfied
AVERAGE SCORE
64%40% of staff rated it 8 or above
Opportunity toReduce WasteThere is an opportunity to run thisarea more efficiently throughEliminating Wasteful or low-valueactivities
OPPORTUNITY
Low
Medium
High
AVERAGE SCORE
59%30% of staff ratedit 8 or above
Opportunity toInnovateThere is an opportunity to run thisarea more effectively by usingInnovative approaches or solutions
OPPORTUNITY
Low
Medium
High
AVERAGE SCORE
70%50% of staff ratedit 8 or above
IT Org. Design & Staffing Assessment / Stark Industries, Inc.
OrganizationChart
IT Org. Design &Staffing Assessment
StaffingOverview
Time Allocationby Function
Time AllocationBy Function & People
TeamEngagement
Key Drivers Function Effectiveness
Staff AllocationWorksheet
Top Team SuggestionsTo Improve IT
Time AllocationBy Activity Type
Staffing Levelsvs. Effectiveness
ScorecardResults
Time AllocationAppendix
DepartmentalForecast Exercise 9

Top Team Suggestions to Improve IT IT staff have provided their top suggestion for improving the IT department. Read thesesuggestions carefully and look for trends within areas as well as across them. Do not feelcompelled to act on everything: identify a few key recurring issues to address and make surethis is communicated to the team.
StrategySTRATEGY & GOVERNANCE
Anthony StarkChief Information Officer
1. Improved managerial capabilities, driving upaccountability and ability to execute. 2. More clarity onbusiness value and objectives we are trying to support andthe IT strategy that would support them. 3. Bettercommunication.
ApplicationsAPPLICATIONS
Bruce BannerSenior Applications Developer
Communicate and collaborate more. Linda SimsApplications Support Analyst
Continue to improve on communication. Steve DavisSenior Technology Analyst
Rethink the support structure. Right now, the vast majorityof time I spend maintaining existing technology is becauseno know else can. Having an additional person would be agreat help.
Alex PhillipsIT Field Services Technician
We need more standardization. Too many people are doingtoo many things too many different ways.
Paul AllenService Desk Analyst I
Training opportunities for the Service Desk, not just inService Desk functions but also to expose Service Deskteam members to other areas of IT so they can see how itfunctions to better understand those areas in how theyintergrate with the Service Desk
John AndrewsDirector of Product Management
Meetings and meeting management: Many of our meetingshave very large groups - governance, in-flight projects, POSinitiatives. We should streamline some of these meetingswith stakeholders where possible. Meetings set up - Valuethe use of people's time - we have scarce resources. Makesure meetings purpose and agenda's are well thoughtthrough in advance of the meeting so that people can comeprepared. Meeting execution - take meeting minutes anddistribute after the meetings. Be forward leaning towardsaction in meetings - drive ownership and next steps so thatissues get resolved.
Tony LewisNetwork Administrator
It comes and goes, but there are periods where there areback to back meetings all day, this makes it hard toperform normal duties. To add to this when large issuesoccur in some cases it may take longer to call into abridge then it would to look into and resolve the issue.
David BowenIT Field Services Technician
Develop and maintain training and documentation. Hans GroverIT Business Analyst
Less micromanagement that leads to constant re-prioritization, re-scoping, pulling resources off for othernew prioritizes. Line level management should be managingstaff directly. More communication. Less reactive and andattempt to be proactive where possible
Dave CaplanService Desk Analyst I
When new companies are acquired, they should be broughtunder our IT umbrella instead of allowing them to keep thesoftware they've been using. If they have application A,
Carol LewisSr. Systems Engineer
Proper monitoring and reporting tools to effectivelyanswer questions regarding service outages or impactedevents
Clark KentIT Business Analyst
Understanding business direction and strategy. Knowingwhere we are today compared to where we want to be in the
IT Org. Design & Staffing Assessment / Stark Industries, Inc.
OrganizationChart
IT Org. Design &Staffing Assessment
StaffingOverview
Time Allocationby Function
Time AllocationBy Function & People
TeamEngagement
Key Drivers Function Effectiveness
Staff AllocationWorksheet
Top Team SuggestionsTo Improve IT
Time AllocationBy Activity Type
Staffing Levelsvs. Effectiveness
ScorecardResults
Time AllocationAppendix
DepartmentalForecast Exercise 10

APPLICATIONS
Lawrence PhilipsDirector of IT SI CRH
Prioritization is key Reduce number of meetings which willbe tough giving my role Spend more time with thebusiness
DATA & BI
Michael KarrApplications Developer
Getting the business to be more aligned across allcompanies in how they view and report their informationto limit the unique application and report requests.
PROJECTS & PPM
Gail KingIT Program Manager
More frequent functional area communication tounderstand the work being done across the organization;and the impact we have directly to the business.
Jerry MillsVP of Governance
Better alignment on the key things at which we want to beexcellent and allocating our time, energy and managementfocus accordingly
Jacques PaulIT Program Manager
It's a catch 22. We need meetings to collaborate and getwork done but at the same time, meetings take us awayfrom what we have to do. However, a reduction ofunnecessary meetings or meetings that don't produce thevalue needed, should be eliminated. Another suggestion isto either minimize approved work (taking place now withprioritization exercises) or increase IT project teams.
Bjorn NilssenSenior Manager, IT Governance
Continue to build and implement IT processes.
InfrastructureINFRASTRUCTURE ANDOPERATIONS
Kirk BlackIT Manager
Change the culture around meetings. As an organizationwe schedule too many meetings to the point that youcannot get your work completed on a daily basis. Peopleare also starting to schedule meetings during the 12 noonlunch our on a regular basis which is infringing on work lifebalance.
Tom HicksVP of Infrastructure and Operations
Focusing on doing fewer things better. Ensuring the rightstaffing levels vs managed services to ensure success ofefforts on which we're engaged. Having the right budgetlevels to effectively manage and grow the IT capabilities.
SECURITY & RISK
Julia DeanSecurity Operations Analyst
Communications between the teams/departments onactivities, needs, initiatives, goals, problems. Clearermapping of functional responsibilities & procedures to
IT Org. Design & Staffing Assessment / Stark Industries, Inc.
OrganizationChart
IT Org. Design &Staffing Assessment
StaffingOverview
Time Allocationby Function
Time AllocationBy Function & People
TeamEngagement
Key Drivers Function Effectiveness
Staff AllocationWorksheet
Top Team SuggestionsTo Improve IT
Time AllocationBy Activity Type
Staffing Levelsvs. Effectiveness
ScorecardResults
Time AllocationAppendix
DepartmentalForecast Exercise 13
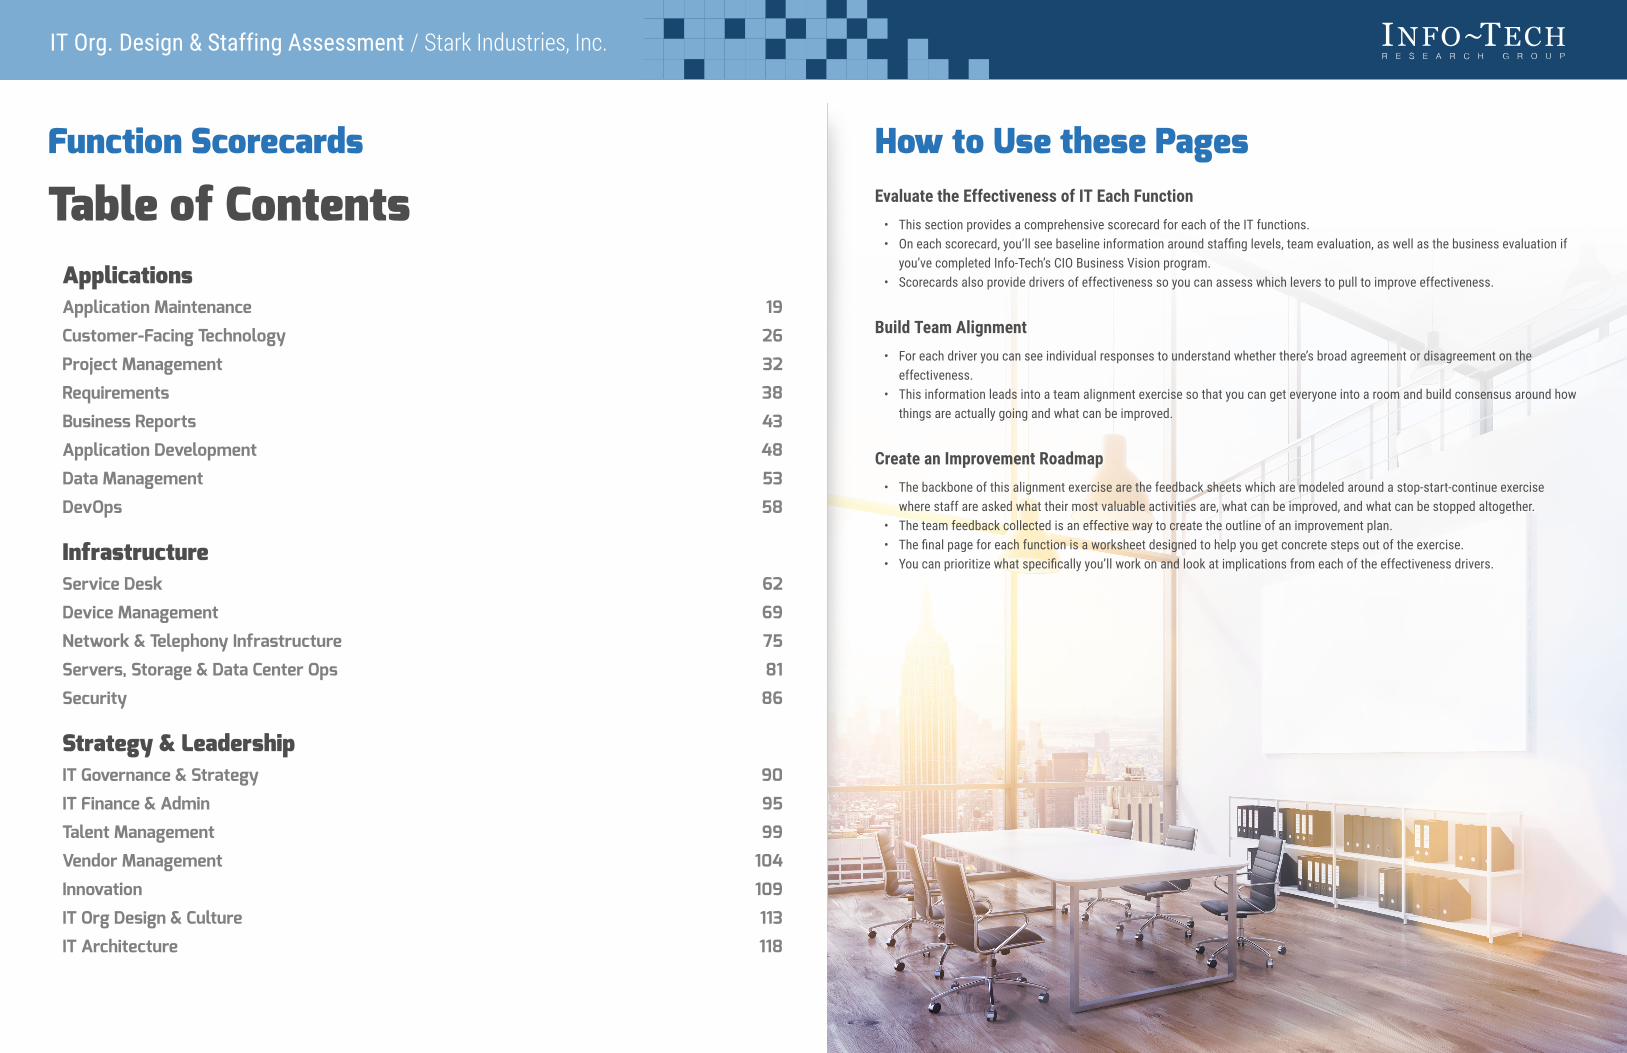
Function Scorecards
Table of ContentsApplicationsApplication Maintenance 19
Customer-Facing Technology 26
Project Management 32
Requirements 38
Business Reports 43
Application Development 48
Data Management 53
DevOps 58
InfrastructureService Desk 62
Device Management 69
Network & Telephony Infrastructure 75
Servers, Storage & Data Center Ops 81
Security 86
Strategy & LeadershipIT Governance & Strategy 90
IT Finance & Admin 95
Talent Management 99
Vendor Management 104
Innovation 109
IT Org Design & Culture 113
IT Architecture 118
How to Use these PagesEvaluate the Effectiveness of IT Each Function
• This section provides a comprehensive scorecard for each of the IT functions.• On each scorecard, you’ll see baseline information around staffing levels, team evaluation, as well as the business evaluation if
you’ve completed Info-Tech’s CIO Business Vision program.• Scorecards also provide drivers of effectiveness so you can assess which levers to pull to improve effectiveness.
Build Team Alignment
• For each driver you can see individual responses to understand whether there’s broad agreement or disagreement on theeffectiveness.
• This information leads into a team alignment exercise so that you can get everyone into a room and build consensus around howthings are actually going and what can be improved.
Create an Improvement Roadmap
• The backbone of this alignment exercise are the feedback sheets which are modeled around a stop-start-continue exercisewhere staff are asked what their most valuable activities are, what can be improved, and what can be stopped altogether.
• The team feedback collected is an effective way to create the outline of an improvement plan.• The final page for each function is a worksheet designed to help you get concrete steps out of the exercise.• You can prioritize what specifically you’ll work on and look at implications from each of the effectiveness drivers.
IT Org. Design & Staffing Assessment / Stark Industries, Inc.

Project ManagementFunction EffectivenessUse this Function Effectiveness Scorecard to evaluate IT staff perceptions of effectivenessacross 7 key drivers, as well as overall.
Compare the team’s own assessment with the rest of IT’s, as well as the business’s (if applicable).This scorecard can be used as part of an alignment exercise to better understand team concerns.
“Satisfied” is the % of respondents who scored the area 8/10 or above. “Neutral” is the % ofrespondents who scored the area 7/10. “Not Satisfied” is the % of respondents who scored thearea 6/10 or below. Each person represents 10% of respondents. If 2 people are shown under“Satisfied”, it means 20% of respondents scored the area 8/10 or higher.
Department Evaluation %55%
74%
Overall Team Effectiveness Business EvaluationProjects
7.1#FTE
7%% OF TOTALSTAFF
0%HAVEDEDICATEDFOCUS
Senior ITManagement
Other IT Staff
64% 54%
18%
29%64%SATISFACTION
9thIMPORTANCE
NAME %
Jeremy Patrick 90%
Mark Mendez 80%
Lane Pryce 80%
Pierce Morgan 30%
Jagadeesh Shamash 30%
Sara Schneider 10%
Processes &Procedures 59%
The Processes & Procedures I work withenable me to do my job effectively
Not Satisfied
Neutral
Satisfied
NAME %
Jeremy Patrick 100%
Bob Soderberg 90%
Mark Mendez 80%
Pierce Morgan 30%
Jagadeesh Shamash 30%
Sara Schneider 30%
Technology 63%
The Technology I work with enables meto do my job effectively
Not Satisfied
Neutral
Satisfied
NAME %
Hans Grover 100%
Jeremy Patrick 100%
Jacques Paul 100%
Travis Barker 50%
Scott Cooper 40%
Sara Schneider 30%
Skills 72%
My team has the right Skills to executeeffectively
Not Satisfied
Neutral
Satisfied
NAME %
James Butler 100%
Kim Jennings 90%
Mark Mendez 80%
Kristina Kash 30%
Hans Grover 10%
Sara Schneider 10%
Absence ofOrg. Barriers 60%
My team is able to execute effectivelywithout organizational or PoliticalBarriers
Not Satisfied
Neutral
Satisfied
NAME %
Jeremy Patrick 90%
Kim Jennings 80%
Gail King 80%
Hans Grover 30%
Sara Schneider 30%
Sean Ellis 30%
Staffing Level 61%
My team has the appropriate StaffingLevel to executive effectively
Not Satisfied
Neutral
Satisfied
NAME %
Hans Grover 100%
Jason Forbes 100%
Sara Schneider 90%
Jeremy Patrick 40%
Gail King 20%
Bob Soderberg 20%
Opportunityto ReduceWaste
65%
There is an opportunity to run this areamore efficiently through EliminatingWasteful or low-value activities
Low
Medium
High
NAME %
Julia Dean 100%
Jacques Paul 90%
Sara Schneider 90%
Kim Jennings 50%
Bob Soderberg 50%
Jeremy Patrick 40%
Opportunityto Innovate 71%
There is an opportunity to run this areamore effectively by using Innovativeapproaches or solutions
Low
Medium
High
IT Org. Design & Staffing Assessment / Stark Industries, Inc.
OrganizationChart
IT Org. Design &Staffing Assessment
StaffingOverview
Time Allocationby Function
Time AllocationBy Function & People
TeamEngagement
Key Drivers Function Effectiveness
Staff AllocationWorksheet
Top Team SuggestionsTo Improve IT
Time AllocationBy Activity Type
Staffing Levelsvs. Effectiveness
ScorecardResults
Time AllocationAppendix
DepartmentalForecast Exercise 32

Project Management Feedback IT staff in this area have provided their feedback on how to improve management of this areathrough Stop/Start/Continue suggestions. The right column also contains feedback fromoutside this area. Use this information to run a team feedback session or for improvementideas.
MOST VALUABLE ACTIONS(CONTINUE)
Jerry Mills
Ensuring the delivery of predictable value to the businessby providing accurate, timely and complete information (toboth IT and our customers) regarding the status of workitems
Kim Leeds Oversight of my team's projects and enhancements. Lawrence PhilipsPrioritize over 60 IT projects as well as putting together ateam of PM's and BA's to assist with the execution of theseprojects
Scott Cooper The BI Projects Tom TompkinsUnderstanding the process and developing the skills toimplement project management within our tools. Pierce Morgan
Any project related to RM performance improvementinitiatives
Gail King
Managing project(s) that seeks input from all projectstakeholders (IT and the business) to build confidence asa working team to meet the expected timelines, and delivera solid solution that supports the overall objective.
Jacques PaulAt this moment in time, it is being the Program Manager for POS. Also act as Portfolio Manager for SI and BTPC faciitator.
Bob SoderbergTeam Morale, CMMS, Infield, CMMS Mobile, Infield Mobile,Middleware, JCP, SIMS, ESB, Integrations
Travis Barker
Working within the organization to make sure smallprojects follow standards that are in place even if notdocumented. Work to get WIFs input when needed if aproject reaches that level. Help my team coach userstowards solutions that don't require special needs.Replicate solutions from company to company.
Jagadeesh Shamash Project Delivery Hans Grover My team
Jason Forbes Data integration. Jeremy PatrickAll aspects of the project our valuable and important to asuccessful implementation. Julia Dean Managing Security Initiative projects
Sara SchneiderActing as a PM and try to set an example for PMprocesses and behaviors.
WHAT CAN BE IMPROVED?(START)
Jerry Mills
* tighter focus on project management basics - timelines,budget, milestones, accountability * better role/responsibility definition between PMs, BRMs and ProductManagers throughout SDLC * automation of portfolio/program/project management communication vehicles(eg, Portfolio View, Program Views, etc) * increasedusability of portfolio/program/project management datathrough the use of visualization tools (eg, Tableau) *better standardization of project management withinClarizen
Kim Leeds
The speed with which project information can becompiled, pushed through governance and executed is anarea where we can improve. (Should be noted that nowthat the project slides can be generated directly fromClarizen, that this is a great improvement!) Need toestablish an alternate process for "fast tracked" or"critical" projects that inevitably come up from thebusiness. And finally, we definitely need an active pipelinefor demand management (which I know is coming.) Last,we need to get the committed dates out into Clarizen asapso we know what timeframe we are working towards.
Erik Dunlop Increase standardization and methodology
Lawrence PhilipsThe recently implemented governance process if effectivebut need more work and an extra effort need to made tothe local business to have them understand the process.
Scott CooperI think there is a lot that can be improved in this area butacknowledge that there is a lot of improvements already inmotion. The implementation of Clarizen should help but
Tom TompkinsThis is an area that is currently being developed andimproving. For me specifically having an IT PM would help.
IT Org. Design & Staffing Assessment / Stark Industries, Inc.
OrganizationChart
IT Org. Design &Staffing Assessment
StaffingOverview
Time Allocationby Function
Time AllocationBy Function & People
TeamEngagement
Key Drivers Function Effectiveness
Staff AllocationWorksheet
Top Team SuggestionsTo Improve IT
Time AllocationBy Activity Type
Staffing Levelsvs. Effectiveness
ScorecardResults
Time AllocationAppendix
DepartmentalForecast Exercise 33

WHAT CAN BE IMPROVED?(START)
presented to management are inaccurate. The timesheettasks are full of redundancies.
Julia Dean
Develop SOPs; Develop clear goals and specific plans;Improve communication between teams & departments;Improve the change process to facilitate implementingchanges; Provide tools for implementing projectcomponents; provide mechanisms for remediatingunderlying issues blocking progress;
Sara Schneider
Hire qualified, proven, FTE SI PMs who have skin in the game, can communicate effectively, and care about the organization. Determine a PM process, document the process, COMMUNICATE the process to all of SI, and hold PMs accountable for following it. Utilize a PM software that is understood, documented, and communicated to all of SI.
WHAT ACTIVITY CAN BESTOPPED?
Jerry Mills* duplication of project management data tracking inmultiple tools (eg, MS Project, MS Excel, Clarizen, etc) Kim Leeds
Including the business desired end date. I believe thiscauses a great deal of confusion with the businessthinking that the date they desire is the expectedcompletion date. Since this date really has no bearing onthe project timeline, I'd suggest it be removed all togetherto avoid the confusion. Regardless of when the business"desires" the project be completed, it is projectprioritization that needs to dictate when we can get to it.
Lawrence Philips Minimize the amount of meetings
Scott CooperAssigning PMs to projects that are either to high level andnot willing to understand the details or not able to. Gail King
I'm not aware of any specific items that need to bestopped. Jacques Paul Individual program update meetings.
Sean EllisIneffective meetings. Ensure that every meeting has apurpose and agenda. This will help minimize the timespent in meetings that don't produce the required result.
Hans Grover Micromanagment Jason ForbesThere needs to be better focus on taking care of thebusiness and less focus on making diagrams.
Sara SchneiderUtilizing contractors to create a the SI governance process.
FEEDBACK FROM OTHER IT STAFF
Tom HicksWe're improving our PM skillsets, but would like to seemore ownership with the PMs of the projects theirmanaging.
John Andrews
Our project management function is improving, but weneed our project managers to as gatekeepers of scope andcommitment and to become an extension of the decisionstaken through governance. I would like to see tightermanagement of the project deliverable, hands raised whenrequirements, scope, or success criteria is unclear andbetter status and communication coming from projectteams.
Casey JonesThe new POS projects I am working on have benefitedgreatly from our project management team.
Brian HossWith all of the initiatives currently going on there is a lot ofoverlapping responsibilities. Catelyn Gifford in very early stage Carol Lewis
This area has been improving specifically with regards tomeetings and communication
IT Org. Design & Staffing Assessment / Stark Industries, Inc.
OrganizationChart
IT Org. Design &Staffing Assessment
StaffingOverview
Time Allocationby Function
Time AllocationBy Function & People
TeamEngagement
Key Drivers Function Effectiveness
Staff AllocationWorksheet
Top Team SuggestionsTo Improve IT
Time AllocationBy Activity Type
Staffing Levelsvs. Effectiveness
ScorecardResults
Time AllocationAppendix
DepartmentalForecast Exercise 35

FEEDBACK FROM OTHER IT STAFF
David ProustWe suffer from inconsistent Project Management,although there has been an initiative to build out thiscompetency (people, processes)
David BowenI have always had a positive experience working with SI PMs. Charles Koch
PM doing do a pretty good job overall. For someenhancements we need PM's assigned to them but forsome reason they do not get assigned. Most likely I need topush for be assigned.
Michael Karr
From my experience, we have an opportunity to improveproject management. I get approached too often aboutassisting on a project that I have little to no information onand expected to work through with minimal notice. Toooften have I seen start dates and due dates be suppliedwithout vetting them with the IT lead and this is unfair tothat individual.
Amy Burke Normally manage by an assigned PM Paul Van DykeBased on the project that happened this past summer Iwould say that the support and guidance was great.
Alex PhillipsI've seen a few good projects get started and get delayedor fail long before hitting any REAL snags. Richard Miles
We are trying very hard to improve this and this score isvery premature to the changes that have recently been putinto place.
Robert RedThe current projects I work with periodically are wellorganized and run effectively.
Rohan Trenas
Like Tim, Dolores and most other members of the ELT,Gerry inherited a loosely-defined area in terms ofprocesses, procedures and organization. We have madestrides this year in improving this area through usage ofbetter tools and positioning the right people in the rightroles. In terms of overall PPM, we are still young, butmaturing nicely.
IT Org. Design & Staffing Assessment / Stark Industries, Inc.
OrganizationChart
IT Org. Design &Staffing Assessment
StaffingOverview
Time Allocationby Function
Time AllocationBy Function & People
TeamEngagement
Key Drivers Function Effectiveness
Staff AllocationWorksheet
Top Team SuggestionsTo Improve IT
Time AllocationBy Activity Type
Staffing Levelsvs. Effectiveness
ScorecardResults
Time AllocationAppendix
DepartmentalForecast Exercise 36

DEPARTMENTExerciseWhat activities can we start/stop/continue? What helps usimprove? What is implementedfrom data?
START 123
STOP 123
CONT. 123
ImplicationsProcess 59%
Tech 63%
Skills 72%
Authority 60%
Staffing 61%
Waste 65%
Innovation 71%
IT Org. Design & Staffing Assessment / Stark Industries, Inc.
OrganizationChart
IT Org. Design &Staffing Assessment
StaffingOverview
Time Allocationby Function
Time AllocationBy Function & People
TeamEngagement
Key Drivers Function Effectiveness
Staff AllocationWorksheet
Top Team SuggestionsTo Improve IT
Time AllocationBy Activity Type
Staffing Levelsvs. Effectiveness
ScorecardResults
Time AllocationAppendix
DepartmentalForecast Exercise 37
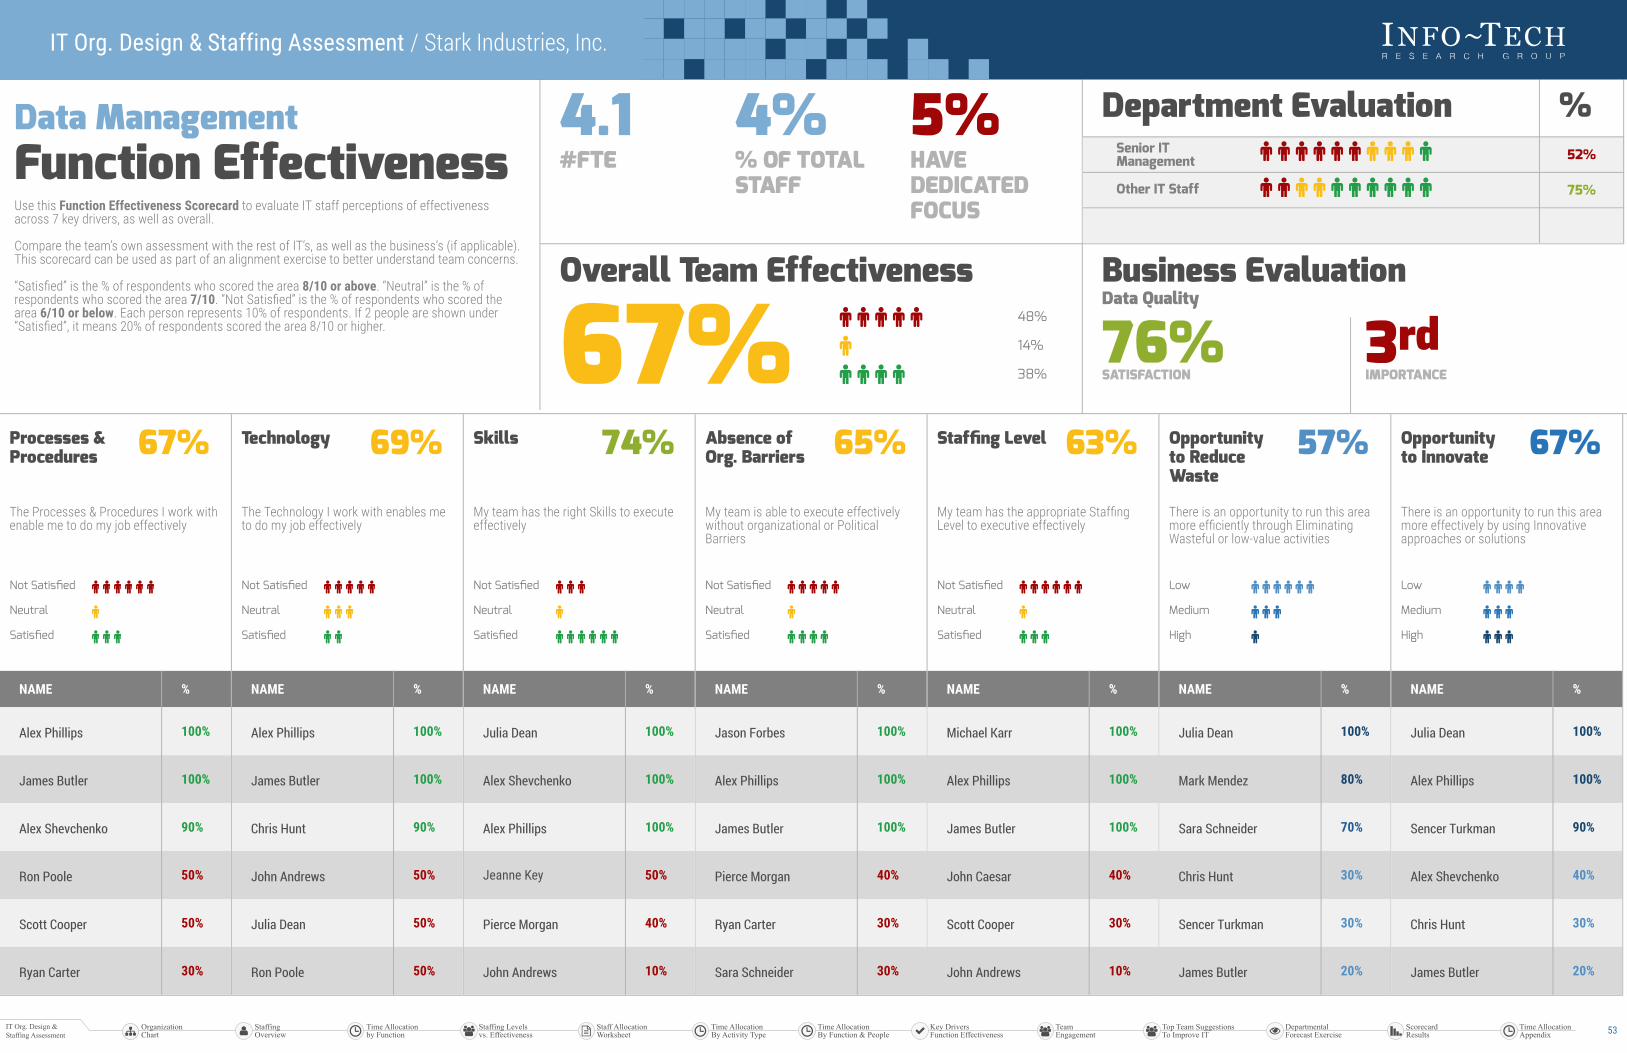
Data ManagementFunction EffectivenessUse this Function Effectiveness Scorecard to evaluate IT staff perceptions of effectivenessacross 7 key drivers, as well as overall.
Compare the team’s own assessment with the rest of IT’s, as well as the business’s (if applicable).This scorecard can be used as part of an alignment exercise to better understand team concerns.
“Satisfied” is the % of respondents who scored the area 8/10 or above. “Neutral” is the % ofrespondents who scored the area 7/10. “Not Satisfied” is the % of respondents who scored thearea 6/10 or below. Each person represents 10% of respondents. If 2 people are shown under“Satisfied”, it means 20% of respondents scored the area 8/10 or higher.
Department Evaluation %52%
75%
Overall Team Effectiveness Business EvaluationData Quality
4.1#FTE
4%% OF TOTALSTAFF
5%HAVEDEDICATEDFOCUS
Senior ITManagement
Other IT Staff
67% 48%
14%
38%76%SATISFACTION
3rdIMPORTANCE
NAME %
Alex Phillips 100%
James Butler 100%
Alex Shevchenko 90%
Ron Poole 50%
Scott Cooper 50%
Ryan Carter 30%
Processes &Procedures 67%
The Processes & Procedures I work withenable me to do my job effectively
Not Satisfied
Neutral
Satisfied
NAME %
Alex Phillips 100%
James Butler 100%
Chris Hunt 90%
John Andrews 50%
Julia Dean 50%
Ron Poole 50%
Technology 69%
The Technology I work with enables meto do my job effectively
Not Satisfied
Neutral
Satisfied
NAME %
Julia Dean 100%
Alex Shevchenko 100%
Alex Phillips 100%
Jeanne Key 50%
Pierce Morgan 40%
John Andrews 10%
Skills 74%
My team has the right Skills to executeeffectively
Not Satisfied
Neutral
Satisfied
NAME %
Jason Forbes 100%
Alex Phillips 100%
James Butler 100%
Pierce Morgan 40%
Ryan Carter 30%
Sara Schneider 30%
Absence ofOrg. Barriers 65%
My team is able to execute effectivelywithout organizational or PoliticalBarriers
Not Satisfied
Neutral
Satisfied
NAME %
Michael Karr 100%
Alex Phillips 100%
James Butler 100%
John Caesar 40%
Scott Cooper 30%
John Andrews 10%
Staffing Level 63%
My team has the appropriate StaffingLevel to executive effectively
Not Satisfied
Neutral
Satisfied
NAME %
Julia Dean 100%
Mark Mendez 80%
Sara Schneider 70%
Chris Hunt 30%
Sencer Turkman 30%
James Butler 20%
Opportunityto ReduceWaste
57%
There is an opportunity to run this areamore efficiently through EliminatingWasteful or low-value activities
Low
Medium
High
NAME %
Julia Dean 100%
Alex Phillips 100%
Sencer Turkman 90%
Alex Shevchenko 40%
Chris Hunt 30%
James Butler 20%
Opportunityto Innovate 67%
There is an opportunity to run this areamore effectively by using Innovativeapproaches or solutions
Low
Medium
High
IT Org. Design & Staffing Assessment / Stark Industries, Inc.
OrganizationChart
IT Org. Design &Staffing Assessment
StaffingOverview
Time Allocationby Function
Time AllocationBy Function & People
TeamEngagement
Key Drivers Function Effectiveness
Staff AllocationWorksheet
Top Team SuggestionsTo Improve IT
Time AllocationBy Activity Type
Staffing Levelsvs. Effectiveness
ScorecardResults
Time AllocationAppendix
DepartmentalForecast Exercise 53

Data Management Feedback IT staff in this area have provided their feedback on how to improve management of this areathrough Stop/Start/Continue suggestions. The right column also contains feedback fromoutside this area. Use this information to run a team feedback session or for improvementideas.
MOST VALUABLE ACTIONS(CONTINUE)
John AndrewsAligned with IT strategy and BSR, drive requirements forEnterprise systems to inform the Master DataManagement initiatives.
Scott Cooper The long term strategy for data managment Pierce MorganMaintenance of data and processes supporting RMinitiatives
Matt Hunter Database availability. Chris Hunt End users data. Jason ForbesI work with database objects like views, stored procs,packages, functions, triggers, etc.
Julia Dean Data protection Michael KarrBuilding reports based on the data management beingprovided. Alex Shevchenko Viewpoint
Alex Phillips file servers Sara SchneiderDocumentation. We have little documentation on currentstate. Steve Herman
Ensuring the backup's at each location that runs JWS areactually backing up.
Sencer TurkmanData integration among various application and businessintelligence platforms.
WHAT CAN BE IMPROVED?(START)
John Andrews
In Product Management, I am have Master Dataresponsibilities and will be working with the new BI teamto consult on what/how we will achieve their goals. I willalso be aligning with the BSR and IT Infrastructuredevelopment (ESB) to make sure Master Data is beingmanaged for POS, HRIS, ERP, Telematics, EAMS, etc... Thebiggest improvement woudl be in bringing in relative skillsets through the BSR who are SMEs on the technical sideof Master data management.
Scott CooperWe need to work closer to the business to achieve ashared goal. Choosing the right projects at the right timewith the right scope.
Matt Hunter
Alignment from leaders on future state and having a road-map on what that needs to look like. There are smallpockets of conversations happening all over the place butno overall real direction.
Chris HuntLet all users know that they have onedrive as a way tostore their important files. Charles Koch
Provide the monitoring tools we need, we have over 200SQL servers, but only 5 monitoring licenses. Jason Forbes
For clarification, I see this as Matt Cooper's database team.I am not a member of this team, but I work with themperiodically. They made a comment on how they wantedmore control of the Apex databases, but the businessseems to be reluctant to hand that role over to them. Matthas some incredible talent assembled on his team. Mypoint is that roles are not well defined despite the fact thatwe have a RACI model.
Julia Dean
Implement Enterprise level tools to categorize and managedata; provide privilege access monitoring and controls;Implement role based access; modify share and datapermissions;
Michael KarrMake use of newer technologies for better datamanagement. Alex Shevchenko Better coordination between different teams
IT Org. Design & Staffing Assessment / Stark Industries, Inc.
OrganizationChart
IT Org. Design &Staffing Assessment
StaffingOverview
Time Allocationby Function
Time AllocationBy Function & People
TeamEngagement
Key Drivers Function Effectiveness
Staff AllocationWorksheet
Top Team SuggestionsTo Improve IT
Time AllocationBy Activity Type
Staffing Levelsvs. Effectiveness
ScorecardResults
Time AllocationAppendix
DepartmentalForecast Exercise 54

WHAT CAN BE IMPROVED?(START)
Alex Phillips
IT has several options for data storage and backups butunless end users are trained on them then they are next toworthless. We need to have training sessions to explainthe risk of only saving files to your hard drive or come upwith solutions (like folder redirection) to manage datawithout leaving it up to the end user.
Ryan CarterBackup software is old technology. Getting business toprovide approval for life cycle of data retention. No changemanagement in place.
Sara Schneider
We are struggling to create an overall data managementstrategy that everyone can agree to. From an IT perspectivewe seem to be on the same page, from a businessperspective we are not. We have too many systems that arenot organized in a streamlined fashion, and it will take along road to get us to where we need to be.
Steve Herman Backup procedures on JWS machines Sencer Turkman
More time can be invested to properly plan, document andstandardize the solution development process. Also aplatform to share and document knowledge base could beimproved.
WHAT ACTIVITY CAN BESTOPPED?
John Andrews
We should be very deliberate in our approach of definingnew infrastructure and Master Data requirements and stopor slow down our rush to get these in to productionscenarios.
Scott CooperOver time it needs to be the duplication of effort indisplaying data and the storage of data. Matt Hunter
Jumping from fire to fire and every item being a high or toppriority. It feels like there is not enough time to focus onlarger projects and internal initiatives.
Chris Hunt Viruses Jason Forbes We need well defined roles. Julia DeanUniversal drive mapping; Eliminate the 'Everyone' access toshares & data; Critical servers being used for file storage.
Alex PhillipsUse of other 3rd party applications like Box. We alreadybought the tools, we need to use them. Sara Schneider
We spend a lot of time in meetings trying to get folks onthe same page. It is nice to have everyone's input but wemight be better off with a top down approach wheremanagement gets together and creates a imitative andthen everyone else know they have to fall in line tocomplete.
Sencer TurkmanRushing into decision without proper evaluation of therequirements or situation.
FEEDBACK FROM OTHER IT STAFF
Tom HicksWe could use a Mater Data Management strategy andeffectively control/organize the data we have available toIT.
Conrad AllenIt is getting to be a lot better than from a year ago and theplans to move to a central repository is a good move Jacques Paul We have a committed team of DBA's.
Bob Soderbergit is what it is...we all feel the pain...I think we are workingtowards the right solution of master data management. Sean Ellis
We need to ensure our solutions include controls thatmaximize the accuracy of our data. If you put junk it, youare only doing to get junk out.
Jacob Cohen
With the introduction of tableau the data we areaccumulating could be a gold mine. Again this is anotherarea where we are in our infancy cant wait to see where wecan take it.
Alain DucasseIf we are taking about backup and restoration of files andfolders regarding the file and print server we should havegood software for doing the backup like Tivoli.
Audrey Piazza Implement Google Drive Bruce Banner
I think the data management could be better but probablyabout as effective as it can be given the parameters thedata team operates under. We have no data retention poilcythat I am aware of and as such I believe the performance ofall of our applications and effectiveness of routinemaintenance activities suffers.
IT Org. Design & Staffing Assessment / Stark Industries, Inc.
OrganizationChart
IT Org. Design &Staffing Assessment
StaffingOverview
Time Allocationby Function
Time AllocationBy Function & People
TeamEngagement
Key Drivers Function Effectiveness
Staff AllocationWorksheet
Top Team SuggestionsTo Improve IT
Time AllocationBy Activity Type
Staffing Levelsvs. Effectiveness
ScorecardResults
Time AllocationAppendix
DepartmentalForecast Exercise 55
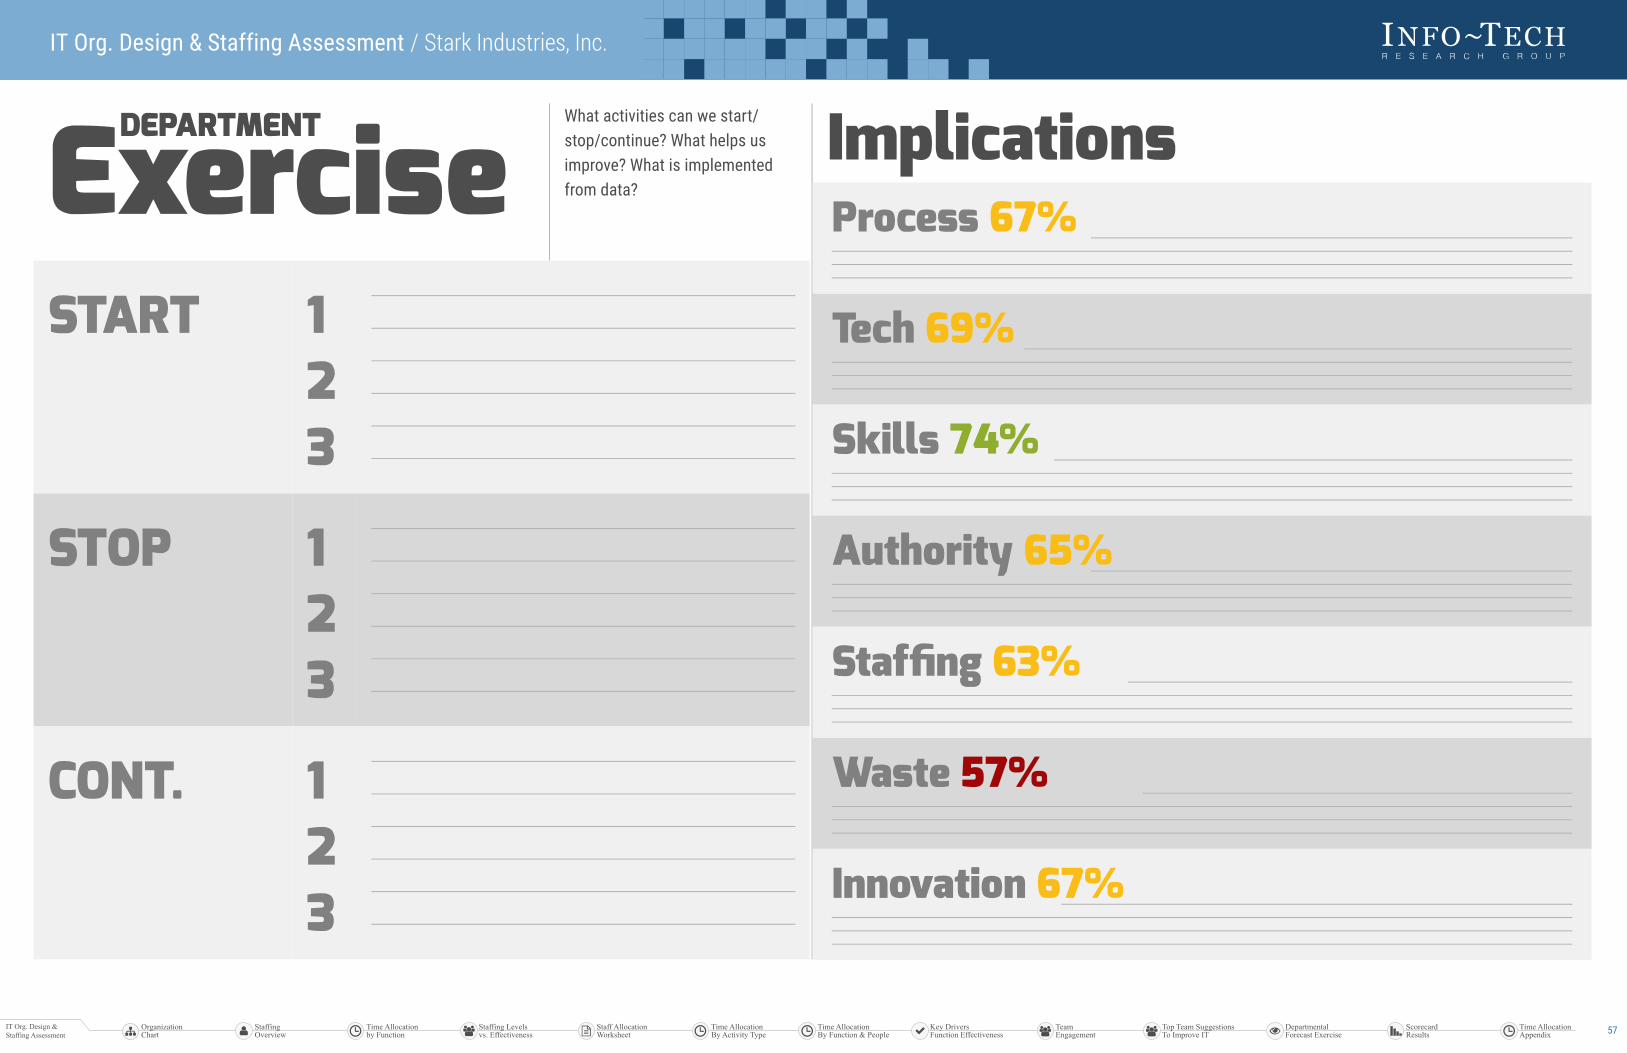
DEPARTMENTExerciseWhat activities can we start/stop/continue? What helps usimprove? What is implementedfrom data?
START 123
STOP 123
CONT. 123
ImplicationsProcess 67%
Tech 69%
Skills 74%
Authority 65%
Staffing 63%
Waste 57%
Innovation 67%
IT Org. Design & Staffing Assessment / Stark Industries, Inc.
OrganizationChart
IT Org. Design &Staffing Assessment
StaffingOverview
Time Allocationby Function
Time AllocationBy Function & People
TeamEngagement
Key Drivers Function Effectiveness
Staff AllocationWorksheet
Top Team SuggestionsTo Improve IT
Time AllocationBy Activity Type
Staffing Levelsvs. Effectiveness
ScorecardResults
Time AllocationAppendix
DepartmentalForecast Exercise 57

DevOpsFunction EffectivenessUse this Function Effectiveness Scorecard to evaluate IT staff perceptions of effectivenessacross 7 key drivers, as well as overall.
Compare the team’s own assessment with the rest of IT’s, as well as the business’s (if applicable).This scorecard can be used as part of an alignment exercise to better understand team concerns.
“Satisfied” is the % of respondents who scored the area 8/10 or above. “Neutral” is the % ofrespondents who scored the area 7/10. “Not Satisfied” is the % of respondents who scored thearea 6/10 or below. Each person represents 10% of respondents. If 2 people are shown under“Satisfied”, it means 20% of respondents scored the area 8/10 or higher.
Department Evaluation %30%
73%
Overall Team Effectiveness Business Evaluation
0.5#FTE
0%% OF TOTALSTAFF
0%HAVEDEDICATEDFOCUS
Senior ITManagement
Other IT Staff
40% 67%
17%
17%
--SATISFACTION
--IMPORTANCE
NAME %
Bruce Banner 80%
Charles Koch 70%
Doug Letterman 40%
John Caesar 20%
Bob Soderberg 20%
Tom Tompkins 10%
Processes &Procedures 40%
The Processes & Procedures I work withenable me to do my job effectively
Not Satisfied
Neutral
Satisfied
NAME %
Bruce Banner 100%
Charles Koch 70%
Doug Letterman 40%
John Caesar 20%
Bob Soderberg 20%
Tom Tompkins 10%
Technology 43%
The Technology I work with enables meto do my job effectively
Not Satisfied
Neutral
Satisfied
NAME %
Bob Soderberg 90%
Bruce Banner 70%
Charles Koch 70%
Doug Letterman 60%
John Caesar 30%
Tom Tompkins 10%
Skills 55%
My team has the right Skills to executeeffectively
Not Satisfied
Neutral
Satisfied
NAME %
Bruce Banner 70%
Charles Koch 70%
Doug Letterman 60%
Bob Soderberg 40%
Tom Tompkins 30%
Absence ofOrg. Barriers 55%
My team is able to execute effectivelywithout organizational or PoliticalBarriers
Not Satisfied
Neutral
Satisfied
NAME %
Charles Koch 70%
Bob Soderberg 70%
Doug Letterman 40%
John Caesar 10%
Tom Tompkins 10%
Staffing Level 40%
My team has the appropriate StaffingLevel to executive effectively
Not Satisfied
Neutral
Satisfied
NAME %
John Caesar 100%
Tom Tompkins 100%
Charles Koch 80%
Doug Letterman 50%
Bob Soderberg 20%
Opportunityto ReduceWaste
72%
There is an opportunity to run this areamore efficiently through EliminatingWasteful or low-value activities
Low
Medium
High
NAME %
Bruce Banner 100%
John Caesar 100%
Bob Soderberg 100%
Tom Tompkins 100%
Doug Letterman 90%
Charles Koch 70%
Opportunityto Innovate 93%
There is an opportunity to run this areamore effectively by using Innovativeapproaches or solutions
Low
Medium
High
IT Org. Design & Staffing Assessment / Stark Industries, Inc.
OrganizationChart
IT Org. Design &Staffing Assessment
StaffingOverview
Time Allocationby Function
Time AllocationBy Function & People
TeamEngagement
Key Drivers Function Effectiveness
Staff AllocationWorksheet
Top Team SuggestionsTo Improve IT
Time AllocationBy Activity Type
Staffing Levelsvs. Effectiveness
ScorecardResults
Time AllocationAppendix
DepartmentalForecast Exercise 58

DevOps Feedback IT staff in this area have provided their feedback on how to improve management of this areathrough Stop/Start/Continue suggestions. The right column also contains feedback fromoutside this area. Use this information to run a team feedback session or for improvementideas.
MOST VALUABLE ACTIONS(CONTINUE)
Tom TompkinsCurrently simply bringing experience and knowledge tothis topic. Doug Letterman TFS build configurations, automated deployments. Bob Soderberg
Team Morale, CMMS, Infield, CMMS Mobile, Infield Mobile,Middleware, JCP, SIMS, ESB, Integrations
Bruce BannerI push the buttons to make it go on release night and/orget everything ready to go leading up to the pushing of thebutton
WHAT CAN BE IMPROVED?(START)
Tom Tompkins We need to develop this area as it does not exist currently. Doug LettermanWe need to collaborate and come up with a DEVOPSstrategy. We do not have one. Bob Soderberg
Successful processes have been used in some areas butdoes not getting disseminated across all projects orteams...All groups and teams have components and areasthat they are experts, but they are not being broughttogether to share resulting in unique success and failures.
Bruce Banner
Again, I think I covered most of the points in the previoussections but this one mostly boils down to not beingstaffed appropriately. We had offshore automate ourdeployment processes and some of us have touched on itbut build automation in a typical development company isa seperate team or at the very least it's own position. Wedon't have anyone who is extremely well versed in buildautomation yet we still have to maintain what the offshoreteam provided. So far this hasn't been an issue, but itcould become one.
Charles KochApp Dev team, to provide more clear instruction and togive us the time we need to make the changes theyrequest and to not have last minute request.
WHAT ACTIVITY CAN BESTOPPED?
Tom Tompkins Make this a 2017 initiative with some urgency. Doug Letterman
Not sure when it comes to DEVOPS as we really are in ourinfancy with this. One thing I would state is that wecollaborate with all teams before sending work out toVendors to complete.
Bruce Banner I think we're ok here
Charles Koch I need it now now now, give us the time to do it right.
FEEDBACK FROM OTHER IT STAFF
Tom Hicks Our DevOps practices is mostly non-existent. John AndrewsWe are not a devops shop. Devops requires an operationalsupport and maturity that we simply cannot attain yet. Wedon't maintain dev, test, pre-prod and production
Scott CooperI believe this is an issue that we struggle with but it is alsoextremely new concept for this company.
IT Org. Design & Staffing Assessment / Stark Industries, Inc.
OrganizationChart
IT Org. Design &Staffing Assessment
StaffingOverview
Time Allocationby Function
Time AllocationBy Function & People
TeamEngagement
Key Drivers Function Effectiveness
Staff AllocationWorksheet
Top Team SuggestionsTo Improve IT
Time AllocationBy Activity Type
Staffing Levelsvs. Effectiveness
ScorecardResults
Time AllocationAppendix
DepartmentalForecast Exercise 59

DEPARTMENTExerciseWhat activities can we start/stop/continue? What helps usimprove? What is implementedfrom data?
START 123
STOP 123
CONT. 123
ImplicationsProcess 40%
Tech 43%
Skills 55%
Authority 55%
Staffing 40%
Waste 72%
Innovation 93%
IT Org. Design & Staffing Assessment / Stark Industries, Inc.
OrganizationChart
IT Org. Design &Staffing Assessment
StaffingOverview
Time Allocationby Function
Time AllocationBy Function & People
TeamEngagement
Key Drivers Function Effectiveness
Staff AllocationWorksheet
Top Team SuggestionsTo Improve IT
Time AllocationBy Activity Type
Staffing Levelsvs. Effectiveness
ScorecardResults
Time AllocationAppendix
DepartmentalForecast Exercise 61

Service DeskFunction EffectivenessUse this Function Effectiveness Scorecard to evaluate IT staff perceptions of effectivenessacross 7 key drivers, as well as overall.
Compare the team’s own assessment with the rest of IT’s, as well as the business’s (if applicable).This scorecard can be used as part of an alignment exercise to better understand team concerns.
“Satisfied” is the % of respondents who scored the area 8/10 or above. “Neutral” is the % ofrespondents who scored the area 7/10. “Not Satisfied” is the % of respondents who scored thearea 6/10 or below. Each person represents 10% of respondents. If 2 people are shown under“Satisfied”, it means 20% of respondents scored the area 8/10 or higher.
Department Evaluation %73%
76%
Overall Team Effectiveness Business EvaluationService Desk
13.2#FTE
12%% OF TOTALSTAFF
23%HAVEDEDICATEDFOCUS
Senior ITManagement
Other IT Staff
77% 10%
27%
63%73%SATISFACTION
2ndIMPORTANCE
NAME %
Dan Draper 100%
Michelle Fine 100%
Alan Grant 100%
Conrad Allen 60%
Jeanne Key 50%
Ron Poole 50%
Processes &Procedures 74%
The Processes & Procedures I work withenable me to do my job effectively
Not Satisfied
Neutral
Satisfied
NAME %
Dan Draper 100%
Alex Phillips 100%
Alan Grant 100%
Ron Poole 50%
Dick Whitman 40%
Jeanne Key 20%
Technology 75%
The Technology I work with enables meto do my job effectively
Not Satisfied
Neutral
Satisfied
NAME %
Alain Ducasse 100%
Dan Draper 100%
Dave Caplan 100%
Bruce Banner 50%
Jeanne Key 50%
Ron Poole 40%
Skills 79%
My team has the right Skills to executeeffectively
Not Satisfied
Neutral
Satisfied
NAME %
Alain Ducasse 100%
Dan Draper 100%
Alan Grant 100%
Paul Allen 40%
Ron Poole 40%
Justin Malloy 20%
Absence ofOrg. Barriers 75%
My team is able to execute effectivelywithout organizational or PoliticalBarriers
Not Satisfied
Neutral
Satisfied
NAME %
Conrad Allen 100%
Dan Draper 100%
Alan Grant 100%
Bruce Banner 40%
Ron Poole 40%
Paul Allen 30%
Staffing Level 73%
My team has the appropriate StaffingLevel to executive effectively
Not Satisfied
Neutral
Satisfied
NAME %
Gary Becker 100%
Justin Malloy 100%
Michelle Fine 100%
Peter Daley 20%
Dan Draper 10%
Alan Grant 10%
Opportunityto ReduceWaste
63%
There is an opportunity to run this areamore efficiently through EliminatingWasteful or low-value activities
Low
Medium
High
NAME %
Justin Malloy 100%
Vince Cartier 100%
Alex Phillips 100%
James Butler 50%
Linda Sims 30%
Peter Daley 30%
Opportunityto Innovate 71%
There is an opportunity to run this areamore effectively by using Innovativeapproaches or solutions
Low
Medium
High
IT Org. Design & Staffing Assessment / Stark Industries, Inc.
OrganizationChart
IT Org. Design &Staffing Assessment
StaffingOverview
Time Allocationby Function
Time AllocationBy Function & People
TeamEngagement
Key Drivers Function Effectiveness
Staff AllocationWorksheet
Top Team SuggestionsTo Improve IT
Time AllocationBy Activity Type
Staffing Levelsvs. Effectiveness
ScorecardResults
Time AllocationAppendix
DepartmentalForecast Exercise 62
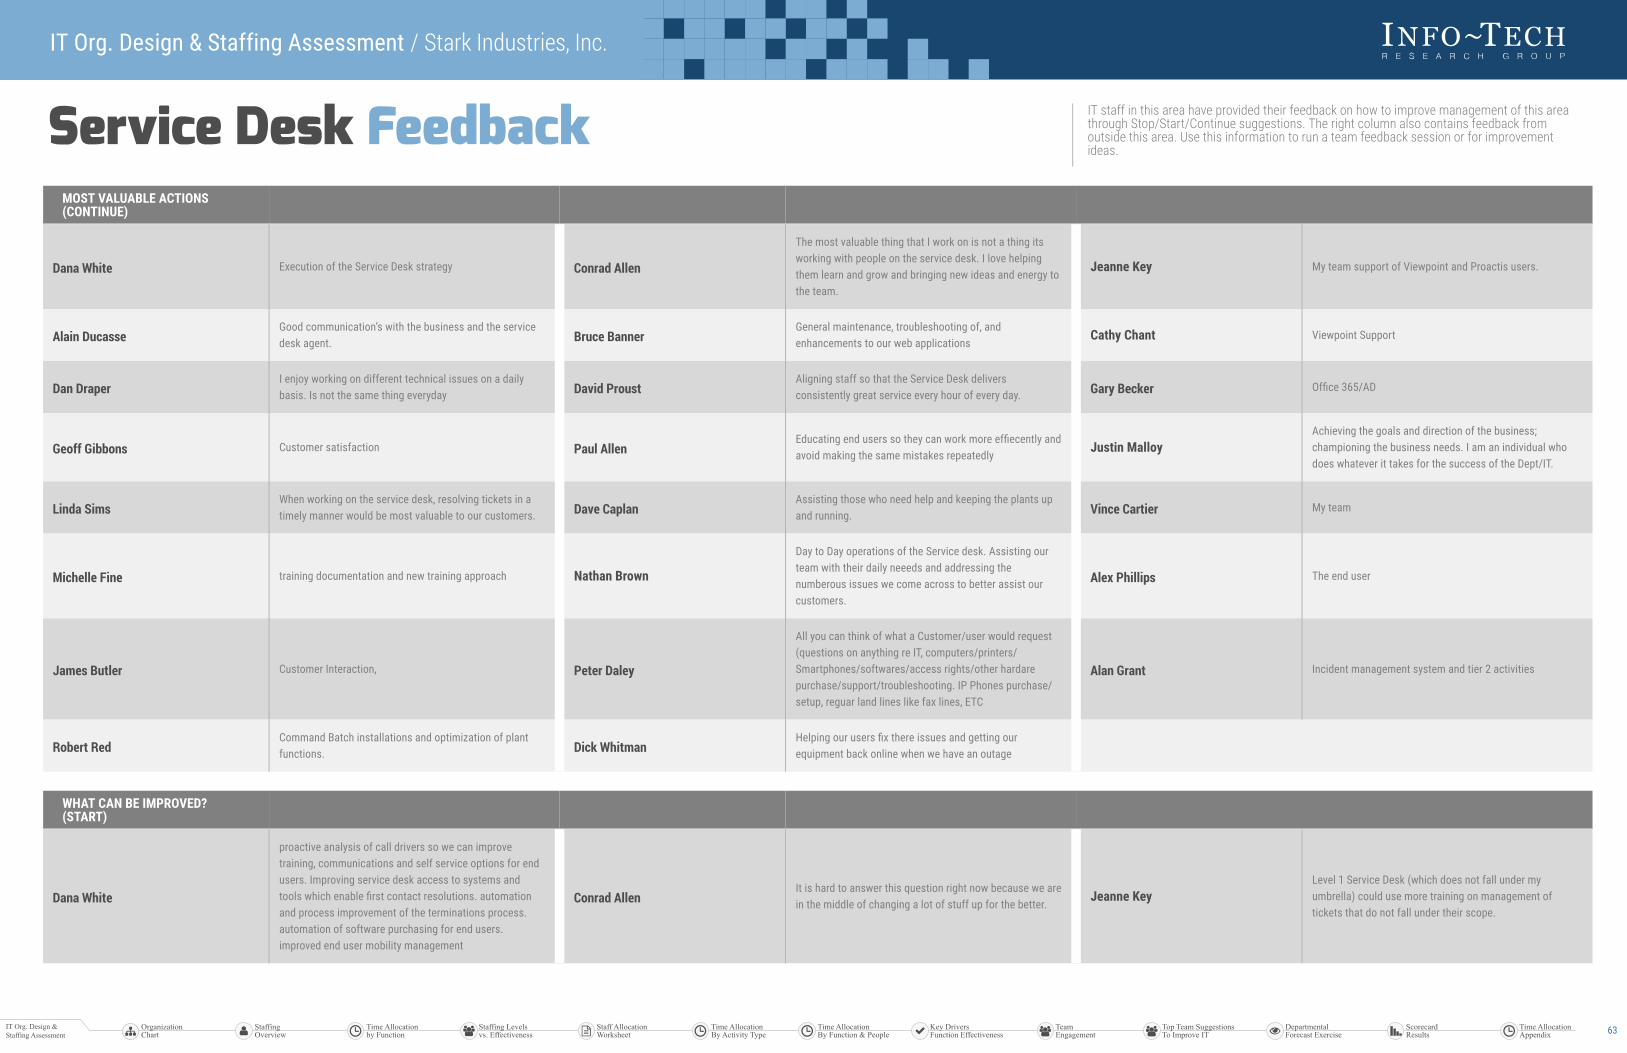
Service Desk Feedback IT staff in this area have provided their feedback on how to improve management of this areathrough Stop/Start/Continue suggestions. The right column also contains feedback fromoutside this area. Use this information to run a team feedback session or for improvementideas.
MOST VALUABLE ACTIONS(CONTINUE)
Dana White Execution of the Service Desk strategy Conrad Allen
The most valuable thing that I work on is not a thing itsworking with people on the service desk. I love helpingthem learn and grow and bringing new ideas and energy tothe team.
Jeanne Key My team support of Viewpoint and Proactis users.
Alain DucasseGood communication’s with the business and the servicedesk agent. Bruce Banner
General maintenance, troubleshooting of, andenhancements to our web applications
Cathy Chant Viewpoint Support
Dan DraperI enjoy working on different technical issues on a dailybasis. Is not the same thing everyday David Proust
Aligning staff so that the Service Desk deliversconsistently great service every hour of every day. Gary Becker Office 365/AD
Geoff Gibbons Customer satisfaction Paul AllenEducating end users so they can work more effiecently andavoid making the same mistakes repeatedly
Justin MalloyAchieving the goals and direction of the business;championing the business needs. I am an individual whodoes whatever it takes for the success of the Dept/IT.
Linda SimsWhen working on the service desk, resolving tickets in atimely manner would be most valuable to our customers. Dave Caplan
Assisting those who need help and keeping the plants upand running. Vince Cartier My team
Michelle Fine training documentation and new training approach Nathan Brown
Day to Day operations of the Service desk. Assisting ourteam with their daily neeeds and addressing thenumberous issues we come across to better assist ourcustomers.
Alex Phillips The end user
James Butler Customer Interaction, Peter Daley
All you can think of what a Customer/user would request(questions on anything re IT, computers/printers/Smartphones/softwares/access rights/other hardarepurchase/support/troubleshooting. IP Phones purchase/setup, reguar land lines like fax lines, ETC
Alan Grant Incident management system and tier 2 activities
Robert RedCommand Batch installations and optimization of plantfunctions. Dick Whitman
Helping our users fix there issues and getting ourequipment back online when we have an outage
WHAT CAN BE IMPROVED?(START)
Dana White
proactive analysis of call drivers so we can improvetraining, communications and self service options for endusers. Improving service desk access to systems andtools which enable first contact resolutions. automationand process improvement of the terminations process.automation of software purchasing for end users.improved end user mobility management
Conrad AllenIt is hard to answer this question right now because we arein the middle of changing a lot of stuff up for the better.
Jeanne KeyLevel 1 Service Desk (which does not fall under myumbrella) could use more training on management oftickets that do not fall under their scope.
IT Org. Design & Staffing Assessment / Stark Industries, Inc.
OrganizationChart
IT Org. Design &Staffing Assessment
StaffingOverview
Time Allocationby Function
Time AllocationBy Function & People
TeamEngagement
Key Drivers Function Effectiveness
Staff AllocationWorksheet
Top Team SuggestionsTo Improve IT
Time AllocationBy Activity Type
Staffing Levelsvs. Effectiveness
ScorecardResults
Time AllocationAppendix
DepartmentalForecast Exercise 63

WHAT CAN BE IMPROVED?(START)
Nathan Brown
I think we need to improve with communcation within ourticketing system across the board. We constantly have toreach out to individuals for explainations and details. TheService desk phone system is a constant problem. Also ithink more cross traing opertunites should be available tohelp promote people from within the company.
Alex Phillips
The service desk has many highly talented analystsworking on it but the scope of support is a bit too wide.The tiered structure is working but it's overwhelming sincesupport for so many apps are being pushed to them. Usersof these apps are expecting experts when they call forsupport but in most cases, the only experience that ananalyst may have had is taught to them by the actualusers. It may be more effective to create specialist groupswithin the team.
Peter Daley
Ticket assingments to/from Helpdesk: know the differencebetween INCIDENT & SERVICE REQUESTS. Ticketassingment to proper group. When we assign and incidentback to the Helpdesk for whatever reasons we identify inthe ticket itself (in the journal entry), it gets back to us over& over. Service desk should consult the ticket journalentries (not only the ticket description entered by therequestee) before dealing/assigning tickets. New userprocedures in Cherwell is also not obvious (tasks are notgenerated automatically)
Robert Red
Clarity on the authority of the requesting user. Whenworking on a request sometimes a user requests thingsthat I do not know if he/she is supposed to have and donot know the chain of command to resolve the request.
Dick Whitman
The company as a whole needs to have Standardizationwithout this it creates an environment that is veryunproductive. With the amount of applications that aresupported they need to be streamlined. We need to look atall aspects of the company environment as a whole we arerunning such a variety of older equipment and having nonetwork topology gives the users a very poor customerexperience. Communication needs to be improvedespecially when new equipment or software.
WHAT ACTIVITY CAN BESTOPPED?
Dana White dealing with inappropriate Solarwinds, infrastructure alerts Conrad Allen same as above Alain Ducasse Stop the negativity
Bruce Banner
I welcome the opportunity to speak directly with servicedesk team members without the formality of "process." Ibelieve that if I can stop what I am doing for 5 minutes toanswer questions while a service desk team member istroubleshooting, it will save everyone's time in the longrun. This could prevent developers from having to contactend users again for additional information once a cherwellticket is escalated and help resolve more issues on thefirst call. Over time, I envision the need for the servicedesk members to ask questions would dwindlesignificantly.
Gary Becker
Task that do not require higher level of technicalknowledge but take longer to complete have been pushedto us. I would like to get more technical based task andduties.
Paul AllenNot taking into account the current work load of the servicedesk when looking to add new duties to the service desk.
Justin Malloy
Charlotte office Tier 3, as I see no value. Moreover, Tier 2does most of what Tier 3 is tasked with doing. Then,anything beyond Tier 2, Field Services, or the rest of the ITresolver groups can address/resolve. Most importantly,the negative environment, as there are detractors/analystswho poison the environment daily. As a result, this causesunnecessary distractions and unprofessionalism.
Dave CaplanMonitoring circuits should be a function of a NOC/Command Center, not the Service Desk. Vince Cartier Making changes that do not help the service desk.
Alex PhillipsService Desk circuit monitoring. As I understand it, a NOCis being created to solve this already and until then the Dick Whitman
Stop bringing on applications that are purchased by theLocal Divisions. We need to build a process
IT Org. Design & Staffing Assessment / Stark Industries, Inc.
OrganizationChart
IT Org. Design &Staffing Assessment
StaffingOverview
Time Allocationby Function
Time AllocationBy Function & People
TeamEngagement
Key Drivers Function Effectiveness
Staff AllocationWorksheet
Top Team SuggestionsTo Improve IT
Time AllocationBy Activity Type
Staffing Levelsvs. Effectiveness
ScorecardResults
Time AllocationAppendix
DepartmentalForecast Exercise 65

WHAT ACTIVITY CAN BESTOPPED?
Service Desk may be the only place for it. The problem isthat (in most cases) agents have very little understandingof a site's network and current processes advise sendinglocal contacts (that may not have an understanding either)into network closets to disconnect/restart equipment.Understandable if there is no on-site IT and they are beingwalked through it over the phone but the majority of thetime, a "CPE" email is sent (which could be automated ifnecessary).
FEEDBACK FROM OTHER IT STAFF
Tom Hicks
A trusted resource for our business. The metrics beingused to focus the team's improvement is making adifference in improving the capabilities. For improvements,would be good to have more capabilities on the servicedesk staff so they can fix problems without having toescalate to other teams.
John Andrews
I have not engaged the service desk directly except to setup a Webex account. That was handled very well. Thereporting I am seeing is that we are definitely trending inthe right direction and feedback I have heard from the fieldis that satisfaction is improving for our customers as well.
Scott Cooper The service desk seems to do a pretty nice job.
Pierce Morgan Business feedback has been very positive Doug LettermanI think in the last year the service desk has become muchmore effective. I still get some comments from thebusiness, but not nearly as often as I used too.
Gail KingThis area has seen marked improvements over the last 2years with the leadership. The direct calls and support arestronger with a skillset that supports the business.
Kirk BlackI think the Service Desk is functional and serves itspurpose. Jacques Paul
Still have issues with response times over email andkickbacks from automated emails telling me that I haven'tresponded when I have responded already. Major outageprocedure is much improved.
Eric Davis
Service Desk has improved vastly over the past few years.Tasks they are trained to perform are done timely andeffectively. Until we build more standardization anddocumentation across the environment we will not be ableto empower the service desk to take over responsibilitieswhich they could perform. Installing a printer is a goodexample. We have so many different configurations (fromprint servers, to direct IP, etc..) that the service desk wouldnot know where to get started in most areas. I believe bymoving toward the print server solution Canada is using wecan standardize on one location/process to install allprinters and allow the service desk to be able to handle thisprocess 100%
Bob Soderberg Service desk is prompt and helpful. Sean Ellis
I think the Service Desk has come a long way. I feel thestrategy that is currently in place will move us in the rightdirection. I do feel that grouping our service deskresources into specific skill sets is crucial. This willincrease first contact resolution and minimize escalationto other IT functions.
Travis Barker
Overall management has been good since Janice took overbut the level of service the end users receive is stillinconsistent and the service desk analysts are often put ina no win situation. No experience in our complicatedapplications and configuration limited rights to makechanges they know how to fix.
Jacob CohenThe service desk has come a long way, still room forimprovement but good job getting to where you are.
Andrew JonesI have heard many comments from users that the NEWService Desk is much better that what we previously had. Brian Hoss
The service desk has come a long ways and is now anintegral part of our support process.
IT Org. Design & Staffing Assessment / Stark Industries, Inc.
OrganizationChart
IT Org. Design &Staffing Assessment
StaffingOverview
Time Allocationby Function
Time AllocationBy Function & People
TeamEngagement
Key Drivers Function Effectiveness
Staff AllocationWorksheet
Top Team SuggestionsTo Improve IT
Time AllocationBy Activity Type
Staffing Levelsvs. Effectiveness
ScorecardResults
Time AllocationAppendix
DepartmentalForecast Exercise 66

DEPARTMENTExerciseWhat activities can we start/stop/continue? What helps usimprove? What is implementedfrom data?
START 123
STOP 123
CONT. 123
ImplicationsProcess 74%
Tech 75%
Skills 79%
Authority 75%
Staffing 73%
Waste 63%
Innovation 71%
IT Org. Design & Staffing Assessment / Stark Industries, Inc.
OrganizationChart
IT Org. Design &Staffing Assessment
StaffingOverview
Time Allocationby Function
Time AllocationBy Function & People
TeamEngagement
Key Drivers Function Effectiveness
Staff AllocationWorksheet
Top Team SuggestionsTo Improve IT
Time AllocationBy Activity Type
Staffing Levelsvs. Effectiveness
ScorecardResults
Time AllocationAppendix
DepartmentalForecast Exercise 68
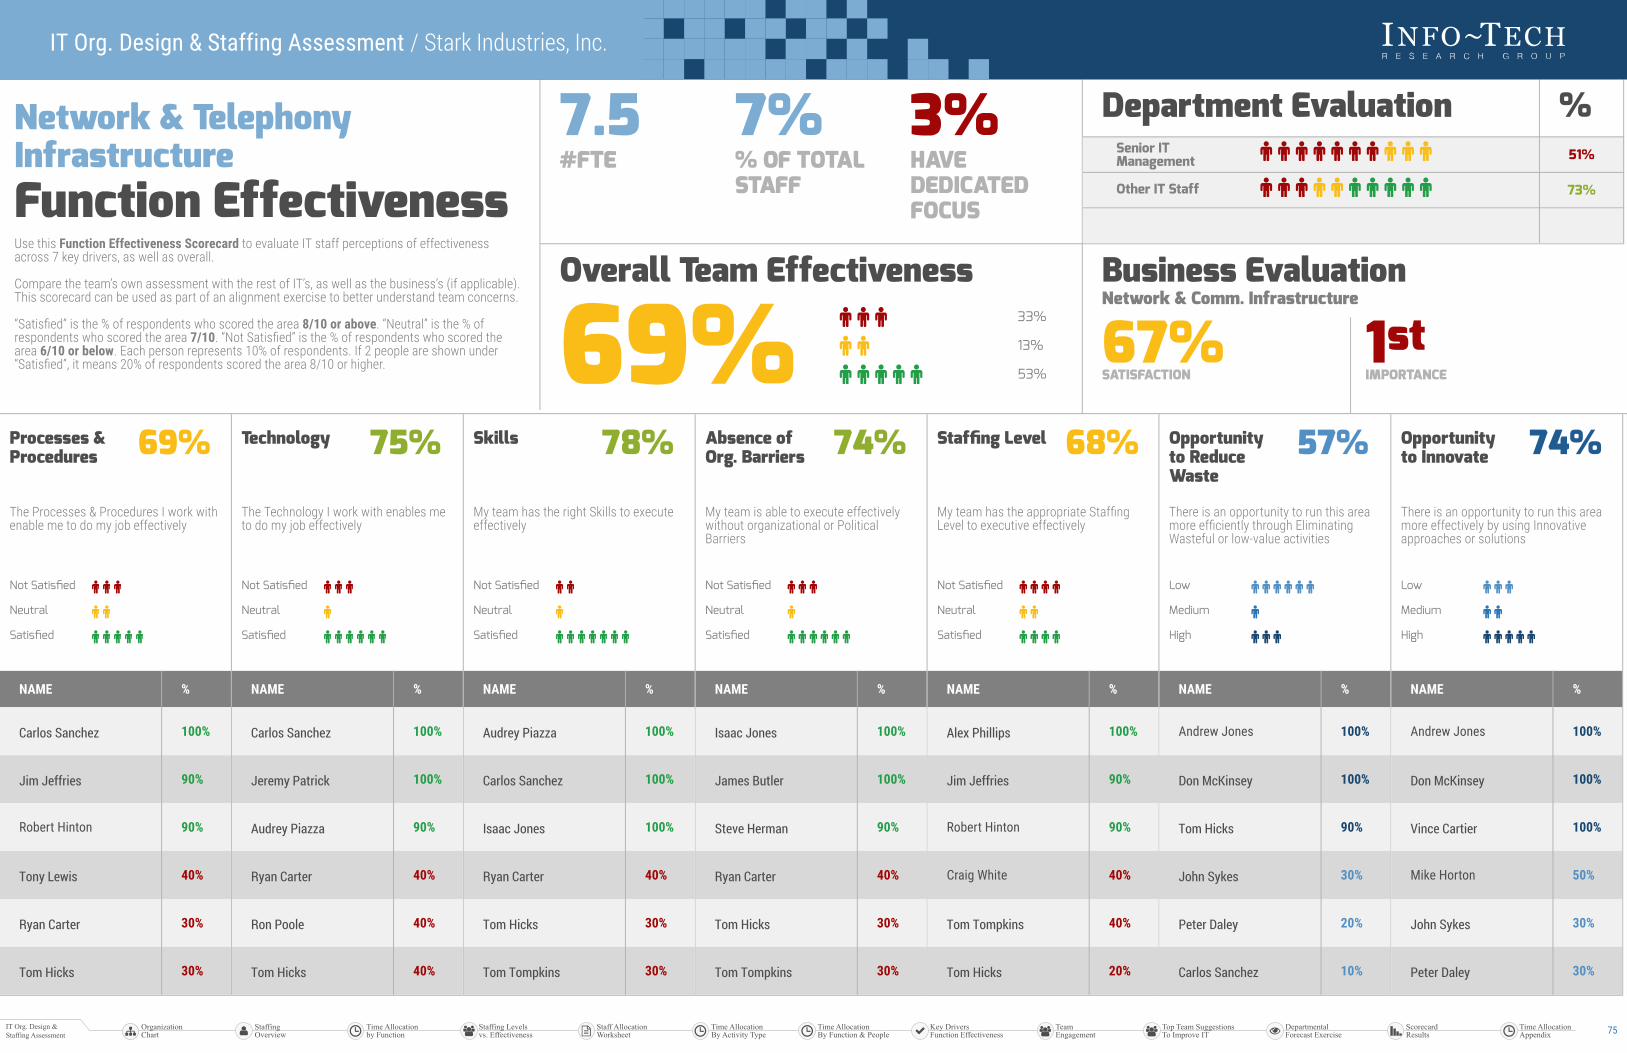
Network & TelephonyInfrastructureFunction EffectivenessUse this Function Effectiveness Scorecard to evaluate IT staff perceptions of effectivenessacross 7 key drivers, as well as overall.
Compare the team’s own assessment with the rest of IT’s, as well as the business’s (if applicable).This scorecard can be used as part of an alignment exercise to better understand team concerns.
“Satisfied” is the % of respondents who scored the area 8/10 or above. “Neutral” is the % ofrespondents who scored the area 7/10. “Not Satisfied” is the % of respondents who scored thearea 6/10 or below. Each person represents 10% of respondents. If 2 people are shown under“Satisfied”, it means 20% of respondents scored the area 8/10 or higher.
Department Evaluation %51%
73%
Overall Team Effectiveness Business EvaluationNetwork & Comm. Infrastructure
7.5#FTE
7%% OF TOTALSTAFF
3%HAVEDEDICATEDFOCUS
Senior ITManagement
Other IT Staff
69% 33%
13%
53%67%SATISFACTION
1stIMPORTANCE
NAME %
Carlos Sanchez 100%
Jim Jeffries 90%
Robert Hinton 90%
Tony Lewis 40%
Ryan Carter 30%
Tom Hicks 30%
Processes &Procedures 69%
The Processes & Procedures I work withenable me to do my job effectively
Not Satisfied
Neutral
Satisfied
NAME %
Carlos Sanchez 100%
Jeremy Patrick 100%
Audrey Piazza 90%
Ryan Carter 40%
Ron Poole 40%
Tom Hicks 40%
Technology 75%
The Technology I work with enables meto do my job effectively
Not Satisfied
Neutral
Satisfied
NAME %
Audrey Piazza 100%
Carlos Sanchez 100%
Isaac Jones 100%
Ryan Carter 40%
Tom Hicks 30%
Tom Tompkins 30%
Skills 78%
My team has the right Skills to executeeffectively
Not Satisfied
Neutral
Satisfied
NAME %
Isaac Jones 100%
James Butler 100%
Steve Herman 90%
Ryan Carter 40%
Tom Hicks 30%
Tom Tompkins 30%
Absence ofOrg. Barriers 74%
My team is able to execute effectivelywithout organizational or PoliticalBarriers
Not Satisfied
Neutral
Satisfied
NAME %
Alex Phillips 100%
Jim Jeffries 90%
Robert Hinton 90%
Craig White 40%
Tom Tompkins 40%
Tom Hicks 20%
Staffing Level 68%
My team has the appropriate StaffingLevel to executive effectively
Not Satisfied
Neutral
Satisfied
NAME %
Andrew Jones 100%
Don McKinsey 100%
Tom Hicks 90%
John Sykes 30%
Peter Daley 20%
Carlos Sanchez 10%
Opportunityto ReduceWaste
57%
There is an opportunity to run this areamore efficiently through EliminatingWasteful or low-value activities
Low
Medium
High
NAME %
Andrew Jones 100%
Don McKinsey 100%
Vince Cartier 100%
Mike Horton 50%
John Sykes 30%
Peter Daley 30%
Opportunityto Innovate 74%
There is an opportunity to run this areamore effectively by using Innovativeapproaches or solutions
Low
Medium
High
IT Org. Design & Staffing Assessment / Stark Industries, Inc.
OrganizationChart
IT Org. Design &Staffing Assessment
StaffingOverview
Time Allocationby Function
Time AllocationBy Function & People
TeamEngagement
Key Drivers Function Effectiveness
Staff AllocationWorksheet
Top Team SuggestionsTo Improve IT
Time AllocationBy Activity Type
Staffing Levelsvs. Effectiveness
ScorecardResults
Time AllocationAppendix
DepartmentalForecast Exercise 75

Network & Telephony InfrastructureFeedback
IT staff in this area have provided their feedback on how to improve management of this areathrough Stop/Start/Continue suggestions. The right column also contains feedback fromoutside this area. Use this information to run a team feedback session or for improvementideas.
MOST VALUABLE ACTIONS(CONTINUE)
Tom Hicks The SD-WAN initiative. Lawrence Philips
The most valuable thing I work on is the entire transitionfrom LH to CRH. We made a lot of progress but there isstill a tremendous amount of work ahead specifically withstrong skilled resources.
Tom Tompkins
Currently it is identifying talented individuals to work with and work on promoting them and developing them along with the converse, those individuals who are in the wrong role need to be given opportunities elsewhere. This will help support my goal of developing the engineering function within SI
Keith BrownActivities that help stabilzie our current networkenvironment such as setting up redundancies amoung ourcritical circuits.
Travis BarkerLeveraging my direct team, SI resources and vendors we have to keep the connectivity up and the telephone systems working.
Jacob Cohencollaboration with field services to determine best solutionsfor plants.
Carlos SanchezAttend to any network problems that may arise at theplants to make sure they can resume proper operations.
Craig White Physical network infrastructure Isaac JonesManaging a team to ensure that the customers have thesupport and services that they need to be productive andperform their daily activities.
Don McKinseyOur analysts work to get the end user or the customer upand working as quick as possible. People are our biggestasset.
David Bowen
In an MSP/Cloud-hosted environment networkinfrastructure is critical. I believe that this is the mostvaluable thing I work on. A close second would be End-User equipment(PCs/phones)
Jeremy PatrickMaintaining the phone systems nationwide to help preventdowntime for our customers.
Tony Lewis Connectivity between locations both remote and head end. Vince Cartier The SI Service Desk Team Alex Phillips The 7th floor network closet
James ButlerThe Network of the Local Plants. if they are not runningright we are not making profit. Peter Daley
Involved in supporting/setting up/troubleshooting/purchasing Network when issues/requests arises. I amalso the Analyst eyes & aid - I go on sites for them! AlsoInvolved in supporting/setting up/troubleshooting/purchasing IP Phone. Example of what I had to do thatcovers both fields: Setting up all network infrastructure atour newly acquired St-Hubert offices/batching plant: Planwhere to have all network jacks installed and coordinateinstallations, Purchase wall mounting Box to secureRouter, Data line, Cable the patch panel, Purchase InstallWifi boxes & have an Analyst configure them 1st.Coordiante with telco to have the main data line installed.Purchase & install all IP phones for locations, define acomplete detailed Excel sheet with all site détails & info -extentions, paging systems, greeting messagerecordings....etc etc.
Alan Grant Mpls and DMPVN along with Active Directory
Robert Hinton Everything our team works on is extremely valuable. Steve Herman Assisting the WAN team in configuring routers.
IT Org. Design & Staffing Assessment / Stark Industries, Inc.
OrganizationChart
IT Org. Design &Staffing Assessment
StaffingOverview
Time Allocationby Function
Time AllocationBy Function & People
TeamEngagement
Key Drivers Function Effectiveness
Staff AllocationWorksheet
Top Team SuggestionsTo Improve IT
Time AllocationBy Activity Type
Staffing Levelsvs. Effectiveness
ScorecardResults
Time AllocationAppendix
DepartmentalForecast Exercise 76

WHAT CAN BE IMPROVED?(START)
Tom Hicks
Implementing an enterprise-wide network solution withcentralized visibility and control. Also having anengineering skillset on the team (in addition to the adminswe have on the team). Better tooling as well, beyondSolarwinds.
Lawrence Philips
Stronger alignment and involvement with IT leadership outof Atlanta. During my 1:1 with the functional leads Iprovide feedback of what happens in Canada but on rearoccasions do I get feedback on activities of what drivetheir functions. Kind of one way communications.
Tom Tompkins
We need to outsource more of the mundane tasks topartners and free up time of the more qualified ITprofessionals. We must also hold leaders accountable forwhat their team produces or is responsible for. I have notbeen here long enough to give more specific examples butI'm seeing some shades of grey in this area.
Keith Brown
I think we can improve our overall enterprise networkmanagment approach to standards and processes andprocedures. I think we are moving in the right directionwith our SD WAN initiative. I also think that our responseto network outages can be greatly improved with somevariatoin of a Network Operations Center type ofengagement.
Travis Barker
Circuit down needs to be handled as a plant down andtreated as such. Carriers need to be called for testing, anddispatching setup from a team that understands telecomand how it works then follows through on a timely basis.
Jacob CohenI feel that by having standard hardware vetted, approvedand purchased by the network team there could be a costsavings and time savings.
Andrew JonesWe should have a dedicated VoIP phone person to handlenew phone setup and issues. Audrey Piazza
Install smart PDU to power cycle phone switches if/whenneeded Carlos Sanchez
During my time in the company I have had little exposure tothe network infrastructure other than fix minor problemwhen a piece of equipment fails it's communication withinthe network. What i have seen is that because of remotelocation where the plants are located sometimesconnectivity is a bit of an issue, but as far as how the VPNworks I think is well structured.
Craig White Communication Isaac JonesContinuing to upgrade internet and phone services, alongwith testing and implementing new technologies such asSDWAN.
Don McKinseyBetter training should be developed. There should be astandardized approach given to all new Analysts.
David Bowen
I believe initiatives have already started, but formalizing SOPs would be very helpful to ensure that we have folks doing things the same way so that no matter who is doing the work it can be completed according to a standard set by SI IT.
Jeremy PatrickThe WAN connectivity between sites. Aging copper linesrunning into sites. Tony Lewis Processes and procedures. Standardization.
Vince Cartier The amount of people we employee Alex Phillips
In the corporate office, our network and telephony areowned by another product group within our company butwe use and are admins to it. At the moment, there is a lackof documentation about the network itself, the appliancesin the network closet, processes for administration, etc.We can improve here by creating network documentationand more communication between product groups.
James Butler Training on actual Software.
Peter DaleyVoIP issues would be solve much faster if VOiP access/support would be done internally. Ryan Carter Enterprise network architect posistion Robert Hinton
More formal training classes for the technical skills neededfor our job.
Steve Herman Hiring an FSA in NE Ohio.
WHAT ACTIVITY CAN BESTOPPED?
IT Org. Design & Staffing Assessment / Stark Industries, Inc.
OrganizationChart
IT Org. Design &Staffing Assessment
StaffingOverview
Time Allocationby Function
Time AllocationBy Function & People
TeamEngagement
Key Drivers Function Effectiveness
Staff AllocationWorksheet
Top Team SuggestionsTo Improve IT
Time AllocationBy Activity Type
Staffing Levelsvs. Effectiveness
ScorecardResults
Time AllocationAppendix
DepartmentalForecast Exercise 77

WHAT ACTIVITY CAN BESTOPPED?
Tom HicksImplementing multiple/various network solutions that, inmany cases, may not be the best fit for a site or theorganization as a whole.
Tom Tompkins
Stop allowing customers and other IT individuals tobypass defined processes. Such as our Canadian divisiongoing directly to the IT support groups and not workingthrough a stated process.
Travis BarkerThe attempt to push the business to Advocate and therepartners.
Jacob Cohen
Purchasing network equipment from CDW. it has been myexperience in the past they are overpriced on Ciscoequipment and we are not seeing the savings on theamount of network equipment we buy.
Andrew Jones Stack8 Carlos SanchezI don't believe I have seen any practice that I would sayneeds to be stopped.
Isaac JonesI don't feel that there is anything that is currently beingdone that is not needed. Don McKinsey
We have a duplication of work that does occur as a resultof some automated processes. As an example networkmonitoring will at time generate a new request or ticketwhen there is already a request working.
Jeremy PatrickNothing should be stop, but moving forward with newertechnology bringing more stability for our customers.
Tony Lewis Not following a written process to expedite the request. Vince Cartier using Shoretel
FEEDBACK FROM OTHER IT STAFF
Erik DunlopBy leveraging advancing technologies we have room toimprove in this area. John Andrews
I have not been directly engaged in the network or infrastructure initiative. I have been very impressed with Tim Huff's team and the steps taken to create operational structure. I am also very impressed by Steve Davis on the End User Computing and Mobility initiatives he has shared with me.
Scott CooperIt seems like we have a lot of different issues with ourphone systems. Overall I do not have many issues.
Jeanne KeyWe seem to have way too many network and telphonyissues. We need to work for a more stable platform. Jacques Paul
Vast improvements have been made in this area but thereis much room for improvement with stabilization efforts. Eric Davis
I believe we have a good understanding on ShoreTel sites,but this does not account for all phone systems throughoutthe environment. The room for improvement will be oncewe have an understanding of 100% and a clear support pathfor every phone system in our environment. . Network wehave a good understanding of the enviroment
Bob Soderberg
I deal with connection and PC issues on a regularbases...Finding the right person to help with connectionand infrastructure issues is usually a round robin beforewe get to the right person.
Sean Ellis
This will always be a challenge because because of themaintenance and support that is required. However, nowthat we have secured the leadership for this future, I feelwe are moving in the right direction. Additional resourcesand/or service providers to supplement demand isrequired to be successful.
Alain DucasseRegarding the Voip support we should put back theconsultant Munish. Regarding the Network , End-to-End isvery good.
Brian HossWork is currently underway to build a better infrastructureto support this going forward and will be implementedduring migration to DP.
Catelyn Giffordconsiderable improvement on telephony in the last 3months Chris Hunt Ken and his team are doing a great job.
Dan Draper Great team! David ProustShoretel telephony is not consistently stable. It would begood to provide more tools to Field Services and the Geoff Gibbons
Probably some low value tasks as changing the name of auser on an extension should be handled by filed service.
IT Org. Design & Staffing Assessment / Stark Industries, Inc.
OrganizationChart
IT Org. Design &Staffing Assessment
StaffingOverview
Time Allocationby Function
Time AllocationBy Function & People
TeamEngagement
Key Drivers Function Effectiveness
Staff AllocationWorksheet
Top Team SuggestionsTo Improve IT
Time AllocationBy Activity Type
Staffing Levelsvs. Effectiveness
ScorecardResults
Time AllocationAppendix
DepartmentalForecast Exercise 78

DEPARTMENTExerciseWhat activities can we start/stop/continue? What helps usimprove? What is implementedfrom data?
START 123
STOP 123
CONT. 123
ImplicationsProcess 69%
Tech 75%
Skills 78%
Authority 74%
Staffing 68%
Waste 57%
Innovation 74%
IT Org. Design & Staffing Assessment / Stark Industries, Inc.
OrganizationChart
IT Org. Design &Staffing Assessment
StaffingOverview
Time Allocationby Function
Time AllocationBy Function & People
TeamEngagement
Key Drivers Function Effectiveness
Staff AllocationWorksheet
Top Team SuggestionsTo Improve IT
Time AllocationBy Activity Type
Staffing Levelsvs. Effectiveness
ScorecardResults
Time AllocationAppendix
DepartmentalForecast Exercise 80

IT Governance & StrategyFunction EffectivenessUse this Function Effectiveness Scorecard to evaluate IT staff perceptions of effectivenessacross 7 key drivers, as well as overall.
Compare the team’s own assessment with the rest of IT’s, as well as the business’s (if applicable).This scorecard can be used as part of an alignment exercise to better understand team concerns.
“Satisfied” is the % of respondents who scored the area 8/10 or above. “Neutral” is the % ofrespondents who scored the area 7/10. “Not Satisfied” is the % of respondents who scored thearea 6/10 or below. Each person represents 10% of respondents. If 2 people are shown under“Satisfied”, it means 20% of respondents scored the area 8/10 or higher.
Department Evaluation %58%
72%
Overall Team Effectiveness Business Evaluation
4.2#FTE
4%% OF TOTALSTAFF
0%HAVEDEDICATEDFOCUS
Senior ITManagement
Other IT Staff
67% 47%
12%
41%
--SATISFACTION
--IMPORTANCE
NAME %
Tim Jacobs 90%
Keith Brown 80%
Jim Taylor 80%
Anthony Stark 50%
Daniel Gray 40%
Bjorn Nilssen 30%
Processes &Procedures 62%
The Processes & Procedures I work withenable me to do my job effectively
Not Satisfied
Neutral
Satisfied
NAME %
Tim Jacobs 90%
Gail King 80%
Keith Brown 80%
John Andrews 40%
Sean Ellis 30%
Anthony Stark 20%
Technology 61%
The Technology I work with enables meto do my job effectively
Not Satisfied
Neutral
Satisfied
NAME %
Jacques Paul 90%
Daniel Gray 80%
Keith Brown 80%
Anthony Stark 50%
Steve Davis 50%
John Andrews 40%
Skills 70%
My team has the right Skills to executeeffectively
Not Satisfied
Neutral
Satisfied
NAME %
Jason Forbes 90%
Keith Brown 90%
Tim Jacobs 80%
Jeanne Key 50%
John Andrews 40%
Sean Ellis 30%
Absence ofOrg. Barriers 65%
My team is able to execute effectivelywithout organizational or PoliticalBarriers
Not Satisfied
Neutral
Satisfied
NAME %
Jason Forbes 90%
Keith Brown 80%
Jacob Cohen 80%
Daniel Gray 30%
John Andrews 20%
Steve Davis 20%
Staffing Level 59%
My team has the appropriate StaffingLevel to executive effectively
Not Satisfied
Neutral
Satisfied
NAME %
Anthony Stark 80%
John Andrews 80%
Sean Ellis 80%
Keith Brown 50%
Gail King 30%
Bjorn Nilssen 30%
Opportunityto ReduceWaste
60%
There is an opportunity to run this areamore efficiently through EliminatingWasteful or low-value activities
Low
Medium
High
NAME %
Anthony Stark 90%
Erik Dunlop 90%
Bjorn Nilssen 90%
Jacob Cohen 60%
Jason Forbes 50%
Keith Brown 50%
Opportunityto Innovate 75%
There is an opportunity to run this areamore effectively by using Innovativeapproaches or solutions
Low
Medium
High
IT Org. Design & Staffing Assessment / Stark Industries, Inc.
OrganizationChart
IT Org. Design &Staffing Assessment
StaffingOverview
Time Allocationby Function
Time AllocationBy Function & People
TeamEngagement
Key Drivers Function Effectiveness
Staff AllocationWorksheet
Top Team SuggestionsTo Improve IT
Time AllocationBy Activity Type
Staffing Levelsvs. Effectiveness
ScorecardResults
Time AllocationAppendix
DepartmentalForecast Exercise 90

IT Governance & Strategy Feedback IT staff in this area have provided their feedback on how to improve management of this areathrough Stop/Start/Continue suggestions. The right column also contains feedback fromoutside this area. Use this information to run a team feedback session or for improvementideas.
MOST VALUABLE ACTIONS(CONTINUE)
Anthony StarkBringing transparency to the IT and Business Leadershipwith regards to project activities/progress/issues/risks/value.
Jerry Mills
* Trust building with our customers: communication of theIT Strategy; Transparency regarding why the IT Governancemodel is structured the way it is, how the IT Governanceprocess works, and the accountable results, measured inbusiness value delivered, not just activities completed
John Andrews
I am working with Gerry and team to define the prioritizationand release planning process. This addresses tacticalgovernance changes and process definition that will allowus to work more efficiently on WIFs and release plans. Forstrategy, it is working through the items on Dolores' list andclosing out the remaining IT strategy Charters.
Daniel GrayCreating and developing policies and procedures onlicensing and procurement process, Gail King
Building documentation and processes that can beactively accessed, and effectively used to improve how wegovern the organization.
Keith Brown Helping to setup governance with Datapipe
Bjorn Nilssen Creating Policies and Procedures. Jacques Paul
Tools such as Clarizen and the processes/procedures thatmake it work. Assist with financials and SOX whenneeded. Was primary for SOX but have transitioned muchof that off.
Tim JacobsPOS documentation and aiding the PM's in understandingPOS and associated processes.
Jacob Cohen work intake forms Jason Forbes data standards Steve Davis EUC Strategy
WHAT CAN BE IMPROVED?(START)
Anthony StarkSolidifying the practices, tools and approach and activelypromoting, sharing and engaging others in the departmentin the activities of IT Governance.
Jerry Mills
* revisions to the IT Governance model (awaiting approvalfrom senior leadership) * better oversight andmanagement of non-project work items (ie, Enhancementsand Service Requests) * implementation of a change orderprocess to cover changes in scope while a work item is inflight * documentation, centralization, and communicationof key processes, policies and procedures *documentation of the IT Strategy and an on-goingprocess/framework for evaluating and refining IT work toalign with the strategy
John Andrews
We need to do a better job of articulating business valuemeasurements and using those to drive governance. Weneed to anchor our IT strategy initiatives and not letcompeting priorities get in the way of finishing thoseefforts.
Lawrence Philips
As per my comments in the PM area there is still a lot ofwork to be done to streamline the governance process.Important to include Canadian leadership in decisions/discussions re this going forward
Daniel GrayOpen a line of communications with all to establish solidand accepted policies on how we procure software,hardware, and IT subscriptions.
Gail King
We have many opportunities to expand this area. The initialwork being done is setting a strong foundation to documentour policies, and procedures that will frame our ability tostandardize across the IT organization. This provides alevel of business security that every area can utilize toensure what we do meets the prescribed standards,guidelines, and utilizes best practices to deliver ourservices.
Keith BrownOur change managment process, our governance aroundvendor billing Bjorn Nilssen
Policies and procedures, portfolio reporting, andcompliance. Jacques Paul
More communication around strategy/vision to the masses.We are often approached about processes that may havebeen communicated to us but others insist they never knew
IT Org. Design & Staffing Assessment / Stark Industries, Inc.
OrganizationChart
IT Org. Design &Staffing Assessment
StaffingOverview
Time Allocationby Function
Time AllocationBy Function & People
TeamEngagement
Key Drivers Function Effectiveness
Staff AllocationWorksheet
Top Team SuggestionsTo Improve IT
Time AllocationBy Activity Type
Staffing Levelsvs. Effectiveness
ScorecardResults
Time AllocationAppendix
DepartmentalForecast Exercise 91

WHAT CAN BE IMPROVED?(START)
about it. At the moment, I can't think of specific examplesbut I know that it has happened and recently.
Sean EllisContinued build out of this function while implementingprocesses and procedures, best practices and tool set tosupplement the road-map.
Tim Jacobs
Streamlining processes or methods used amongst theTeam. As an example for the POS Projects, PM's wereusing different solutions or documents to capture similarinformation. Develop one document for one process toensure documentation was consistent.
Jacob Cohen refining of process. policies
Jason Forbes
I am thinking of this in terms of the standards committee,otherwise I am not involved. I think that the folks doingthis are extremely good communicators and negotiators,but they may not be that technical. That can be animpediment at times.They are also some of the brightest.
Steve Davis
The governance process and tool set is changing whiletraining and requirements to use these tools is lacking. ITStrategies are difficult to create let alone execute. Anexample is creating our mobile strategy. To make aneffective Mobile Strategy you need buy in from crossfunctional parts of the business. To get this buy in youneed a lot of input from across the business. Whilecreating the cross functional team was simple, getting theinput, contribution, and interest from the team wasdifficult. In addition the EUC Strategy took priority over theMobile Strategy, and rightfully so since the Mobile Strategyshould be inline and apart of the EUC Strategy. Once theEUC Strategy is completed we will be able to continue andcomplete the Mobile Strategy
WHAT ACTIVITY CAN BESTOPPED?
Jerry Mills* revise/reduce the number and level of participants in theBTPC John Andrews
Allowing any effort that is lacking a business valuemeasurement to pass through governance (ProductManagement gate). Delaying/canceling IT strategy work.
Daniel GrayEach IT group doing their own thing with no order ofgovernance and policies prevents the team to move forwardtogether.
Gail King
Each functional area not using standard processes toachieve similar requirements. Our nimble environmentallows the latitude to create tools and documentation.Pooling all of this knowledge centrally, in a formattedlibrary will allow us to continue to develop it for the longterm, and meet compliance standards when required.
Bjorn Nilssen Not much to stop, since Governance needs to be built up. Jacques PaulNot sure if anything can be stopped at the moment as it isall needed to ramp up to where we need to be.
Sean Ellis
Criticism of the governance process and the Clarizen tool.The is part of our IT Transformation and it will not happenover night. Instead of just complaining, help to determine asolution.
Tim JacobsNothing currently comes to mind. The Team is continuallyevolving so there is continual refinement of processes. Asan aside, hoping.
Jason ForbesI think that they do a good job. They need to forget aboutdivisional loyalties and a preference for the tools that theyare accustomed to, and focus on the big picture.
Steve DavisWaiting to bring IT into a project after their input is actuallyneeded and can make a difference.
FEEDBACK FROM OTHER IT STAFF
IT Org. Design & Staffing Assessment / Stark Industries, Inc.
OrganizationChart
IT Org. Design &Staffing Assessment
StaffingOverview
Time Allocationby Function
Time AllocationBy Function & People
TeamEngagement
Key Drivers Function Effectiveness
Staff AllocationWorksheet
Top Team SuggestionsTo Improve IT
Time AllocationBy Activity Type
Staffing Levelsvs. Effectiveness
ScorecardResults
Time AllocationAppendix
DepartmentalForecast Exercise 92
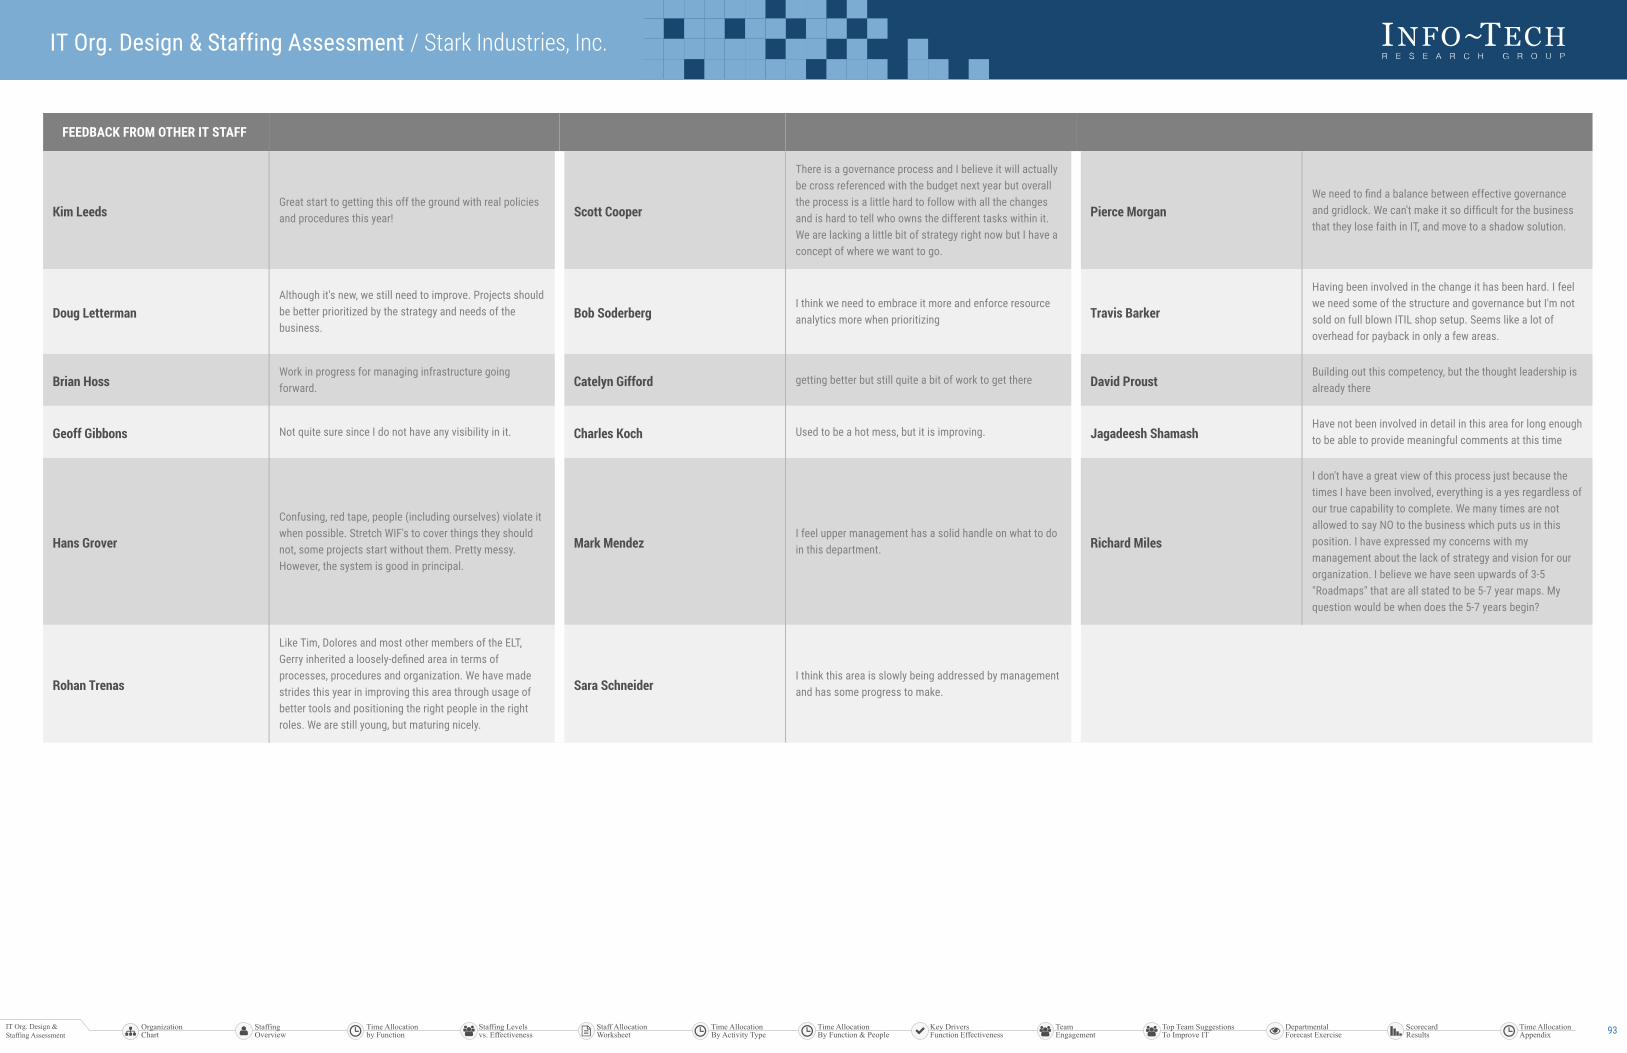
FEEDBACK FROM OTHER IT STAFF
Kim LeedsGreat start to getting this off the ground with real policiesand procedures this year! Scott Cooper
There is a governance process and I believe it will actuallybe cross referenced with the budget next year but overallthe process is a little hard to follow with all the changesand is hard to tell who owns the different tasks within it.We are lacking a little bit of strategy right now but I have aconcept of where we want to go.
Pierce MorganWe need to find a balance between effective governanceand gridlock. We can't make it so difficult for the businessthat they lose faith in IT, and move to a shadow solution.
Doug LettermanAlthough it's new, we still need to improve. Projects shouldbe better prioritized by the strategy and needs of thebusiness.
Bob SoderbergI think we need to embrace it more and enforce resourceanalytics more when prioritizing Travis Barker
Having been involved in the change it has been hard. I feelwe need some of the structure and governance but I'm notsold on full blown ITIL shop setup. Seems like a lot ofoverhead for payback in only a few areas.
Brian HossWork in progress for managing infrastructure goingforward. Catelyn Gifford getting better but still quite a bit of work to get there David Proust
Building out this competency, but the thought leadership isalready there
Geoff Gibbons Not quite sure since I do not have any visibility in it. Charles Koch Used to be a hot mess, but it is improving. Jagadeesh ShamashHave not been involved in detail in this area for long enoughto be able to provide meaningful comments at this time
Hans Grover
Confusing, red tape, people (including ourselves) violate itwhen possible. Stretch WIF's to cover things they shouldnot, some projects start without them. Pretty messy.However, the system is good in principal.
Mark MendezI feel upper management has a solid handle on what to doin this department. Richard Miles
I don't have a great view of this process just because thetimes I have been involved, everything is a yes regardless ofour true capability to complete. We many times are notallowed to say NO to the business which puts us in thisposition. I have expressed my concerns with mymanagement about the lack of strategy and vision for ourorganization. I believe we have seen upwards of 3-5"Roadmaps" that are all stated to be 5-7 year maps. Myquestion would be when does the 5-7 years begin?
Rohan Trenas
Like Tim, Dolores and most other members of the ELT,Gerry inherited a loosely-defined area in terms ofprocesses, procedures and organization. We have madestrides this year in improving this area through usage ofbetter tools and positioning the right people in the rightroles. We are still young, but maturing nicely.
Sara SchneiderI think this area is slowly being addressed by managementand has some progress to make.
IT Org. Design & Staffing Assessment / Stark Industries, Inc.
OrganizationChart
IT Org. Design &Staffing Assessment
StaffingOverview
Time Allocationby Function
Time AllocationBy Function & People
TeamEngagement
Key Drivers Function Effectiveness
Staff AllocationWorksheet
Top Team SuggestionsTo Improve IT
Time AllocationBy Activity Type
Staffing Levelsvs. Effectiveness
ScorecardResults
Time AllocationAppendix
DepartmentalForecast Exercise 93
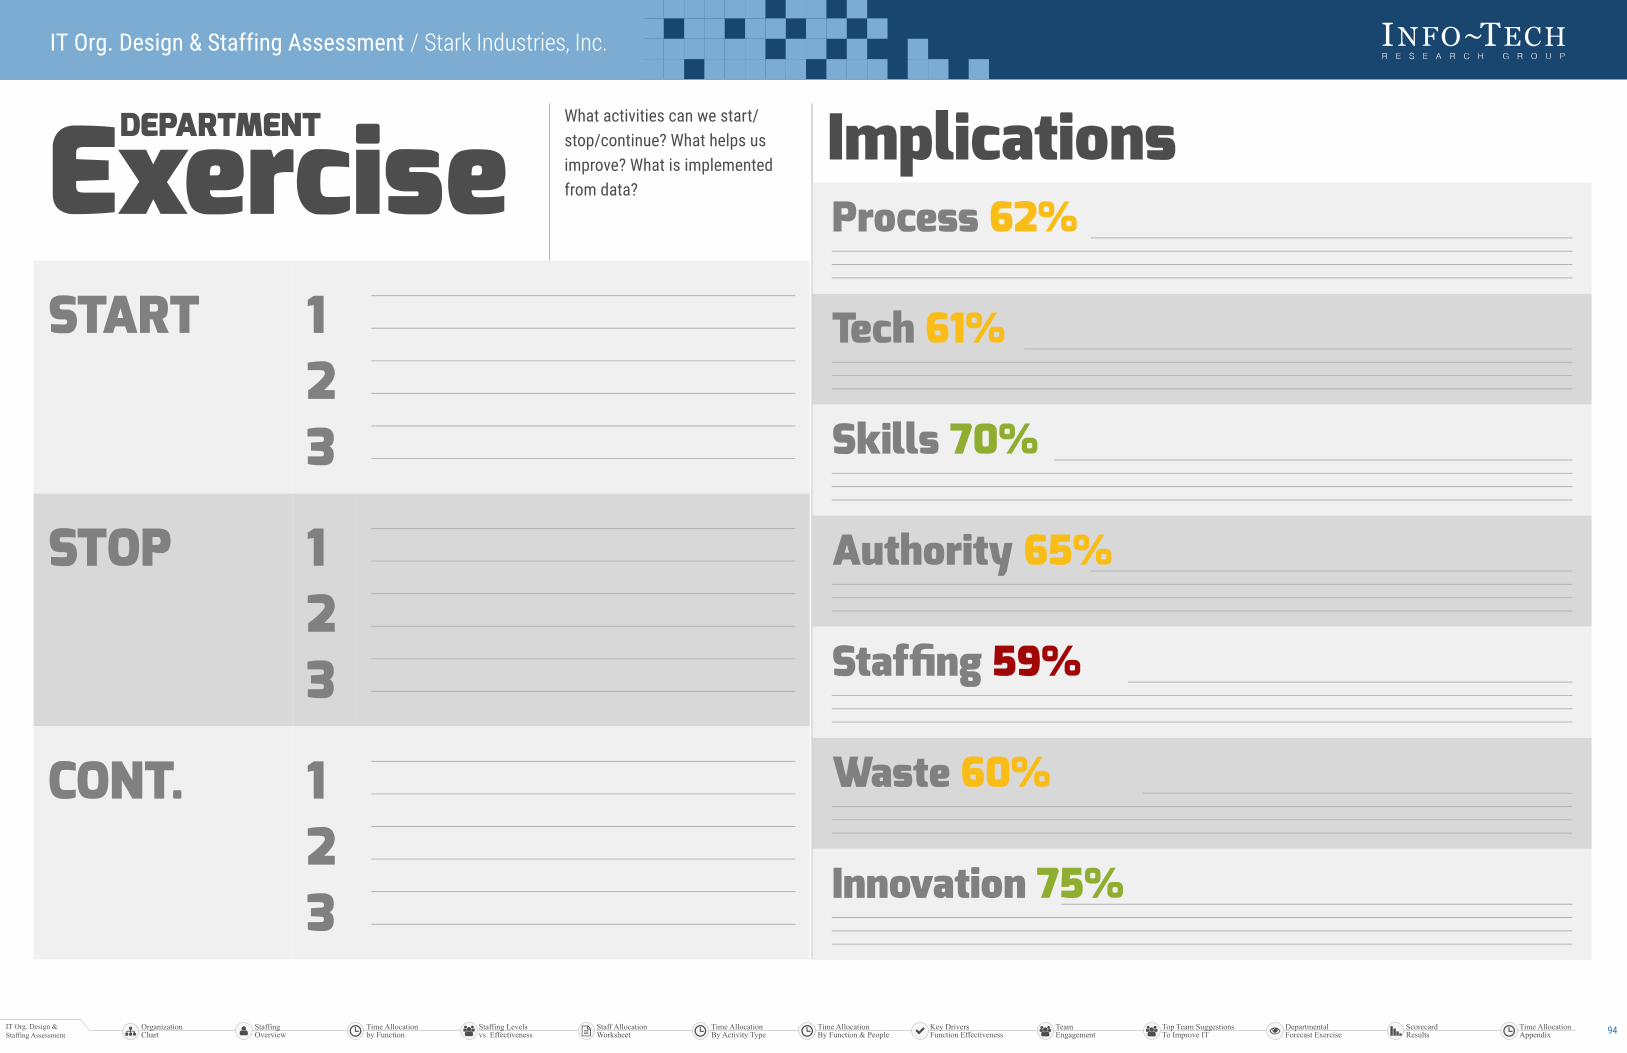
DEPARTMENTExerciseWhat activities can we start/stop/continue? What helps usimprove? What is implementedfrom data?
START 123
STOP 123
CONT. 123
ImplicationsProcess 62%
Tech 61%
Skills 70%
Authority 65%
Staffing 59%
Waste 60%
Innovation 75%
IT Org. Design & Staffing Assessment / Stark Industries, Inc.
OrganizationChart
IT Org. Design &Staffing Assessment
StaffingOverview
Time Allocationby Function
Time AllocationBy Function & People
TeamEngagement
Key Drivers Function Effectiveness
Staff AllocationWorksheet
Top Team SuggestionsTo Improve IT
Time AllocationBy Activity Type
Staffing Levelsvs. Effectiveness
ScorecardResults
Time AllocationAppendix
DepartmentalForecast Exercise 94

InnovationFunction EffectivenessUse this Function Effectiveness Scorecard to evaluate IT staff perceptions of effectivenessacross 7 key drivers, as well as overall.
Compare the team’s own assessment with the rest of IT’s, as well as the business’s (if applicable).This scorecard can be used as part of an alignment exercise to better understand team concerns.
“Satisfied” is the % of respondents who scored the area 8/10 or above. “Neutral” is the % ofrespondents who scored the area 7/10. “Not Satisfied” is the % of respondents who scored thearea 6/10 or below. Each person represents 10% of respondents. If 2 people are shown under“Satisfied”, it means 20% of respondents scored the area 8/10 or higher.
Department Evaluation %39%
69%
Overall Team Effectiveness Business EvaluationIT Innovation Leadership
1.8#FTE
2%% OF TOTALSTAFF
0%HAVEDEDICATEDFOCUS
Senior ITManagement
Other IT Staff
58% 69%
13%
19%62%SATISFACTION
7thIMPORTANCE
NAME %
Carlos Sanchez 100%
Jim Jeffries 100%
Robert Red 80%
Dana White 30%
John Caesar 30%
Ryan Carter 30%
Processes &Procedures 56%
The Processes & Procedures I work withenable me to do my job effectively
Not Satisfied
Neutral
Satisfied
NAME %
Carlos Sanchez 100%
Jim Jeffries 100%
Jacob Cohen 90%
John Andrews 30%
Lawrence Philips 30%
John Caesar 20%
Technology 57%
The Technology I work with enables meto do my job effectively
Not Satisfied
Neutral
Satisfied
NAME %
Carlos Sanchez 100%
Jim Jeffries 100%
Jacob Cohen 90%
Dana White 20%
John Andrews 20%
John Caesar 20%
Skills 55%
My team has the right Skills to executeeffectively
Not Satisfied
Neutral
Satisfied
NAME %
Jim Jeffries 100%
Carlos Sanchez 90%
Jacob Cohen 90%
Jeanne Key 40%
Lawrence Philips 30%
John Andrews 20%
Absence ofOrg. Barriers 58%
My team is able to execute effectivelywithout organizational or PoliticalBarriers
Not Satisfied
Neutral
Satisfied
NAME %
Jim Jeffries 100%
Carlos Sanchez 90%
Robert Red 80%
Dana White 20%
John Andrews 20%
John Caesar 20%
Staffing Level 51%
My team has the appropriate StaffingLevel to executive effectively
Not Satisfied
Neutral
Satisfied
NAME %
Tom Tompkins 90%
Pierce Morgan 80%
Larry Wade 70%
Carlos Sanchez 10%
Jim Jeffries 10%
Robert Red 10%
Opportunityto ReduceWaste
52%
There is an opportunity to run this areamore efficiently through EliminatingWasteful or low-value activities
Low
Medium
High
NAME %
Dana White 100%
Steve Davis 100%
Tom Tompkins 90%
Lawrence Philips 30%
Jim Jeffries 10%
Robert Red 10%
Opportunityto Innovate 63%
There is an opportunity to run this areamore effectively by using Innovativeapproaches or solutions
Low
Medium
High
IT Org. Design & Staffing Assessment / Stark Industries, Inc.
OrganizationChart
IT Org. Design &Staffing Assessment
StaffingOverview
Time Allocationby Function
Time AllocationBy Function & People
TeamEngagement
Key Drivers Function Effectiveness
Staff AllocationWorksheet
Top Team SuggestionsTo Improve IT
Time AllocationBy Activity Type
Staffing Levelsvs. Effectiveness
ScorecardResults
Time AllocationAppendix
DepartmentalForecast Exercise 109

Innovation Feedback IT staff in this area have provided their feedback on how to improve management of this areathrough Stop/Start/Continue suggestions. The right column also contains feedback fromoutside this area. Use this information to run a team feedback session or for improvementideas.
MOST VALUABLE ACTIONS(CONTINUE)
Dana WhiteMentoring managers on how to drive process improvementacross the organization John Andrews
Aligning our activities with the business systems roadmap(transformation as innovation). Scott Cooper Business Intelligence
Tom TompkinsI will drive this through a communicated mission andvalues statement and creating a discipline within theteam.
Carlos Sanchez Helping in the implementation of new ideas. Robert Red current is truck backup cameras onto the the tablets.
Steve Davis Value changes depending on the daily priority.
WHAT CAN BE IMPROVED?(START)
Dana Whiteneed a methodology for process improvement andtechnology innovation "speed boats" for the business John Andrews
Innovation needs to be fostered. I would proposehackathons or other structured methodologies foridentifying innovation. We also need to let the vendormarketplace innovate on our behalf, so we need to beaware of the overall vendor community and adopt multi-vendor strategies where possible.
Lawrence PhilipsThere is no process in place (that I know off) that allows forinnovation
Scott CooperWe need to build a foundation that can support the localinnovation at the company level. This needs to be donewith proper governance and architecture.
Tom TompkinsWe need to exercise this muscle as it is not being used.This will be done by dedicate a portion of the week in'improvement' exercises.
Pierce Morgan
Foster a culture of innovation rather than a reactionaryresponse to business demand. Tighter business andindustry involvement to forecast the application of newtechnologies
Jacob Cohen maybe working towards an R&D team Carlos Sanchez
I think the team is always thinking of new ways to keep allareas of the company improving and increasing itsproductivity. As I mention before I believe that the onearea that needs improvement is communication.
Ryan CarterKeep employees trained with new technology. Incentive tokeep certifications and/or get promotions based oncertifications.
Robert Red Its innovation, the whole process is improvement. Steve Davis
Innovation seems to take the backseat to support. Whenproduction is down, they need the attention. I've called onTier III for support assistance and they have helped outwhen/where they can. What would be beneficial is findingtime and topics to continually train Tier III. Another helpwould be for an additional Technology Analyst to not onlybounce ideas but to assist with tasks and workflows. Thiswould be a great help especially if we worked out of thesame office.
WHAT ACTIVITY CAN BESTOPPED?
IT Org. Design & Staffing Assessment / Stark Industries, Inc.
OrganizationChart
IT Org. Design &Staffing Assessment
StaffingOverview
Time Allocationby Function
Time AllocationBy Function & People
TeamEngagement
Key Drivers Function Effectiveness
Staff AllocationWorksheet
Top Team SuggestionsTo Improve IT
Time AllocationBy Activity Type
Staffing Levelsvs. Effectiveness
ScorecardResults
Time AllocationAppendix
DepartmentalForecast Exercise 110

WHAT ACTIVITY CAN BESTOPPED?
Dana White projects that are not prioritized John Andrews Middleware integrations that do not scale Scott CooperContinue to build innovation in a not governed or designedarchitecture
Tom Tompkins Not making this a priority. Jacob Cohen testing in live environments.
FEEDBACK FROM OTHER IT STAFF
Kim Leeds Don't really feel that we have this as a formal IT function. Tom Hicks We don't really have a culture of IT innovation. Doug LettermanI believe the business is more innovative than we are mostof the time.
Jacques Paul
Due to lots of KTLO work and overallocation of resources, Ibelieve that IT innovation falls to the wayside. It becomesdifficult to take 30 minutes or an hour in your day to readarticles and reference materials to become more familiarwith innovative technologies.
Eric Davis
I have seen major advancements over the past 12 monthsas it relates to IT innovation over the past year. thereviewing of the SDWAN POC is a great example of an ITservice which will greatly aid us in our infrastructure
Bob Soderberg its good when we can...
Sean Ellis
Our industry and technical acumen make this a challenge.However, if we can find ways to build value for ourbusiness, then they will be more willing to work with us tomake it happen.
Brian HossI expect this to improve as we migrate to the new datacenter with newer hardware allowing for advanced toolingimproving current processes and procedures
Chris HuntI feel like things are moving in the right direction but couldbe improved.
David BowenI think SI IT does a good job of trying to stay ahead of the curve with our IT strategies and solutions. Charles Koch
What innovation, we try to be innovate things, like dataarchiving and DR. But there is always push back. "Oh wecan do that a later date"
Hans Grover
We are trying new things such as ESB which is nice.Problem is we are trying to fit a square peg in a hole wedon't know what the shape is because we are reacting toprioritizes and worry about getting dates without scope,then cramming the square peg in the "oh crap, we ran out oftime" hole in the end.
Tony LewisI think we are lacking in this area not because we dontknow, but the time and resources to come up with newideas is not readily available.
Mark MendezI see some things happening that appear to be in the nameof IT Innovation. But I can't speak to their success. Amy Burke
We help support and introduce innovation but usually this isalways business driven, should be IT also
Paul Van DykeNew method for deploying pcs is currently a work inprogress but it is moving in the right direction. James Butler Willing to at least look at new IT. Peter Daley New TrackIT tablet system is a pretty good example !
Richard Miles
We should be phasing out custom built applications to more standardized product sets. We are not staffed properly to manage a large number of applications that are specifically customized to Stark.
Rohan Trenas
I believe the ELT supports ideas and recommendations forinnovative change. I haven't encountered a member of theELT who wasn't willing to lend an ear or time torecommendations and that is good to see. The fact thatthe ELT realizes the improvement/maturity effort is aboutteamwork and not themselves is refreshing.
IT Org. Design & Staffing Assessment / Stark Industries, Inc.
OrganizationChart
IT Org. Design &Staffing Assessment
StaffingOverview
Time Allocationby Function
Time AllocationBy Function & People
TeamEngagement
Key Drivers Function Effectiveness
Staff AllocationWorksheet
Top Team SuggestionsTo Improve IT
Time AllocationBy Activity Type
Staffing Levelsvs. Effectiveness
ScorecardResults
Time AllocationAppendix
DepartmentalForecast Exercise 111

DEPARTMENTExerciseWhat activities can we start/stop/continue? What helps usimprove? What is implementedfrom data?
START 123
STOP 123
CONT. 123
ImplicationsProcess 56%
Tech 57%
Skills 55%
Authority 58%
Staffing 51%
Waste 52%
Innovation 63%
IT Org. Design & Staffing Assessment / Stark Industries, Inc.
OrganizationChart
IT Org. Design &Staffing Assessment
StaffingOverview
Time Allocationby Function
Time AllocationBy Function & People
TeamEngagement
Key Drivers Function Effectiveness
Staff AllocationWorksheet
Top Team SuggestionsTo Improve IT
Time AllocationBy Activity Type
Staffing Levelsvs. Effectiveness
ScorecardResults
Time AllocationAppendix
DepartmentalForecast Exercise 112
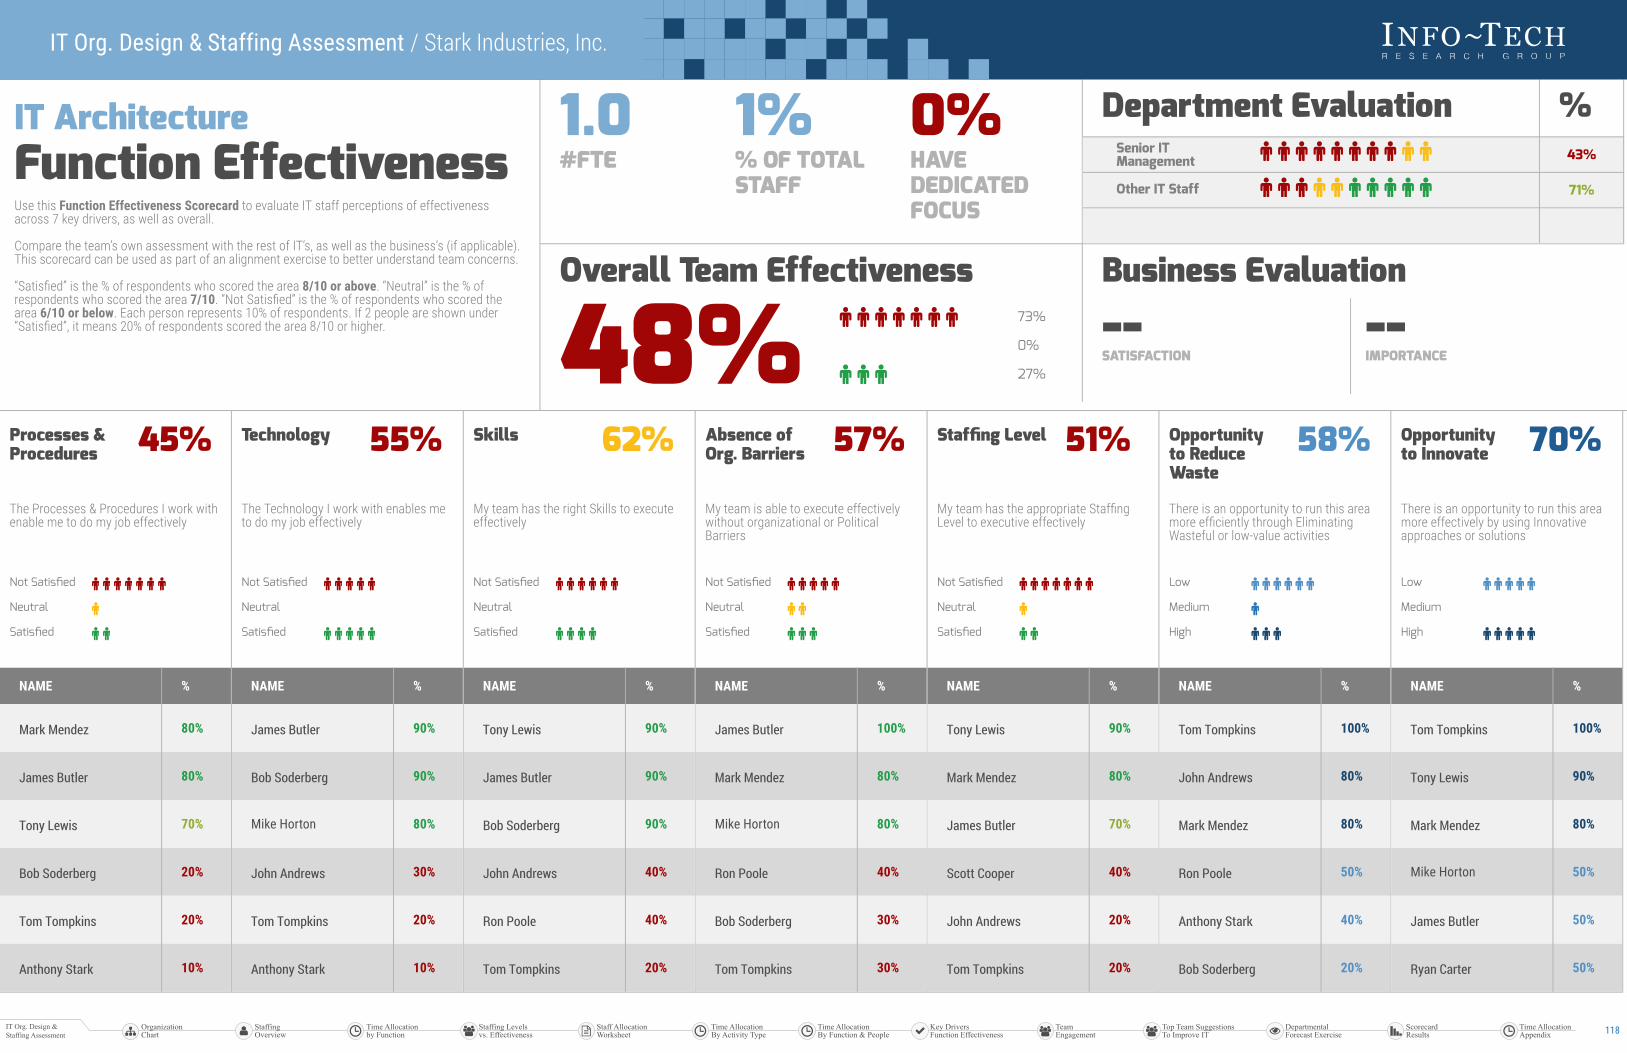
IT ArchitectureFunction EffectivenessUse this Function Effectiveness Scorecard to evaluate IT staff perceptions of effectivenessacross 7 key drivers, as well as overall.
Compare the team’s own assessment with the rest of IT’s, as well as the business’s (if applicable).This scorecard can be used as part of an alignment exercise to better understand team concerns.
“Satisfied” is the % of respondents who scored the area 8/10 or above. “Neutral” is the % ofrespondents who scored the area 7/10. “Not Satisfied” is the % of respondents who scored thearea 6/10 or below. Each person represents 10% of respondents. If 2 people are shown under“Satisfied”, it means 20% of respondents scored the area 8/10 or higher.
Department Evaluation %43%
71%
Overall Team Effectiveness Business Evaluation
1.0#FTE
1%% OF TOTALSTAFF
0%HAVEDEDICATEDFOCUS
Senior ITManagement
Other IT Staff
48% 73%
0%
27%
--SATISFACTION
--IMPORTANCE
NAME %
Mark Mendez 80%
James Butler 80%
Tony Lewis 70%
Bob Soderberg 20%
Tom Tompkins 20%
Anthony Stark 10%
Processes &Procedures 45%
The Processes & Procedures I work withenable me to do my job effectively
Not Satisfied
Neutral
Satisfied
NAME %
James Butler 90%
Bob Soderberg 90%
Mike Horton 80%
John Andrews 30%
Tom Tompkins 20%
Anthony Stark 10%
Technology 55%
The Technology I work with enables meto do my job effectively
Not Satisfied
Neutral
Satisfied
NAME %
Tony Lewis 90%
James Butler 90%
Bob Soderberg 90%
John Andrews 40%
Ron Poole 40%
Tom Tompkins 20%
Skills 62%
My team has the right Skills to executeeffectively
Not Satisfied
Neutral
Satisfied
NAME %
James Butler 100%
Mark Mendez 80%
Mike Horton 80%
Ron Poole 40%
Bob Soderberg 30%
Tom Tompkins 30%
Absence ofOrg. Barriers 57%
My team is able to execute effectivelywithout organizational or PoliticalBarriers
Not Satisfied
Neutral
Satisfied
NAME %
Tony Lewis 90%
Mark Mendez 80%
James Butler 70%
Scott Cooper 40%
John Andrews 20%
Tom Tompkins 20%
Staffing Level 51%
My team has the appropriate StaffingLevel to executive effectively
Not Satisfied
Neutral
Satisfied
NAME %
Tom Tompkins 100%
John Andrews 80%
Mark Mendez 80%
Ron Poole 50%
Anthony Stark 40%
Bob Soderberg 20%
Opportunityto ReduceWaste
58%
There is an opportunity to run this areamore efficiently through EliminatingWasteful or low-value activities
Low
Medium
High
NAME %
Tom Tompkins 100%
Tony Lewis 90%
Mark Mendez 80%
Mike Horton 50%
James Butler 50%
Ryan Carter 50%
Opportunityto Innovate 70%
There is an opportunity to run this areamore effectively by using Innovativeapproaches or solutions
Low
Medium
High
IT Org. Design & Staffing Assessment / Stark Industries, Inc.
OrganizationChart
IT Org. Design &Staffing Assessment
StaffingOverview
Time Allocationby Function
Time AllocationBy Function & People
TeamEngagement
Key Drivers Function Effectiveness
Staff AllocationWorksheet
Top Team SuggestionsTo Improve IT
Time AllocationBy Activity Type
Staffing Levelsvs. Effectiveness
ScorecardResults
Time AllocationAppendix
DepartmentalForecast Exercise 118
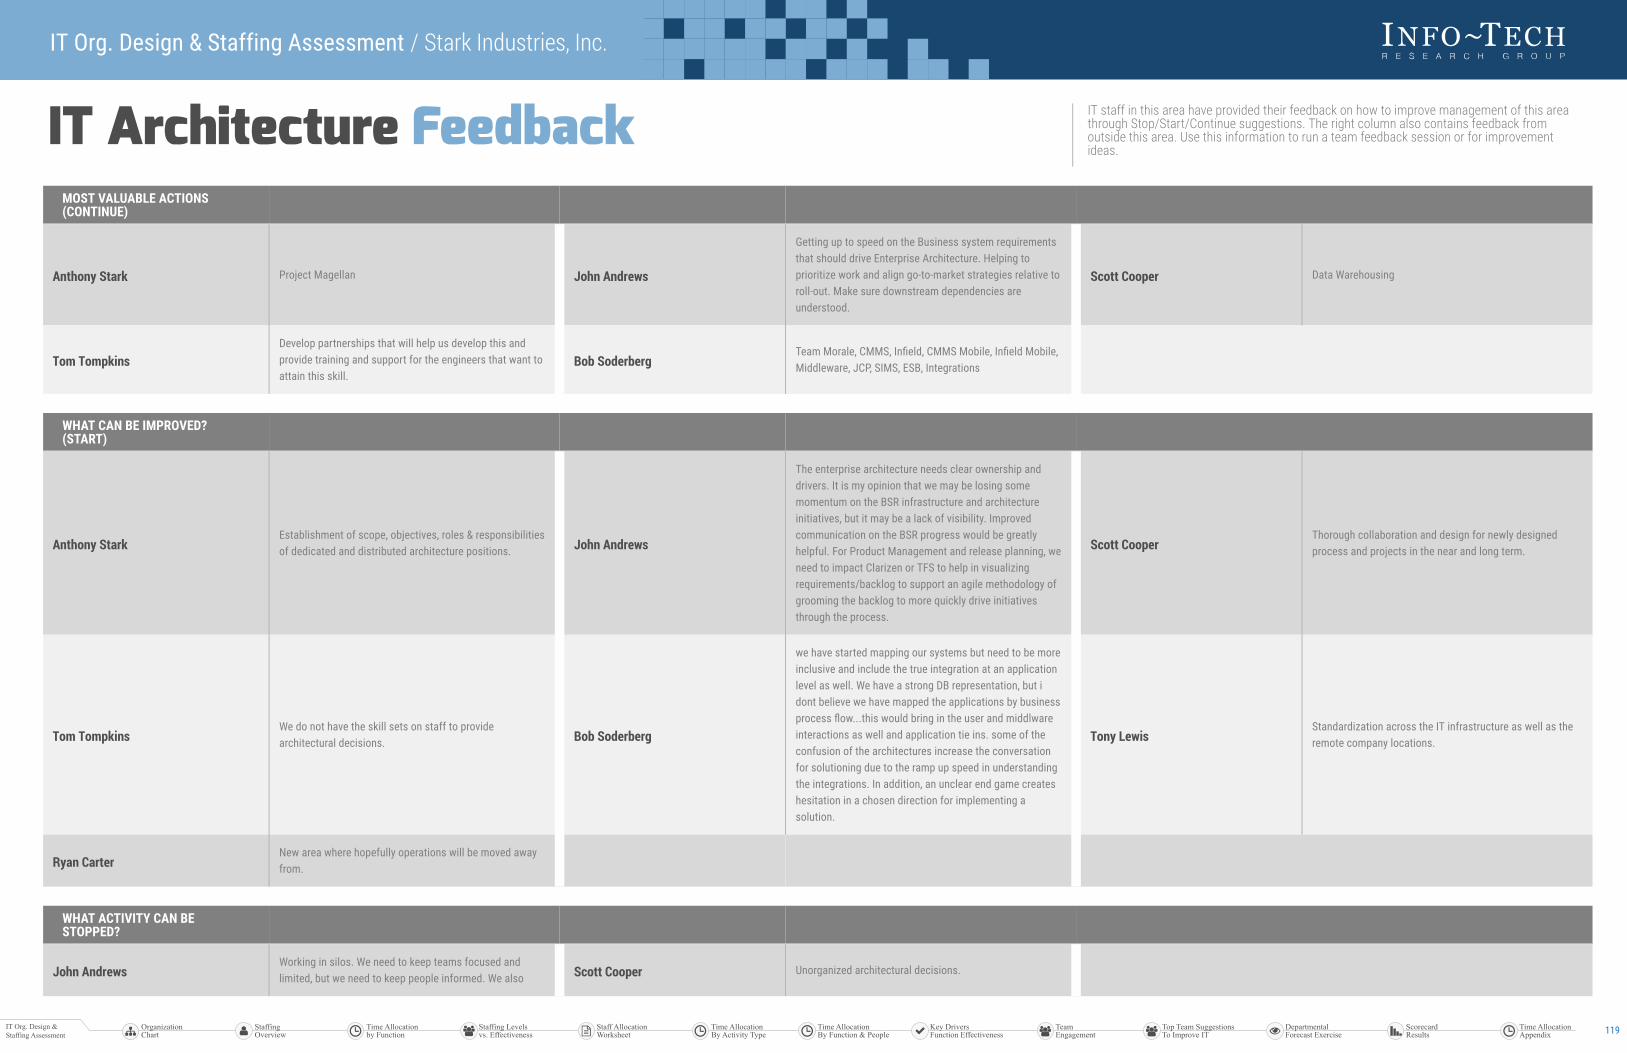
IT Architecture Feedback IT staff in this area have provided their feedback on how to improve management of this areathrough Stop/Start/Continue suggestions. The right column also contains feedback fromoutside this area. Use this information to run a team feedback session or for improvementideas.
MOST VALUABLE ACTIONS(CONTINUE)
Anthony Stark Project Magellan John Andrews
Getting up to speed on the Business system requirementsthat should drive Enterprise Architecture. Helping toprioritize work and align go-to-market strategies relative toroll-out. Make sure downstream dependencies areunderstood.
Scott Cooper Data Warehousing
Tom TompkinsDevelop partnerships that will help us develop this andprovide training and support for the engineers that want toattain this skill.
Bob SoderbergTeam Morale, CMMS, Infield, CMMS Mobile, Infield Mobile,Middleware, JCP, SIMS, ESB, Integrations
WHAT CAN BE IMPROVED?(START)
Anthony StarkEstablishment of scope, objectives, roles & responsibilitiesof dedicated and distributed architecture positions. John Andrews
The enterprise architecture needs clear ownership anddrivers. It is my opinion that we may be losing somemomentum on the BSR infrastructure and architectureinitiatives, but it may be a lack of visibility. Improvedcommunication on the BSR progress would be greatlyhelpful. For Product Management and release planning, weneed to impact Clarizen or TFS to help in visualizingrequirements/backlog to support an agile methodology ofgrooming the backlog to more quickly drive initiativesthrough the process.
Scott CooperThorough collaboration and design for newly designedprocess and projects in the near and long term.
Tom TompkinsWe do not have the skill sets on staff to providearchitectural decisions. Bob Soderberg
we have started mapping our systems but need to be moreinclusive and include the true integration at an applicationlevel as well. We have a strong DB representation, but idont believe we have mapped the applications by businessprocess flow...this would bring in the user and middlwareinteractions as well and application tie ins. some of theconfusion of the architectures increase the conversationfor solutioning due to the ramp up speed in understandingthe integrations. In addition, an unclear end game createshesitation in a chosen direction for implementing asolution.
Tony LewisStandardization across the IT infrastructure as well as theremote company locations.
Ryan CarterNew area where hopefully operations will be moved awayfrom.
WHAT ACTIVITY CAN BESTOPPED?
John AndrewsWorking in silos. We need to keep teams focused andlimited, but we need to keep people informed. We also Scott Cooper Unorganized architectural decisions.
IT Org. Design & Staffing Assessment / Stark Industries, Inc.
OrganizationChart
IT Org. Design &Staffing Assessment
StaffingOverview
Time Allocationby Function
Time AllocationBy Function & People
TeamEngagement
Key Drivers Function Effectiveness
Staff AllocationWorksheet
Top Team SuggestionsTo Improve IT
Time AllocationBy Activity Type
Staffing Levelsvs. Effectiveness
ScorecardResults
Time AllocationAppendix
DepartmentalForecast Exercise 119
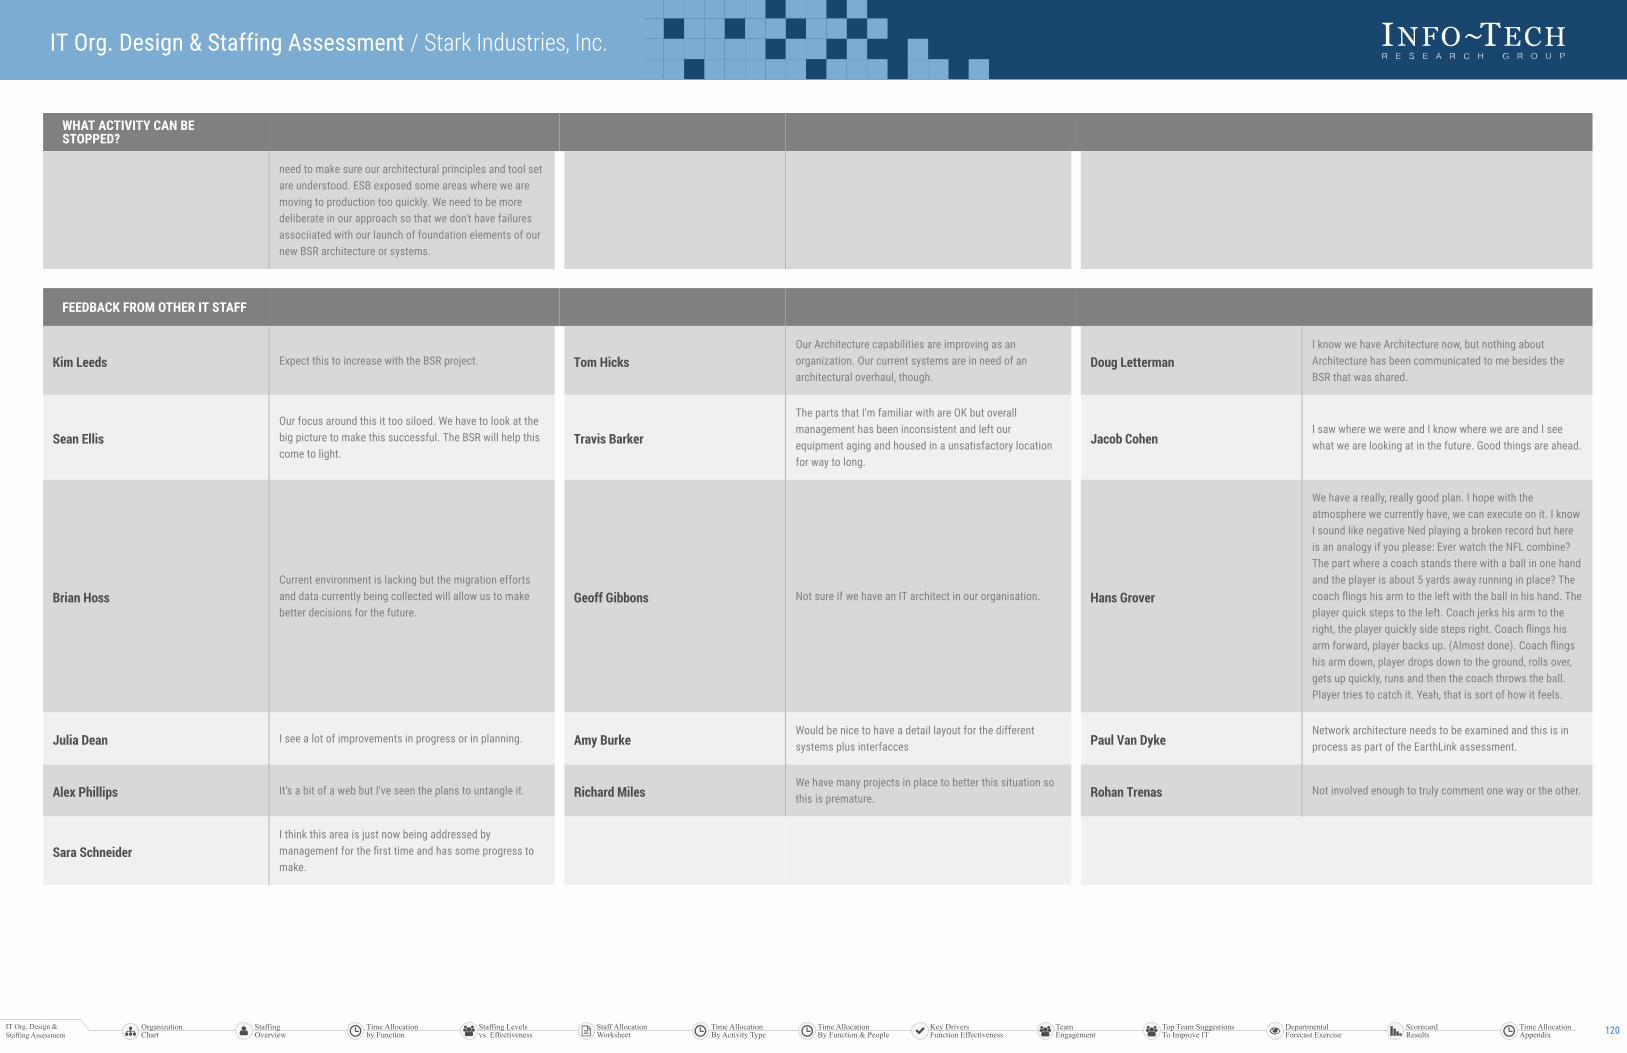
WHAT ACTIVITY CAN BESTOPPED?
need to make sure our architectural principles and tool setare understood. ESB exposed some areas where we aremoving to production too quickly. We need to be moredeliberate in our approach so that we don't have failuresassociiated with our launch of foundation elements of ournew BSR architecture or systems.
FEEDBACK FROM OTHER IT STAFF
Kim Leeds Expect this to increase with the BSR project. Tom HicksOur Architecture capabilities are improving as anorganization. Our current systems are in need of anarchitectural overhaul, though.
Doug LettermanI know we have Architecture now, but nothing aboutArchitecture has been communicated to me besides theBSR that was shared.
Sean EllisOur focus around this it too siloed. We have to look at thebig picture to make this successful. The BSR will help thiscome to light.
Travis Barker
The parts that I'm familiar with are OK but overallmanagement has been inconsistent and left ourequipment aging and housed in a unsatisfactory locationfor way to long.
Jacob CohenI saw where we were and I know where we are and I seewhat we are looking at in the future. Good things are ahead.
Brian HossCurrent environment is lacking but the migration effortsand data currently being collected will allow us to makebetter decisions for the future.
Geoff Gibbons Not sure if we have an IT architect in our organisation. Hans Grover
We have a really, really good plan. I hope with theatmosphere we currently have, we can execute on it. I knowI sound like negative Ned playing a broken record but hereis an analogy if you please: Ever watch the NFL combine?The part where a coach stands there with a ball in one handand the player is about 5 yards away running in place? Thecoach flings his arm to the left with the ball in his hand. Theplayer quick steps to the left. Coach jerks his arm to theright, the player quickly side steps right. Coach flings hisarm forward, player backs up. (Almost done). Coach flingshis arm down, player drops down to the ground, rolls over,gets up quickly, runs and then the coach throws the ball.Player tries to catch it. Yeah, that is sort of how it feels.
Julia Dean I see a lot of improvements in progress or in planning. Amy BurkeWould be nice to have a detail layout for the differentsystems plus interfacces Paul Van Dyke
Network architecture needs to be examined and this is inprocess as part of the EarthLink assessment.
Alex Phillips It's a bit of a web but I've seen the plans to untangle it. Richard MilesWe have many projects in place to better this situation sothis is premature. Rohan Trenas Not involved enough to truly comment one way or the other.
Sara SchneiderI think this area is just now being addressed bymanagement for the first time and has some progress tomake.
IT Org. Design & Staffing Assessment / Stark Industries, Inc.
OrganizationChart
IT Org. Design &Staffing Assessment
StaffingOverview
Time Allocationby Function
Time AllocationBy Function & People
TeamEngagement
Key Drivers Function Effectiveness
Staff AllocationWorksheet
Top Team SuggestionsTo Improve IT
Time AllocationBy Activity Type
Staffing Levelsvs. Effectiveness
ScorecardResults
Time AllocationAppendix
DepartmentalForecast Exercise 120

DEPARTMENTExerciseWhat activities can we start/stop/continue? What helps usimprove? What is implementedfrom data?
START 123
STOP 123
CONT. 123
ImplicationsProcess 45%
Tech 55%
Skills 62%
Authority 57%
Staffing 51%
Waste 58%
Innovation 70%
IT Org. Design & Staffing Assessment / Stark Industries, Inc.
OrganizationChart
IT Org. Design &Staffing Assessment
StaffingOverview
Time Allocationby Function
Time AllocationBy Function & People
TeamEngagement
Key Drivers Function Effectiveness
Staff AllocationWorksheet
Top Team SuggestionsTo Improve IT
Time AllocationBy Activity Type
Staffing Levelsvs. Effectiveness
ScorecardResults
Time AllocationAppendix
DepartmentalForecast Exercise 121