item 11 - ieee rrpa pnw adequacy 72712
TRANSCRIPT

Pacific NorthwestPacific NorthwestPacific NorthwestPacific NorthwestResource Adequacy StandardResource Adequacy Standardq yq y
John Fazio, NW Power and Conservation Council
IEEE RRPA Subcommittee
San Diego, CaliforniaSan Diego, California
July 27, 2012
OutlineOutline
• What is Resource Adequacy?q y
• The PNW Adequacy Standard• The PNW Adequacy Standard
• State of the System Report
• Current Assessment for the PNW
What is Resource Adequacy?What is Resource Adequacy?
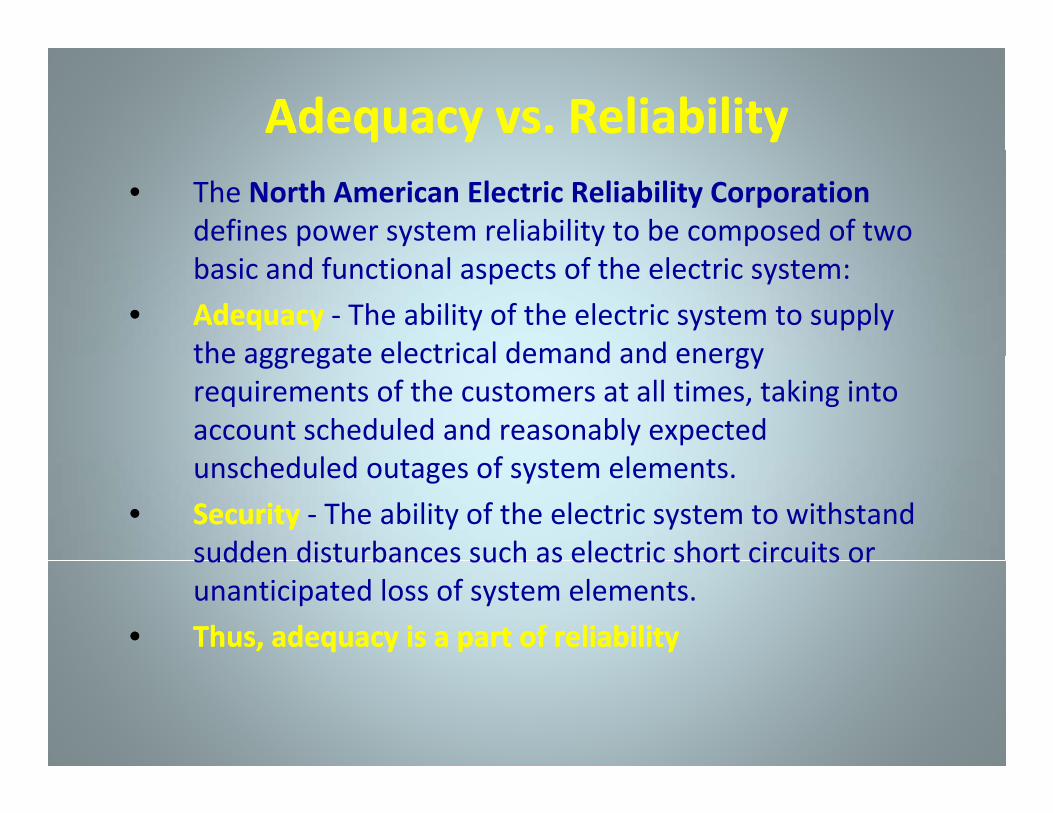
Adequacy vs. ReliabilityAdequacy vs. Reliability• The North American Electric Reliability Corporation
defines power system reliability to be composed of two basic and functional aspects of the electric system:
•• AdequacyAdequacy ‐ The ability of the electric system to supply the aggregate electrical demand and energythe aggregate electrical demand and energy requirements of the customers at all times, taking into account scheduled and reasonably expected
h d l d f lunscheduled outages of system elements.
•• SecuritySecurity ‐ The ability of the electric system to withstand sudden disturbances such as electric short circuits orsudden disturbances such as electric short circuits or unanticipated loss of system elements.
•• Thus, adequacy is a part of reliabilityThus, adequacy is a part of reliability
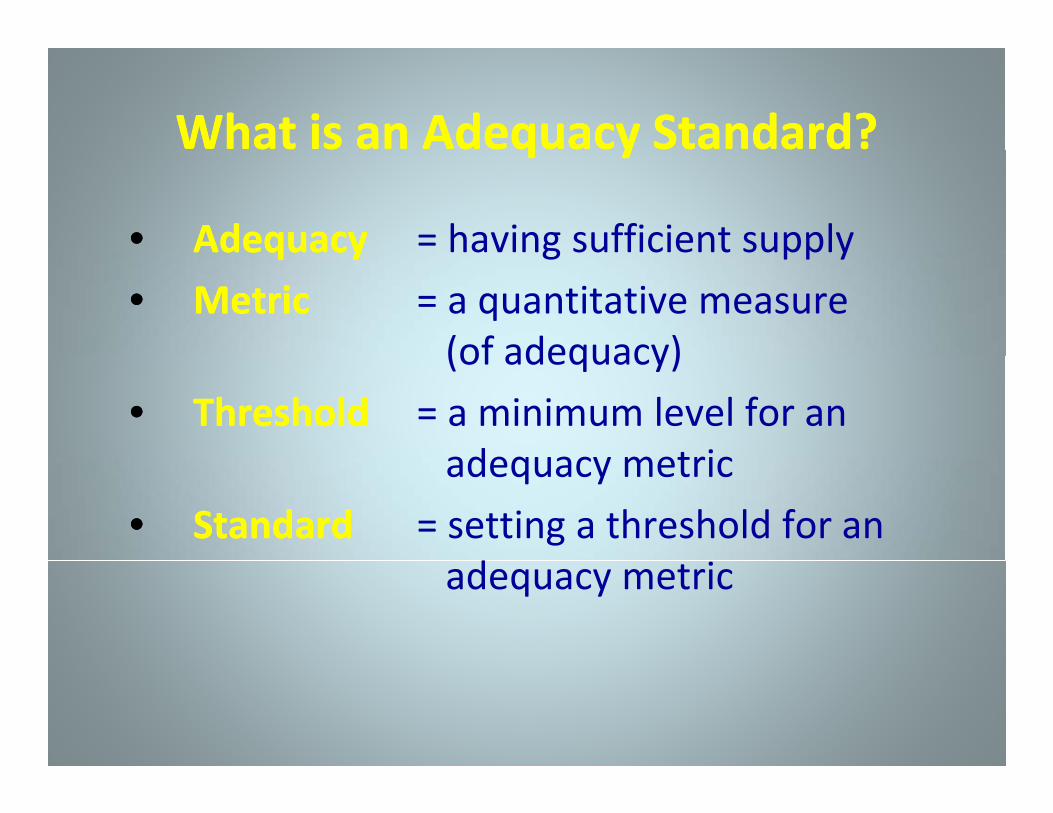
What is an Adequacy Standard?What is an Adequacy Standard?q yq y
•• AdequacyAdequacy = having sufficient supplyq yq y g pp y
•• MetricMetric = a quantitative measure(of adequacy)(of adequacy)
•• ThresholdThreshold = a minimum level for an adequacy metricadequacy metric
•• StandardStandard = setting a threshold for an dadequacy metric

Forum’s Adequacy MetricsForum’s Adequacy Metrics
Metric Description
LOLPLoss of load probability = number of games with a problem divided by the total number of gamesLOLP a problem divided by the total number of games
Use of StandbyNumber of games that dispatch standby resources at least once divided by total gamesConditional value at risk = average annual
CVaR (energy) Conditional value at risk = average annual curtailment for 5% worst games
CV R ( k)Conditional value at risk = average single-hour
il f % fCVaR (peak) curtailment for worst 5% of games
EUEExpected unserved energy = total curtailmentdivided by the total number of games
LOLHLoss of load hours= total number of hours of curtailment divided by total number of gamesLoss of load expectation = total number of
6
LOLEp
events divided by total number of games

Sample Adequacy ThresholdsSample Adequacy Thresholds
Metric Threshold
LOLP 5 percent (used in the PNW)
Use of Standby Not commonly used
CVaR (energy) No common threshold
CVaR (peak) No common thresholdCVaR (peak) No common threshold
EUE No common threshold
LOLH R t 2 4 h /LOLH Ranges up to 2.4 hours/year
LOLE 1 event/10 years or 0.1 event/year
7
Physical vs. Economic AdequacyPhysical vs. Economic Adequacy
•• PhysicalPhysical = “keeping the lights on”
•• EconomicEconomic = “keeping rates low and minimizing annual price fluctuations”
• Economic adequacy is generally a higher standard (e.g. more controllable supply)
• Economic adequacy is usually targeted in integrated resource plans (IRP)resource plans (IRP)
• Physical adequacy is an “early warning” when resource development falls short for unexpected reasons
The PNW Adequacy StandardThe PNW Adequacy Standard

The Pacific NW Adequacy StandardThe Pacific NW Adequacy Standardq yq y
• Is a physical standardp y
• Assumes no transmission outages
• Uses the LOLP metric• Uses the LOLP metric
• Sets a 5% threshold for the LOLP
• Assess adequacy 5 years out,assuming existing or expected resources (including conservation)
Interpretation of the StandardInterpretation of the Standardpp• The likelihood of having at least one curtailment** five
years into the future must be 5% or less for the power y psupply to be deemed adequate.
• Intended to be an early warning should resource development fall• Intended to be an early warning should resource development fall dangerously short
• Does not take economic factors into consideration• Not intended to be a resource needs assessment but could be usedNot intended to be a resource needs assessment but could be used
to support one• Used as a safeguard in the Council’s resource strategy model
** This represents a simulated curtailment. In reality, it represents the likelihood of having to take extraordinary measures to continue to provide service.
Adequacy Standard Methodology (1)Adequacy Standard Methodology (1)Adequacy Standard Methodology (1)Adequacy Standard Methodology (1)
• Use a chronological hourly Monte Carlo simulation computer model (GENESYS)
• Run many simulations (games) with different values for future unknown variables
• Future unknown variables include:• Water supply• Temperature (load) variation• Wind generation• Wind generation• Forced outages
Adequacy Standard Methodology (2)Adequacy Standard Methodology (2)Adequacy Standard Methodology (2)Adequacy Standard Methodology (2)• Model the transmission capacities of:p
• East‐west regional interties• NW to SW interties• NW to Canada interties
• Include an amount of market supply that pp ywe are reasonably sure will be available
• Simulate the operation over every hour of every month
Adequacy Standard Methodology (3)Adequacy Standard Methodology (3)Adequacy Standard Methodology (3) Adequacy Standard Methodology (3) • Any game in which at least one curtailment
i id d “b d”occurs is considered a “bad” game• LOLP = number of bad games divided by the
total number of gamestotal number of games• The number of curtailments per game and the
magnitude of curtailments do notdo not affect LOLPmagnitude of curtailments do not do not affect LOLP• A State of the System report provides more
detailed information about the power supplydetailed information about the power supply, which includes frequency and magnitude
The State of the System ReportThe State of the System Reporty py p
The State of the System ReportThe State of the System ReportThe State of the System ReportThe State of the System Report
• LOLP value and adequacy statusq y
• Values for additional adequacy metrics
• Monthly breakdown of LOLP• Monthly breakdown of LOLP
• Monthly and hourly use of resources and market supply
• Curtailment statistics

DRAFT DRAFT Adequacy Assessment for 2015Adequacy Assessment for 2015(Not for Distribution)(Not for Distribution)(Not for Distribution)(Not for Distribution)
Metric Value Units Threshold
LOLP 0.93% Percent 5%
Use of Standby 1 1% Percent N/AUse of Standby 1.1% Percent N/A
CVaR (energy) 6,968 MW-hours N/A
CVaR (peak) 516 MW N/A
EUE 348 MW-hours N/A
LOLH 0.3 Hours/year 0.8 to 2.4
LOLE 0.02 Events/year 0.1
17
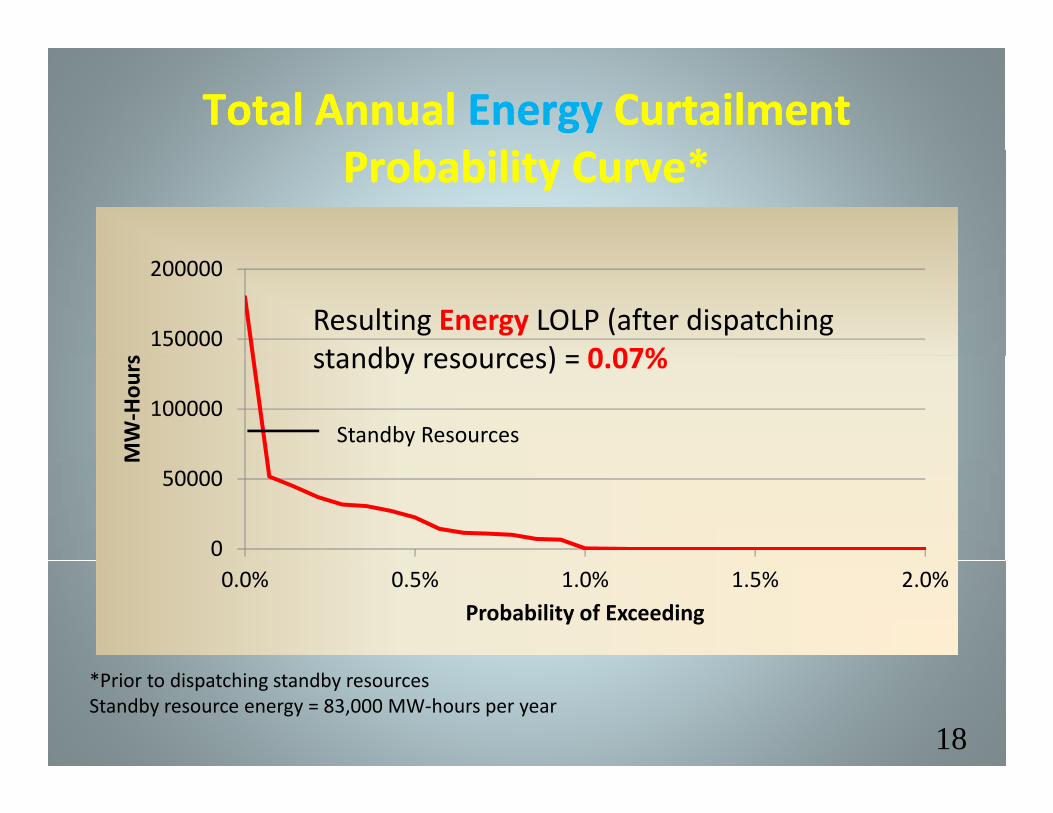
Total Annual Total Annual EnergyEnergy Curtailment Curtailment b bili *b bili *Probability Curve*Probability Curve*
150000
200000
Resulting Energy LOLP (after dispatching standby resources) = 0 07%
100000
MW‐Hou
rs standby resources) = 0.07%
Standby Resources
0
50000
M
0.0% 0.5% 1.0% 1.5% 2.0%Probability of Exceeding
18
*Prior to dispatching standby resourcesStandby resource energy = 83,000 MW‐hours per year
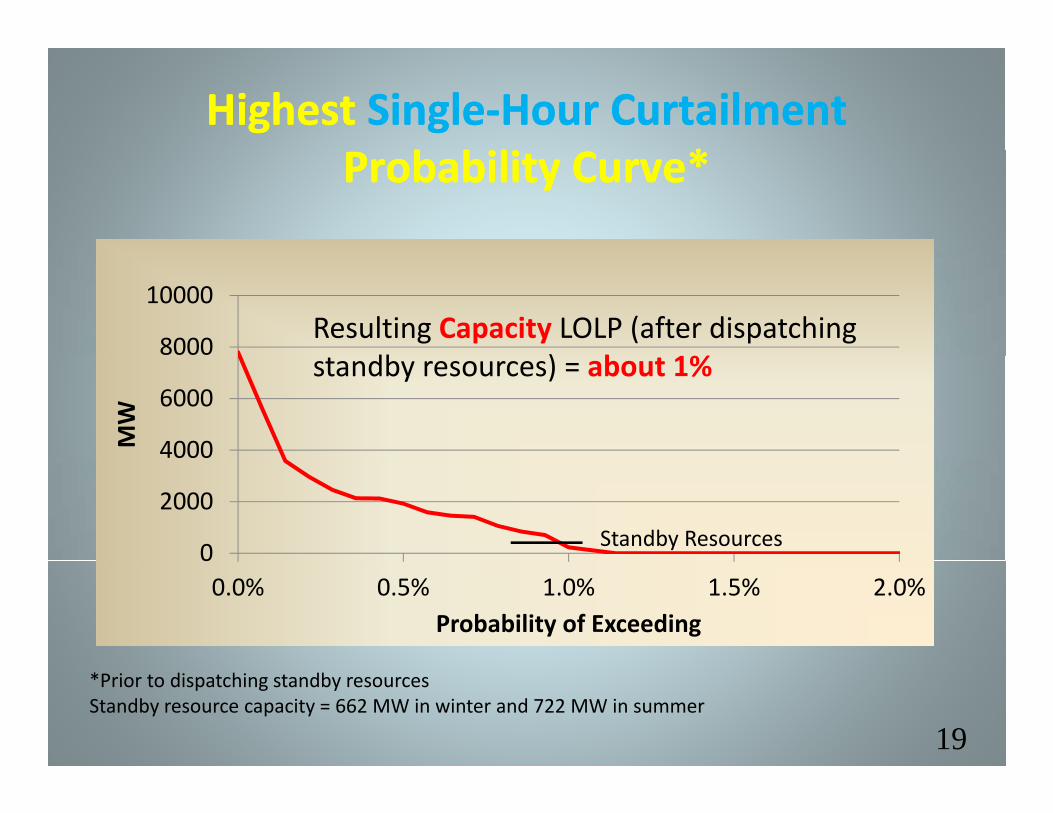
Highest Highest SingleSingle‐‐Hour Curtailment Hour Curtailment b bili *b bili *Probability Curve*Probability Curve*
8000
10000Resulting Capacity LOLP (after dispatching
db ) b %
4000
6000
MW
standby resources) = about 1%
0
2000
000
Standby Resources00.0% 0.5% 1.0% 1.5% 2.0%
Probability of Exceeding
19
*Prior to dispatching standby resourcesStandby resource capacity = 662 MW in winter and 722 MW in summer
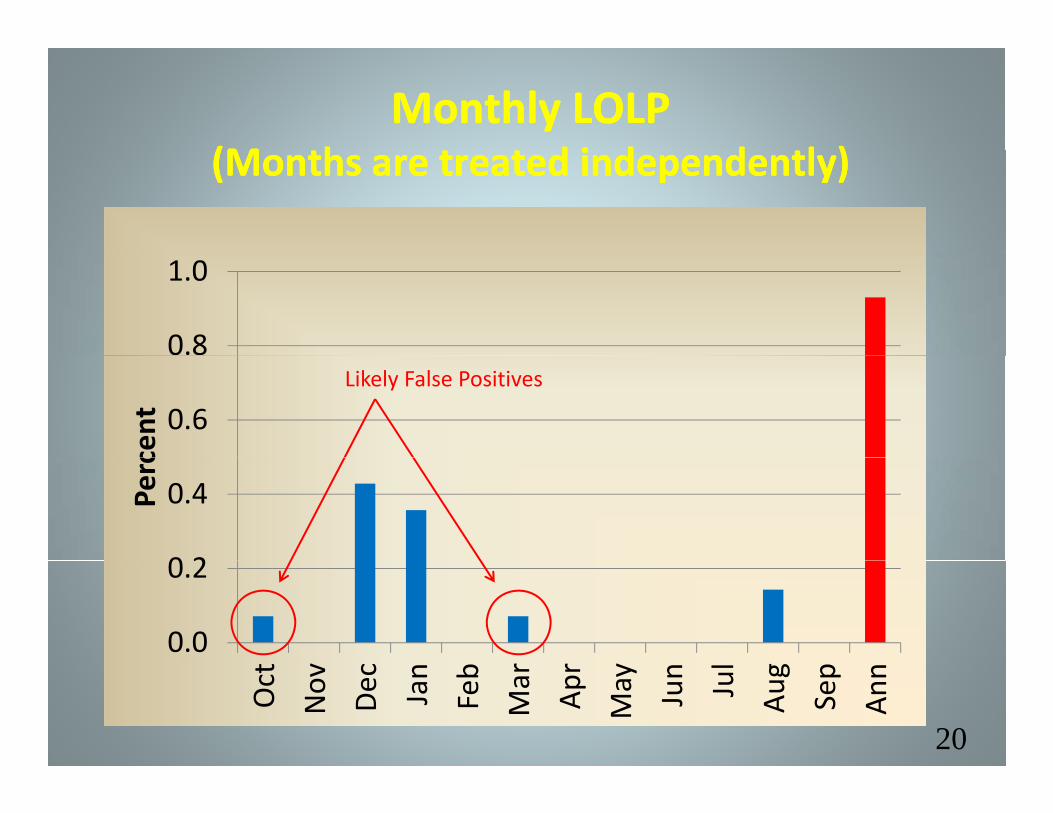
Monthly LOLPMonthly LOLP(M h d i d d l )(M h d i d d l )(Months are treated independently)(Months are treated independently)
0.8
1.0
0.6
cent
Likely False Positives
0 2
0.4Perc
0.0
0.2
20
Oct
Nov Dec Jan
Feb
Mar
Apr
May Jun Jul
Aug Sep
Ann
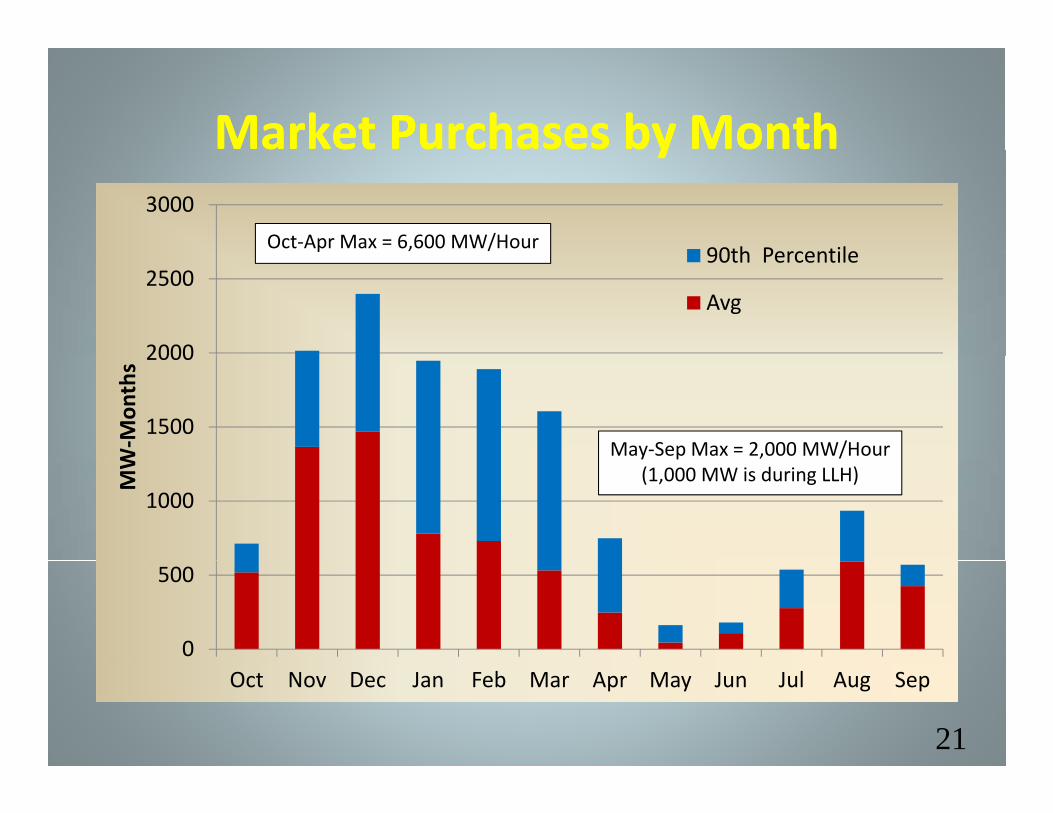
Market Purchases by MonthMarket Purchases by Monthyy3000
90th PercentileOct‐Apr Max = 6,600 MW/Hour
2000
250090th Percentile
Avg
1500
2000
W‐M
onths
May‐Sep Max = 2,000 MW/Hour
1000
MW
y p , /(1,000 MW is during LLH)
0
500
21
Oct Nov Dec Jan Feb Mar Apr May Jun Jul Aug Sep
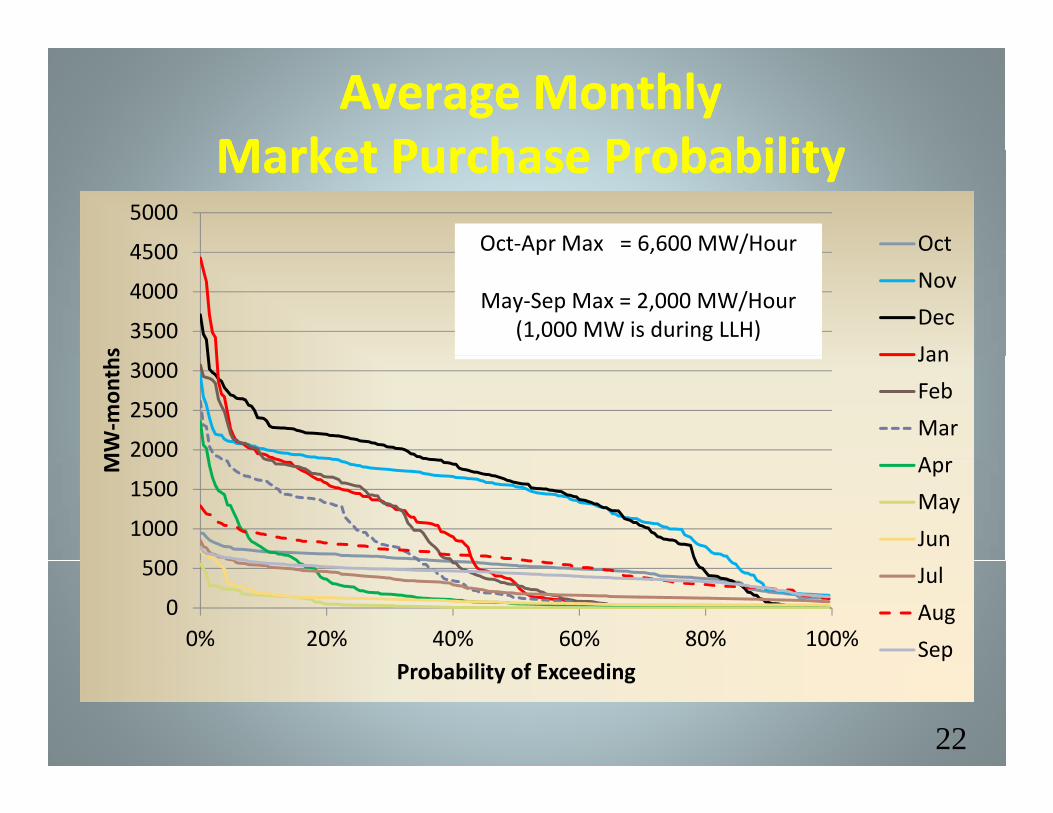
Average Monthly Average Monthly Market Purchase ProbabilityMarket Purchase ProbabilityMarket Purchase ProbabilityMarket Purchase Probability
4500
5000OctOct‐Apr Max = 6,600 MW/Hour
3500
4000
4500
s
Nov
Dec
Jan
p , /
May‐Sep Max = 2,000 MW/Hour(1,000 MW is during LLH)
2000
2500
3000
MW‐m
onths Jan
Feb
Mar
A
500
1000
1500
M Apr
May
Jun
0
500
0% 20% 40% 60% 80% 100%b b l f d
Jul
Aug
Sep
22
Probability of Exceeding
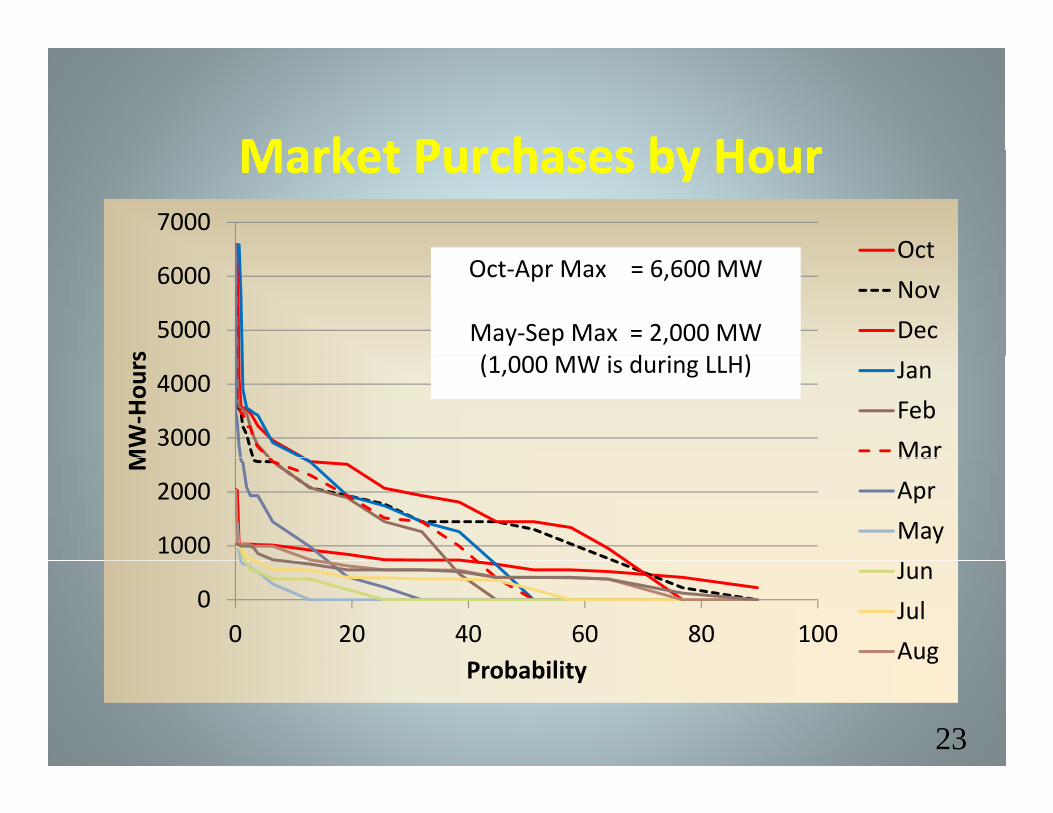
Market Purchases by HourMarket Purchases by HourMarket Purchases by HourMarket Purchases by Hour7000
Oct
5000
6000
s
Oct
Nov
Dec
Oct‐Apr Max = 6,600 MW
May‐Sep Max = 2,000 MW( d )
3000
4000
MW‐Hou
rs Jan
Feb
Mar
(1,000 MW is during LLH)
1000
2000
M Mar
Apr
May
00 20 40 60 80 100
P b bilit
Jun
Jul
Aug
23
Probabilityg
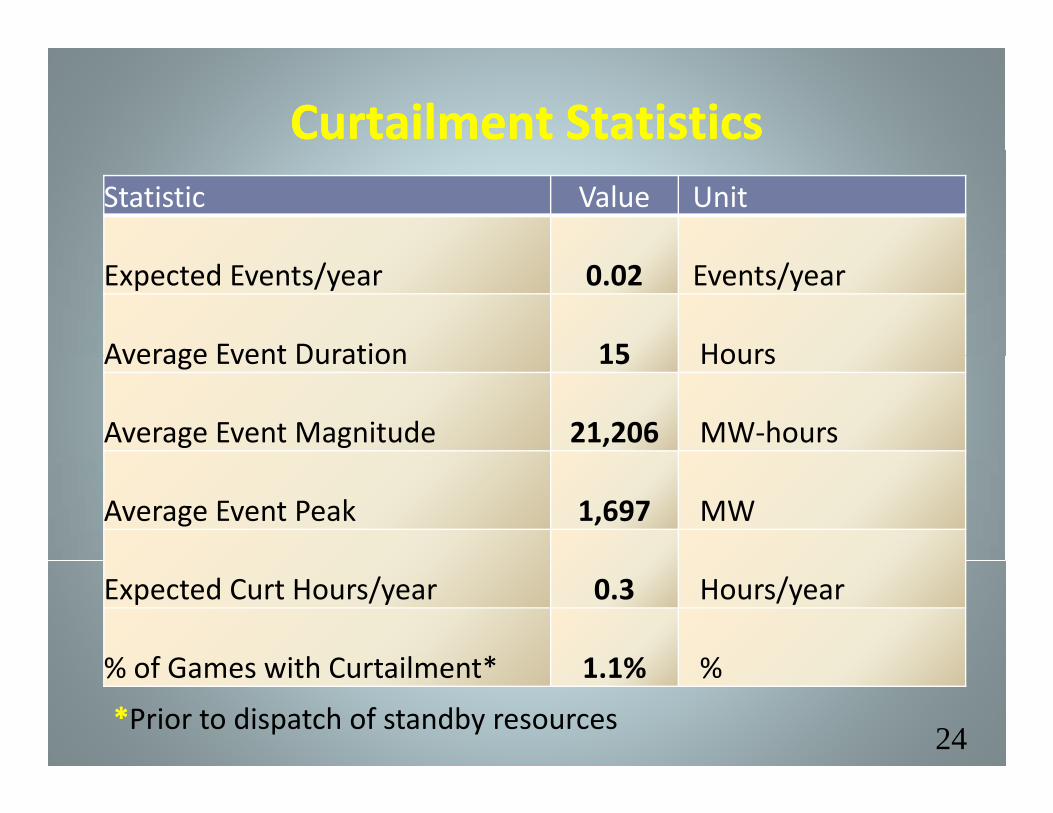
Curtailment StatisticsCurtailment StatisticsStatistic Value Unit
Expected Events/year 0.02 Events/year
Average Event Duration 15 HoursAverage Event Duration 15 Hours
Average Event Magnitude 21,206 MW‐hours
Average Event Peak 1,697 MW
Expected Curt Hours/year 0.3 Hours/year
% of Games with Curtailment* 1 1% %% of Games with Curtailment* 1.1% %
24**Prior to dispatch of standby resources
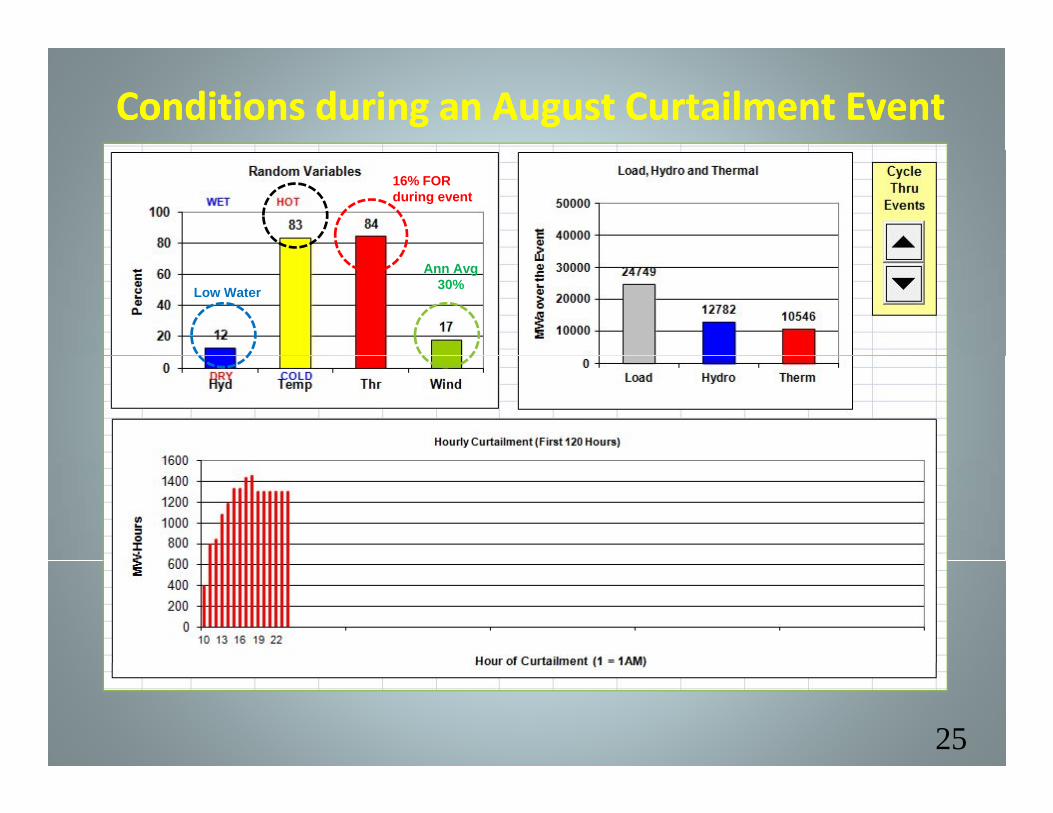
Conditions during an August Curtailment EventConditions during an August Curtailment Event
16% FORduring event
Ann Avg30%Low Water
25
DraftDraft Adequacy Assessment for 2015Adequacy Assessment for 2015(N t f Di t ib ti )(N t f Di t ib ti )(Not for Distribution)(Not for Distribution)
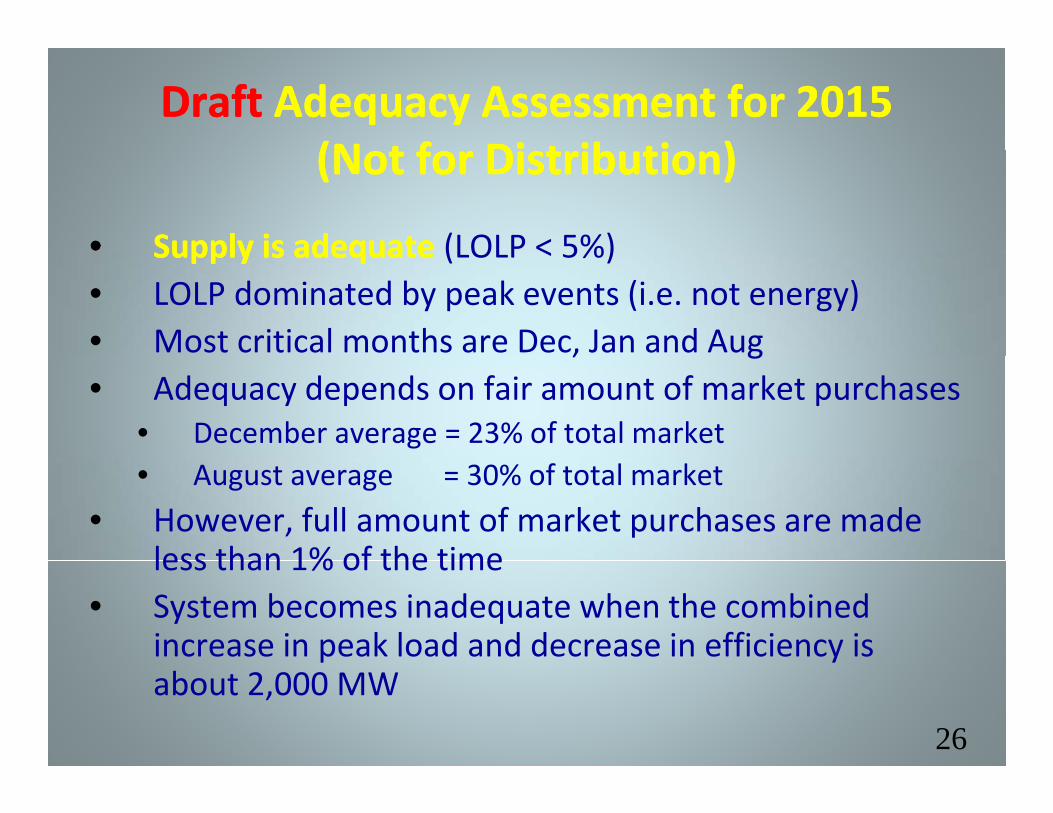
•• Supply is adequateSupply is adequate (LOLP < 5%)Supply is adequate Supply is adequate (LOLP < 5%)• LOLP dominated by peak events (i.e. not energy) • Most critical months are Dec, Jan and Aug , g• Adequacy depends on fair amount of market purchases
• December average = 23% of total market • August average = 30% of total market
• However, full amount of market purchases are made less than 1% of the timeless than 1% of the time
• System becomes inadequate when the combined increase in peak load and decrease in efficiency is about 2,000 MW
26