item parceling strategies in sem: investigating - sage publications
TRANSCRIPT
ORGANIZATIONAL RESEARCH METHODSHall et al. / ITEM PARCELING STRATEGIES IN SEM
Item Parceling Strategies in SEM:Investigating the Subtle Effectsof Unmodeled Secondary Constructs
ROSALIE J. HALLANDREA F. SNELLMICHELLE SINGER FOUSTUniversity of Akron
For theoretical and empirical reasons, researchers may combine item-level re-sponses into aggregate item parcels to use as indicators in a structural equationmodeling context. Yet the effects of specific parceling strategies on parameter esti-mation and model fit are not known. In Study 1, different parceling combinationsmeaningfully affected parameter estimates and fit indicators in two organiza-tional data sets. Based on the concept of external consistency, the authors pro-posed that combining items that shared an unmodeled secondary influence intothe same parcel (shared uniqueness strategy) would enhance the accuracy of pa-rameter estimates. This proposal was supported in Study 2, using simulated datagenerated from a known model. When the unmodeled secondary influence was re-lated to indicators of only one latent construct, the shared uniqueness parcelingstrategy resulted in more accurate parameter estimates. When indicators of bothtarget latent constructs were contaminated, bias was present but appropriatelysignaled by worsened fit statistics.
Structural equation modeling (SEM), implemented with analytic tools such asLISREL (Jöreskog & Sörbom, 1989, 1993) or EQS (Bentler, 1989), is increasinglyused to study proposed causal relationships among psychological constructs (Trem-blay & Gardner, 1996). Unlike multiple-regression-based approaches to estimatingstructural paths, SEM techniques offer the potential to remove measurement errorfrom estimates of structural relationships (e.g., Bollen, 1989; James, Mulaik, & Brett,1982). This is done by separately modeling latent constructs and latent error terms sothat the tests of the structural relationships can be made between the unbiased latentconstructs, rather than between the observed variables that incorporate true influencesof the latent construct but also systematic and measurement errors (i.e., uniquenesses).
Separating the construct-relevant variance from the uniqueness requires theexplicit specification of a measurement model of the relationships between latent con-structs and their indicators. Typically, a latent construct has several manifest indica-
Organizational Research Methods, Vol. 2 No. 3, July 1999 233-256© 1999 Sage Publications, Inc.
233

tors, with directional paths freed from the appropriate latent construct to relevantmanifest indicator variables. In practice, the number and forms of manifest indicatorsmay vary considerably, and there are not many firm guidelines for making thesechoices. However, choices about the types of indicators and specification of the mea-surement model have implications for the extent to which bias can be removed fromthe latent construct and the construct adequately represented (e.g., see Bagozzi &Edwards, 1998; DeShon, 1998). In the current article, we argue that when aggregatesof items known as item parcels or testlets are used as manifest indicators, the accuracyof parameter estimates and the diagnosticity of the goodness-of-fit test may depend onhow the parcels are created.
Item parcels differ from subscale or scale scores in that the entire set of item parcelsreflects a single primary factor dimension, or latent construct, whereas a set ofsubscale or scale scores reflects several separable (though generally closely related)latent constructs. The idea of creating and using item parcels is not a new one—it wasoriginally introduced by Cattell (1956), and further explored by Cattell and Burdsal(1975). Other researchers in the fields of psychology and educational testing (e.g.,Lawrence & Dorans, 1987; Manhart, 1996; Marsh, 1994; Schau, Stevens, Dauphinee,& Vecchio, 1995; Thompson & Melancon, 1996; West, Finch, & Curran, 1995) havesuggested using item parcels as indicators of the latent constructs in SEM analyses toaddress problems with large sample size requirements, unreliability, and nonnormal orcoarsely measured item-level data. However, these works have not addressed concep-tual issues concerning how item parcels may or may not affect the estimation of rela-tionships involving the latent construct.
The current article reviews some previous recommendations for creating compos-ite indicators, and suggests that under certain conditions these recommendations mayinfluence fit statistics and lead to biased parameter estimates. Results from the analysisof two organizational data sets supporting this argument are briefly presented. A theo-retical explanation for this effect is advanced, and then further explored in a set ofMonte Carlo simulations.
Choosing an Indicator Structure
The choice of an indicator structure requires careful consideration both of thestudy’s purpose and of the conceptualization of the latent constructs. Latent constructswith single indicators can be problematic, and although used with some frequency inorganizational SEM models, single indicators may (a) make achieving model identifi-cation more difficult (Bollen, 1989), (b) be associated with higher likelihood ofimproper solutions (Ding, Velicer, & Harlow, 1995), and (c) require analyses (e.g.,coefficient alpha) external to SEM if error is to be modeled and thus removed from thelatent constructs. Because of these considerations, it is preferable to use at least threeor four indicators per latent construct to ensure identification, increase the chances ofproper solutions, and allow one to estimate latent errors (e.g., Bollen, 1989).
The multiple indicators of the latent constructs may be at different levels, as sug-gested by Bagozzi and Edwards (1998). Their work explores the implications of differ-ent levels of aggregation on the construct validity of latent variables. Four differentindicator depths are considered, reflecting increasing levels of aggregation of the indi-cator variables: (a) individual item responses are used as separate indicators, resultingin a total disaggregation model; (b) indicators consist of composite subsets of items
234 ORGANIZATIONAL RESEARCH METHODS

(indicator scores are created by aggregating item responses), resulting in a partial dis-aggregation model; (c) scores from preexisting facets or scales are used as indicators,resulting in a partial aggregation model; and (d) indicators consist of aggregates ofscale scores, resulting in a total aggregation model.
All of these aggregation depths have been employed in organizational research(Snell, Hall, & Foust, 1997). In cases where the construct of interest is broadly definedor the measurement scale has multiple subscales or subfacets, indicators at a high levelof aggregation may be most appropriate. However, in many cases there is really onlyone good measure of the construct that one is interested in, or there are organizationalconstraints on the number of scales that may be included in a questionnaire. In thesesituations, the researcher is left with two choices: Individual scale items can be usedas indicators (a total disaggregation model); or, subsets of items can be summed oraveraged to form item parcels, which then serve as indicators for a partial disaggrega-tion model.
Item parcels may be preferred over individual items as indicators for a variety ofreasons. The composite-level indicators tend to be more reliable and normally distrib-uted, and to have values that are more continuously distributed. In addition, someMonte Carlo research suggests that as the number of indicators per factor increases,there are accompanying decreases in the value of a number of commonly used fit indi-ces (Anderson & Gerbing, 1984; Ding et al., 1995; Williams & Holahan, 1994). Thismay occur in part because, as the number of indicators increases, there is greater poten-tial for shared secondary influences and cross-loadings among the indicators. Thesesources of contamination are frequently not explicitly modeled, and thus contribute tooverall lack of fit of the model. (This does not mean that the fit indices are incorrect.Rather, rules of thumb for acceptable fit often do not directly take into account the indi-cator/factor ratio.) Thus, many researchers opt for an indicator structure that avoidsthis problem by using three to four indicators per latent construct rather than a largernumber of indicators.
Another reason that item parcels are frequently chosen is related to sample sizerequirements. When a larger number of indicators per latent construct is used, themodel will typically have more free parameters. Some rules of thumb for determiningadequate sample size are based on the ratio of estimated parameters to respondents(e.g., see Bentler & Chou, 1987; Bollen, 1989; Tanaka, 1987). By implication, increas-ing the number of indicators directly affects the sample size requirements for the study.This has led to a commonly held view that the number of indicators per factor shouldbe limited (e.g., to three or four), especially with small sample sizes.
Based on the results of a recent simulation study by Marsh, Hau, Balla, and Gray-son (1998), however, we suggest that small sample sizes not be the sole rationale forchoosing to use item parcels. Marsh et al. found that with small sample sizes (≤ 100), 4or more indicators per factor were necessary to ensure proper solutions. Furthermore,their results consistently showed that it was better to have more indicators per con-struct, even though higher ratios of indicators per factors resulted in lower fit indices.Higher ratios increased the likelihood of a proper solution and produced more accurateparameter estimates. Indeed, in the Marsh et al. simulations, parcels did not offer anyparticular advantages over the use of individual items in terms of convergence to aproper solution or accurate parameter estimation, although item parcels performedcomparably to items when the number of parcels was greater than 3 and sample sizewas greater than 100. However, some aspects of their simulations may have been
Hall et al. / ITEM PARCELING STRATEGIES IN SEM 235

uncharacteristic of typical organizational data sets (for example, all items in the simu-lation had equal saturation of the latent construct).
In sum, there is no unqualified evidence that item parcels should be used instead ofindividual items, even if the number of items is very large. But given some of the com-mon frustrations produced by large indicator/factor ratios, nonnormal data, and thesheer complexity of working with models with large numbers of indicators, research-ers will continue to view item parcels as an attractive option. Given this interest, it isimportant to know the effects of item parceling on the accuracy of the SEM analysis.
Random versus planned aggregation strategies. One important question concernsthe manner in which parcels are created. When preexisting subscales or scales are usedas indicators, the combination of items is by definition based on an a priori structurethat has a previous theoretical and/or empirical basis. However, when item parcels areused, groupings may be formed using a random or quasi-random procedure, or group-ings may be made based on a theoretical or empirical rationale developed by theresearcher. For example, Schau et al. (1995) deliberately spread negatively wordeditems across parcels, with the goal of producing parcels that were equivalent in termsof mean, standard deviation, and skew. Lawrence and Dorans (1987) and Manhart(1996) balanced assignment of items of varying difficulty across parcels. Other anec-dotal suggestions include successively combining the highest and lowest items froman exploratory factor analysis, or combining the items with the highest and lowestitem-total correlations, reflecting a strategy of equalizing the influence of the primaryfactor across item parcels. All of these approaches, though not necessarily yielding thesame combination of items into parcels, imply that some combinations are preferableto others. In contrast, recommendations to create item parcels using a random proce-dure imply that the choice makes no difference, or at least that there can be no rationalbasis for making the choice.
In spite of the variety of recommendations, there is relatively little published workon the implications of choosing different grouping strategies, and no well-elaboratedtheoretical rationale for the choice. For example, are the fit, parameter estimates, andmeaning of SEM models affected by how items are parceled? In this article, we arguethat the way in which items are combined into parcels can noticeably influence theresults of SEM analyses of the type of data typically collected in psychologicalresearch. And, in contrast to several of the authors mentioned above, we argue thatthere are advantages to placing more similar items together into the same parcel ratherthan balancing or distributing them equally across parcels.
Theoretical Rationale for ExpectingDifferences in Parceling Strategies
As a starting point, the set of items to be parceled is assumed to be unidimensionalin the sense that the results of an exploratory factor analysis (EFA) would typically beinterpreted as supporting a single-factor structure. That is, all items have strong load-ings on a primary factor, and the eigenvalues for any additional factors are substan-tively lower than for the first factor, with values of less than one or a clear break in ascree plot of eigenvalues. Yet even when this condition is met, some of the items arelikely to share one or more weak, secondary factor influences. These secondary factorsmay represent contamination from other psychological constructs, or they may be
236 ORGANIZATIONAL RESEARCH METHODS

methods factors. Because of the sensitivity of SEM analyses to even very minor modelmisspecifications, these secondary factors have the potential to influence indicators ofmodel fit and to influence parameter estimation. We believe that it is these weak (butshared) secondary influences that in part determine whether items should be placedtogether into the same item parcel or not. The concept of external consistency, which isdiscussed in more detail below, offers a starting point for thinking about the implica-tions of different item parceling strategies.
External consistency of items. Gerbing and Anderson (1988) suggest that two con-ditions are necessary for establishing the unidimensionality of a set of indicators:internal and external consistency. Readers are likely to be more familiar with the con-cept of internal consistency than external consistency. Unlike internal consistency,which represents the extent to which items within a scale share common variance,external consistency evaluates the extent to which each item shares variance withitems outside the scale. That is, external consistency depends on the degree to whichitems in the set are influenced by extraneous secondary constructs. External consis-tency is violated when a secondary dimension is a cause of two or more indicators in amodel. SEM analyses are sensitive to both the internal and external consistency of theindicators in the model because the manifest error terms or uniqueness (Θδs andΘεs)include both random error and systematic error that may be due to an unmodeled exter-nal factor influence.
If we translate Gerbing and Anderson’s (1988) work into the context of an SEMmeasurement model using item parcels, the implications become clearer. CompareFigures 1 and 2, which show six item-level indicators that all reflect a primary factorrepresenting the construct of interest. In both of these figures, Items 1 and 2 also reflect
Hall et al. / ITEM PARCELING STRATEGIES IN SEM 237
Figure 1: Model Showing Items With Shared Secondary Influence Placed in Same ParcelNote. ξ = latent exogenous construct, λ = factor loading, and δ = uniqueness.

a secondary influence, such as might result when responses to the item are influencedby an additional substantive construct or by a methods factor such as negative wordingor social desirability. To simplify the example, assume also that the primary and secon-dary constructs are unrelated to each other.
In both figures, the six items have been aggregated into three 2-item parcels. Sup-pose that the researcher has not explicitly acknowledged the secondary factor, so thatan SEM model is tested including only paths from the primary factor to the indicators.In Figure 1, the parcels are constructed so that the shared uniqueness of the two itemswith the secondary influence is isolated into a single parcel. Here, the estimates of thepath coefficients (also referred to asλs or factor loadings) from the primary factor toeach item parcel will depend solely on the strength of the primary factor influence onthe item parcel. The errors estimated for each parcel will reflect random error variancefor all three item parcels, and for Parcel 1, will additionally incorporate the uniquevariance due to the influence of the secondary factor on Items 1 and 2.
However, when the items with the shared secondary influence are placed into sepa-rate parcels (as shown in Figure 2), they reflect a strategy of distributing the items withshared uniqueness across parcels. In this case, the estimates of the path coefficientsfrom the latent construct to the indicators will reflect both the influence of the primaryfactor and of the unmodeled secondary factor that is now common to both Parcel 1 andParcel 2, because variance that is held in common between at least two indicators willbe partially attributed to the primary factor. Resulting estimates of the relationshipbetween the primary factor and Parcels 1 and 2 will be upwardly biased, and estimatesof the relationship between the primary factor and Parcel 3 will be downwardly biased(because Parcel 3 does not share any of the secondary influence that has now been
238 ORGANIZATIONAL RESEARCH METHODS
Figure 2: Model Showing Items With Shared Secondary Influence Placed in Different ParcelsNote. ξ = latent exogenous construct, λ = factor loading, and δ = uniqueness.

absorbed into the definition of the primary factor). Thus, when the items with a sharedsecondary influence are placed into two or more separate item parcels, the measure-ment model is misspecified, resulting in inaccurate parameter estimates and a poten-tially poorer fit of the hypothesized model to the data.
Examples from educational testing literature. Although there are no empiricalinvestigations of the effects of an unmodeled secondary influence on parcel composi-tion, there are a number of empirical studies from the educational testing literature thatexamine the issue of parceling strategies. Those familiar with this literature may rec-ognize that our suggestion to combine items sharing unmodeled secondary influencesinto the same parcel may conflict with these strategies, which typically recommenddistributing items with different characteristics (e.g., endorsement frequencies, nega-tive wording, etc.) across item parcels. We suggest two reasons for this apparent dis-crepancy.
First, the opposing strategies may emanate from attempts to deal with very differentsituations with regard to the unidimensionality of the items to be combined into par-cels. In the current study, we focus on relatively unidimensional scales. Consider, bycontrast, Kishton and Widaman’s (1994) study of the factor structure of a locus of con-trol scale. A preliminary EFA suggested a three-factor structure for this scale. Two setsof item parcels were created, one in which the items identified in the EFA as belongingto the same subfacet were spread across the parcels and one in which items from eachsubfacet were combined together. The fits of the two models using the two differentparcel sets were virtually identical; however, the authors favored the first strategybecause the second strategy generated inadmissible factor intercorrelations. AlthoughKishton and Widaman’s conclusions are contrary to those advocated here, they wereworking with a set of items that were not unidimensional enough to argue that the indi-cators reflected a single primary construct.
Second, much of the previous research uses item parcels to correct for violations ofmultivariate normality and continuous measurement assumptions that are required forthe maximum likelihood and Generalized Least Squares (GLS) estimation techniquesmost commonly used in SEM. Here, the emphasis is on creating item parcels whosedistributions show similar levels of normality (e.g., Thompson & Melancon, 1996), aswell as equal standing on response factors such as item difficulty (Lawrence & Dorans,1987; Manhart, 1996) and negative wording (Schau et al., 1995). Even though thesestudies demonstrate how such parcels can be constructed, they do not address whetherthese parceling strategies actually result in more accurate parameter estimates. Thetheoretical justifications are reasonable; however, we could find no empirical supportthat these strategies would result in more accurate parameter estimation and tests ofmodel fit. We were most concerned with typical organizational measures; it is possiblethat the most appropriate parceling strategy is dependent on the characteristics of theitems and types of questions being addressed, and that these vary across disciplines.
Brief Overview of Studies 1 and 2
The next sections present the results of two investigations of the effects of differentcombinations of items into item parcels on indicators of fit and parameter estimates.For both studies, we tested the simplest path model incorporating parcels that we could
Hall et al. / ITEM PARCELING STRATEGIES IN SEM 239

devise, consisting of a causal path between two latent constructs. The exogenous con-struct (independent variable) always had three parcels for manifest indicators, and theendogenous construct (dependent variable) varied slightly in form across the samples.For all analyses, the six items comprising the independent variable measure wereaggregated to create all 15 possible combinations of three 2-item parcels, and a modelwas tested for each unique combination of items into parcels, to allow us to comparethe parameter estimates and fit indices across different parcel combinations. (Parcelswould typically not be formed with only six items, but we wanted to keep the numberof potential combinations manageable.)
In Study 1, data from two organizational samples were analyzed to demonstrate thatdifferences in fit and parameter estimates are not only hypothetically possible, butoccur in practice. These data sets were chosen to represent data with characteristicstypical to those seen in organizational research. The disadvantage of these real datasets, however, was that it was impossible to know the true underlying relationships.Thus, in Study 2 we turned to Monte Carlo simulations to test whether item parcelingstrategies that combine items with a shared secondary influence into the same parcelbetter recover known model parameters than do parceling strategies that separateitems with a shared secondary influence.
Study 1: Method and Results
Description of Samples
Biodata participants and measures. The biodata sample consisted of 461 customerservice representatives employed in a large utility company. Responses to a six-itembiodata measure of persuasive ability were used to create indicators of the independentvariable. A Likert-type response scale ranging from 1 to 5 was used, with high scoresindicating high incidence of persuasive behaviors. Coefficient alpha for this scale was.65, which is consistent with previously reported reliabilities of biodata scales (Baehr& Williams, 1967; Owens, 1976). All items pertained to past behaviors and experi-ences (e.g., “In the past, how easily have you been able to persuade others to do thingsyour way?”).
The dependent variable was job performance. Performance was measured by col-lecting supervisor ratings of an employee’s ability to interact with coworkers andsupervisors. The format of these ratings is similar to the behavioral summary scalingprocedure (Borman, 1979), and results in item scores ranging from 1 to 6, with 6 indi-cating the highest level of performance. This four-item measure had a coefficient alphaof .83.
Teamwork participants and measures. The second sample consisted of responsesfrom 752 members of a large company in the communications industry. Six items wereused to measure the independent variable of teamwork (e.g., “Please rate your com-pany on rewarding group effort”). The dependent variable was a six-item measure ofwork and organizational satisfaction. Responses to both measures were made on ascale ranging from 1 (very good) to 5 (very poor). Coefficient alpha for the teamworkvariable was .91, and for the satisfaction measure was .87.
240 ORGANIZATIONAL RESEARCH METHODS

Exploratory Factor Analyses
Before creating the item parcels, a principal axis EFA was conducted on the six per-suasive ability items and, separately, for the six teamwork items. Inspection of thescree plots and a parallel analysis criterion (Lautenschlager, 1989) supported the exis-tence of a relatively strong primary factor for each set of items. For the teamwork sam-ple, the first factor explained 69% of the variance, and the first two eigenvalues were4.148 and 0.586. Factor loadings ranged from .78 to .82. For the biodata sample, thefirst factor accounted for 41% of the variance, and the first two eigenvalues were 2.45and 1.00. Factor loadings for this sample ranged from .38 to .73.
Following the EFA, for each sample a preliminary path analysis model was testedusing maximum likelihood estimation, with LISREL 8.12. In this model, item-levelindicators were used for the independent variable (persuasive ability or teamwork).The item-level analyses were performed for two reasons: (a) to provide fit indicatorsand parameter estimates that could be compared to the models using parcels as indica-tors, and (b) to look for evidence of unmodeled secondary factor influences.
Theχ2 goodness-of-fit statistic was significant for both samples, thus rejecting thenull hypothesis of good fit. Also, both samples had some large modification indicessuggesting that fit would improve if some error terms were allowed to covary. (Thesewere consistent with the idea that the items might incorporate small, unmodeled sec-ondary influences.) Thus, revised models were tested in which one error covariancewas freed for the biodata model and seven error covariances were freed for the team-work model.
For the biodata sample, the revised model yielded a nonsignificantχ ( )33
2 value of42.54, as well as a Comparative Fit Index (CFI) of .99 and Standardized Root MeanSquare Residual (SRMR) of .033. Thus, this model fit the data extremely well.Although theχ ( )18
2 of 40.54 was still significant for the teamwork sample, other indica-tors suggested an adequate fit (CFI = .99, SRMR = .019). The standardized item load-ings for the persuasive ability indicators ranged from .41 to .63; for the teamwork indi-cators, these loadings ranged from .78 to .81. (All factor loadings were statisticallysignificant.) The estimated path coefficient from persuasive ability to job performancehad a standardized value of .09, and was nonsignificant. The estimated path fromteamwork to satisfaction was .76 and was significant.
Tests of Item Parcel Models
For the biodata sample,χ2 values ranged from 13.57 to 22.71 across the 15 parcelcombinations. All models had 13 degrees of freedom, and theχ2 for 14 of the 15 mod-els had probability values of greater than .05 and thus would have been judged to fitwell. For the teamwork sample, theχ2 values ranged from 7.50 to 40.12, with 7 degreesof freedom. Six of the models hadχ2 values withp greater than .05. These 6 modelswould have been judged to fit well on the basis of theχ2 test. The remaining 9 models,however, hadχ2 values withps ranging from less than .05 to less than .0001, and wouldhave led to a conclusion of significant model misfit.
The range ofχ2 values found with both datasets raises doubt about the assumedarbitrariness of the item parcel combination and the resulting conclusions that would
Hall et al. / ITEM PARCELING STRATEGIES IN SEM 241

be drawn by the researcher. In both samples, the null hypothesis of good fit would havebeen rejected for one or more of the models, but not for others. In addition, there wasappreciable variability in other fit indicators, in particular the Root Mean Square Errorof Approximation (RMSEA).
The values of the estimated structural parameters (γ) also demonstrated some vari-ability. In the biodata sample, this variability would have implications for the substan-tive conclusions drawn from the test of the model—the path coefficients ranged from avalue of .06, which is a nonsignificant relationship in this sample, to .11, which indi-cates a statistically significant path. The estimated path coefficients for the teamworksample ranged from .74 to .77, and all were statistically significant.
These results demonstrate that different combinations of items into parcels can pro-duce different fit statistics and parameter estimates. To eliminate the possibility thatthe fluctuations in model fit were related to differences in the normality of the distribu-tions of the parcels that were created, the skew and kurtosis of all parcels were com-pared. Differences in the distributions of the item parcels had no discernable connec-tion to the fit of the different models. In addition, the modification indices for theuniqueness of the item parcels were examined to determine if they could be used topredict which item combinations were especially likely to contribute to model misfit.However, this led to no clear-cut conclusions, potentially because of the simultaneouspresence of more than one secondary influence. Thus, we turned to the analysis of dataproduced by Monte Carlo simulations, where the true underlying measurement modelcould be known.
Study 2: Method
To test the feasibility of the secondary construct explanation developed in the intro-duction, the Monte Carlo capabilities of PRELIS 2/LISREL 8 were used for threesimulations, each of which generated 500 simulated data sets. Each of the simulateddata sets contained 500 observations on 10 variables. Of the 10 variables, 6 were cre-ated to simulate item-level indicators (X1 to X6) of the latent independent (exogenous)variable and were then paired to make all possible different combinations of three2-item parcels, in the same manner as for Study 1. The remaining 4 variables wereindicators of the latent dependent (endogenous) variable. A covariance matrix con-taining all possible item parcel combinations plus the dependent variable indicatorswas output for each of the simulated data sets, and then used as input to a LISRELmodel proposing a directional path between two latent constructs,ξ1 (the exogeneous,or independent latent variable) andη1 (the endogenous, or dependent latent variable),again in a manner very similar to those used for the biodata and team samples. Thus,for each of the three simulations, a total of 7,500 (15 possible combinations of parcels× 500 data sets) LISREL analyses were performed.
The appendix contains the PRELIS program lines used to generate the simulateddata sets, based on procedures outlined in Jöreskog and Sörbom (1994, pp. 14-16). The500 data sets of Simulation 1 were generated from a very simple model in which all sixitem-level indicators of the primary exogenous construct (ξ1) had loadings of .65, plusa random error component. Simulation 1 included no variables with secondary con-struct influences. In Simulation 2, all six indicators of the exogenous construct (ξ1) hadunstandardized loadings of .65 on the primary construct, and two of the indicators (X1
242 ORGANIZATIONAL RESEARCH METHODS

andX2) had additional loadings of .50 and .40 on a secondary construct (ξ2). In all datasets, the value of the path from the primary exogenous construct (ξ1) to the endogenousconstruct (η1) was set to .60 (random error was also added in the modeling of this path).In Simulation 3, both a primary and secondary exogenous construct influenced theindicators of the independent variable, exactly as in Simulation 2. However, in thismodel, the secondary exogenous construct (ξ2) additionally had a weak influence (.20)on the endogenous construct (η1). This second latent construct could represent either asubstantive factor or a methods factor that influences the observed value of two of themanifestX variables in combination withξ1.
To summarize the results of the simulations, the fit indicators and parameter esti-mates were averaged across the 500 data sets tested for each of the 15-item parcel com-binations. Given that we were testing a 13dfmodel, the expected value ofχ2 for a per-fectly fitted model would be equal to 13, withp= .50. The value of CFI should be closeto 1.00, and small values should be observed for RMSEA and SRMR. For Simulations2 and 3, mean fit indicators and parameter estimates were also determined for all mod-els using the same general item parceling strategy (i.e., isolated vs. distributed unique-ness), and significance tests were conducted to determine if the observed differenceswere statistically significant.
Because of the effects of the unmodeled secondary construct in the Simulation 2and 3 data sets, we expected to see more variability in the LISREL indicators across allpossible item parcel sets for these two simulations than for Simulation 1. In otherwords, the models for Simulations 2 and 3 were misspecified because they did notexplicitly model the effects of the secondary construct. We expected that item parcelcombinations which placed the two items sharing the unmodeled secondary influenceinto the same parcel (thus isolating this undesired shared variance into the uniquenessterm for the indicator) would show better model fit and more accurate parameter esti-mates than combinations which separated the two items into different parcels. Simula-tion 3 should demonstrate how fit and parameter estimates are affected when theunmodeled secondary construct not only influences indicators of the independent vari-able but is related to the dependent variable, further complicating the effects on fit indi-ces and parameter estimates.
Results
Simulation 1
For Simulation 1 data, mean fit indicator and parameter estimate values were calcu-lated over all 500 data sets and for all possible 15-item parcel combinations, and thuswere based on 7,500 LISREL analyses. Because no secondary influence was includedin the generation of the data, the tests of the LISREL models should recover the truevalues of the parameter estimates and should fit well. Indeed, all fit indicators sug-gested a close-to-perfect fit of the model to the data. The goodness-of-fitχ2 values hada mean of 13.43 (range = 13.15 to 13.81),df = 13, averagep = .48. The values ofRMSEA ranged from .011 to .012, and the CFI was equal to 1.00 for all models.
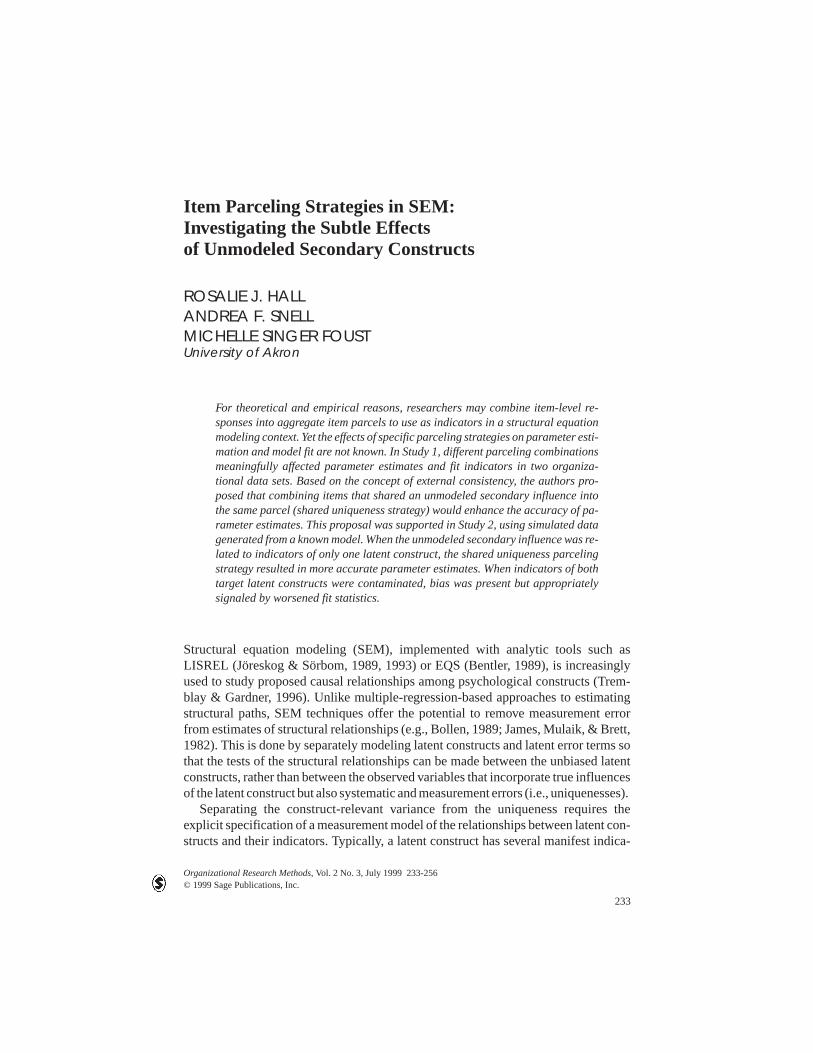
The mean values of the parameter estimates for Simulation 1 (reported in Figure 3)provide a standard against which to evaluate the values recovered from Simulations 2and 3. These values were exactly what would be expected given knowledge of the
Hall et al. / ITEM PARCELING STRATEGIES IN SEM 243
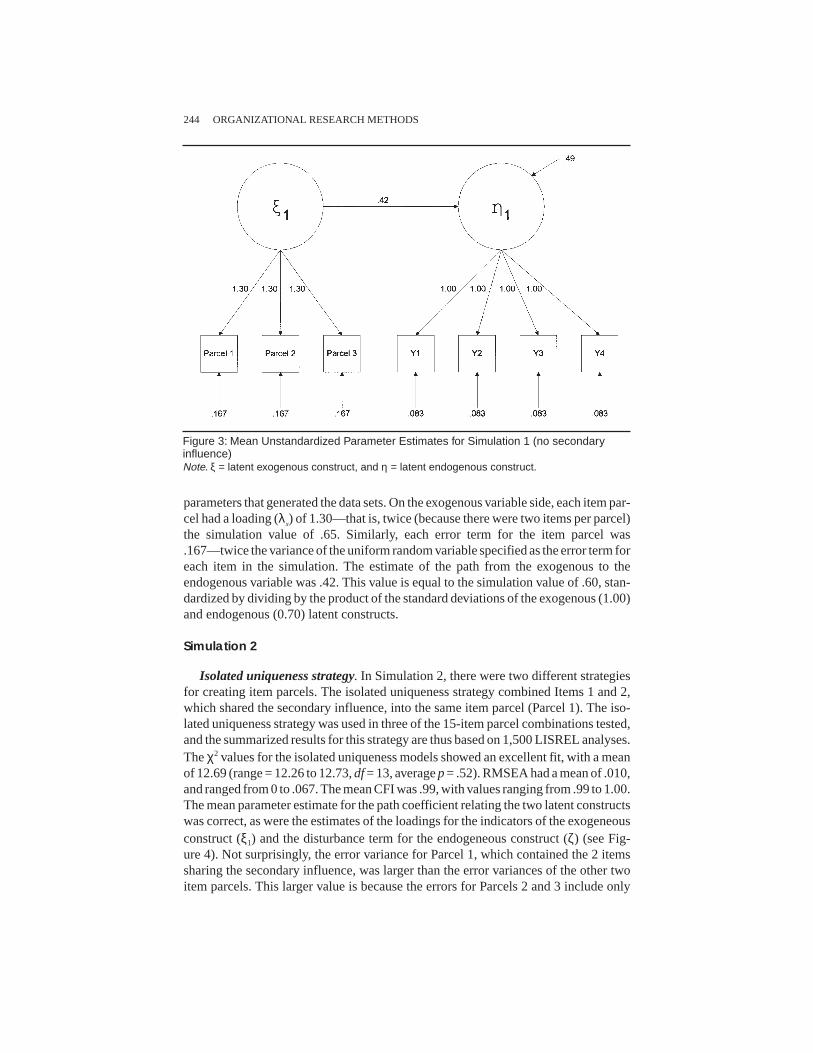
parameters that generated the data sets. On the exogenous variable side, each item par-cel had a loading (λx) of 1.30—that is, twice (because there were two items per parcel)the simulation value of .65. Similarly, each error term for the item parcel was.167—twice the variance of the uniform random variable specified as the error term foreach item in the simulation. The estimate of the path from the exogenous to theendogenous variable was .42. This value is equal to the simulation value of .60, stan-dardized by dividing by the product of the standard deviations of the exogenous (1.00)and endogenous (0.70) latent constructs.
Simulation 2
Isolated uniqueness strategy. In Simulation 2, there were two different strategiesfor creating item parcels. The isolated uniqueness strategy combined Items 1 and 2,which shared the secondary influence, into the same item parcel (Parcel 1). The iso-lated uniqueness strategy was used in three of the 15-item parcel combinations tested,and the summarized results for this strategy are thus based on 1,500 LISREL analyses.Theχ2 values for the isolated uniqueness models showed an excellent fit, with a meanof 12.69 (range = 12.26 to 12.73,df= 13, averagep= .52). RMSEA had a mean of .010,and ranged from 0 to .067. The mean CFI was .99, with values ranging from .99 to 1.00.The mean parameter estimate for the path coefficient relating the two latent constructswas correct, as were the estimates of the loadings for the indicators of the exogeneousconstruct (ξ1) and the disturbance term for the endogeneous construct (ζ) (see Fig-ure 4). Not surprisingly, the error variance for Parcel 1, which contained the 2 itemssharing the secondary influence, was larger than the error variances of the other twoitem parcels. This larger value is because the errors for Parcels 2 and 3 include only
244 ORGANIZATIONAL RESEARCH METHODS
Figure 3: Mean Unstandardized Parameter Estimates for Simulation 1 (no secondaryinfluence)Note. ξ = latent exogenous construct, and η = latent endogenous construct.

random error, whereas the error term for Parcel 1 reflects both random error and theunique variance due to the unmodeled secondary influence.
Distributed uniqueness strategy. In contrast, the Simulation 2 models that placedthe items with a shared secondary influence into separate item parcels did not fit aswell. This distributed uniqueness strategy was used for 12 of the 15-item parcel combi-nations tested; therefore, the reported means are based on 6,000 LISREL analyses. Forthese models, the meanχ2 was 20.29, with values that ranged from 19.92 to 20.71. Thedifference between the meanχ2 values for the two different parceling strategies used inSimulation 2 was statistically significant,t = –47.18,p < .001. The mean RMSEA forthese models was .030, and ranged from 0 to .090. The average CFI was 1.00, and val-ues ranged from .96 to 1.00.
Not only did indices of model fit differ for the two parceling strategies, but severalof the mean parameter estimates from the Simulation 2 distributed uniqueness modelswere biased (see Figure 5). The pattern of changes in the parameter estimates sug-gested that the exogenous construct had been redefined so that it now partly reflectedthe secondary influence. This is corroborated by the upwardly biased loadings of thetwo-item parcels influenced by the secondary construct—Parcels 1 and 2 had loadingsof 1.38 versus the true value of 1.30—and the downwardly biased loading for Parcel 3(1.23 vs. the true value of 1.3), which was not influenced by the secondary construct.Because the exogenous construct (ξ1 in Figure 5) has been redefined, the estimate ofthe relationship between it and the endogeneous variable (η1) is attenuated from a truevalue of .42 to a value of .40. This occurs because the unmodeled secondary constructthat now contaminates the definition of the primary construct is not related to thedependent variable.
Hall et al. / ITEM PARCELING STRATEGIES IN SEM 245
Figure 4: Mean Unstandardized Parameter Estimates for Simulation 2: Models With Un-modelled, Shared, Secondary Influence Isolated in Parcel 1Note. ξ = latent exogenous construct, and η = latent endogenous construct.

Simulation 3
Isolated uniqueness strategy. Finally, Figures 6 and 7 present the results of usingthe two-item parceling strategies on Simulation 3 data. Recall that the true modelunderlying the data from Simulation 3 was identical to that of Simulation 2, except thatthe secondary construct now had a causal influence not only on two items reflectingthe exogenous construct but also directly on the endogenous construct. The results forthe isolated uniqueness strategy suggest increased model misfit and the meanχ2 was26.91, with values ranging from 26.77 to 27.11. The mean probability value associatedwith theχ2 test was .08, and importantly, 65% of thepvalues were less than or equal to.05 and would have led to a correct rejection of this misspecified model. The meanRMSEA equaled .043 for all relevant models, with values ranging from 0 to .11.
As can be seen in Figure 6, the loading for Parcel 1, which contains the shared sec-ondary influence, is upwardly biased (1.57 vs. a true value of 1.30), although the load-ings for the other two parcels are correct. The estimate of the path coefficient relatingthe exogenous to the endogenous latent construct is also upwardly biased with a valueof .47, opposed to the true value of .42. This occurs because the estimate of this pathnow confounds the true relationship of these two constructs with the additional rela-tionship between the secondary influence and the dependent construct.
Distributed uniqueness strategy. For Simulation 3, when the distributed unique-ness strategy was used, theχ2 values improved significantly over the just reportedSimulation 3 results for the isolated uniqueness strategy,t = 52.02,p< .001. The meanvalue ofχ2 for the distributed uniqueness strategy was 13.63 and ranged from 13.40 to
246 ORGANIZATIONAL RESEARCH METHODS
Figure 5: Mean Unstandardized Parameter Estimates for Simulation 2: Models With Un-modeled, Shared, Secondary Influence in Separate Parcels. Parcel 1 Has Stronger Sec-ondary Influence and Parcel 2 Has Weaker Secondary InfluenceNote. ξ = latent exogenous construct, and η = latent endogenous construct.

13.88, suggesting an excellent fit. The mean probability value associated with theχ2
test was .47, and for all of the data sets the probabilities were greater than .05. Weemphasize this point because it means that based on the probability level associated
Hall et al. / ITEM PARCELING STRATEGIES IN SEM 247
Figure 6: Mean Parameter Estimates for Simulation 3: Models With Unmodeled, Shared,Secondary Influence Isolated in Parcel 1; Secondary Influence Affects EndogenousVariableNote. ξ = latent exogenous construct, and η = latent endogenous construct.
Figure 7: Mean Parameter Estimates for Simulation 3: Models With Unmodelled, Shared,Secondary Influence in Parcels 1 and 2; Secondary Influence Affects EndogenousVariableNote. ξ = latent exogenous construct, and η = latent endogenous construct.

with theχ2 goodness-of-fit value, which is considered to be a stringent criterion, theincorrectly specified model would not have been rejected in any of the analyses wherethe distributed uniqueness strategy was used. The mean RMSEA value was .012, withvalues ranging from 0 to .097.
In the set of models using the distributed uniqueness strategy, all three of the pathsfrom the latent exogenous construct to the item parcels were biased (1.52, 1.28, and1.24, compared to a true value of 1.30), in contrast to the isolated uniqueness strategymodels in which bias was observed in only one of these paths. The path coefficient wasslightly more upwardly biased than in the isolated uniqueness models of Simulation 3,with a mean value of .48 rather than the true value of .42 (see Figure 7), again becauseof the confound with the unmodeled secondary construct. Thus, in Simulation 3, bothitem parceling strategies led to biased estimates of the path coefficient, because themodel being tested did not explicitly include the effects of the secondary construct.However, in Simulation 3, when the distributed uniqueness strategy was used, the mis-fit was not readily detected because the values ofχ2 and RMSEA suggested an excel-lent fit of the model to the data. In contrast, the largerχ2 and RMSEA of the modelsusing the isolated uniqueness strategy provided better clues that the model was indeedmisspecified.
Discussion
As described in the introduction, there are a variety of theoretical and practical rea-sons for researchers to consider using item parcels, including keeping the ratio ofmanifest indicators to latent constructs manageable, reducing the number of freeparameters in the model to decrease sample size requirements, and increasing thechances of adequate model fit. Most important among the reasons, however, is theissue of good construct representation, as raised by Bagozzi and Edwards (1998).Their empirical data suggested that in comparison to more aggregate indicators, itemparcels and item-level indicators provided the best representation of the multifacetedscale that they studied (the Work Aspect Preference Scale). That an appreciablenumber of other researchers also choose to use item parcels is supported by the litera-ture. We reviewed all articles published in theJournal of Applied Psychologybetween1990 and 1996, and found that 17% of the 48 articles that used SEM analyses to testcausal models relied on item parcels as manifest indicators for at least some latent con-structs in the model (details available from authors).
Bagozzi and Edwards (1998) proposed four general guidelines for creating itemparcels in their discussion section, including rules that sets of items be unidimensionaland that items combined into one parcel should be at the same level of specificity andconstitute independent observations from items in another parcel. They contend thatthese guidelines will make measurement more precise and, most important, reduce thechance of including other constructs such as subordinate factors (i.e., secondary influ-ences), superordinate aspects (i.e., higher level factor or method effects), or covaryingvariables. We believe our study results augment their list, and provide some explana-tions and boundary conditions for their guidelines.
248 ORGANIZATIONAL RESEARCH METHODS

Contributions of the Study
Demonstration that parceling strategy makes a difference. The analyses of boththe empirical data sets (biodata and teamwork data) and the simulated data sets clearlydemonstrate that the particular combination of items into parcels can systematicallyinfluence fit statistics and parameter estimates. Tests of the difference between themeanχ2 values for the isolated uniqueness strategy versus the distributed uniquenessstrategy were statistically significant for both Simulation 2 and Simulation 3 of Study2 (Simulation 1 items had no secondary influence). In the teamwork sample of Study 1,40% of the item parcel combinations resulted in a nonsignificantχ2 value, whereas60% did not. In the biodata sample of Study 1, estimates of the relationship betweenthe independent and dependent constructs were statistically significant for 27% of themodels and not for 73% of the models. And perhaps more important, the simulationresults clearly showed that when a secondary influence was present, parameter esti-mates of models using parcels could be biased. Taken together, these findings demon-strate the fallacy of assuming that a strategy of randomly generating item parcels willproduce trivial differences in SEM results.
Enhanced theoretical explanation of observed differences across item parcelcombinations. The Study 1 analyses suggested that unmodeled secondary influencesmight explain the observed differences in SEM results across different item parcelcombinations. To verify this impression, three sets of simulated data sets were createdfor Study 2, which demonstrated that the choice of item parceling strategy was essen-tially arbitrary when no secondary influences were present, as shown in Simulation 1.When secondary influences are present, as shown in Simulations 2 and 3, two clearlydifferentiated patterns of results emerged—one pattern was characteristic of combin-ing items sharing the secondary influence into a single parcel (the isolated uniquenessstrategy), and the other pattern was characteristic of combining items sharing the sec-ondary influence into different parcels (the distributed uniqueness strategy).
When a distributed uniqueness strategy was used in Simulations 2 and 3, the secon-dary factor was partially subsumed in the representation of the primary latent con-struct. This confound biased both estimates of the factor loadings and of the path coef-ficient for the causal relationship between the primary exogenous construct and theendogenous construct. In Simulation 2, where the unmodeled secondary factor wasrelated to the primary exogenous construct but not to the endogenous construct, theestimate of the path coefficient was attenuated. In Simulation 3, where the secondaryfactor was related to both the exogenous construct and the endogenous construct, theestimate of the path coefficient was inflated.
In contrast, when an isolated uniqueness strategy was used in Simulation 2, the fac-tor loadings and path coefficient were correctly estimated. In Simulation 3, the isolateduniqueness strategy did not protect against biased estimates. However, when the iso-lated uniqueness strategy was used in Simulation 3, theχ2 test correctly gave indica-tions of model misspecification, whereas the distributed uniqueness strategy did not.
The simulation results were consistent with theoretically derived expectationsbased on the measurement concept of external consistency. When items with a shared
Hall et al. / ITEM PARCELING STRATEGIES IN SEM 249

secondary influence are placed into the same item parcel, the external consistency ofthe measure is increased by relegating a secondary influence to the uniqueness term ofa single item parcel, so that no two parcels are both influenced by the same secondaryconstruct. SEM is sensitive to the external consistency of a measure, and provides amore stringent assessment of its unidimensionality (Gerbing & Anderson, 1988).The isolated uniqueness strategy for creating item parcels can increase the uni-dimensionality of the latent construct by improving the external consistency of themanifest indicators.
Boundary Conditions for Generalizing Results
Especially because these results are based on a relatively small number of variablesand parcel combinations, as well as a limited range of parameter values, we are reluc-tant at this point to generalize widely. The extent to which these results are likely toapply to other situations may depend on several boundary conditions, including thefollowing: (a) the extent that the item set is unidimensional, (b) whether the secondaryinfluence affects indicators for only one (versus more than one) construct, and (c) thenumber of unmodeled secondary influences present. These are elaborated in the fol-lowing sections.
Unidimensionality of the item set. Our study results may apply only to situationswhere the set of items to be combined into parcels is unidimensional. Although parcel-ing effects occur because one or more quite weak secondary constructs are present, anEFA of the items used in our samples and simulations would demonstrate that all itemsshow a substantial influence of the primary construct, and any secondary factors areweak enough that they would ordinarily be disregarded.
In the simulations, the eigenvalue for the primary factor was six times larger thanthe eigenvalue for the secondary factor. Thus, the simulation results demonstratemeaningful effects with weak secondary factors. This ratio may be typical for sometypes of organizational measures (e.g., organizational climate, job satisfaction, com-mitment); however, researchers using other types of measures (e.g., personality) maynot have such strong unidimensional structures. In fact, the two Study 1 data setsexemplify this discrepancy—the ratio of first to second eigenvalues for the teamworksample was 7 to 1; for the biodata sample, it was 2.45 to 1.
Recently, Snell, Hall, Davies, and Keeney (1999) examined several empirical datasets with differing levels of secondary factor contamination in an effort to evaluate therobustness of the isolated uniqueness strategy. In general, they found that the variouscombinations of items into item parcels yielded relatively consistent parameter esti-mates when the ratio of the eigenvalues for the first factor to the second factor wasabove 2.5. However, when the primary factor was only twice as large as the secondaryfactor, the primary factor saturation of the items fluctuated considerably and the vari-ous item parcel combinations produced more inconsistent parameter estimates. Theseresults suggest that the isolated uniqueness strategy may be most effective when thesecondary factor can be easily identified and it only weakly influences the items defin-ing the primary construct.
When the unidimensionality condition is not met, the isolated uniqueness strategymay not be optimal. Violation of this condition may be one explanation for whysome authors in the educational testing literature (e.g., Kishton & Widaman, 1994;
250 ORGANIZATIONAL RESEARCH METHODS

Lawrence & Dorans, 1987; Manhart, 1996; Schau et al., 1995; Thompson & Melan-con, 1996) recommend a strategy of placing similar items into different parcels, a vari-ant of what we have called the distributed uniqueness strategy. It may be that when theset of items is unidimensional, the isolated uniqueness strategy is best, but when theyare multidimensional, a parallel strategy is best. However, it may also be that the betterfit achieved with a parallel strategy in this circumstance masks serious measurementproblems that would be better addressed by respecifying the model. We did notaddress this issue in the current study.
The secondary influence affects indicators of only one construct. In Simulation 2,the isolated uniqueness strategy resulted in correct parameter estimates and bettermodel fits, whereas the distributed uniqueness strategy led to some biased estimatesand poorer overall model fit. However, this was not true in Simulation 3, where bothstrategies resulted in biased estimates of some parameters and the isolated uniquenessstrategy models showed poorer overall model fit. The difference between these twosimulations was that in Simulation 2, the influence of the secondary factor wasrestricted only to the items that served as indicators of the primary endogenous con-struct. In Simulation 3, the secondary factor influenced both the indicators of the pri-mary exogenous construct and the endogenous construct. Thus, we conclude that theisolated uniqueness strategy will not protect against biased estimates when the secon-dary factor influences more than one construct.
However, the results of Simulation 3 clearly demonstrate the potential danger ofselecting a set of item parcels because it maximizes model fit. In this simulation, themodels using the isolated uniqueness strategy showed poorer fit than did the distrib-uted uniqueness models. The poorer fit of the isolated uniqueness models correctlyflagged an unmeasured variables problem (e.g., see James, 1980). The isolateduniqueness models forced the influence of the unmodeled factor into a single indica-tor, resulting in a substantial uniqueness term that covaried with the endogenous vari-able. Because the model did not explicitly include a path or covariance relating theuniqueness to the endogenous construct, the fit of the model suffered.
In contrast, when the distributed uniqueness strategy was used, variance related tothe secondary construct was interpreted as shared variance and to some extent wasincorporated into the primary construct. This inflated the estimated causal relationshipbetween the exogenous and endogenous variables, and resulted in an apparently betterfit of the (incorrect) model to the data because now some of the relationship betweenthe secondary construct and the endogenous construct was accommodated in themodel, albeit in a misleading manner. Although the model appeared to fit better, theassumption that all relevant causes of the endogenous variable were included in themodel was still violated. Thus, the models employing the isolated uniqueness strategywere more desirable because they correctly demonstrated poor model fit and served toalert the researcher to a model specification problem.
Number of secondary influences. The simulations performed in this study wereprobably oversimplified in the sense that responses to items may well be influenced bymore than one secondary construct. The resulting effects on model fit and parameterestimates become correspondingly more difficult to anticipate, and trade-offs mayhave to be made if a particular item shares multiple secondary influences with otheritems. Although the present study did not examine such complex relationships, we arehopeful that future studies can address issues such as the following: Can multiple sec-
Hall et al. / ITEM PARCELING STRATEGIES IN SEM 251

ondary constructs cancel out their effects on model fit and parameter estimation?What, if any, is the boundary between an irrelevant secondary influence and a relevant(i.e., misleading or damaging) one?
Tentative Recommendations for Practice
Given the argument inMultivariate Behavioral Researchconcerning the use ofcomposite scores versus individual items in measurement invariance studies (Dras-gow, 1995; Labouvie & Ruetsch, 1995; McDonald, 1995; Nesselroade, 1995; Wida-man, 1995), it is clear that SEM researchers do not believe that the choice of an indica-tor structure is arbitrary. However, we were surprised by the paucity of research andresulting practical guidelines for those wishing to conduct SEM analyses using itemparcels. The results of the current study support combining items that share a secon-dary factor into the same parcel, to force this unmodeled influence into the uniquenessterm and thereby isolate the factor loading and structural estimates as much as possiblefrom the contamination of the secondary factor influence.
However, one is left with the question of how to detect the possible presence ofunmodeled, secondary factors. At this point we can only make tentative recommenda-tions. First, a rational analysis of the item content might provide some clues about thenature of potential secondary factors. The content of the items defining the primaryconstruct may be scrutinized with the goal of creating smaller subscales based onrecognizable content differences or context differences (e.g., items concerning one’sbehavior with friends vs. with coworkers). There are also a variety of method effectsthat could constitute a substantial secondary factor such as positive versus negativeitem wording, sequential placement in the questionnaire (e.g., next to items measuringa different construct), or more pervasive response tendencies such as negative affectiv-ity or socially desirable responding.
Second, a factor analysis of the item-level data may be helpful. Either an EFA or aconfirmatory factor analysis (CFA) could be used for this. With an EFA, the researcherwould want to factor analyze all items from a scale, forcing from two to four factors,depending on the total number of items and the likely number of parcels to be created.Items with higher loadings on the same factor should be combined into the same par-cel. (Or, another strategy altogether would be to avoid parcels entirely by using as indi-cators only the items with high loadings on the primary factor and no cross-loadings.This might be best if the factor analysis results are complex.) If CFA is used, then themodification indices may be used to determine which items have uniquenesses thatcovary. These items would then be combined into the same parcel. Following this, theresearcher might also want to carefully inspect the modification indices for the par-celed indicators to determine if the parceling strategy has indeed isolated the strongestsecondary influences.
Third, one might merely want to see if there is likely to be meaningful variability inresults depending on how items are combined into parcels. In this case, one could trytesting a number of models, using different item parcel combinations, and then com-paring the differences in fit indices and parameter estimates. If there are many items,trying all possible combinations of parcels can get quite tedious; instead, a handful ofcombinations that differed substantially from each other in composition could betested.
252 ORGANIZATIONAL RESEARCH METHODS

Once potential secondary constructs have been identified, a couple of strategiesmight be pursued. First, if the researcher is lucky enough to have a measure of theunmodeled secondary factor, new variables could be added to the model and explicitpaths included to the relevant items. For example, if the secondary factor is a methodsfactor, one might employ method bias analyses similar to those detailed in Williamsand Anderson (1994). In this study, the effects of positive and negative affectivity weremodeled as additional causes of the indicators of substantive constructs. Althoughcumbersome, SEM analyses explicitly modeling multiple causes for the indicatorshelp mitigate the problem of relevant unmodeled variables. However, it may notalways be possible to determine the exact nature of the secondary influence, or even ifit is known, a good measure of it might not have been collected. In this situation, ourisolated uniqueness strategy might prove quite helpful.
In addition to recommendations concerning how to create item parcels and identifypotentially damaging secondary influences, results of the current study also suggestthat alternative interpretations of large error terms (Θδ or Θε) should be consideredwhen interpreting the SEM output from a partial disaggregation model. Concern witha uniqueness term for one composite indicator that is substantially larger than the oth-ers may tempt one to instead create and use a set of item parcels that generate more uni-form uniqueness estimates. However, results from the current study suggest that thislarge uniqueness may be the key to successfully removing the unmodeled secondaryconstruct from the estimation of the primary latent trait.
Conclusions
The results of this study show that different combinations of items into parcels canaffect SEM analysis results in the following three important ways: (a) biasing parame-ter estimates, (b) creating variability in fit indicators, and (c) redefining the nature ofthe primary construct. A strategy of combining items that share an unmodeled secon-dary influence into the same parcel may help mitigate these effects. To the extent thatusers of SEM are aware that the choice of a parceling strategy may introduce bias, thequality of their analyses will be improved.
Hall et al. / ITEM PARCELING STRATEGIES IN SEM 253

APPENDIXPRELIS Program Lines for Simulations 1 to 3
TITLE Generate item level data for item parcel studyDA NO = 500 RP = 500CO ALL;!Create latent constructs and relations among themNE KSI1 = NRAND; NE KSI2 = NRAND; NE KSI3 = .60 * KSI1 + NRAND{Simulation 3: NE KSI3 = .60 * KSI1 + .20 * KSI2 + NRAND};!Generate random errors for manifest indicatorsNE DELTA1 = URAND; NE DELTA2 = URAND; NE DELTA3 = URANDNE DELTA4 = URAND; NE DELTA5 = URAND; NE DELTA6 = URANDNE DELTA7 = URAND; NE DELTA8 = URAND; NE DELTA9 = URANDNE DELTA10 = URAND;!Generate item-level values for indicators of IV (X1 – X6) and DV (X7 – X10)NE X1 = .65 * KSI1 + .00 * KSI2 + DELTA1{Simulation 2,3: NE X1 = .65 * KSI1 + .50 * KSI2 + DELTA1}NE X2 = .65 * KSI1 + .00 * KSI2 + DELTA2{Simulation 2,3 NE X2 = .65 * KSI1 + .40 * KSI2 + DELTA1}NE X3 = .65 * KSI1 + .00 * KSI2 + DELTA3NE X4 = .65 * KSI1 + .00 * KSI2 + DELTA4NE X5 = .65 * KSI1 + .00 * KSI2 + DELTA5NE X6 = .65 * KSI1 + .00 * KSI2 + DELTA6NE X7 = .70 * KSI3 + DELTA7NE X8 = .70 * KSI3 + DELTA8NE X9 = .70 * KSI3 + DELTA9NE X10 = .70 * KSI3 + DELTA10;!Create item parcelsNE TEST12 = X1 + X2; NE TEST13 = X1 + X3; NE TEST14 = X1 + X4NE TEST15 = X1 + X5; NE TEST16 = X1 + X6; NE TEST23 = X2 + X3NE TEST24 = X2 + X4; NE TEST25 = X2 + X5; NE TEST26 = X2 + X6NE TEST34 = X3 + X4; NE TEST35 = X3 + X5; NE TEST36 = X3 + X6NE TEST45 = X4 + X5; NE TEST46 = X4 + X6; NE TEST56 = X5 + X6;SD KSI1 – KSI3 DELTA1 – DELTA10 X1 – X6OU CM = {filename}
References
Anderson, J. C., & Gerbing, D. W. (1984). The effect of sampling error on convergence, im-proper solutions, and goodness-of-fit indices for maximum likelihood confirmatory factoranalysis.Psychometrika, 49, 155-172.
Baehr, M. E., & Williams, G. B. (1967). Underlying dimensions of personal background dataand their relationship to occupational classification.Journal of Applied Psychology, 51,481-490.
Bagozzi, R. P., & Edwards, J. R. (1998). A general approach for representing constructs in or-ganizational research.Organizational Research Methods, 1, 45-87.
254 ORGANIZATIONAL RESEARCH METHODS

Bentler, P. M. (1989).EQS structural equations program manual. Los Angeles: BMDP Statisti-cal Software.
Bentler, P. M., & Chou, C. P. (1987). Practical issues in structural modeling.Sociological Meth-ods and Research, 16, 78-117.
Bollen, K. A. (1989).Structural equations with latent variables. New York: John Wiley.Borman, W. C. (1979). Format and training effects on rating accuracy and rater errors.Journal of
Applied Psychology, 64, 410-421.Cattell, R. B. (1956). Validation and intensification of the sixteen personality factors question-
naire.Journal of Clinical Psychology, 12, 205-214.Cattell, R. B., & Burdsal, C. A., Jr. (1975). The radial parcel double factoring design: A solution
to the item-vs-parcel controversy.Multivariate Behavioral Research, 10, 165-179.DeShon, R. P. (1998). A cautionary note on measurement error corrections in structural equation
models.Psychological Methods, 3, 412-423.Ding, L., Velicer, W. F., & Harlow, L. L. (1995). Effects of estimation methods, number of indi-
cators per factor, and improper solution on structural equation modeling fit indices.Struc-tural Equation Modeling, 2, 119-144.
Drasgow, F. (1995). Some comments on Labouvie and Ruetsch.Multivariate Behavioral Re-search, 30, 83-85.
Gerbing, D. W., & Anderson, J. C. (1988). An updated paradigm for scale development incorpo-rating unidimensionality and its assessment.Journal of Marketing Research,25, 186-192.
James, L. R. (1980). The unmeasured variables problem in path analysis.Journal of AppliedPsychology, 65, 415-421.
James, L. R., Mulaik, S. A., & Brett, J. M. (1982).Causal analysis: Assumptions, models, anddata. Beverly Hills, CA: Sage.
Jöreskog, K. G., & Sörbom, D. (1989).LISREL 7: A guide to the program and applications. Chi-cago: Scientific Software International.
Jöreskog, K. G., & Sörbom, D. (1993).New features in LISREL 8. Chicago: Scientific SoftwareInternational.
Jöreskog, K. G., & Sörbom, D. (1994).Simulation with PRELIS 2 and LISREL 8. Chicago: Sci-entific Software International.
Kishton, J. M., & Widaman, K. F. (1994). Unidimensional versus domain representative parcel-ing of questionnaire items: An empirical example.Educational and Psychological Mea-surement, 54, 757-765.
Labouvie, E., & Ruetsch, C. (1995). Testing for equivalence of measurement scales: Simplestructure and metric invariance reconsidered.Multivariate Behavioral Research,30, 63-76.
Lautenschlager, G. J. (1989). A comparison of alternatives to conducting Monte Carlo analysesfor determining parallel analysis criteria.Multivariate Behavioral Research,24, 365-395.
Lawrence, I. M., & Dorans, N. J. (1987, April).An assessment of the dimensionality of SAT-Mathematical. Paper presented at the annual meeting of the National Council on Measure-ment in Education, Washington, DC.
Manhart, J. J. (1996, April).Factor analytic methods for determining whether multiple-choiceand constructed-response tests measure the same construct. Paper presented at the annualmeeting of the National Council on Measurement in Education, New York.
Marsh, H. W. (1994). Confirmatory factor analysis models of factorial invariance: A multifac-eted approach.Structural Equation Modeling, 1, 5-34.
Marsh, H. W., Hau, K. T., Balla, J. R., & Grayson, D. (1998). Is more ever too much? Thenumber of indicators per factor in confirmatory factor analysis.Multivariate BehavioralResearch, 33, 181-220.
McDonald, R. P. (1995). Testing for equivalence of measurement scales: A comment.Multivari-ate Behavioral Research, 30, 87-88.
Hall et al. / ITEM PARCELING STRATEGIES IN SEM 255

Nesselroade, J. R. (1995). “. . . and expectation fainted, longing for what it had not.”: Commentson Labouvie and Ruetsch’s “Testing for Equivalence . . .” Multivariate Behavioral Re-search, 30, 95-99.
Owens, W. A. (1976). Background data. In M. D. Dunnette (Ed.),Handbook of industrial andorganizational psychology(pp. 609-644). Chicago: Rand McNally.
Schau, C., Stevens, J., Dauphinee, T. L., & Vecchio, A. D. (1995). The development and valida-tion of the survey of attitudes toward statistics.Educational and Psychological Measure-ment, 55, 868-875.
Snell, A. F., Hall, R. J., Davies, G. M., & Keeney, M. J. (1999, April).The implications of secon-dary factors for the use of item parcels in Structural Equation Modeling. Paper presented atthe 14th annual meeting of the Society of Industrial and Organizational Psychology, At-lanta, GA.
Snell, A. F., Hall, R. J., & Foust, M. S. (1997, August).Are testlets created equal: Examiningtestlet construction strategies in SEM. Paper presentation at annual meeting of the Acad-emy of Management, Boston.
Tanaka, J. S. (1987). “How big is enough?”: Sample size and goodness of fit in structural equa-tion models with latent variables.Child Development, 58, 134-146.
Thompson, B., & Melancon, J. G. (1996, November).Using item ‘testlets’/‘parcels’ in confir-matory factor analysis: An example using the PPSDQ-78. Paper presented at the annualmeeting of the Mid-South Educational Research Association, Tuscaloosa, AL.
Tremblay, P. F., & Gardner, R. C. (1996). On the growth of structural equation modeling in psy-chological journals.Structural Equation Modeling, 3, 93-104.
West, S. G., Finch, J. F., & Curran, P. J. (1995). Structural equation models with nonnormal vari-ables. In R. H. Hoyle (Ed.),Structural equation modeling: Concepts, issues, and applica-tions(pp. 56-75). Thousand Oaks, CA: Sage.
Widaman, K. F. (1995). On methods for comparing apples and oranges.Multivariate Behav-ioral Research, 30, 101-106.
Williams, L. J., & Anderson, S. E. (1994). An alternative approach to method effects by usinglatent-variable models: Applications in organizational behavior research.Journal of Ap-plied Psychology, 79, 323-331.
Williams, L. J., & Holahan, P. J. (1994). Parsimony-based fit indices for multiple-indicator mod-els: Do they work?Structural Equation Modeling, 1, 161-189.
Rosalie J. Hall is an assistant professor in the Department of Psychology at the University of Akron. She re-ceived her Ph.D. in Industrial/Organizational Psychology from the University of Maryland. Her current re-search interests include interpersonal perception in organizational settings and applied research methods.
Andrea F. Snell is an assistant professor in the Department of Psychology at the University of Akron. She re-ceived her Ph.D. in Human Differences and Measurement Psychology from the University of Georgia. Herresearch interests include the development of noncognitive selection measures and the assessment of re-sponse distortion effects.
Michelle Singer Foust is a doctoral candidate in Industrial/Organizational Psychology at the University ofAkron. Her research interests include employee lateness behaviors and advanced statistical methodologies.
256 ORGANIZATIONAL RESEARCH METHODS