it’s about time (and how we can model it)
TRANSCRIPT

It’s About Time
(and how we can model it)
1

Introduction� Douglas Nuttall, P.Eng.
� 22 years experience as Civil Engineer in land development, water resources, transportation.
� Modelling experience in hydrology, hydraulics, groundwater, thermal, solar.
� Studying Sustainability Engineering for 20 years: not part of my job + not a researcher = hobby
� 2 publications, blog on the topic.
2

Finding the Problem Statement� Traditional engineering finds short-term local
solutions to short-term local problems. Assumes everything is in isolation to everything else. FALSE!
� With our understanding of the world expanding, and the resilience of the system being consumed, short-term is becoming instantaneous, and local is the other side of the world. eg. Sudbury Superstack
� While Preventative Engineering will increase the signal to noise ratio between wanted and unwanted effects, how does society answer ‘What is wanted?’ –history indicates humanity is bad at that.
3

Journey to here� In 1996, I discovered what others had called
Sustainability Engineering, as a concept
� My desired outcome was to find a way to be able to answer with confidence if a particular alternative design was, or was not, the most Sustainable, and if it did, or did not, make the community more Sustainable.
� No methods at the time could answer both questions together.
� Few methods today can answer either question well.
4
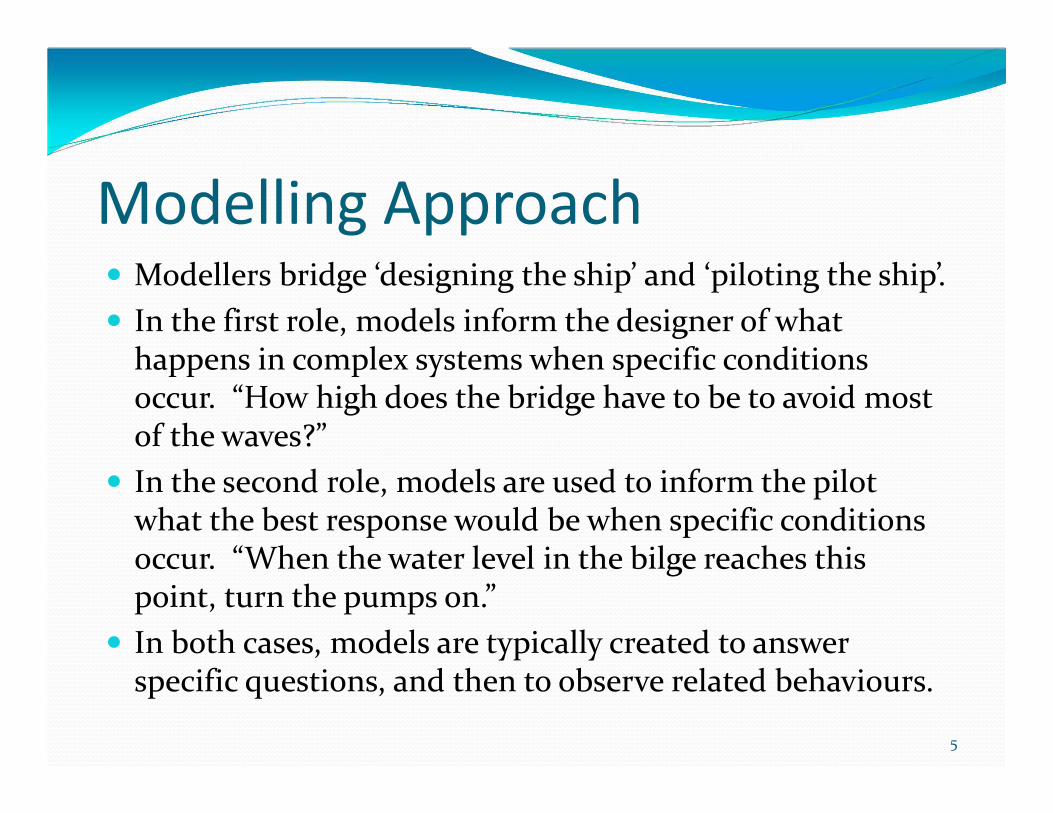
Modelling Approach� Modellers bridge ‘designing the ship’ and ‘piloting the ship’.
� In the first role, models inform the designer of what happens in complex systems when specific conditions occur. “How high does the bridge have to be to avoid most of the waves?”
� In the second role, models are used to inform the pilot what the best response would be when specific conditions occur. “When the water level in the bilge reaches this point, turn the pumps on.”
� In both cases, models are typically created to answer specific questions, and then to observe related behaviours.
5

Decisions� When designing the model, the modeller has to decide
what role they are playing: if design, then the units of measure must be well understood (length of ship); if monitoring, the important indicators must be understood (remaining fuel on board).
� There are dozens of indicators on the console of a ship. How many were used to design it? None.
� There are no ‘length of ship’ or ‘diameter of screw’ indicators on the console because they are fixed by the designer, not used by pilot.
6

Indicators� To manage any complex system, there are key
indicators that allow the managers of the system to determine what is happening, and to know what corrective action is required to fix things before a crisis.
� Many examples – economists use GNP and inflation, physicians use blood pressure and O
2saturation,
governments use polling results. Pilots may use compass, radar, depth sounder, etc.
� Fine for monitoring. Not useful in design.
7

Measurements
� In every form of engineering, there is a specific fundamental unit of measurement.
� In rivers, it is the rate of water entering and leaving the system, and the volume in the system.
� In structural, it is finding all of the applied loads, the corresponding stress, and the resistance to stress – force, and pressure.
� If we’re going to design, it’s going to have to be with something that can be measured. Units are required.
� What are the units of measure for Sustainability? And what are the relationships between them? We’ll get to that…
8

Sustainability is a Wicked ProblemWicked Problems are a class of problems that are defined as :� The problem is not understood until after the formulation of a
solution.� Wicked problems have no stopping rule.� Solutions to wicked problems are not right or wrong.� Every wicked problem is essentially novel and unique.� Every solution to a wicked problem is a 'one shot operation.'� Wicked problems have no given alternative solutions.
Wikipedia
And yet, a problem that is fully defined solves itself. Thus, Wicked Problems must not be fully defined. Perhaps they are not fully-definable. First step, therefore, is to complete the definitions as best we can, and solve those parts that are solvable.
9

Starting with Engineering
Engineering is the process of maximizing utility while minimizing cost to the client.
Sustainability Engineering must be more like ‘maximizing social benefit while minimizing negative ecological impact’. We’ll come back to this at the end.
10

Objectives for any system of
Sustainability Engineering:� objective, using units of measure instead of
indicators.� repeatable, so that anyone using the same data has
the ability to produce the same results.� sensitive to, but independent of: culture, climate,
labour and resource availability, technology, scale of community, and/or an undefined future.
� universal, able to be applied to any discipline of engineering.
� complete, able to address the potential quality of life within a community, and how that potential is actualized.
11
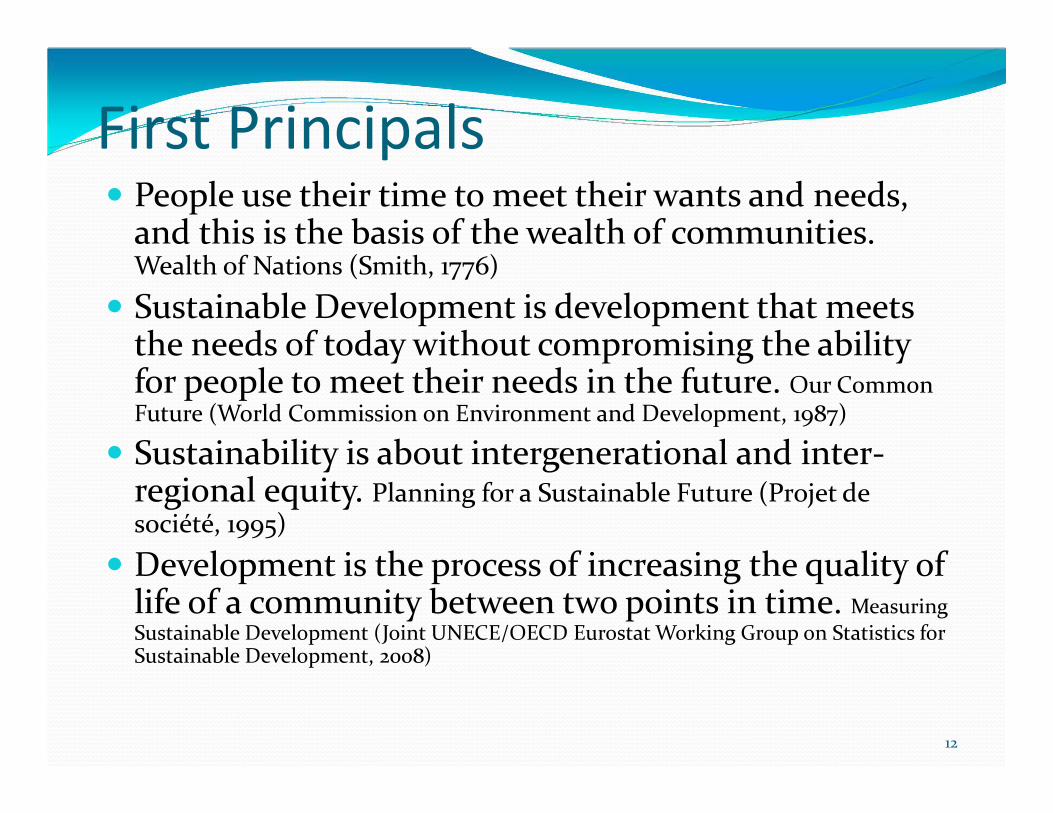
First Principals� People use their time to meet their wants and needs,
and this is the basis of the wealth of communities. Wealth of Nations (Smith, 1776)
� Sustainable Development is development that meets the needs of today without compromising the ability for people to meet their needs in the future. Our Common Future (World Commission on Environment and Development, 1987)
� Sustainability is about intergenerational and inter-regional equity. Planning for a Sustainable Future (Projet de société, 1995)
� Development is the process of increasing the quality of life of a community between two points in time. Measuring Sustainable Development (Joint UNECE/OECD Eurostat Working Group on Statistics for Sustainable Development, 2008)
12

More First Principals� Needs are universal and invariant, and the wealth of
the community comes from having needs met. Human
Scale Development (Max-Neef, et al., 1991)
� Daly's Rules Toward a Steady-state Economy (Daly, 1973)
� We must use renewable resources slower than they renew
� We must use non-renewable resources slower than they can be replaced with renewable alternatives
� We must produce wastes slower than the environment can absorb them or render them harmless
13

My definitions� Needs are aspects of Human Nature. Needs can be viewed,
at a minimum, as physical, mental, emotional, spiritual, and social. Examples would include rest, nutrition, love, governance, etc. In many cases, not meeting needs will have impacts in multiple ‘directions’ at once. Needs are met by activities that prevent the degradation of the individual, family or community. The tools and infrastructure associated with needs (or wants) would be the means to meet the needs, rather than needs themselves.
� On any scale, a community must be able to meet its needs with the resources it manages in perpetuity, and the labour it has available.
14

More definitions� Infrastructure is an investment of time and resources
with an expectation of a return on that investment in the form of time and/or resources into the future.
� Technological Development is the creation or enhancement of systems of infrastructure with the expectation of an improvement in the Potential Quality of Life of a community.
� Potential Quality of Life is the time available within a community for activities other than those required to meet needs.
15
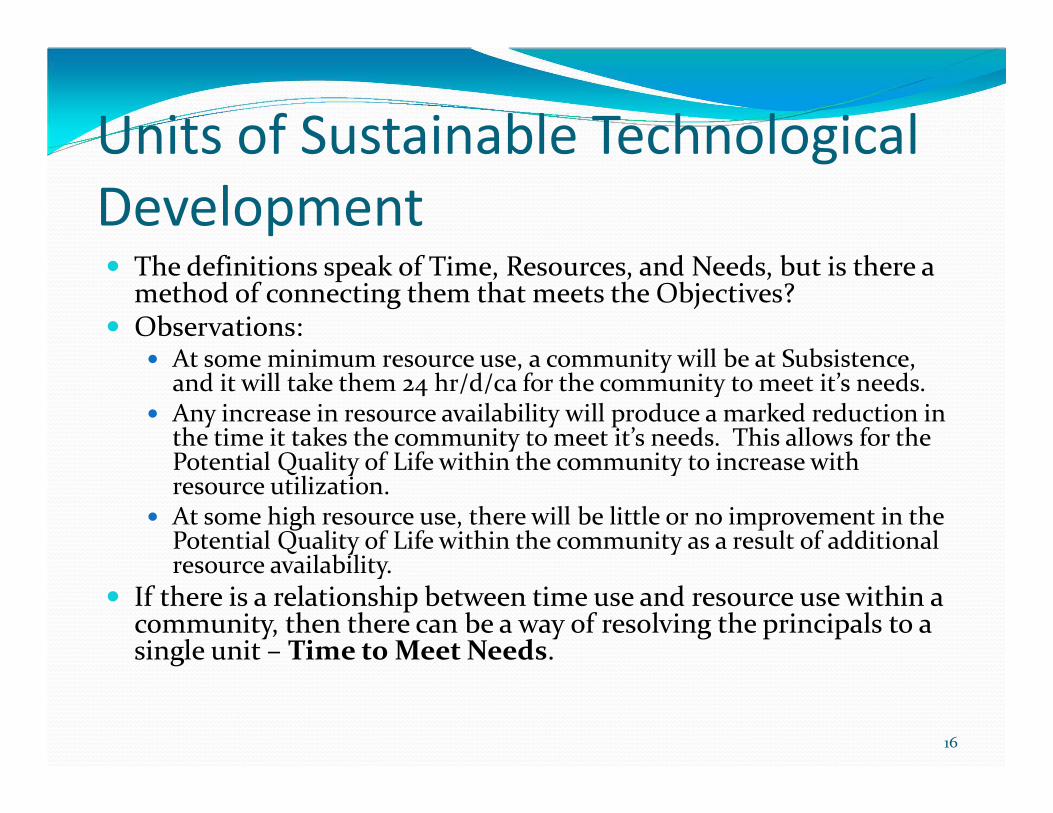
Units of Sustainable Technological
Development� The definitions speak of Time, Resources, and Needs, but is there a
method of connecting them that meets the Objectives?� Observations:
� At some minimum resource use, a community will be at Subsistence, and it will take them 24 hr/d/ca for the community to meet it’s needs.
� Any increase in resource availability will produce a marked reduction in the time it takes the community to meet it’s needs. This allows for the Potential Quality of Life within the community to increase with resource utilization.
� At some high resource use, there will be little or no improvement in the Potential Quality of Life within the community as a result of additional resource availability.
� If there is a relationship between time use and resource use within a community, then there can be a way of resolving the principals to a single unit – Time to Meet Needs.
16

Resource / Time Curve for Canada, 2005
0
360
720
1080
1440
0 5 10
Tim
e U
se t
o M
ee
t N
ee
ds
(min
/d/c
a)
Ecological Footprint (gHa/ca)
Household
y=ax^b+c
Capacity
17

What is Sustainability Engineering� Actualized Quality of Life is the time available for activities
other than meeting needs, as if all needs are met.� Sustainable Technological Development is creating or
enhancing the systems of infrastructure so that there is an expectation of a return on that investment into the future, when considering only the resources available in perpetuity to the community and the time required to meet needs within the community.
� Sustainability Engineering is the process of maximizing the Actualized Quality of Life within a community while minimizing the negative ecological impacts, through Sustainable Technological Development, while considering the obstructions within the existing society that prevent needs from being met.
18
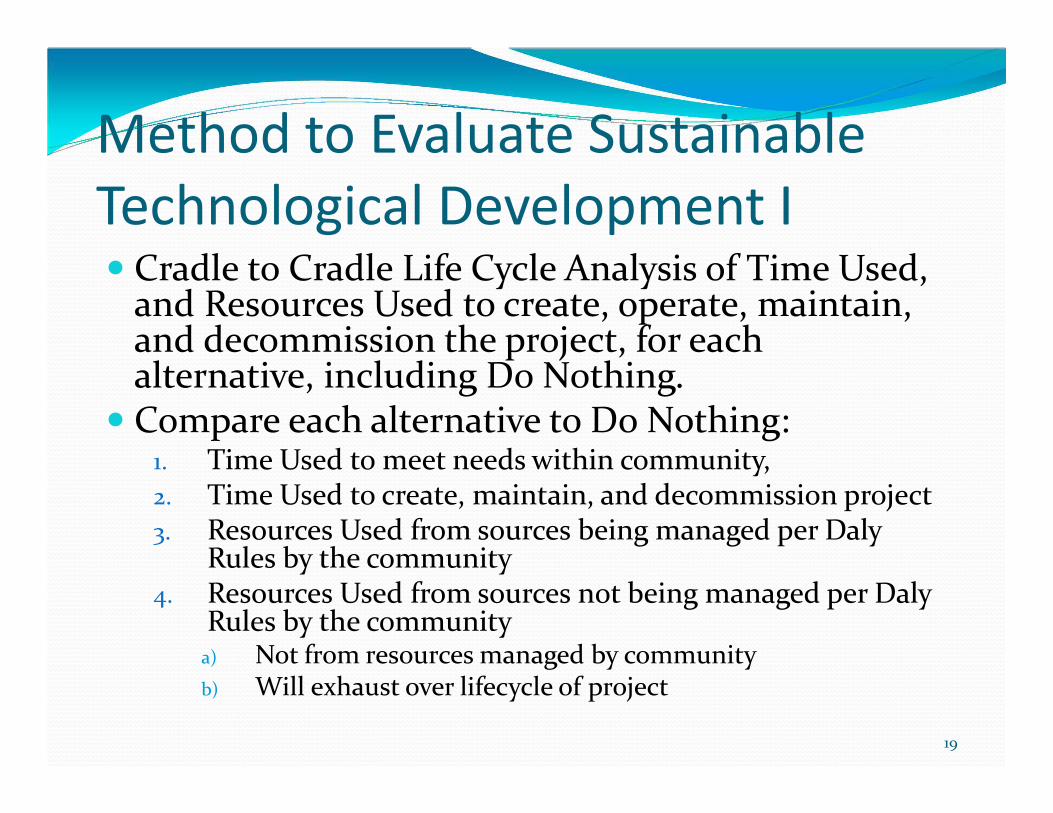
Method to Evaluate Sustainable
Technological Development I� Cradle to Cradle Life Cycle Analysis of Time Used,
and Resources Used to create, operate, maintain, and decommission the project, for each alternative, including Do Nothing.
� Compare each alternative to Do Nothing: 1. Time Used to meet needs within community, 2. Time Used to create, maintain, and decommission project3. Resources Used from sources being managed per Daly
Rules by the community 4. Resources Used from sources not being managed per Daly
Rules by the communitya) Not from resources managed by communityb) Will exhaust over lifecycle of project
19

Method to Evaluate Sustainable
Technological Development II
5. Convert (4a) to a Time Cost using the slope of the R/T curve at Capacity, and (4b) to a Time Penalty using the mass ratio of (4b) to total mass used, multiplied by the Time Benefit.
6. Subtract (2)+(5) from (1) =Net Time Benefit
7. Divide (6) by cost =Sustainable Value
� Additional math can be used to address the difference between met and unmet needs.
20

Evaluation of Results� All alternatives that have a Net Time Benefit > 0 makes
the community more Sustainable
� The alternative with the greatest Net Time Benefit makes the community the most Sustainable
� The alternative with the greatest Sustainable Value produces the greatest improvement in Potential Quality of Life in the community per dollar spent = best investment, ‘lowest hanging fruit’.
� If the total per capita Community Managed Ecological Footprint is less than Capacity, the community has the potential to be Sustainable.
21

Rubrick as a Marking Scheme for
Sustainability Engineering
� Incomplete Assignment: Status Quo. Client provides a problem for the engineer to solve. Engineer maximizes utility while minimizing the cost to the client. Short term solution to the symptom of an underlying problem.
� D: Level 1 Green Engineering. Client asks for a broader perspective from the engineer. Engineer maximizes utility while minimizing the cost to the client, and uses indicators (TBL, etc.) or criteria (LEED, Envision, etc.) to provide rationale for the broader perspective of ‘utility’. Probably long term solution to the symptom of an underlying problem. Bonus marks available if method addresses social justice in a meaningful way.
22

Rubrick as a Marking Scheme for
Sustainability Engineering
� C: Level 2 Engineering for Sustainable Development. Client asks for an underlying problem to be solved. Engineer uses community data to determine the greatest Potential Quality of Life (PQoL) that can be obtained through Technological Development. Long term solution to the problem identified by symptoms provided by the client.
� B: Level 3 Sustainability Engineering. Client asks engineer to identify the underlying problems and find the greatest possible improvement in the Actualized Quality of Life (AQoL). Engineer involves Human Development professionals to find how to work around the obstructions within society that prevent the PQoLfrom being Actualized. Long term solution to underlying problems using Technological Development.
23

Rubrick as a Marking Scheme for
Sustainability Engineering
� A: Level 4 Ideal (Undefined but required future condition). Client identifies that symptoms to problems exist. Human Development Professionals identify all obstructions within community and determine the means to remove them. Engineer provides appropriate T.D. solution once problems being solved can be done most economically (eg, when T.D. is the lowest hanging fruit). Problems are solved in most efficient manner available to community.
24

Conclusion� My theory does not fully address Sustainability
problems – only applies to Technological Development, not Human Development
� This is not the only possible solution to ‘What is Sustainable Technological Development’ – other units may exist.
� This is incomplete – still working on identifying and quantifying obstructions within society that prevent needs from being met.
� Human Time to Meet Needs is a necessary unit of measure for Sustainability Engineering
25

Questions?
26
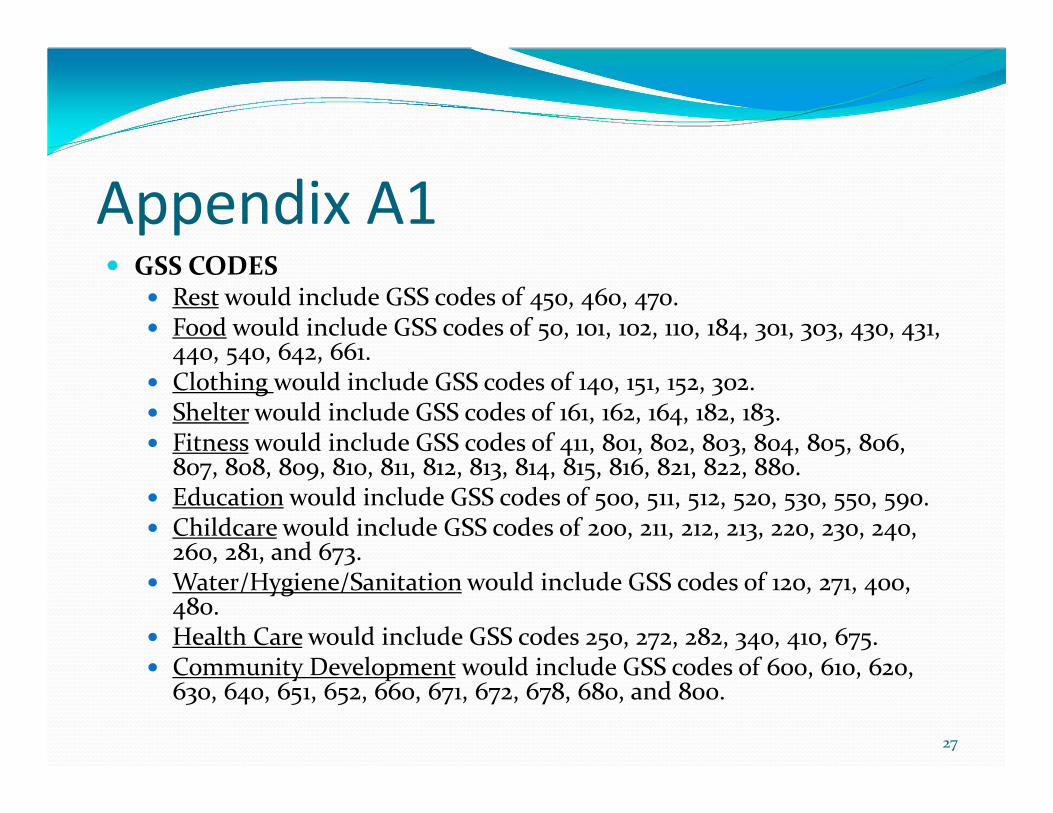
Appendix A1� GSS CODES
� Rest would include GSS codes of 450, 460, 470.� Food would include GSS codes of 50, 101, 102, 110, 184, 301, 303, 430, 431,
440, 540, 642, 661.� Clothing would include GSS codes of 140, 151, 152, 302.� Shelter would include GSS codes of 161, 162, 164, 182, 183.� Fitness would include GSS codes of 411, 801, 802, 803, 804, 805, 806,
807, 808, 809, 810, 811, 812, 813, 814, 815, 816, 821, 822, 880.� Education would include GSS codes of 500, 511, 512, 520, 530, 550, 590.� Childcare would include GSS codes of 200, 211, 212, 213, 220, 230, 240,
260, 281, and 673.� Water/Hygiene/Sanitation would include GSS codes of 120, 271, 400,
480.� Health Care would include GSS codes 250, 272, 282, 340, 410, 675. � Community Development would include GSS codes of 600, 610, 620,
630, 640, 651, 652, 660, 671, 672, 678, 680, and 800.
27

Appendix A2� NAICS CODES
� Food would include NAICS codes of 1111, 1112, 1113, 1119, 1121, 1122, 1123, 1124, 1125, 1141, 1151, 1152, 3112, 3113, 3114, 3115, 3116, 3117, 3118, 3119, 3253, 4111, 4131, 4171, 4183, 4451, 4452, 4931.
� Clothing would include NAICS codes of 3131, 3132, 3133, 3151, 3152, 3159, 3161, 3162, 3169, 4141, 4481, 4482, 8123.
� Shelter would be NAICS codes of 1131, 1132, 1133, 1153, 2361, 2372, 2381, 2382, 2383, 2389, 3211, 3212, 3219, 3272, 4161, 4163, 4172, 4441, 5617, 6233, 7213.
� Education would be NAICS codes of 6111, 6112, 6113, 6114, 6115, 6116, 6117.� Childcare would be NAICS code 6244� Water/Hygiene/Sanitation would be NAICS codes of 2213, 2371, 3256, 4145, 5621,
5622, 5629, 8122.� Health Care would be NAICS codes 3254, 4461, 6211, 6212, 6213, 6214, 6215, 6216,
6219, 6221, 6222, 6223, 6231, 6232, 6233, 6239.� Security would be NAICS codes 9111, 9112, 9121, and 9131.� Community Development would NAICS codes 8131, 8132, 8133, 8134.
28
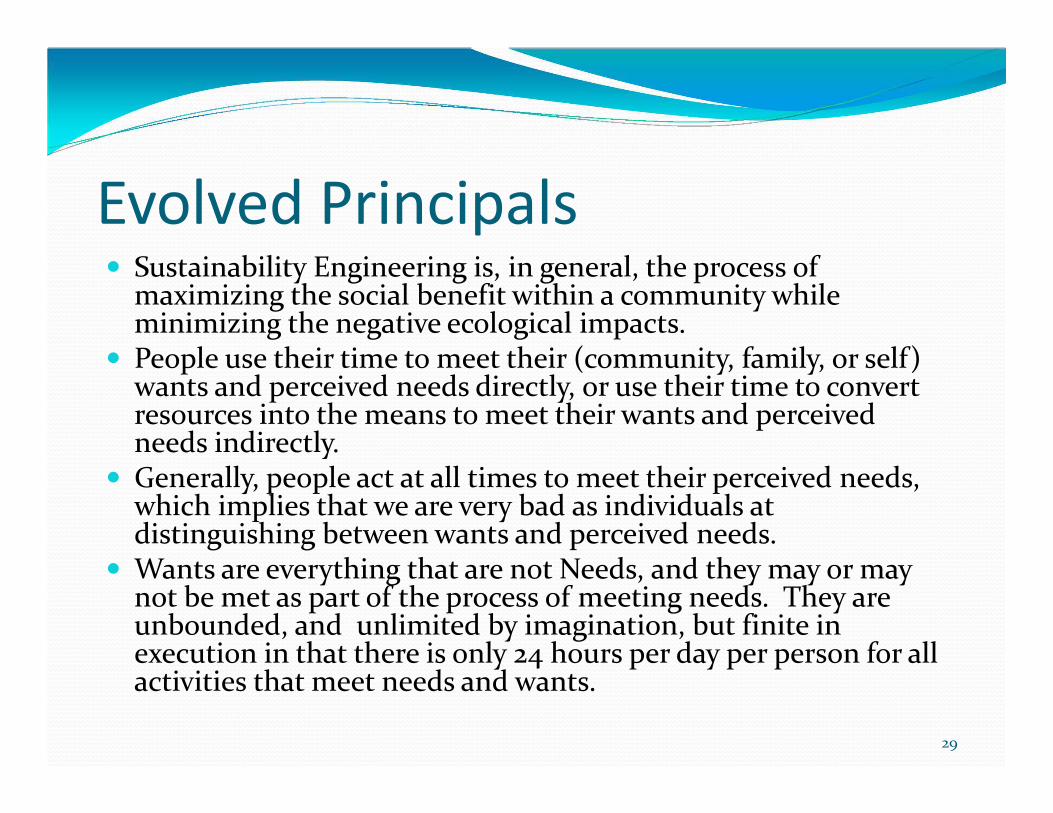
Evolved Principals� Sustainability Engineering is, in general, the process of
maximizing the social benefit within a community while minimizing the negative ecological impacts.
� People use their time to meet their (community, family, or self) wants and perceived needs directly, or use their time to convert resources into the means to meet their wants and perceived needs indirectly.
� Generally, people act at all times to meet their perceived needs, which implies that we are very bad as individuals at distinguishing between wants and perceived needs.
� Wants are everything that are not Needs, and they may or may not be met as part of the process of meeting needs. They are unbounded, and unlimited by imagination, but finite in execution in that there is only 24 hours per day per person for all activities that meet needs and wants.
29

Table B1 – Time Use Data SummarySource: Statistics Canada, Cycle 19 Global Social Survey, 12M0019XCB, 2006. This analysis is based on the Statistics
Canada General Social Survey, Cycle 19: Time Use, 2005. All computations, use and interpretation of these data are
entirely that of Douglas Nuttall, P.Eng.
Household income categories from Time Use Data
1 2 3 4 5 6 7 8 9 10 11 12
count 138 87 339 760 769 1517 1810 1551 1598 2126 1450 2307
Average time (min/d/ca) 985 1012 971 948 928 901 885 877 877 874 860 857
Stadev 255 228 250 233 229 237 241 243 243 241 248 246
Max 1440 1440 1440 1440 1440 1440 1440 1440 1440 1440 1440 1440
80 %ile 1209 1245 1200 1156 1134 1110 1110 1098 1100 1110 1101 1095
Median 990 995 975 945 920 890 860 850 840 838.5 820 810
20 %ile 745 797 740 740 720 690 670 660 660 660 650 650
Min 240 546 135 210 325 20 100 40 90 60 210 110
Averages, per category (min/d/ca)
Rest 566 578 577 563 550 537 521 524 513 508 504 500
Food 135 109 128 135 143 133 131 126 127 125 123 120
Clothing 28 20 22 27 25 24 26 24 23 27 23 21
Shelter 2 1 9 8 10 14 14 13 18 18 16 14
Fitness 22 35 29 25 24 24 28 28 28 32 31 30
Education 99 134 44 28 30 24 18 15 19 15 17 18
Childcare 11 21 16 19 17 16 19 24 25 27 28 30
H2O/hyg./sani. 72 75 74 82 78 69 73 69 66 64 63 62
health care 2 1 14 9 6 6 4 5 4 5 4 4
mobility for household 18 22 26 28 25 31 32 31 34 34 35 38
Community 27 11 25 20 16 20 16 15 17 16 14 14
mobility for community 4 5 5 4 6 4 4 4 4 4 4 4
Employment 54 59 72 78 113 157 197 221 228 241 272 278
employment to meet needs 17 24 27 32 47 74 91 104 111 117 128 127
mobility for employment 6 7 8 8 10 15 18 21 21 23 30 31 30
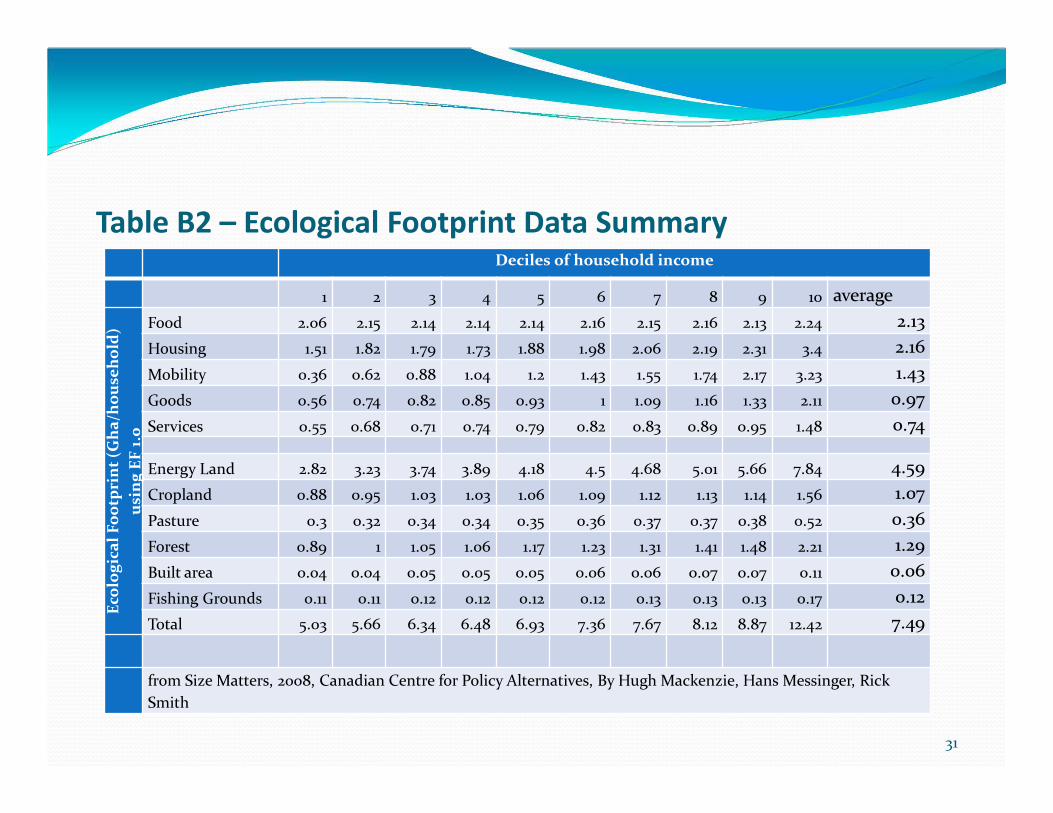
Table B2 – Ecological Footprint Data SummaryDeciles of household income
1 2 3 4 5 6 7 8 9 10 average
Eco
log
ica
l F
oo
tpri
nt
(Gh
a/h
ou
seh
old
)
usi
ng
EF
1.0
Food 2.06 2.15 2.14 2.14 2.14 2.16 2.15 2.16 2.13 2.24 2.13
Housing 1.51 1.82 1.79 1.73 1.88 1.98 2.06 2.19 2.31 3.4 2.16
Mobility 0.36 0.62 0.88 1.04 1.2 1.43 1.55 1.74 2.17 3.23 1.43
Goods 0.56 0.74 0.82 0.85 0.93 1 1.09 1.16 1.33 2.11 0.97
Services 0.55 0.68 0.71 0.74 0.79 0.82 0.83 0.89 0.95 1.48 0.74
Energy Land 2.82 3.23 3.74 3.89 4.18 4.5 4.68 5.01 5.66 7.84 4.59
Cropland 0.88 0.95 1.03 1.03 1.06 1.09 1.12 1.13 1.14 1.56 1.07
Pasture 0.3 0.32 0.34 0.34 0.35 0.36 0.37 0.37 0.38 0.52 0.36
Forest 0.89 1 1.05 1.06 1.17 1.23 1.31 1.41 1.48 2.21 1.29
Built area 0.04 0.04 0.05 0.05 0.05 0.06 0.06 0.07 0.07 0.11 0.06
Fishing Grounds 0.11 0.11 0.12 0.12 0.12 0.12 0.13 0.13 0.13 0.17 0.12
Total 5.03 5.66 6.34 6.48 6.93 7.36 7.67 8.12 8.87 12.42 7.49
from Size Matters, 2008, Canadian Centre for Policy Alternatives, By Hugh Mackenzie, Hans Messinger, Rick
Smith
31

Table B3 – Combined DataSource: Statistics Canada, Cycle 19 Global Social Survey, 12M0019XCB, 2006. This analysis is based on the Statistics
Canada General Social Survey, Cycle 19: Time Use, 2005, All computations, use and interpretation of these data are
entirely that of Douglas Nuttall, P.Eng.
Deciles of household income
1 2 3 4 5 6 7 8 9, 10
Tim
e U
se (
min
ute
s/d
ay)
of
resp
on
de
nt,
GS
S
Cyc
le 1
9
EF 5.03 5.66 6.34 6.48 6.93 7.36 7.67 8.12 10.645
count 1400 1402 1503 1613 1665 1601 1488 1377 2404
rest 567 544 530 522 520 511 508 504 500
food 132 138 132 129 126 126 125 123 120
clothing 25 25 25 25 23 24 27 23 22
shelter 8 12 14 14 15 18 18 16 14
fitness 26 24 26 28 28 30 32 31 30
education 46 27 21 17 16 17 15 17 18
childcare 18 17 18 21 24 26 27 28 30
H2O/hyg./sani. 79 73 71 72 68 65 64 63 62
health care 9 6 5 4 5 4 5 4 4
mobility for household 26 28 31 31 32 34 34 35 38
Community 21 18 18 16 16 16 16 14 14
mobility for community 4 5 4 4 4 4 4 4 4
sum 960.0 914.3 893.3 882.2 876.9 875.7 874.0 860.7 857.0
employment 34 135 175 204 224 233 241 271 277
employment to meet needs 13 61 82 95 107 113 117 128 127
mobility for employment 4 13 17 19 21 22 23 30 31
32

0
180
360
540
720
900
1080
1260
1440
0 2 4 6 8 10 12 14 16 18
Tim
e t
o M
ee
t N
ee
ds
(min
/da
y/c
a)
Ecological Footprint (gHa/ca)
Basic
c/w EF cost
Bel
ow
Su
bsi
sten
ce
Bel
ow
Cap
acit
y
Bey
on
d H
op
e
Bey
on
d C
apac
ity
33

� Below Subsistence: Resources unavailable to meet minimum needs, more than 24 h/d/ca required to meet needs of community.
� Below Capacity: Classic economics developed in this range. All increases in resource consumption produce an increase in the Potential Quality of Life of the community. Trickle Down makes sense.
� Beyond Capacity: Classic economics fails to predict reality. No increase in resource consumption will produce an increase in the Potential Quality of Life of the community.
� Beyond Hope. Imminent failure of ecosystem, economy, and society.
34

� Red Zone – less sustainable. Period.
� Orange Zone – can, under specific conditions, be more sustainable, but conditions may be hard to define
� Yellow Zone – would usually cause the community to become more sustainable.
� Green Zone – always will lead to a more sustainable community.
35

Addressing Effectiveness
� Find the time spent within the community for each need:
� For those individuals who have the need met = A
� For those individuals who have the need unmet =B
� Effectiveness E = ∑A/[∑A+∑B], all values summed across each need, for the whole population.
� Potential Quality of Life PQoL = 1440 min/ca/d –[∑A+∑B]
� Actualized Quality of Life AQoL = 1440 min/ca/d –[∑A+∑B]/E
= 1440 min/ca/d-(∑A+∑B)2/∑A
= 1440 min/ca/d-(∑A+2∑B+∑B2/∑A)
36
Further Reading� http://sustainabilityengineering.net/4-example/
� http://sustainabilityengineering.net/2015/10/27/goldilocks-and-the-3-sets-of-indicators/
� page 14 and 15 of http://issuu.com/glaciermedia/docs/civilwinterfinalde
� http://sustainabilitydesign.org/karlskrona-manifesto/
37