its impact on the global economy
TRANSCRIPT

ERF 13TH ANNUAL CONFERENCE
OIL:
ITS IMPACT ON THE GLOBAL ECONOMY
Conference Paper
►
FINANCIAL GUARANTEE AS INNOVATION TOOL
IN ISLAMIC PROJECT FINANCE
M. KABIR HASSAN ISSOUF SOUMARÉ
Kuwait, 16 – 18 December 2006

FINANCIAL GUARANTEE AS INNOVATION TOOL
IN ISLAMIC PROJECT FINANCE *
M. Kabir Hassan
Department of Economics and Finance
University of New Orleans
New Orleans, LA 70148 USA
Phone: 504-280-6163
Fax: 504-280-6397
Email: [email protected]
Email: [email protected]
&
Issouf Soumaré
Department of Finance & Insurance
Faculty of Business Administration
Laval University
Quebec, Qc. G1K 7P4 Canada
Phone: 418-656-2131 ext. 4298
Fax: 418-656-2624
Email: [email protected]
This version: August 2006
* Issouf Soumaré gratefully acknowledges the financial support from the Institut de Finance Mathématique of Montréal. The usual disclaimer applies.

1
FINANCIAL GUARANTEE AS INNOVATION TOOL
IN ISLAMIC PROJECT FINANCE
Abstract
This paper proposes a model to study the arrangement of Islamic project finance with
the participation of the government as provider of loan guarantees. The entrepreneur
(musharakah) initiates a project and raises funds by issuing Islamic profit sharing debt
instruments (mudarabah). The government intervenes in providing financial guarantees in
order to enhance the creditworthiness and increase the debt capacity of the project. Our work
raises several policy implications related to the structuring of Islamic project finance and the
participation of both government and multilateral public agencies such as the Islamic
Development Bank. It provides a unifying framework for the improvement of access to funds
for Islamic projects and gives a rationale for the government intervention in the arrangement of
those projects.

2
I. INTRODUCTION
The foundations of Islamic finance are described in the Muslim Holy book and the
traditions of the Prophet Muhammad (SAW). Under Islamic law (Sharia), making money from
money, such as charging interest, is usury and therefore not permitted. Wealth should be
generated only through legitimate trade and investment in assets. All forms of interests are
forbidden. Moreover, investment in companies involved with illicit activities or goods such as
alcohol, gambling, tobacco and pornography is strictly off limits. Islamic financing contracts
should be designed to avoid risk-free return and money from money (riba), uncertainty
(gharar) and gambling (maysir), e.g., Ebrahim (1999), Esty (2004) and CFA Magazine (2005).
Islamic financial instruments have to be carefully structured so that the exchange involves
goods for money or partnership shares for money over time. The Islamic financial model
works on the basis of risk sharing. Islamic banking is growing at a rate of 15% to 20% per
year, e.g., Esty (2004), KPMG Tax Monitor (2005). Some western countries are changing their
tax codes in order to accommodate Islamic finance (see KPMG Tax Monitor (2005), BBC
News (2004)).1 The singularities of Islamic finance require the conventional finance approach
to be redesigned in order to satisfy the criteria of Islamic financing. These restrictions impose
financing constraints to entrepreneurs seeking funds to undertake large scale Islamic project
financed investments.
Indeed, project finance is an arrangement in which a sponsor creates a new project
company and looks to the project future cash flows as the main source of repayment to lenders.
It allows better risk sharing since lenders have to evaluate and audit only the project assets
rather than having to assess both project and sponsor assets as would be the case with other
financing vehicles. Project finance is an increasingly important method of financing large-
scale capital-intensive projects, such as power plants, oil pipelines, automated steel mills,
roads, ports, tunnels, etc. The demand for financing often exceeds the supply capacity of the
project sponsor and of local capital markets (Farrell, 2003). According to Esty (2004), project-
financed investments have grown at a compound rate of almost 20 percent over the past 10
years and globally firms financed 234 billion dollar US of capital expenditures using project
finance in 2004, up from 172 billion dollar US in 2003. Kleimeier and Megginson (2001)
1 According to August 2005 KPMG Tax Monitor: “The last decade has seen tremendous growth in the Islamic financial system. More than 240 financial institutions – in more than 48 countries – now practice some form of Islamic finance. Moreover, Islamic banking assets worldwide are estimated at over US$200 billion with an average annual growth rate of 15 percent in recent years. The UK have published changes to tax rules in an effort to accommodate Islamic financial products. Should Ireland do the same?” For BBC News on Islamic banking go to http://news.bbc.co.uk/2/hi/business/3676138.stm.

3
compare empirically portfolios of project finance loans to comparable samples of non-project
finance loans. They find that project finance loans have longer maturities and are more likely
to have third party guarantees. Moreover, projects funded with project finance loans are highly
leveraged with an average loan to project value ratio of 67 percent. Ebrahim (1999) establishes
a comparative study between Islamic and conventional project finance. Khan (2002) analyses
cases involving Islamic instruments in financing build operate and transfer (BOT) Projects.
This paper studies the dynamics between equityholders (musharakah), profit sharing
lenders (mudarabah) and the government in the arrangement of Islamic project financed
investments. The shareholders (musharakah) being the entrepreneur initiates a project and
seeks outside funds to finance it. The entrepreneur finances part of the project investment with
own capital and the remaining amount is provided by debtholders in a profit sharing contract
(mudarabah). In this financing agreement, lenders share the project after tax net-income with
equity holders if the project is successful, but looses their investment in case of default by the
project. To reduce the default risk and enhance the creditworthiness of the project, the
government intervenes by providing partial financial loan guarantees. If the project turns out to
be successful, the government gains tax revenues, debtholders and equityholders share the
after tax net-income using a preset sharing formula. We argue that by appropriate risk sharing
and/or government financial loan guarantee, project sponsors in the Islamic world can enhance
the creditworthiness and increase the debt capacity of their project financed investments.
Since project financed investments involve huge amounts of financing and are highly
levered, one way for lenders to hedge credit risk is to require financial guarantees for the loans
they make. A financial guarantee is a promise from a third party to make good on payments to
the fund provider when the borrower defaults. To have access to more funds and at lower
costs, firms resort to financial guarantees to improve their credit rating and debt capacity (The
World Bank; 1995, 2002). Government agencies and international organizations such as the
World Bank, and Export Credit Agencies are some of the main providers of financial
guarantees, especially to back large-scale projects financing (e.g., Dailami and Leipziger
(1998), Ehrhardt and Irwin (2004)).2
2 In fiscal year 2005 (as of September 2005), Export-Import Bank the export credit agency of the United States supported by project finance 405 million dollar US in Qatar Liquified Gas Co. II, 230 million dollar US in Egypt Basic Industries Corp. (EBIC) and 263 million dollar US in Q-Chem II. (See Export-Import Bank of the United States website: http://www.exim.gov/products/guarantee/pfauth.html). On September 13, 2005, the Multilateral Investment Guarantee Agency, MIGA, a private sector branch of the World Bank Group, said it issued $1.2 billion in investment guarantees (insurance) for 33 new projects (62 contracts) in developing countries during the fiscal year ending June 30, 2005. (See MIGA website: http://www.miga.org/).
4
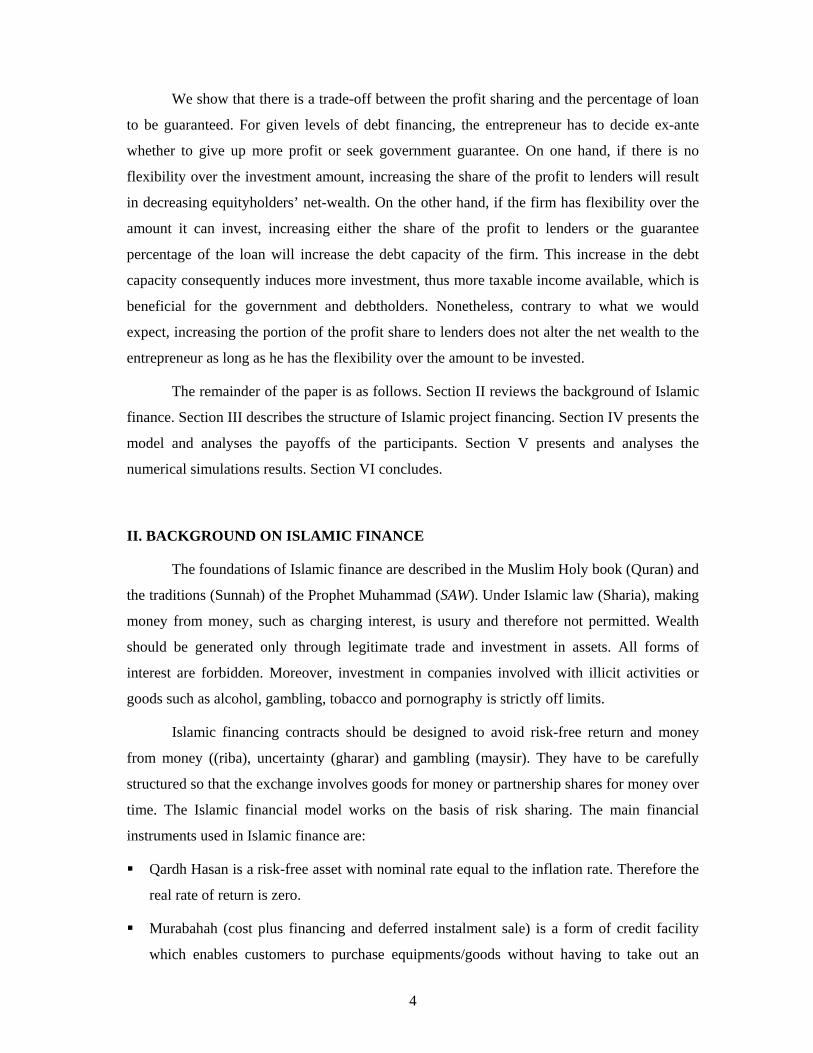
We show that there is a trade-off between the profit sharing and the percentage of loan
to be guaranteed. For given levels of debt financing, the entrepreneur has to decide ex-ante
whether to give up more profit or seek government guarantee. On one hand, if there is no
flexibility over the investment amount, increasing the share of the profit to lenders will result
in decreasing equityholders’ net-wealth. On the other hand, if the firm has flexibility over the
amount it can invest, increasing either the share of the profit to lenders or the guarantee
percentage of the loan will increase the debt capacity of the firm. This increase in the debt
capacity consequently induces more investment, thus more taxable income available, which is
beneficial for the government and debtholders. Nonetheless, contrary to what we would
expect, increasing the portion of the profit share to lenders does not alter the net wealth to the
entrepreneur as long as he has the flexibility over the amount to be invested.
The remainder of the paper is as follows. Section II reviews the background of Islamic
finance. Section III describes the structure of Islamic project financing. Section IV presents the
model and analyses the payoffs of the participants. Section V presents and analyses the
numerical simulations results. Section VI concludes.
II. BACKGROUND ON ISLAMIC FINANCE
The foundations of Islamic finance are described in the Muslim Holy book (Quran) and
the traditions (Sunnah) of the Prophet Muhammad (SAW). Under Islamic law (Sharia), making
money from money, such as charging interest, is usury and therefore not permitted. Wealth
should be generated only through legitimate trade and investment in assets. All forms of
interest are forbidden. Moreover, investment in companies involved with illicit activities or
goods such as alcohol, gambling, tobacco and pornography is strictly off limits.
Islamic financing contracts should be designed to avoid risk-free return and money
from money ((riba), uncertainty (gharar) and gambling (maysir). They have to be carefully
structured so that the exchange involves goods for money or partnership shares for money over
time. The Islamic financial model works on the basis of risk sharing. The main financial
instruments used in Islamic finance are:
Qardh Hasan is a risk-free asset with nominal rate equal to the inflation rate. Therefore the
real rate of return is zero.
Murabahah (cost plus financing and deferred instalment sale) is a form of credit facility
which enables customers to purchase equipments/goods without having to take out an

5
interest bearing loan. The bank buys an item and then sells it on to the customer on a
deferred basis.
Ijara (operating lease) is a leasing agreement whereby the bank buys an equipment or
productive asset for a customer and then leases it back over a specific period. The client
avoids initial capital outlay. In some cases, the customer is able to buy the item at the end
of the contract.
Mudarabah is a profit-and-loss sharing Islamic income or revenue bond contract. It offers
specialist investment in which the project owner(s) and the investor share any profits. It
does not guarantee any fixed rate of return (ribawi), instead, the investor receives a share
of the profit or bears the losses generated by the business venture, and the principal is paid
(in real terms) at the termination of the contract.
Musharakah is an investment partnership in which profit sharing terms are agreed in
advance, and losses are pegged to the amount invested. It is an equity participation or stock
ownership contract.
Next, we describe the structure of the Islamic project finance and discuss how the financial
instruments mudarabah and musharakah can be used to finance it.
III. STRUCTURE OF THE ISLAMIC PROJECT FINANCING
We consider an entrepreneur (or sponsor) who wants to undertake a new investment
project. Several owners can co-exist in this new venture; however, we use the term
entrepreneur to design the ‘representative equityholder’. The project will be built as a stand-
alone firm, meaning that the project is an independent and separate entity. The project requires
an initial investment I. The entrepreneur has limited liability; his only commitment in the
project is its capital infusion S. Debtholders provide the remaining amount D = I - S. However,
the entrepreneur is facing the constraint that the project can be undertaken only if the
investment level I is superior to the minimum required investment I , I ≥ I . In this kind of
Islamic financing, the equityholder (musharakah) has to share the profit with debtholders
(mudarabah) if the project is successful. In distress situation, the priority goes to debtholders.
Debtholders receive fraction of the firm’s after tax net profit plus their principal amount (the
principal is paid in real terms not in nominal) if the project is successful. Hence, the owner-
entrepreneur keeps the residual value of the project.

6
If the project is undertaken, the government benefits from it because of the corporate
taxes. Therefore, it is in the interest of the government to encourage the entrepreneur to go
ahead with the project. But, in the Islamic context, since the conventional capital market
channel cannot always be used, it can be hard for the entrepreneur to raise enough money in
order to finance the project. To overcome that, the government will intervene by providing
partial loan guarantees for the project loan. There are many ways for the government to do so.
One way will be through multilateral public agencies such as the Islamic Development Bank.
The government will act so as far as the net social benefit outweighs the loan guarantee cost.
The maximum government guarantee coverage should be obtained when the maximum benefit
is equal to the marginal cost of guaranteeing the loan. We use as proxy for the social benefit,
the amount of tax the government receives from the project.
Figure 1 describes the relationships between the entrepreneur (shareholders), lenders
and the government. The project is financed by the entrepreneur and debtholders. The
government enhances the creditworthiness of the project by providing loan guarantees. If the
total financing exceeds the minimum capital requirement, the project goes ahead, otherwise the
project is abandoned. When the project goes ahead, the investment is made and the project
yields cash revenues. The cash revenues are then redistributed among the players, i.e., the
government collects taxes, debtholders receive their repayment which is composed of the
principal and share of the profit, and equity holders are left with the residual value. Therefore,
the success of the project benefits all parties involved which is consistent with the risk sharing
philosophy behind Islamic finance.
Insert Figure 1 here
Based on this Islamic project finance structure, next we present the model and analyse
the payoffs to the participants.
IV. THE MODEL
As described in the previous section, we consider an entrepreneur (or sponsor) who
wants to undertake a new investment project. The project will be built as a stand-alone firm,
meaning that the project is an independent and separate entity. The project requires an initial
investment I and its cash flows are characterized by the following technology )(~ IvV θ= where
θ~ is the random output price which captures the stochastic nature of the cash flows and v(I) is
a twice differentiable concave function of investment. We assume the project cash flows to

7
have the following risk adjusted stochastic process:
tttt dWIVdtIVIdV )()()()( σλσµ +−= , (1)
where µ, σ and λ are respectively the instantaneous return, volatility and market price of risk
of the project’s asset returns. The random variable W is a standard Wiener process.
In Islamic finance, there is no risk-free rate, but instead any money deposit in a bank
account and not used for investment will grow at the inflation rate π. Under the risk neutral
valuation à la Harrison and Kreps (1979) and Merton (1974), the parameter λ is the market
price of risk for the project. In the special case of a tradable security, λσµ − is equal to the
inflation rate π in equation (1).3
As mentioned before, the project requires an initial endogenous investment level I, but
there is a minimum investment requirement in the sense that the entrepreneur has to raise at
least I before the project can be undertaken. The project sponsor (or shareholders) has limited
financing capacity, therefore he can only finance an amount S of the total investment. He then
needs outside financing in the form of profit and loss sharing certificate. In other words, the
entrepreneur can infuse a capital level S and has to borrow I - S to finance the new project. We
assume a simple capital structure for the project, consisting of single debt and equity contracts.
The maturity of the project is T. We assume the existence of corporate taxes. The project is
owned by the entrepreneur and the project cash flows are used to pay the project debtholders.
In this financing framework, often referred to as non- or limited recourse financing, lenders
depend on the performance of the project itself for repayment rather than the credit of the
sponsor. The only commitment of the sponsor is its capital contribution.
In the following subsections, we present respectively, the cost/benefit to the
government, the payoff from the participation constraint of lenders, and the payoff to the
owner-entrepreneur.
IV.1. Guarantee cost and tax revenue to the government
The government acts as a stakeholder in the project by providing partial loan
guarantees. The incentive for the government is to gain positive social benefits if the project is
realized. The government insures a fraction ω of the loan principal, with 0≤ ω ≤1. From the
structural approach of Merton (1974, 1977), the total loan guarantee cost to the government is
3 See Hull (2005) for a general discussion on the use of risk neutral valuation in valuing real options and the estimation of λ. Schwartz and Moon (2000) propose a risk neutral pricing model of internet companies.

8
equivalent to a put option and is given as follows
[ ] )()()()0),(max( )(0 zNeIVTzDNeIVDeEG TT
TT −−+−=−= −−−− πλσµππ σωω , (2)
where T
TDIVz
σσλσµω )5.0()/)(ln( 2
0 +−+= and N(.) is the cumulative normal distribution
function.
By guaranteeing the debt, the government expects to raise more taxes to fulfill its
social agenda. If the project is realized, the expected tax revenue to the government will be
[ ] )()()()0,)(max( )(0 TxINexNeIVIIVeETaxes c
TTcTc
T στττ ππλσµπ −−=−= −−−− , (3)
where T
TIIVx
σσλσµ )5.0()/)(ln( 2
0 +−+= and τc is the corporate tax rate.
The net gain to the government is the difference between the tax gain and the cost of
the guarantee, i.e., Taxes - G. Therefore, the participation constraint of the government is such
that the net gain to him is positive, Taxes - G ≥ 0.
IV.2. Lenders’ participation constraint and project debt capacity
As we mentioned above, the project is financed with equity and debt. The entrepreneur
contributes S and the rest I - S is financed by outside investors in the form of profit-sharing
Islamic bond instrument. Outside investors share the profit with the owner-entrepreneur. At the
maturity T, if the project is successful, debtholders receive their principal otherwise they loose
money since they won’t be able to recover the full amount of the principal.
Optimal debt without financial guarantee
In absence of loan guarantee, the payments to debtholders at date T are:
⎪⎩
⎪⎨
⎧
≤≤<
>−−+=
DIVIIVD
IIV
IVD
IIVqDD
T
T
T
T
Tc
T
)()(
)(
ififif
)(
))()(1( τ, (4)
where q is the profit sharing allocation parameter.
Equation (4) states that if the cash flow generated by the project exceeds the initial
investment amount, debtholders receive their principal amount D and share of the after tax net-
income (percentage q). Otherwise, they receive only the principal amount when the project end
value is greater than the principal amount and the project savage value in case the project

9
market value is inferior to the principal amount. Therefore, the equilibrium value of the debt
today is the expected present value of the terminal payments to debthoders:
[ ] { }[ ] { }[ ][ ]
)()()(
)()()()1(
1)(1)0,)(max()1(
)(0
)(0
)()(
yNeIVTyDNe
TxINexNeIVq
IVeEDeEIIVqeED
TT
TTc
DIVTT
DIVT
TcT
TT
−+−+
−−−=
×+×+−−=
−−−
−−−
≤−
>−−
πλσµπ
ππλσµ
πππ
σ
στ
τ &&
, (5a)
or
[ ])()()1(
)()()1()( )(0
TyDNeTxINeq
yNxNqeIVDTT
c
cT
σστ
τππ
πλσµ
−+−−−
−+−=−−
−−
, (5b)
where T
TIIVx
σσλσµ )5.0()/)(ln( 2
0 +−+= and
TTDIV
yσ
σλσµ )5.0()/)(ln( 20 +−+
= .
After few algebraic manipulations, we can show that the maximum total amount of
debt without guarantee will be
[ ])(1
)()1()()()1()( )(0
TyNeTxINeqyNxNqeIVD
T
Tcc
T
σσττ
π
ππλσµ
−−−−−−+−
=−
−−−
. (6)
Given the level of sponsor contribution S or total investment I to be made, equation (6)
allows us to solve for the maximum level of debt outside investors will be willing to extend to
the project. Equation (6) is a fixed point problem as x and y contains D, we solve for the level
of maximum debt using Matlab optimization toolbox. We denote by DNG the optimal debt
level without financial guarantee. If the entrepreneur were to change the investment level, the
debt amount will also change.
Optimal debt with financial guarantee
Instead, in the presence of financial guarantee, the value of the guaranteed debt will be
equal to the value of the debt without guarantee plus the value of the guarantee, i.e.,
GDD NG += . Using equations (2) and (4), we obtain
[ ][ ])()(
)()1()()()()1()(
][)(
0
TzNTyNDe
TxINeqzNyNxNqeIV
GDeED
T
Tcc
T
TT
σωσ
σττπ
ππλσµ
π
+−+−+
−−−−−−+−=
+=
−
−−−
−
, (7)
which yields,

10
[ ])()(1
)()1()()()()1()( )(0
TzNeTyNeTxINeqzNyNxNqeIVD
TT
Tcc
T
σωσσττ
ππ
ππλσµ
+−−−−−−−−−−+−
=−−
−−−
. (8)
Given the level of sponsor contribution S or investment I, equation (8) is a fixed point
problem as x, y and z contains D. We use Matlab optimization toolbox to solve for D. We
denote by DG the optimal maximum guaranteed debt. In conventional modern finance, in
presence of credit insurance, debtholders will either decrease the credit premium they require
to lend to the firm or they will increase their funding to the firm because the credit insurance
enhances the project creditworthiness and increases its borrowing capacity. In Islamic banking,
there is no return premium; the credit improvement will translate through changes in the profit
sharing parameter q and/or the debt capacity DG.
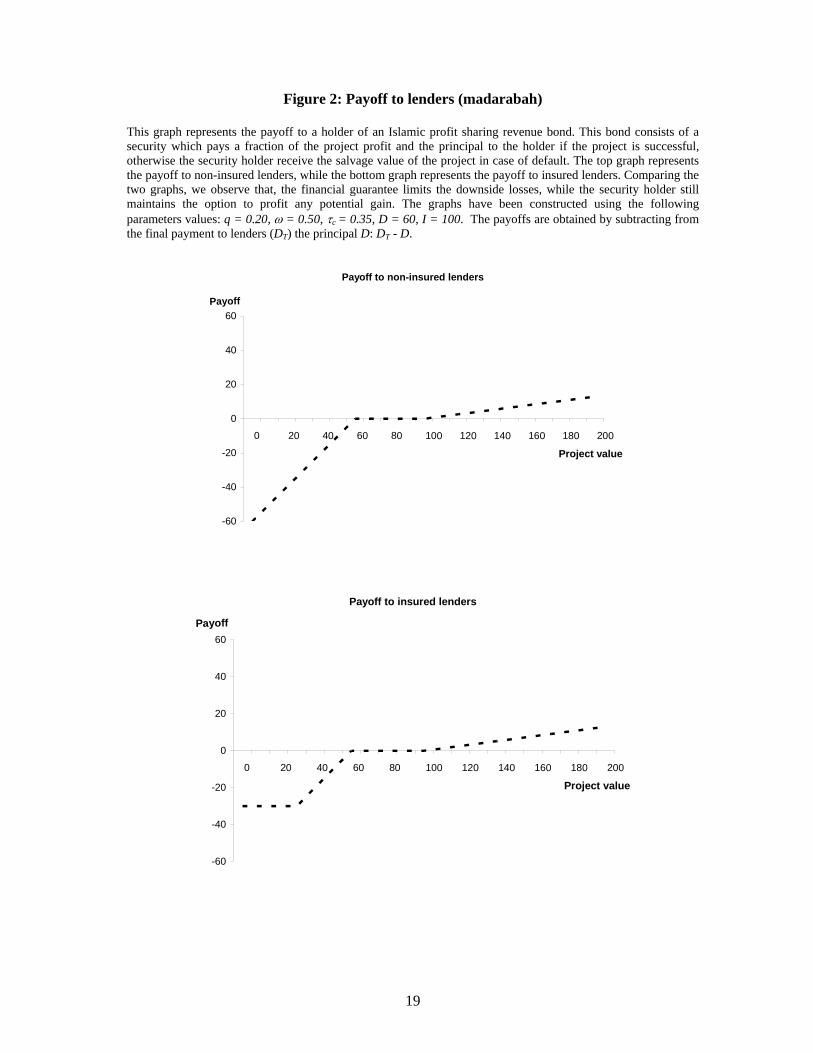
Figure 2 plots the payoffs to lenders as function of the value of the project. In the first
graph (top graph), the payoff of the non-insured debt is plotted. As illustrated, in bad
performance states, lenders loose their initial investment, but in good states, they recover the
principal of their investment plus share of the profit. In the second graph (bottom graph), the
payoff to the insured lenders is plotted. As illustrated by the graph, the government loan
guarantee reduces the downside losses to lenders. In good performance states, lenders still
receive their principal and share of the profit.
Insert Figure 2 here
IV.3. Net-wealth to the entrepreneur-owner
The project borrows D at the beginning and promise to pay fraction q of the after tax
net-income plus the principal amount D at date T. Hence, the owner-entrepreneur keeps the
residual value of the project. Therefore, the residual to the owner-entrepreneur in the new
venture at time T is as follows:
⎪⎩
⎪⎨
⎧
≤≤<
>−
−−−−−−=
DIVIIVD
IIVDIV
IIVIIVqDIVR
T
T
T
T
TcTcT
T
)()(
)(
ififif
0)(
))(())()(1()( ττ, (9)
Equation (9) states that the residual value to the entrepreneur is the difference between
the project value and the payments to debtholders and government when the project value is
greater than the initial investment amount. Otherwise, it is either the difference between the
firm value and the principal payment or zero whichever is greater. The net-wealth of the
11
owner-entrepreneur in the new venture is the expected present value of its terminal payoff
given in equation (9) minus his initial capital contribution:
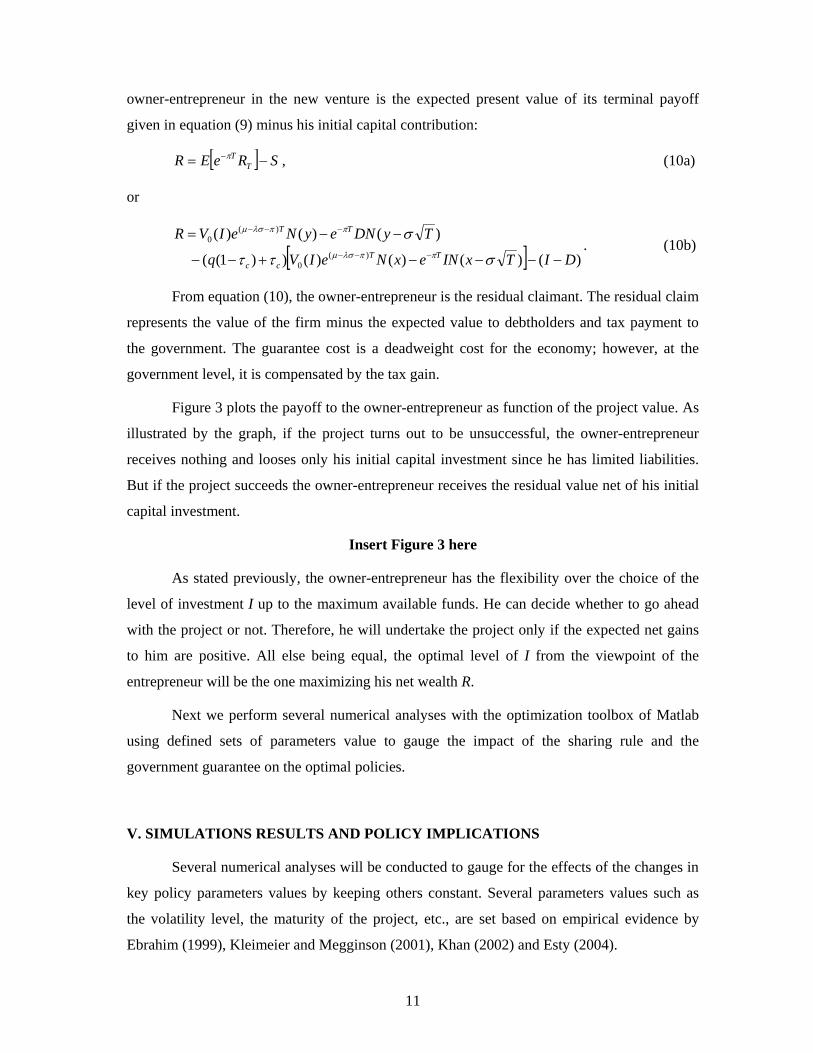
[ ] SReER TT −= −π , (10a)
or
[ ] )()()()())1((
)()()()(
0
)(0
DITxINexNeIVq
TyDNeyNeIVRTT
cc
TT
−−−−+−−
−−=−−−
−−−
σττ
σππλσµ
ππλσµ
. (10b)
From equation (10), the owner-entrepreneur is the residual claimant. The residual claim
represents the value of the firm minus the expected value to debtholders and tax payment to
the government. The guarantee cost is a deadweight cost for the economy; however, at the
government level, it is compensated by the tax gain.
Figure 3 plots the payoff to the owner-entrepreneur as function of the project value. As
illustrated by the graph, if the project turns out to be unsuccessful, the owner-entrepreneur
receives nothing and looses only his initial capital investment since he has limited liabilities.
But if the project succeeds the owner-entrepreneur receives the residual value net of his initial
capital investment.
Insert Figure 3 here
As stated previously, the owner-entrepreneur has the flexibility over the choice of the
level of investment I up to the maximum available funds. He can decide whether to go ahead
with the project or not. Therefore, he will undertake the project only if the expected net gains
to him are positive. All else being equal, the optimal level of I from the viewpoint of the
entrepreneur will be the one maximizing his net wealth R.
Next we perform several numerical analyses with the optimization toolbox of Matlab
using defined sets of parameters value to gauge the impact of the sharing rule and the
government guarantee on the optimal policies.
V. SIMULATIONS RESULTS AND POLICY IMPLICATIONS
Several numerical analyses will be conducted to gauge for the effects of the changes in
key policy parameters values by keeping others constant. Several parameters values such as
the volatility level, the maturity of the project, etc., are set based on empirical evidence by
Ebrahim (1999), Kleimeier and Megginson (2001), Khan (2002) and Esty (2004).

12
V.1. The role of financial guarantee in absence of investment flexibility
We define the absence of investment flexibility by the fact that the project requires an
exact investment amount and there is no room for the entrepreneur to change the level of the
investment, in other worlds, either he raises the required amount or the project is not
undertaken. The numerical simulation results are presented in Figure 4.
Insert Figure 4 here
In Figure 4, without loss of generality, the level of investment I is normalized to 100. We
analyse the sensibilities of the optimal policies (the government guarantee percentage, the cost
of the guarantee to the government, the entrepreneur’s net wealth and the debt ratio) to the
profit sharing parameter q for different levels of capital contribution from the entrepreneur
measured as the percentage of sponsor own capital in total investment. From the percentage
capital level of the entrepreneur, we compute the amount of the capital contribution by the
entrepreneur S. The debt amount to be raised is therefore the difference between the
investment and the entrepreneur capital, i.e., I - S. To raise the required debt level, the
entrepreneur needs financial guarantees as illustrated in Figure 4.
We observe that the government loan guarantee enhances the creditworthiness of the
project. However, the firm needs less government guarantees when the profit sharing
parameter is high and the sponsor’s own capital is big. Therefore, with limited capital, the
entrepreneur trades-off between the fraction of the profit to extend to lenders and the partial
guarantee portion. When the profit sharing parameter increases, the partial guarantee portion
decreases. In this non-flexible investment environment, increasing the profit sharing parameter
q decreases the net-wealth to the entrepreneur. Intuitively, since the investment level does not
change, the cash flow level is the same, and so is the before tax net-income. As a consequence,
the government net-wealth is decreasing with the cost of the guarantee. We should keep in
mind that we have assumed no investment flexibility; in presence of investment flexibility, the
outcome could be different.
V.2. The role of financial guarantees with investment flexibility
In contrast to the absence of investment flexibility, here we assume that the
entrepreneur can increase or decrease the level of the investment as long as the investment

13
level is above the minimum required investment. For the numerical simulations, we assume
the capital contribution from the entrepreneur to be fixed, but the investment level is varying
with the debt capacity which is function of the percentage of guarantee provided and the
sharing rule parameter. The numerical simulations results are plotted in Figure 5.
Insert Figure 5 here
The graphs show the simultaneous impacts of the government loan guarantee and the
profit sharing parameter on the optimal policies (the maximum debt capacity, the investment
level, the entrepreneur’s net-wealth, the guarantee cost, the total tax revenue and the
government net-wealth). The entrepreneur capital contribution S is fixed (without loss of
generality, we normalized it to 100) and the total investment is equal to the entrepreneur
contributed capital S plus the total debt D, I = S + D. The flexibility over the investment level
comes from the amount of debt raised. If lenders are willing to extend more funds to the
project, then the project investment will be high otherwise it will be low.
As illustrated by the graphs, the debt capacity (D) of the project increases when either
the government percentage guarantee increases or the profit sharing parameter increases. In
this model, the investment level is endogenous since any changes on the debt level affect the
total investment level. On one hand, we observe that, increasing the profit sharing parameter q
does increase the entrepreneur’s net-wealth. Indeed, since the capital contribution of the
entrepreneur is fixed, increasing the profit sharing parameter increases the debt capacity,
which in turn increases the total investment level inducing more available profit to be shared.
Therefore, the increasing size effect dominates the decreasing sharing fraction.
On the other hand, increasing the loan guarantee percentage improves the entrepreneur
and government net-wealth. The explanation is as follows. With more guarantees, the firm is
able to borrow more, yielding more investment, which increases the taxable income and the
residual value to shareholders. For the government, more taxable income generates more tax
revenues, and with our set of parameters values used to generate the graphs, the tax gain
outweighs the guarantee cost for the government.
V.3. Financial guarantees and analysis of the costs/benefits to the government
As illustrated by the government net wealth graph in Figure 5, providing more
guarantees always improves the net wealth to the entrepreneur. But for the government, it is
not always beneficial. The guarantee portion or the profit sharing parameter increases the debt

14
capacity of the project which increases the total investment since I = S + D. Using the
government loan guarantee to enhance the creditworthiness and increase the debt capacity of
the project induces a cost for the government but at the same time, if the project is successful,
the government gains from tax revenues collected. Therefore, there is an optimal guarantee
level to be provided by the government. The optimal guarantee portion is obtained when the
marginal gain (marginal tax revenue) is equal to the marginal cost (marginal guarantee cost).
Insert Figure 5 here
V.4. Sensitivity analyses to the parameters values
Sensitivity to the output price
Figure 6 presents the impact of the simultaneous changes in the loan guarantee percentage
and the profit sharing parameter on the optimal policies (the debt capacity, the net-wealth to
the entrepreneur and the government net-wealth) for two levels of output price. For lower
output prices, it takes more guarantees to insure a positive net-wealth to the entrepreneur. Or
put in other words, it takes more guarantees for the project to go ahead. But for the
government, with lower levels of output price, it is more beneficial to lower the percentage of
guarantee it provides if the project goes ahead. Unfortunately, that will not be the case if the
entrepreneur does not expect positive residual value. The government gets nothing when the
project is abandoned; therefore, it is in its interest to provide some level of financial guarantee
which will create incentive for the entrepreneur (positive net-wealth) to go ahead with the
project. Hence, even though the zero guarantee contribution seems more plausible for the
government at first look; it does not guarantee that the project will go ahead.
Insert Figure 6 here
Sensitivity to the project risk level
Figure 7 illustrates the sensitivity results with respect to the project’s asset returns
volatility. When the project is too risky, debtholders require more part of the profit for
compensation for their investment which decreases the net-wealth of the entrepreneur.
Therefore, more needs for guarantees, which affects negatively the net-wealth of the
government. As we have argued previously, it is in the interest of the government to provide
financial guarantee support even if it results in destruction of part of its net-wealth, otherwise
the project will not go ahead. The government will act so as long as its net-wealth remain

15
positive.
Insert Figure 7 here
Sensitivity to the project’s asset growth rate, the market price of risk and the inflation rate
Figures 8, 9 and 10 show the sensitivity results respectively for changes in the project asset
returns growth, the market price of risk and the inflation rate. Lower levels of project asset
growth rate (or higher levels of either the market price of risk or the inflation rate), all else
being equal, imply less future expect value for sharing between the three players (debtholders,
entrepreneur and government).
Insert Figure 8 here
Insert Figure 9 here
Insert Figure 10 here
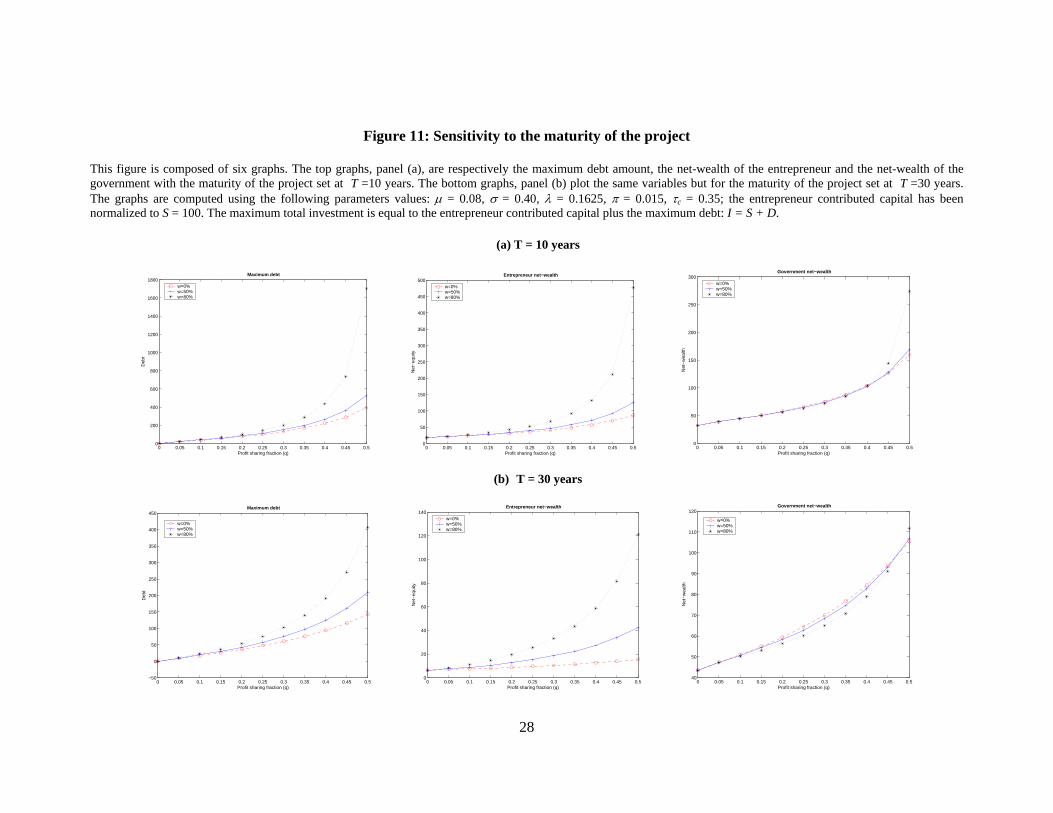
Sensitivity to the project maturity
Figure 11 shows the sensitivity results with respect to the project maturity. When the
maturity of the project increases, the net-wealth to the government and the entrepreneur
decrease, and that because the amount of debt extended to the project is lower. The intuition is
as follows. Recall, from equations (4) and (7), the face value of the debt is the initial amount of
debt since no money is made from nothing in Islamic financing, therefore the discounting
factor has more impact with longer maturities than shorter maturities. As a consequence,
debtholders require more share of the profit. However, increasing the profit sharing parameter
will create less incentive for the entrepreneur to invest.
Insert Figure 11 here
Sensitivity to the tax rate
Figure 12 exhibits the sensitivity results with respect to changes in the tax rate. When the
tax rate increases, it creates less incentive for investment, therefore the total net taxable income
is lower, which brings less revenue to the government. This phenomenon is more accentuated
for higher levels of the profit sharing parameter. Hence, for the government, increasing the tax
rate will create the inverse effect, which is the decrease in the government revenue since it
does not create incentive for investment.
Insert Figure 12 here
Sensitivity to the entrepreneur’s capital contribution

16
Figure 13 plots the sensitivity results with respect to level of the entrepreneur’s capital
contribution. For these graphs, we take two values for the contribution of the entrepreneur, S =
50 and S = 100. We observe that when the value of S doubles, all the optimal policy values are
doubled. Therefore, the optimal policies are proportional to the value of S. This is true because
the revenue function used in our simulation is linear to the investment level. With non linear
revenue function specification, this proportionality won’t hold. However, all the qualitative
results obtained above will remain valid.
Insert Figure 13 here
VI. CONCLUSION
This paper proposes a model to study the interactions between the project’s sponsor, its
lenders and the government. The entrepreneur has an investment opportunity with positive
expected net gain. To finance the project, the entrepreneur contributes with own capital and
seeks outside funds by issuing Islamic profit sharing certifcates. He also requires government
financial guarantees to enhance the creditworthiness and increase the debt capacity of the
project. The payoffs to all the participants are derived from their participation and incentive
constraints in equilibrium. The participation constraint of debtholders determines the optimal
profit sharing parameter and the maximum debt amount. The percentage of loan guarantee is
determined such that the government gains positive net-wealth from the project. The
investment decision lies on the entrepreneur and he gets the residual value of the project.
Our work raises several policy implications related to the arrangement of Islamic
project finance and the participation of both government and multilateral public agencies such
as the Islamic Development Bank. It provides a unifying framework for the improvement of
access to funds in the Islamic financing context and gives a rationale for the government
intervention in the arrangement of Islamic project finance.

17
REFERENCES
CFA Magazine, 2005, Islamic Finance: How New Practitioners of Islamic Finance are Mixing Theologie and Modern Investment Theory, The CFA Institute Member Magazine for Investment Professionals (March/April).
Dailami, M. and D. Leipziger, 1998, Infrastructure Project Finance and Capital Flows: A New Perspective, World Development 26, 1283-1298.
Ebrahim, M.-S., 1999, Integrating Islamic and Conventional Project Finance, Thunderbird International Business Review 41 (4/5), 583-609.
Ehrhardt, D. and T. Irwin, 2004, Avoiding Customer and Taxpayer Bailouts in Private Infrastructure Projects: Policy Toward Leverage, Risk Allocation and Bankruptcy, World Bank Policy Research Paper 3274 (April).
Esty, B. C., 2004, Modern Project Finance, John Wiley and Sons, Inc.
Farrell, L. M., 2003, Principal-Agency Risk in Project Finance, International Journal of Project Management 21, 547-561.
Gendron, M., V. S. Lai, and I. Soumaré, 2002, An Analysis of Private Loan Guarantee Portfolios, Research in International Business and Finance 16, 395-415.
Harrison, J.M. and D.M. Kreps, 1979, Martingales and Arbitrage in Multiperiod Securities Markets, Journal of Economic Theory 20, 381-408.
Hull, J., 2002, Options, Futures, and Other Derivatives, 5th edition, Prentice Hall.
Khan, T., 2002, Financing Build, Operate and Transfer (BOT) Projects: The Case of Islamic Instruments, Islamic Economic Studies 10, 1, 1-36.
Kleimeier, S. and W. L. Megginson, 2001, An Empirical Analysis of Limited Recourse Project Finance, Working Paper, The University of Oklahoma.
KPMG Tax Monitor, 2005, Islam and the Tax Code – Should Ireland Follow the UK’s Lead? By Brian Daly, Finance Magazine (August), 1-5.
Merton, R. C., 1974, On the Pricing of Corporate Debt: The Risk Structure of Interest Rates, Journal of Finance 29, 449-470.
, 1977, An Analytic Derivation of the Cost of Deposit Insurance and Loan Guarantees: An Application of Modern Option Pricing Theory, Journal of Banking and Finance 1, 3-11.
Merton, R. C. and Z. Bodie, 1992, On the Management of Financial Guarantees, Financial Management 21, 87-109.
Myers, S. C., 1977, Determinants of Corporate Borrowing, Journal of Financial Economics 5, 147-175.
The World Bank, 1995, The World Bank Guarantee: Catalyst for Private Capital Flows, The World Bank Group, September.
The World Bank, 2002, The World Bank Guarantee: Leveraging Private Finance for Emerging Markets, Project Finance and Guarantees Department (January).

18
Figure 1: The players chart flow This chart plots the interactions between the entrepreneur, lenders and the government in the arrangement of Islamic project finance. The entrepreneur initiates a project idea and requires outside financing in the form of Islamic profit sharing debt. The government intervene by providing a financial guarantee in order to improve the project creditworthiness. If the investment is made, each stakeholder receives part of the cash flows generated by the project. The chart illustrates the cash inflows to and outflows from the project to the different stakeholders.
Entrepreneur Lenders
Government
Investment
Cash Flows generated by the project
Guarantees
Principal & Profit sharing
Debt Capital
Profit sharing
yes
Decision to go ahead or not
No Cash Flows
no
Taxes
19
Figure 2: Payoff to lenders (madarabah)
This graph represents the payoff to a holder of an Islamic profit sharing revenue bond. This bond consists of a security which pays a fraction of the project profit and the principal to the holder if the project is successful, otherwise the security holder receive the salvage value of the project in case of default. The top graph represents the payoff to non-insured lenders, while the bottom graph represents the payoff to insured lenders. Comparing the two graphs, we observe that, the financial guarantee limits the downside losses, while the security holder still maintains the option to profit any potential gain. The graphs have been constructed using the following parameters values: q = 0.20, ω = 0.50, τc = 0.35, D = 60, I = 100. The payoffs are obtained by subtracting from the final payment to lenders (DT) the principal D: DT - D.
Payoff to non-insured lenders
-60
-40
-20
0
20
40
60
0 20 40 60 80 100 120 140 160 180 200
Project value
Payoff
Payoff to insured lenders
-60
-40
-20
0
20
40
60
0 20 40 60 80 100 120 140 160 180 200
Project value
Payoff

20
Figure 3: Payoff to the entrepreneur or shareholders (musharakah)
This graph represents the payoff to the entrepreneur or shareholders. The entrepreneur receives the residual value of the project. If the project is successful, the entrepreneur shares the after tax profit with lenders, otherwise he looses his initial investment. Comparing this payoff to the payoff of standard call option, commonly used to modelled equity, here there is a kink when the payoff crosses the horizontal line. The curve above the horizontal line is the profit sharing part presented in Islamic financing. The graphs have been constructed using the following parameters values: q = 0.20, ω = 0.50, τc = 0.35, D = 60, I = 100, S = I – D = 40. The payoffs are obtained by subtracting from the final payment to the entrepreneur (RT) his initial capital investment S: RT - S.
Payoff to shareholders
-60
-40
-20
0
20
40
60
0 20 40 60 80 100 120 140 160 180 200
Project value
Payoff

21
Figure 4: Optimal policies with fixed level of investment
This figure is composed of four graphs plotting the optimal policies as function of the profit sharing fraction (q) for different levels of entrepreneur’s capital contribution portion (S / I). The graphs plot respectively, (a) the percentage of loan guarantee by the government (ω), (b) the cost of the financial guarantee to the government, (c) the entrepreneur’s net-wealth, and (d) the project debt ratio which is equal to the total debt divided by the sum of the total debt and the total equity. The graphs are computed using the following parameters values: V0(I) = 1.5× I, µ = 0.08, σ = 0.4, λ = 0.1625, π = 0.015, τc = 0.35, T =10; the total investment level has been normalized to I = 100. The capital contribution percentage of the entrepreneur is S/I, which gives the value of S, and the guaranteed debt value is obtained by I - S. The percentage ω is the guarantee percentage need to raise the debt amount I - S.
(a) Percentage of loan guaranteed (ω) (b) Guarantee costs (G)
0.05 0.1 0.15 0.2 0.25 0.3 0.35 0.4 0.45 0.50
0.2
0.4
0.6
0.8
1
1.2
1.4 Garantee percentage
Profit sharing fraction (q)
Gar
ante
e pe
rcen
tage
(w
)
S/I=5%S/I=15%S/I=30%
0.05 0.1 0.15 0.2 0.25 0.3 0.35 0.4 0.45 0.50
5
10
15
20
25
30
35
40 Guarantee costs
Profit sharing fraction (q)
Gua
rant
ee (
G)
S/I=5%S/I=15%S/I=30%
(c) Entrepreneur net-wealth (R) (d) Debt ratio (D / (R + I))
0.05 0.1 0.15 0.2 0.25 0.3 0.35 0.4 0.45 0.510
15
20
25
30
35
40
45
50
55 Entrepreneur net−wealth
Profit sharing fraction (q)
Net
−eq
uity
S/I=5%S/I=15%S/I=30%
0.05 0.1 0.15 0.2 0.25 0.3 0.35 0.4 0.45 0.50.5
0.55
0.6
0.65
0.7
0.75 Debt ratio
Profit sharing fraction (q)
Deb
t rat
io
S/I=5%S/I=15%S/I=30%

22
Figure 5: Optimal policies as function of the sharing rule and guarantee percentage
This figure is composed of six graphs. The graphs plot respectively top to bottom and left to right, the maximum debt capacity of the project, the maximum total investment level of project, the net-wealth to the entrepreneur, the cost of the financial guarantee to the government, the total taxes collected by the government, and the net-wealth of the government. The graphs are computed using the following parameters values: V0(I) = 1.5× I, µ = 0.08, σ = 0.4, λ = 0.1625, π = 0.015, τc = 0.35, T =10; the entrepreneur contributed capital has been normalized to S = 100. The maximum total investment is equal to the entrepreneur contributed capital plus the maximum debt: I =S + D.
0
0.2
0.4
0.6
0.8
00.05
0.10.15
0.20.25
0.3
0
50
100
150
200
250
300
350
Percentage debt garantee (w)
Maximum debt
Profit sharing fraction (q)
Deb
t (D
)
0
0.2
0.4
0.6
0.8
00.05
0.10.15
0.20.25
0.3
0
50
100
150
200
250
300
350
400
450
Percentage debt garantee (w)
Maximum investment
Profit sharing fraction (q)
Inve
stm
ent (
I)
0
0.2
0.4
0.6
0.8
00.05
0.10.15
0.20.25
0.3
0
20
40
60
80
100
120
Percentage debt garantee (w)
Entrepreneur net−wealth
Profit sharing fraction (q)
Net
−eq
uity
(R
)
0
0.2
0.4
0.6
0.8
00.05
0.10.15
0.20.25
0.3
0
10
20
30
40
50
60
70
Percentage debt garantee (w)
Guarantee costs
Profit sharing fraction (q)
Gua
rant
ee (
G)
0
0.2
0.4
0.6
0.8
00.05
0.10.15
0.20.25
0.3
0
50
100
150
Percentage debt garantee (w)
Total taxes
Profit sharing fraction (q)
Tax
es
0
0.2
0.4
0.6
0.8
00.05
0.10.15
0.20.25
0.3
0
10
20
30
40
50
60
70
80
Percentage debt garantee (w)
Government net−wealth
Profit sharing fraction (q)
Net
−w
ealth

23
Figure 6: Sensitivity to the output price
This figure is composed of six graphs. The top graphs, panel (a), are respectively the maximum debt amount, the net-wealth of the entrepreneur and the net-wealth of the government with the cash flow function defined as V(I) = 1.2× I. The bottom graphs, panel (b) plot the same variables but for cash flow function V(I) = 1.5× I. The graphs are computed using the following parameters values: µ = 0.08, σ = 0.40, λ = 0.1625, π = 0.015, τc = 0.35, T =10; the entrepreneur contributed capital has been normalized to S = 100. The maximum total investment is equal to the entrepreneur contributed capital plus the maximum debt: I = S + D.
(a) V(I) = 1.2× I
0 0.05 0.1 0.15 0.2 0.25 0.3 0.35 0.4 0.45 0.50
50
100
150
200
250
300 Maximum debt
Profit sharing fraction (q)
Deb
t
w=0%w=50%w=80%
0 0.05 0.1 0.15 0.2 0.25 0.3 0.35 0.4 0.45 0.5−10
−5
0
5
10
15 Entrepreneur net−wealth
Profit sharing fraction (q)
Net
−eq
uity
w=0%w=50%w=80%
0 0.05 0.1 0.15 0.2 0.25 0.3 0.35 0.4 0.45 0.520
25
30
35
40
45
50
55
60 Government net−wealth
Profit sharing fraction (q)
Net
−w
ealth
w=0%w=50%w=80%
(b) V(I) = 1.5× I
0 0.05 0.1 0.15 0.2 0.25 0.3 0.35 0.4 0.45 0.50
200
400
600
800
1000
1200
1400
1600
1800 Maximum debt
Profit sharing fraction (q)
Deb
t
w=0%w=50%w=80%
0 0.05 0.1 0.15 0.2 0.25 0.3 0.35 0.4 0.45 0.50
50
100
150
200
250
300
350
400
450
500 Entrepreneur net−wealth
Profit sharing fraction (q)
Net
−eq
uity
w=0%w=50%w=80%
0 0.05 0.1 0.15 0.2 0.25 0.3 0.35 0.4 0.45 0.50
50
100
150
200
250
300 Government net−wealth
Profit sharing fraction (q)N
et−
wea
lth
w=0%w=50%w=80%

24
Figure 7: Sensitivity to the project risk level
This figure is composed of six graphs. The top graphs, panel (a), are respectively the maximum debt amount, the net-wealth of the entrepreneur and the net-wealth of the government with the project risk level set at σ = 0.40. The bottom graphs, panel (b) plot the same variables but for the project risk level set at σ = 0.60. The graphs are computed using the following parameters values: µ = 0.08, λ = 0.1625, π = 0.015, τc = 0.35, T =10; the entrepreneur contributed capital has been normalized to S = 100. The maximum total investment is equal to the entrepreneur contributed capital plus the maximum debt: I = S + D.
(a) σ = 0.40
0 0.05 0.1 0.15 0.2 0.25 0.3 0.35 0.4 0.45 0.50
200
400
600
800
1000
1200
1400
1600
1800 Maximum debt
Profit sharing fraction (q)
Deb
t
w=0%w=50%w=80%
0 0.05 0.1 0.15 0.2 0.25 0.3 0.35 0.4 0.45 0.50
50
100
150
200
250
300
350
400
450
500 Entrepreneur net−wealth
Profit sharing fraction (q)
Net
−eq
uity
w=0%w=50%w=80%
0 0.05 0.1 0.15 0.2 0.25 0.3 0.35 0.4 0.45 0.50
50
100
150
200
250
300 Government net−wealth
Profit sharing fraction (q)
Net
−w
ealth
w=0%w=50%w=80%
(b) σ = 0.60
0 0.05 0.1 0.15 0.2 0.25 0.3 0.35 0.4 0.45 0.5−50
0
50
100
150
200
250
300 Maximum debt
Profit sharing fraction (q)
Deb
t
w=0%w=50%w=80%
0 0.05 0.1 0.15 0.2 0.25 0.3 0.35 0.4 0.45 0.5−35
−30
−25
−20
−15
−10
−5
0
5
10
15 Entrepreneur net−wealth
Profit sharing fraction (q)
Net
−eq
uity
w=0%w=50%w=80%
0 0.05 0.1 0.15 0.2 0.25 0.3 0.35 0.4 0.45 0.50
5
10
15
20
25
30
35
40
45
50 Government net−wealth
Profit sharing fraction (q)
Net
−w
ealth
w=0%w=50%w=80%

25
Figure 8: Sensitivity to the asset growth rate
This figure is composed of six graphs. The top graphs, panel (a), are respectively the maximum debt amount, the net-wealth of the entrepreneur and the net-wealth of the government with the project asset’s growth rate set at µ = 0.05. The bottom graphs, panel (b) plot the same variables but for the project asset’s growth rate set at µ = 0.08. The graphs are computed using the following parameters values: σ = 0.40, λ = 0.1625, π = 0.015, τc = 0.35, T =10; the entrepreneur contributed capital has been normalized to S = 100. The maximum total investment is equal to the entrepreneur contributed capital plus the maximum debt: I = S + D.
(a) µ = 0.05
0 0.05 0.1 0.15 0.2 0.25 0.3 0.35 0.4 0.45 0.50
100
200 Maximum debt
Profit sharing fraction (q)
Deb
t
w=0%w=50%w=80%
0 0.05 0.1 0.15 0.2 0.25 0.3 0.35 0.4 0.45 0.5−22
−20
−18
−16
−14
−12
−10
−8 Entrepreneur net−wealth
Profit sharing fraction (q)
Net
−eq
uity
w=0%w=50%w=80%
0 0.05 0.1 0.15 0.2 0.25 0.3 0.35 0.4 0.45 0.520
25
30
35
40
45
50 Government net−wealth
Profit sharing fraction (q)
Net
−w
ealth
w=0%w=50%w=80%
(b) µ = 0.08
0 0.05 0.1 0.15 0.2 0.25 0.3 0.35 0.4 0.45 0.50
200
400
600
800
1000
1200
1400
1600
1800 Maximum debt
Profit sharing fraction (q)
Deb
t
w=0%w=50%w=80%
0 0.05 0.1 0.15 0.2 0.25 0.3 0.35 0.4 0.45 0.50
50
100
150
200
250
300
350
400
450
500 Entrepreneur net−wealth
Profit sharing fraction (q)
Net
−eq
uity
w=0%w=50%w=80%
0 0.05 0.1 0.15 0.2 0.25 0.3 0.35 0.4 0.45 0.50
50
100
150
200
250
300 Government net−wealth
Profit sharing fraction (q)
Net
−w
ealth
w=0%w=50%w=80%

26
Figure 9: Sensitivity to the market price of risk
This figure is composed of six graphs. The top graphs, panel (a), are respectively the maximum debt amount, the net-wealth of the entrepreneur and the net-wealth of the government with the market price of risk set at λ = 0.1625. The bottom graphs, panel (b) plot the same variables but for the market price of risk set at λ = 0.20. The graphs are computed using the following parameters values: µ = 0.08, σ = 0.40, π = 0.015, τc = 0.35, T =10; the entrepreneur contributed capital has been normalized to S = 100. The maximum total investment is equal to the entrepreneur contributed capital plus the maximum debt: I = S + D.
(a) λ = 0.1625
0 0.05 0.1 0.15 0.2 0.25 0.3 0.35 0.4 0.45 0.50
200
400
600
800
1000
1200
1400
1600
1800 Maximum debt
Profit sharing fraction (q)
Deb
t
w=0%w=50%w=80%
0 0.05 0.1 0.15 0.2 0.25 0.3 0.35 0.4 0.45 0.50
50
100
150
200
250
300
350
400
450
500 Entrepreneur net−wealth
Profit sharing fraction (q)
Net
−eq
uity
w=0%w=50%w=80%
0 0.05 0.1 0.15 0.2 0.25 0.3 0.35 0.4 0.45 0.50
50
100
150
200
250
300 Government net−wealth
Profit sharing fraction (q)
Net
−w
ealth
w=0%w=50%w=80%
(b) λ = 0.20
0 0.05 0.1 0.15 0.2 0.25 0.3 0.35 0.4 0.45 0.50
50
100
150
200
250
300
350
400 Maximum debt
Profit sharing fraction (q)
Deb
t
w=0%w=50%w=80%
0 0.05 0.1 0.15 0.2 0.25 0.3 0.35 0.4 0.45 0.50
10
20
30
40
50
60 Entrepreneur net−wealth
Profit sharing fraction (q)
Net
−eq
uity
w=0%w=50%w=80%
0 0.05 0.1 0.15 0.2 0.25 0.3 0.35 0.4 0.45 0.520
30
40
50
60
70
80 Government net−wealth
Profit sharing fraction (q)
Net
−w
ealth
w=0%w=50%w=80%

27
Figure 10: Sensitivity to the inflation rate
This figure is composed of six graphs. The top graphs, panel (a), are respectively the maximum debt amount, the net-wealth of the entrepreneur and the net-wealth of the government with the inflation rate set at π = 0.015. The bottom graphs, panel (b) plot the same variables but for the inflation rate set at π = 0.03. The graphs are computed using the following parameters values: µ = 0.08, σ = 0.40, λ = 0.1625, τc = 0.35, T =10; the entrepreneur contributed capital has been normalized to S = 100. The maximum total investment is equal to the entrepreneur contributed capital plus the maximum debt: I = S + D.
(a) π = 0.015
0 0.05 0.1 0.15 0.2 0.25 0.3 0.35 0.4 0.45 0.50
200
400
600
800
1000
1200
1400
1600
1800 Maximum debt
Profit sharing fraction (q)
Deb
t
w=0%w=50%w=80%
0 0.05 0.1 0.15 0.2 0.25 0.3 0.35 0.4 0.45 0.50
50
100
150
200
250
300
350
400
450
500 Entrepreneur net−wealth
Profit sharing fraction (q)
Net
−eq
uity
w=0%w=50%w=80%
0 0.05 0.1 0.15 0.2 0.25 0.3 0.35 0.4 0.45 0.50
50
100
150
200
250
300 Government net−wealth
Profit sharing fraction (q)
Net
−w
ealth
w=0%w=50%w=80%
(b) π = 0.030
0 0.05 0.1 0.15 0.2 0.25 0.3 0.35 0.4 0.45 0.50
2
4
6
8
10
12
14
16
18
20 Entrepreneur net−wealth
Profit sharing fraction (q)
Net
−eq
uity
w=0%w=50%w=80%
0 0.05 0.1 0.15 0.2 0.25 0.3 0.35 0.4 0.45 0.50
2
4
6
8
10
12
14
16
18
20 Entrepreneur net−wealth
Profit sharing fraction (q)
Net
−eq
uity
w=0%w=50%w=80%
0 0.05 0.1 0.15 0.2 0.25 0.3 0.35 0.4 0.45 0.525
30
35
40
45
50
55
60
65
70
75 Government net−wealth
Profit sharing fraction (q)
Net
−w
ealth
w=0%w=50%w=80%
28
Figure 11: Sensitivity to the maturity of the project
This figure is composed of six graphs. The top graphs, panel (a), are respectively the maximum debt amount, the net-wealth of the entrepreneur and the net-wealth of the government with the maturity of the project set at T =10 years. The bottom graphs, panel (b) plot the same variables but for the maturity of the project set at T =30 years. The graphs are computed using the following parameters values: µ = 0.08, σ = 0.40, λ = 0.1625, π = 0.015, τc = 0.35; the entrepreneur contributed capital has been normalized to S = 100. The maximum total investment is equal to the entrepreneur contributed capital plus the maximum debt: I = S + D.
(a) T = 10 years
0 0.05 0.1 0.15 0.2 0.25 0.3 0.35 0.4 0.45 0.50
200
400
600
800
1000
1200
1400
1600
1800 Maximum debt
Profit sharing fraction (q)
Deb
t
w=0%w=50%w=80%
0 0.05 0.1 0.15 0.2 0.25 0.3 0.35 0.4 0.45 0.50
50
100
150
200
250
300
350
400
450
500 Entrepreneur net−wealth
Profit sharing fraction (q)
Net
−eq
uity
w=0%w=50%w=80%
0 0.05 0.1 0.15 0.2 0.25 0.3 0.35 0.4 0.45 0.50
50
100
150
200
250
300 Government net−wealth
Profit sharing fraction (q)
Net
−w
ealth
w=0%w=50%w=80%
(b) T = 30 years
0 0.05 0.1 0.15 0.2 0.25 0.3 0.35 0.4 0.45 0.5−50
0
50
100
150
200
250
300
350
400
450 Maximum debt
Profit sharing fraction (q)
Deb
t
w=0%w=50%w=80%
0 0.05 0.1 0.15 0.2 0.25 0.3 0.35 0.4 0.45 0.50
20
40
60
80
100
120
140 Entrepreneur net−wealth
Profit sharing fraction (q)
Net
−eq
uity
w=0%w=50%w=80%
0 0.05 0.1 0.15 0.2 0.25 0.3 0.35 0.4 0.45 0.540
50
60
70
80
90
100
110
120 Government net−wealth
Profit sharing fraction (q)N
et−
wea
lth
w=0%w=50%w=80%

29
Figure 12: Sensitivity to the tax rate
This figure is composed of six graphs. The top graphs, panel (a), are respectively the maximum debt amount, the net-wealth of the entrepreneur and the net-wealth of the government with the tax rate set at τc = 0.35. The bottom graphs, panel (b) plot the same variables but for the tax rate set at τc = 0.50. The graphs are computed using the following parameters values: µ = 0.08, σ = 0.40, λ = 0.1625, π = 0.015, T =10; the entrepreneur contributed capital has been normalized to S = 100. The maximum total investment is equal to the entrepreneur contributed capital plus the maximum debt: I = S + D.
(a) τc = 0.35
0 0.05 0.1 0.15 0.2 0.25 0.3 0.35 0.4 0.45 0.50
200
400
600
800
1000
1200
1400
1600
1800 Maximum debt
Profit sharing fraction (q)
Deb
t
w=0%w=50%w=80%
0 0.05 0.1 0.15 0.2 0.25 0.3 0.35 0.4 0.45 0.50
50
100
150
200
250
300
350
400
450
500 Entrepreneur net−wealth
Profit sharing fraction (q)
Net
−eq
uity
w=0%w=50%w=80%
0 0.05 0.1 0.15 0.2 0.25 0.3 0.35 0.4 0.45 0.50
50
100
150
200
250
300 Government net−wealth
Profit sharing fraction (q)
Net
−w
ealth
w=0%w=50%w=80%
(b) τc = 0.50
0 0.05 0.1 0.15 0.2 0.25 0.3 0.35 0.4 0.45 0.50
50
100
150
200
250
300
350
400 Maximum debt
Profit sharing fraction (q)
Deb
t
w=0%w=50%w=80%
0 0.05 0.1 0.15 0.2 0.25 0.3 0.35 0.4 0.45 0.50
10
20
30
40
50
60 Entrepreneur net−wealth
Profit sharing fraction (q)
Net
−eq
uity
w=0%w=50%w=80%
0 0.05 0.1 0.15 0.2 0.25 0.3 0.35 0.4 0.45 0.540
60
80
100
120
140
160
180 Government net−wealth
Profit sharing fraction (q)
Net
−w
ealth
w=0%w=50%w=80%

30
Figure 13: Sensitivity to the entrepreneur contributed capital
This figure is composed of six graphs. The top graphs, panel (a), are respectively the maximum debt amount, the net-wealth of the entrepreneur and the net-wealth of the government with the entrepreneur contributed capital set to S = 50. The bottom graphs, panel (b) plot the same variables but for the entrepreneur contributed capital set to S = 100. The graphs are computed using the following parameters values: µ = 0.08, σ = 0.40, λ = 0.1625, π = 0.015, τc = 0.35, T =10. The maximum total investment is equal to the entrepreneur contributed capital plus the maximum debt: I = S + D.
(a) S = 50
0 0.05 0.1 0.15 0.2 0.25 0.3 0.35 0.4 0.45 0.50
100
200
300
400
500
600
700
800
900 Maximum debt
Profit sharing fraction (q)
Deb
t
w=0%w=50%w=80%
0 0.05 0.1 0.15 0.2 0.25 0.3 0.35 0.4 0.45 0.50
50
100
150
200
250 Entrepreneur net−wealth
Profit sharing fraction (q)
Net
−eq
uity
w=0%w=50%w=80%
0 0.05 0.1 0.15 0.2 0.25 0.3 0.35 0.4 0.45 0.50
20
40
60
80
100
120
140 Government net−wealth
Profit sharing fraction (q)
Net
−w
ealth
w=0%w=50%w=80%
(b) S = 100
0 0.05 0.1 0.15 0.2 0.25 0.3 0.35 0.4 0.45 0.50
200
400
600
800
1000
1200
1400
1600
1800 Maximum debt
Profit sharing fraction (q)
Deb
t
w=0%w=50%w=80%
0 0.05 0.1 0.15 0.2 0.25 0.3 0.35 0.4 0.45 0.50
50
100
150
200
250
300
350
400
450
500 Entrepreneur net−wealth
Profit sharing fraction (q)
Net
−eq
uity
w=0%w=50%w=80%
0 0.05 0.1 0.15 0.2 0.25 0.3 0.35 0.4 0.45 0.50
50
100
150
200
250
300 Government net−wealth
Profit sharing fraction (q)N
et−
wea
lth
w=0%w=50%w=80%