itu-asean forum on over the top (ott) services: business ... · itu-asean forum on over the top...
TRANSCRIPT

ITU-ASEAN Forum on Over the Top (OTT) Services:
Business, Policy and Regulatory Trends
Phnom Penh, Cambodia
08-09 December, 2015
Pedro Seixas
ITU Expert
Session 2:Drivers of OTT and
implications for telecommunications
operators
2
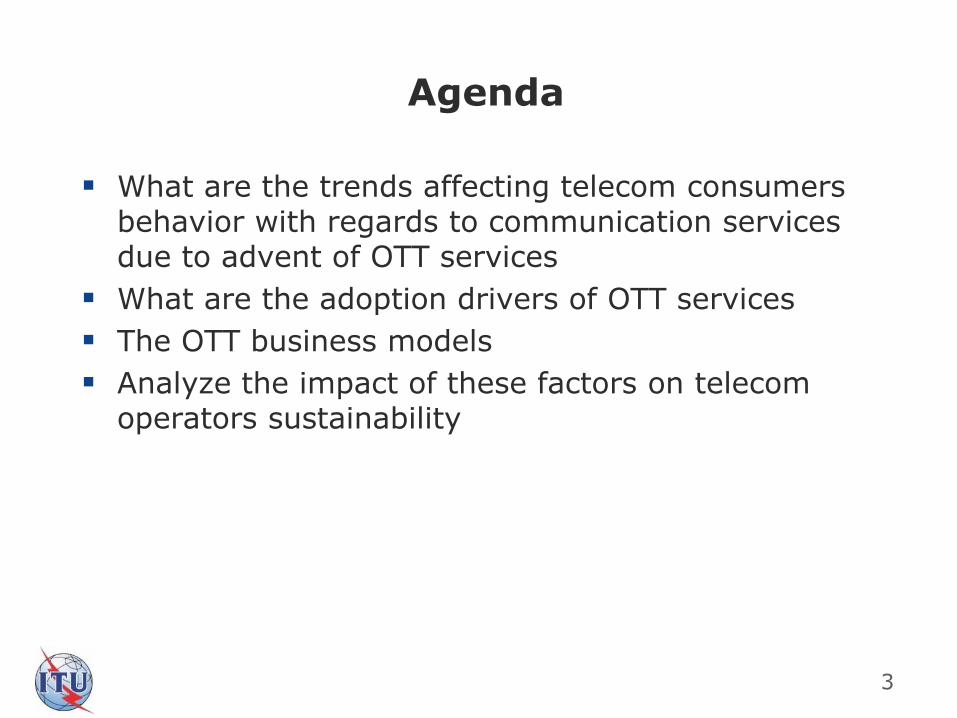
Agenda
What are the trends affecting telecom consumers behavior with regards to communication services due to advent of OTT services
What are the adoption drivers of OTT services
The OTT business models
Analyze the impact of these factors on telecom operators sustainability
3

Voice andmessagesrevenue
Data traffic andrevenue
Pricing ofservices
Network investment
New services
Customization
Technologyadvancement
Messagingpreferences
Content
Socialization
Cost
Convenience
Added features
Smartphonepenetration
User experience
Net neutrality
Innovation
Various factor and trends have a huge impact on network operators current business model
CONSUMERS
OTTs
Network operators
4
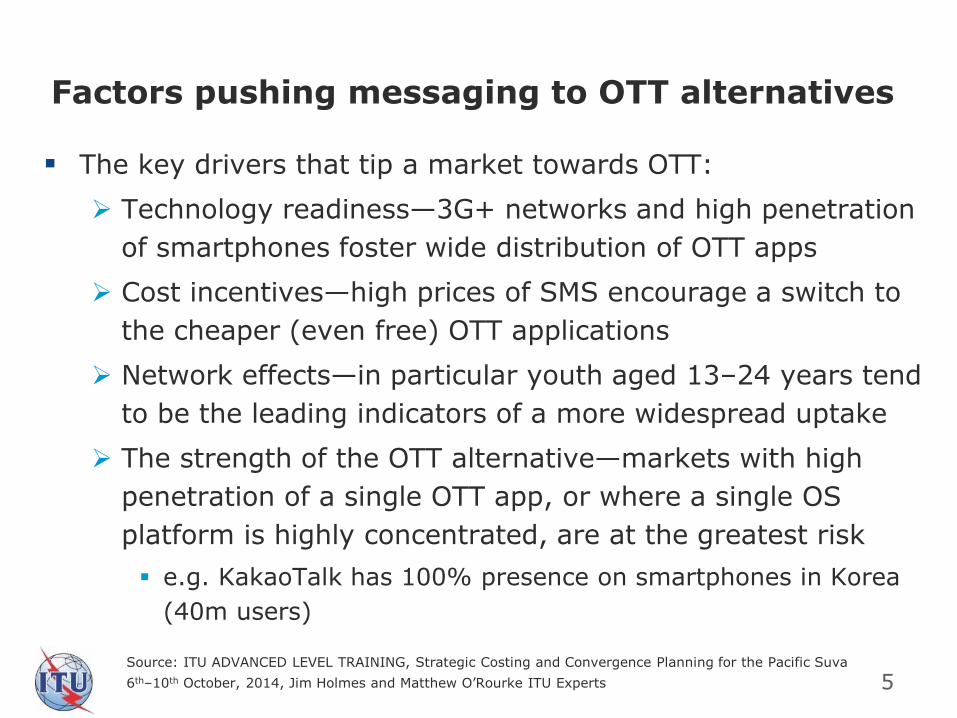
Factors pushing messaging to OTT alternatives
The key drivers that tip a market towards OTT:
Technology readiness—3G+ networks and high penetration
of smartphones foster wide distribution of OTT apps
Cost incentives—high prices of SMS encourage a switch to
the cheaper (even free) OTT applications
Network effects—in particular youth aged 13–24 years tend
to be the leading indicators of a more widespread uptake
The strength of the OTT alternative—markets with high
penetration of a single OTT app, or where a single OS
platform is highly concentrated, are at the greatest risk
e.g. KakaoTalk has 100% presence on smartphones in Korea
(40m users)
5Source: ITU ADVANCED LEVEL TRAINING, Strategic Costing and Convergence Planning for the Pacific Suva
6th–10th October, 2014, Jim Holmes and Matthew O’Rourke ITU Experts
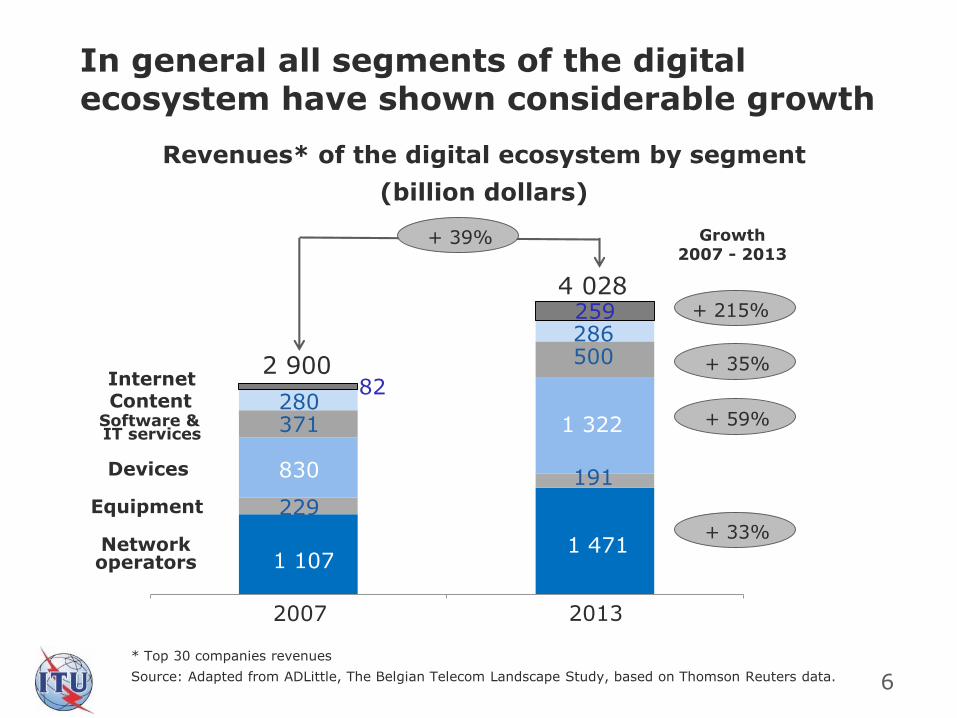
In general all segments of the digital ecosystem have shown considerable growth
1 2
1 107
229
830
371280
82
2007
1 471
2013
191
1 322
500286259
2 900
4 028
+ 39%
Network operators
Equipment
Devices
Software &IT services
ContentInternet
* Top 30 companies revenues
Source: Adapted from ADLittle, The Belgian Telecom Landscape Study, based on Thomson Reuters data.
Revenues* of the digital ecosystem by segment
(billion dollars)
+ 215%
+ 59%
+ 35%
+ 33%
Growth 2007 - 2013
6
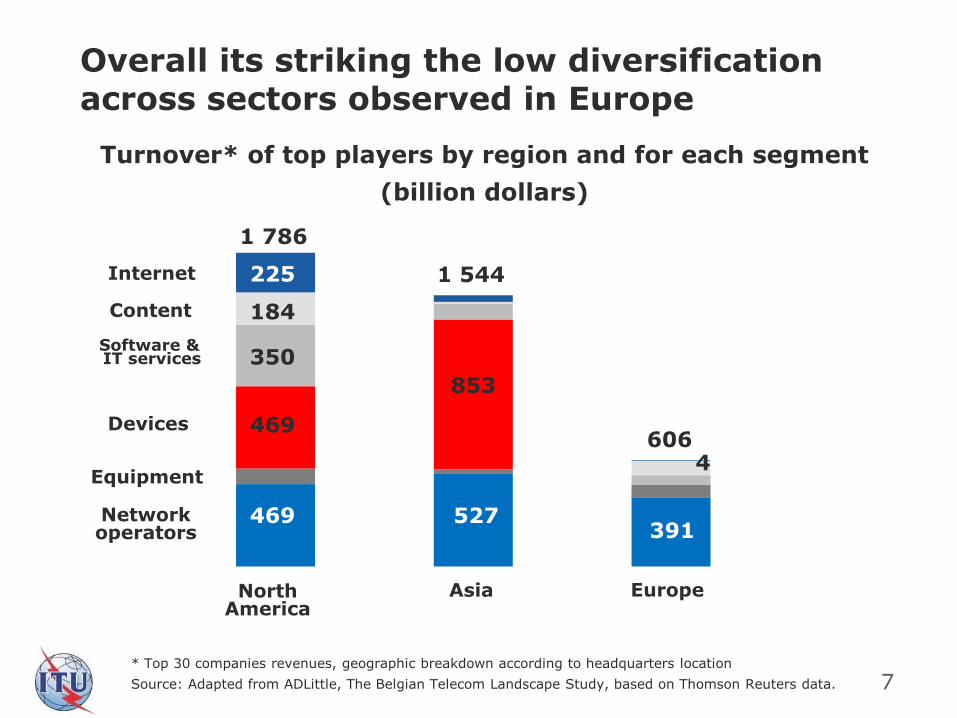
Overall its striking the low diversificationacross sectors observed in Europe
* Top 30 companies revenues, geographic breakdown according to headquarters location
Source: Adapted from ADLittle, The Belgian Telecom Landscape Study, based on Thomson Reuters data.
Turnover* of top players by region and for each segment
(billion dollars)
Network operators
Equipment
Devices
Software &IT services
Content
Internet
North America
Asia Europe
1 786
1 544
606469
853
350
184
225
469 527391
4
7
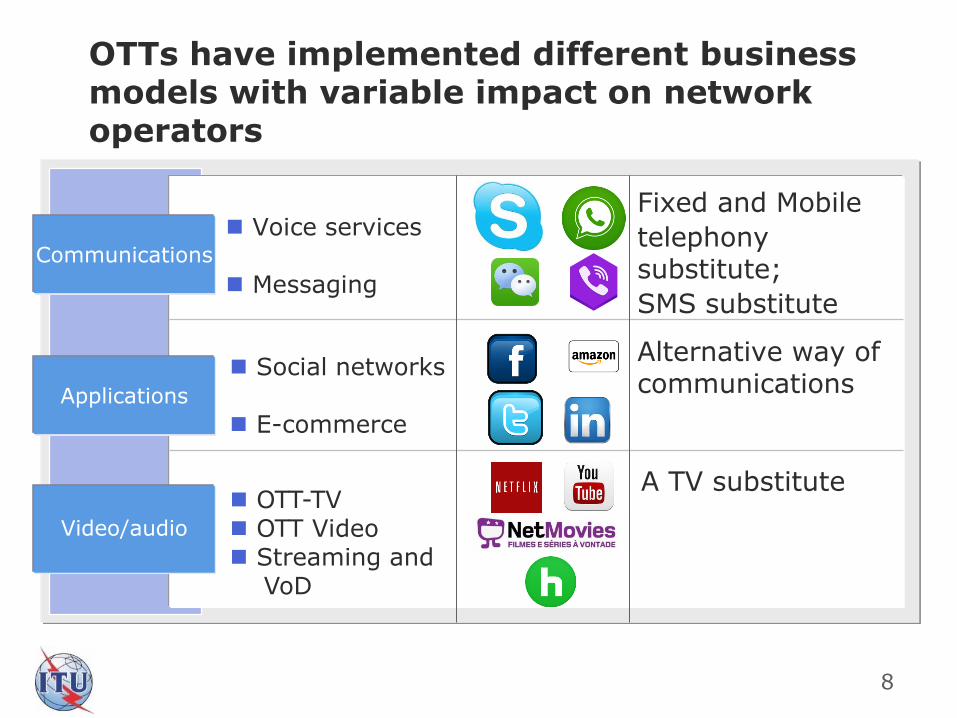
OTTs have implemented different business models with variable impact on network operators
Voice services
Messaging
Communications
Social networks
E-commerce
Applications
Video/audio
OTT-TV OTT Video Streaming and
VoD
Fixed and Mobile
telephony substitute;
SMS substitute
A TV substitute
Alternative way of communications
8
Revenue loss: voice and messages
Revenue enhancement: data, handsets, new services
IP traffic increased demand will require additional investment in network bandwidth
Sector consolidation (within mobile; mobile and cable; fixed and mobile)
Bundled offers
OTTs significantly impact telecoms business models which have been based on overly priced voice and sms services
9
10
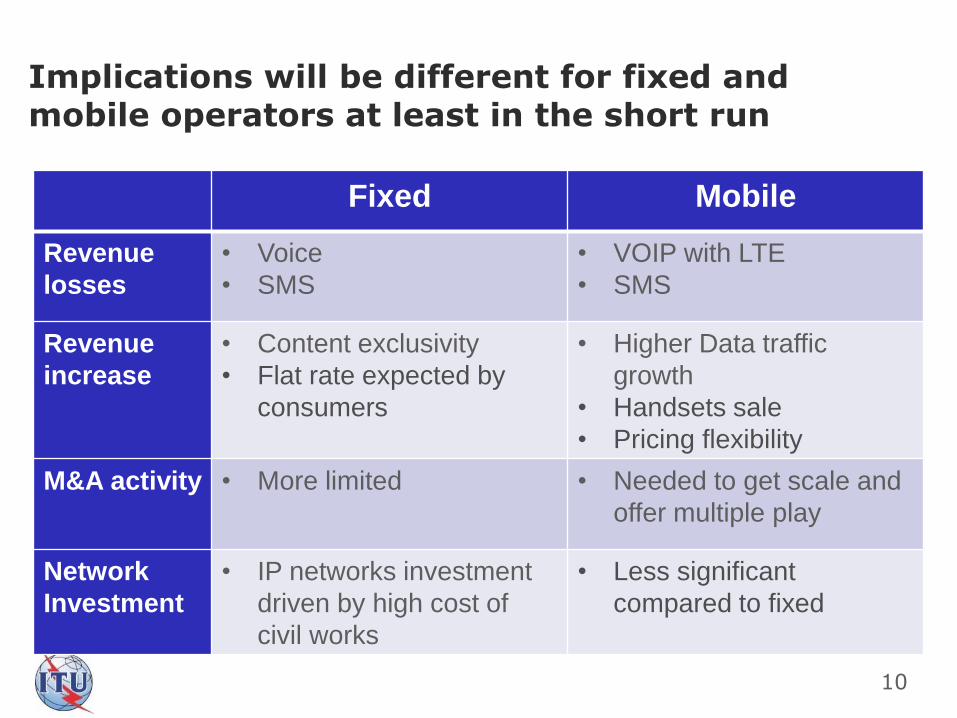
Fixed Mobile
Revenue
losses
• Voice
• SMS
• VOIP with LTE
• SMS
Revenue
increase
• Content exclusivity
• Flat rate expected by
consumers
• Higher Data traffic
growth
• Handsets sale
• Pricing flexibility
M&A activity • More limited • Needed to get scale and
offer multiple play
Network
Investment
• IP networks investment
driven by high cost of
civil works
• Less significant
compared to fixed
Implications will be different for fixed and mobile operators at least in the short run
11
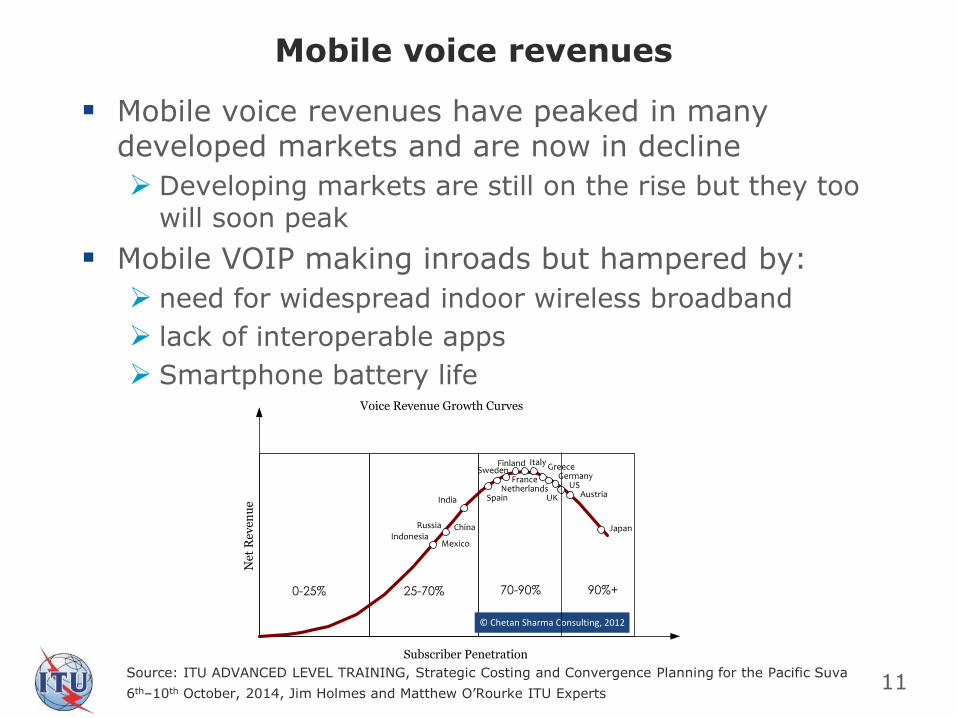
Mobile voice revenues have peaked in many developed markets and are now in decline
Developing markets are still on the rise but they too will soon peak
Mobile VOIP making inroads but hampered by:
need for widespread indoor wireless broadband
lack of interoperable apps
Smartphone battery life
are generally dependent on the maturity of the market, the economic and political conditions of the market, the regulatory regimes, the competitive forces that are at play in the market, and the availability of substitute solutions. In the subsequent sections, we will delve into each of the major revenue curves and discuss the nature of growth and decline in various countries.
First Revenue Curve – Voice The first cellular market started in Japan in 1979 and gradually all markets launched cellular services over the course of the next 25 years. For much of this time, the primary revenue growth driver was voice. As such, the markets that started early also reached saturation early. For example, while the cellular market in India was just coming out of its cocoon in 2003, Japanese voice revenues already peaked and started declining. Next, many countries in Europe followed. Perhaps, as the precursor to the 2008 financial meltdown, the voice revenues in many European nations peaked in 2007 and started declining. Obviously, the micro-revenue environment was a bit different depending on how each individual operator was doing but typically, the number 3 and 4 operator in a given country peaked first in voice revenues and the decline began. In the US, the voice revenues of Sprint and T-Mobile USA started declining in 2007, which led to the overall voice revenues in the US market to retreat even though Verizon and AT&T – the top two operators by overall revenues and total subscribers still had growing voice revenues. In fact, they haven’t pe aked yet as of the wr it ing of this paper.
Net
Rev
enu
e
Subscriber Penetration
0-25% 25-70% 70-90%
Austria
Finland
Netherlands
Italy
USGermany
Greece
IndonesiaMexico
UK
France
Spain
Sweden
Russia China
India
Voice Revenue Growth Curves
© Chetan Sharma Consulting, 2012
Japan
90%+
Figure 2. Mobile Voice Revenue Growth Curves
Mobile voice revenues
Source: ITU ADVANCED LEVEL TRAINING, Strategic Costing and Convergence Planning for the Pacific Suva
6th–10th October, 2014, Jim Holmes and Matthew O’Rourke ITU Experts
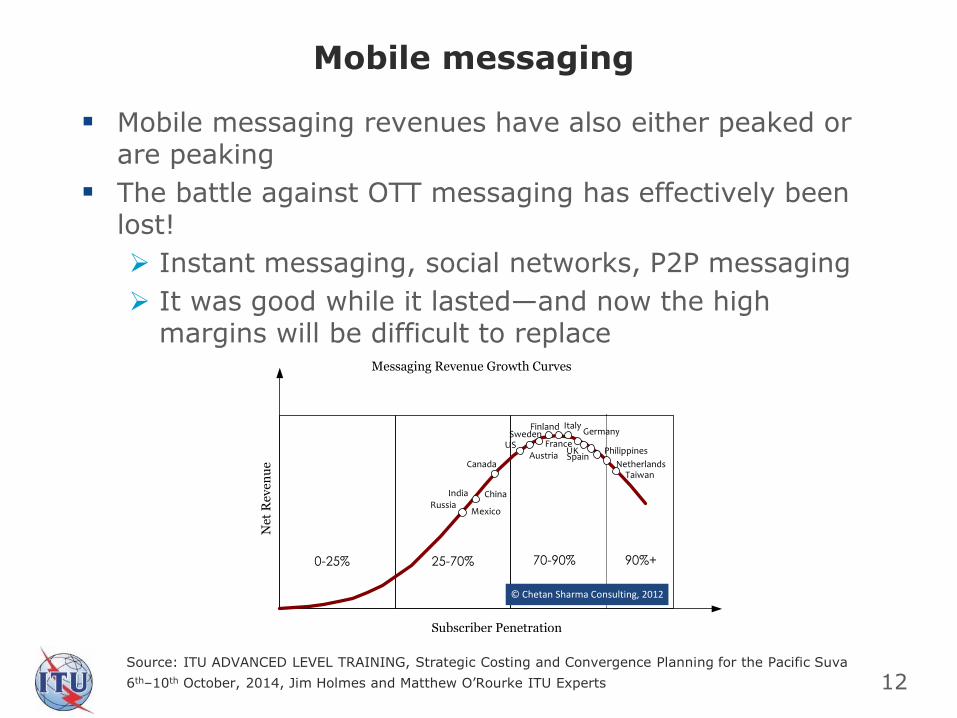
Mobile messaging revenues have also either peaked or are peaking
The battle against OTT messaging has effectively been lost!
Instant messaging, social networks, P2P messaging
It was good while it lasted—and now the high margins will be difficult to replace
12
the fast 3G/4G networks were in place complimented by industry changing devices, the stage was set for disruption in the messaging space. Even before Whatsapp, Voxer, and Viber, the likes of Blackberry Messenger and Skype, had started the phenomenon in the developing nations where consumers are price sensitive and creative in minimizing their tariffs. That so me of the op e rators we re caught by su r pr is e and didn’t anticipate the shift points to the fundamental flaw in the DNA of some.
Net
Rev
enu
e
Subscriber Penetration
0-25% 25-70% 70-90%
Austria
Finland
Netherlands
Italy
US
Germany
Philippines
Mexico
UKFrance
Spain
Sweden
RussiaChinaIndia
Messaging Revenue Growth Curves
Canada
© Chetan Sharma Consulting, 2012
Taiwan
90%+
Figure 6. Mobile Messaging Revenue Growth Curves In the next 2-4 quarters, the markets of US, Finland, Sweden, France, and Italy will join the ranks of declining messaging revenues. Even in China, which is still considered a growth market, C
h
ina Mo bile, wo rld’s biggest operator by revenue and subscribers started to see its messaging revenue decline (figure 7). In fact, mobile apps and VAS commanded the highest share in 2011 from the mobile data revenues.
Mobile messaging
Source: ITU ADVANCED LEVEL TRAINING, Strategic Costing and Convergence Planning for the Pacific Suva
6th–10th October, 2014, Jim Holmes and Matthew O’Rourke ITU Experts
According to several analysts estimated revenue losses are very significant
The volume of OTT messages sent is already estimated to exceed standard SMS messages and forecasts are unambiguously in favour of OTTs
According to Ovum, a London-based research and analytics firm, the telecommunications industry will lose a combined $386 billion between 2012 and 2018, mainly from customers using over-the-top (OTT) voice applications such as the market-leading Skype and Lync, both owned by Microsoft
13
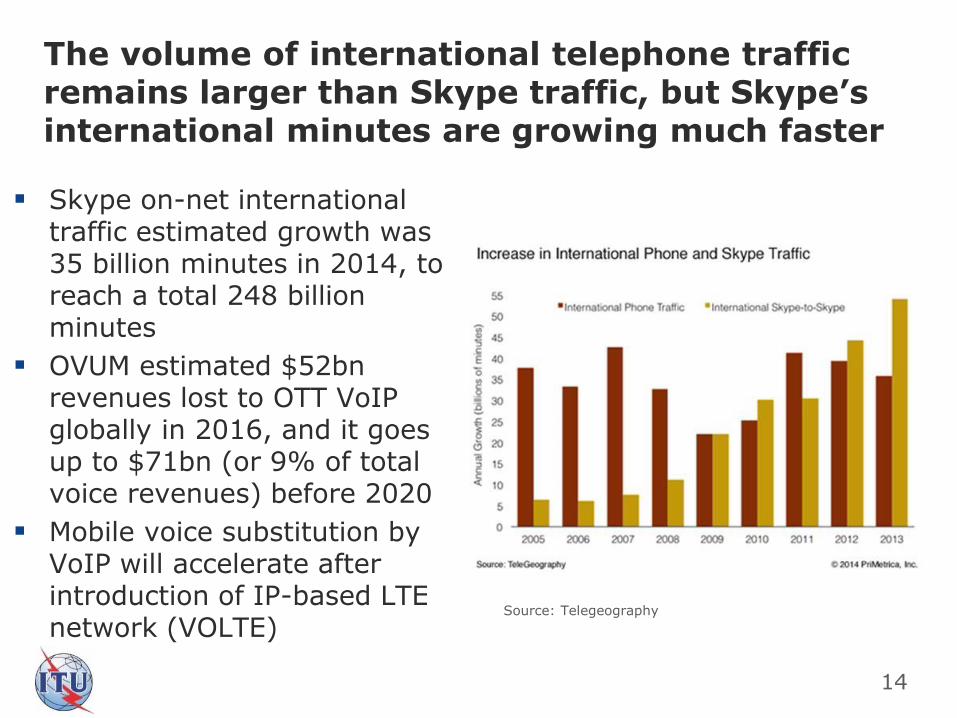
Skype on-net international traffic estimated growth was 35 billion minutes in 2014, to reach a total 248 billion minutes
OVUM estimated $52bn revenues lost to OTT VoIP globally in 2016, and it goes up to $71bn (or 9% of total voice revenues) before 2020
Mobile voice substitution by VoIP will accelerate after introduction of IP-based LTE network (VOLTE)
Source: Telegeography
14
The volume of international telephone traffic remains larger than Skype traffic, but Skype’s international minutes are growing much faster
15
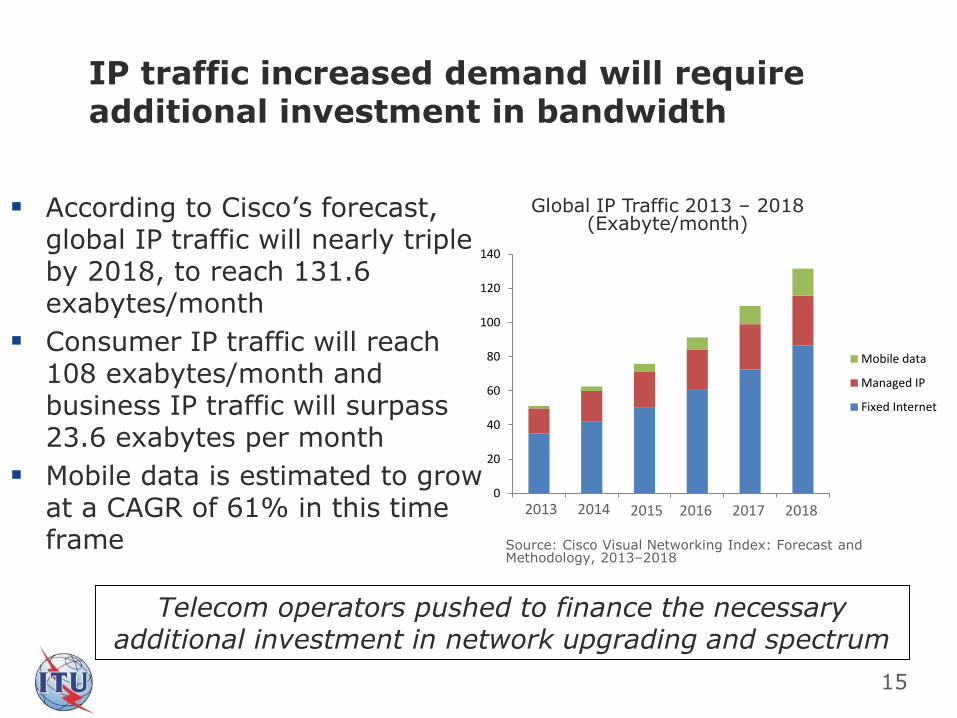
According to Cisco’s forecast, global IP traffic will nearly triple by 2018, to reach 131.6 exabytes/month
Consumer IP traffic will reach 108 exabytes/month and business IP traffic will surpass 23.6 exabytes per month
Mobile data is estimated to grow at a CAGR of 61% in this time frame
0
20
40
60
80
100
120
140
1 2 3 4 5 6
Mobile data
Managed IP
Fixed Internet
2013 2014 2015 2016 2017 2018
Global IP Traffic 2013 – 2018(Exabyte/month)
Source: Cisco Visual Networking Index: Forecast and Methodology, 2013–2018
IP traffic increased demand will require additional investment in bandwidth
Telecom operators pushed to finance the necessary additional investment in network upgrading and spectrum
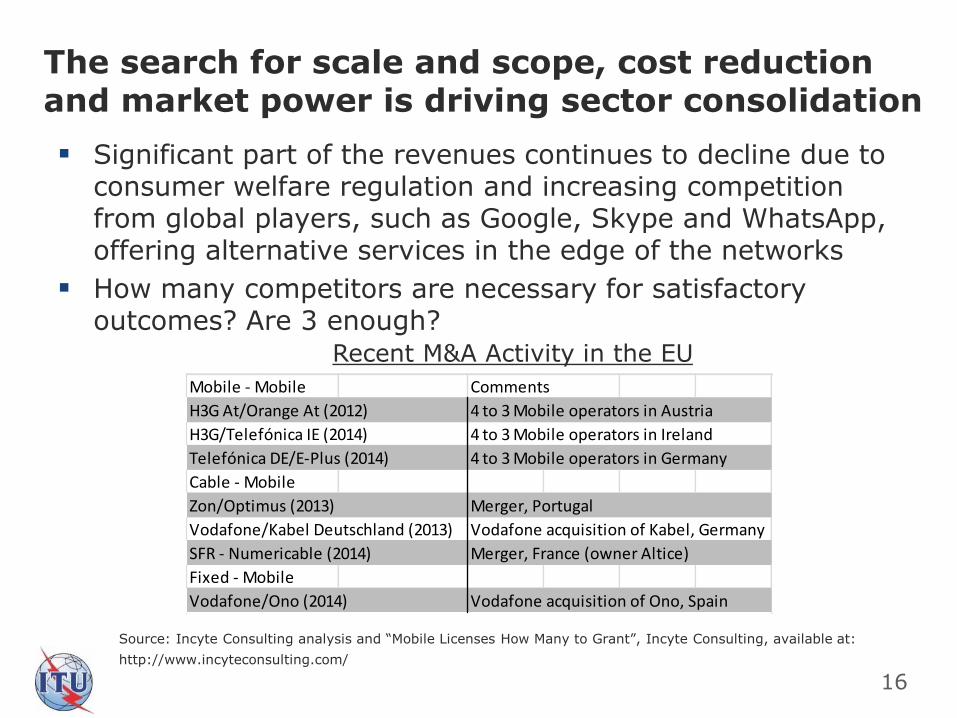
Significant part of the revenues continues to decline due to consumer welfare regulation and increasing competition from global players, such as Google, Skype and WhatsApp, offering alternative services in the edge of the networks
How many competitors are necessary for satisfactory outcomes? Are 3 enough?
The search for scale and scope, cost reduction and market power is driving sector consolidation
Mobile - Mobile Comments
H3G At/Orange At (2012) 4 to 3 Mobile operators in Austria
H3G/Telefónica IE (2014) 4 to 3 Mobile operators in Ireland
Telefónica DE/E-Plus (2014) 4 to 3 Mobile operators in Germany
Cable - Mobile
Zon/Optimus (2013) Merger, Portugal
Vodafone/Kabel Deutschland (2013) Vodafone acquisition of Kabel, Germany
SFR - Numericable (2014) Merger, France (owner Altice)
Fixed - Mobile
Vodafone/Ono (2014) Vodafone acquisition of Ono, Spain
Recent M&A Activity in the EU
Source: Incyte Consulting analysis and “Mobile Licenses How Many to Grant”, Incyte Consulting, available at:
http://www.incyteconsulting.com/
16
17
Conclusions
There is no doubt that OTTs had and will continue to have a strong impact on telecommunications traditional revenues: voice and messaging
In the fixed domain the battle with OTTs is more difficult: users got used to unlimited or quasi unlimited volume caps, to no blocking or throttling, free open internet access, and unlimited capacity of fiber in consumer’s perception
In the mobile service consumers are acquainted with very restrictive volume caps (in most markets), and in general the perception is that mobile broadband is expensive
Mobile data traffic will see exponential growth byt mobile business has a lot more pricing flexibility and capacity to control traffic load
Sector consolidation will continue also driven by lower business margins and further need for scale

18
Or-koonThank you