itv plc final results 2008/media/files/i/itv-plc/... · supply to itv 316 320 (1) total external...
TRANSCRIPT

1
ITV plcFinal Results 2008
4th March 2009

2
Introduction
Michael GradeExecutive Chairman

3
Agenda
� Introduction and overview Michael Grade
� Financial review Ian Griffiths
� Current trading and strategic update John Cresswell

4
Overview
2008 results � Total revenue £2,029m (2007: £2,082m)� Operating EBITA £211m (2007: £311m)� Impacted by NAR downturn and online investment� Reported numbers reflect impact of £2.7bn impairment of goodwill� Adjusted EPS 2.7p (2007: 5.0p)
2008 operating and strategic highlights� ITV share of viewing held for second year running� ITV share of UK TV advertising held for first time in 25 years� Global Content revenues (including internal) increased by 10%� Online users and video views growing steadily
2009 update� TV market and economic outlook remains weak

5
ITV’s prioritiesCore business, cost savings and cash
Focusing on our core business as a producer broadcaste r� Further non-core disposals and business closures
Additional and accelerated cost savings� Total savings of £155m in 2009, rising to £245m in 2011
Cash and liquidity � Additional covenant-free financing secured� Board recommending suspension of final dividend
Note: cost savings include previously announced savings of £35m over 2009/10 and regional savings of £40m in 2009
6
Accelerated regulatory progress
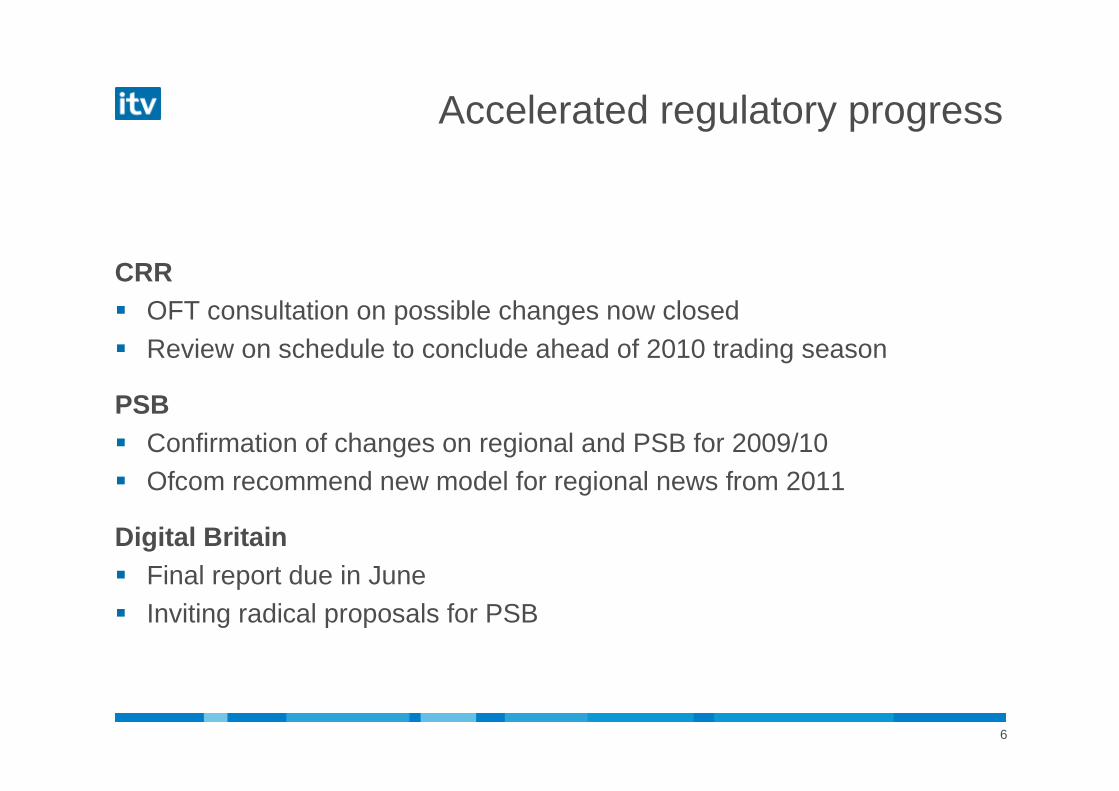
CRR� OFT consultation on possible changes now closed� Review on schedule to conclude ahead of 2010 trading season
PSB� Confirmation of changes on regional and PSB for 2009/10 � Ofcom recommend new model for regional news from 2011
Digital Britain� Final report due in June� Inviting radical proposals for PSB

7
Financial review
Ian GriffithsGroup Finance Director

8
2,082
2,029
20
21
97
3335
23
1900
1950
2000
2050
2100
2007 ITV1 NAR ChannelsNAR
PRS Internationalproduction
UKproduction
CSA / Other 2008
Group revenue
£m

9
211
311 64
9 198
38
100
120
140
160
180
200
220
240
260
280
300
320
2007 NAR NPB PRS Online CSA /Other
2008
Group profit
£m

10
BroadcastingRevenue and EBITA
(3)6
1,087407
1,125382
Schedule costsOther Broadcasting costs
(4)1,4891,425ITV plc NAR
(43)244140EBITA pre exceptionals
(5)1,7381,647Total
(8)3633SDN
(17)157131Media sales, PRS and other income
-
4
56
56
56
58
- GMTV
Sponsorship
16209242- ITV2, 3, 4, News, CITV, M&M
(8)1,2241,127- ITV1
Change %2007200812 months to 31 st December - £m

11
Global ContentRevenue and EBITA
10564622Total Revenue (inc ITV supply)
-9090EBITA pre exceptionals
(1)320316Supply to ITV
25244306Total External Revenue
8114123Distribution and exploitation
566398International production
International
(11)1917Resources
424868UK Production
Change %2007200812 months to 31 st December - £m

12
OnlineRevenue and EBITA
* Includes itv.com, itvlocal, ITV Mobile and Other Revenues
93336Total
(67)(12)(20)EBITA pre exceptionals
(18)2218Friends Reunited
641118itv.com and other*
Change %2007200812 months to 31 st December - £m

13
Profit and loss
138(2,554)(Loss)/profit after tax
(50)178Tax
188(2,732)(Loss)/profit before tax
(33)(60)Interest
221(2,672)(Loss)/profit before interest and tax
3(14)Associates, JVs and Investment income
(9)(108)Exceptional Items (total)
(28)(2,695)Goodwill reduction and impairment
(56)(66)Normal
Amortisation
311211Operating EBITA pre exceptionals
2,0822,029Revenue
2007200812 months to 31 st December - £m

14
Adjusted Profit and Loss
*Before exceptional items, amortisation, impairments of intangible assets
** Before exceptional items, amortisation, impairments of intangible assets, amortised cost adjustment and in addition for EPS, before tax adjustments
(33)(30)Interest (before amortised cost adjustment)
3(14)Associates, JVs and Investment income
311211Operating EBITA pre exceptionals*
5.02.7EPS (p)**
194106Profit for the period
(1)(2)Minority interests
195108Profit after tax
(86)(59)Tax
281167Profit before tax**
2007200812 months to 31 st December - £m

15
Exceptional items
12 months to 31 st Dec - £m 2008 2007
Reorganisation and integration costs (40) (8)
PRS (6) (18)
Onerous contract provision (50) (9)
Kangaroo (1) -
Total operating exceptional items (97) (35)
(Loss)/gain on the sale and impairment of properties (17) 9
Gain on the sale, net of impairment, of subsidiaries and investments 17 43
Impairment of available for sale financial assets (7) (26)
Kangaroo (4) -
Total non-operating exceptional items (11) 26
Total exceptional items (108) (9)

16
Interest charge
(29)(3)- less non cash movements (net)
-(30)Non cash amortised cost adjustment
(62)(63)Cash interest paid
(33)(60)P&L charge
1816Non cash IAS19 imputed pension interest
(7)24Swap fair value movements
3128Interest on cash and other
(75)(98)
-(16)One-off financial instrument closure costs
(75)(82)Interest on bonds
2007200812 months to 31 st December

17
TaxP&L tax credit and cash tax
43Net cash received
62Cash tax refunds for prior years
(14)Payments made relating to prior years
(5)Cash paid on account for 2008
(50)178P&L tax (credit)/charge
25198 Prior year adjustments
(20)(15)Deferred tax
(55)(5)Current year tax expense
2007200812 months to 31 st December - £m

18
178112
17
88
39
0
100
200
31.12.07 £39m deficitfunding
Asset/liability andother movements
Impact of changein mortalityassumption
31.12.08
Pension deficit
16
162
(146)
2008
(15)Imputed interest on P&L charge
129Expected returnon assets
(144)Interest cost
2009f£m
£mIAS 19 deficit
2,4912,161Fair value of scheme assets
1,0871,330Bonds
120127Other
(178)
(2,339)
704
2008
(112)Deficit
(2,603)Value of scheme liabilities
1,284Equities and property
2007£m

19
Movement in net debt
1510Share based compensation
66(62)Movement in net debt
262138Cash generated from operations (post-capex)
99(23)Cash generated from business activities
(33)(39)Defined benefit pension deficit funding
668730Net debt
(26)2Other movements
(122)(123)Equity dividends
6020Sale/purchase of businesses, investments and assets
(44)(20)Taxation and interest
(31)(40)Exceptional items
(55)(52)Capital expenditure less sale of fixed assets
(44)(67)Working capital
346247EBITDA
2007200812 months to 31 st Dec - £m

20
2009 funding update
Funding� £125m facility to 2013 drawn down� £50m new 10-year financing secured February 2009, with potential to
increase to £200m� Financial covenants apply only to undrawn £450m facility running to 2011
Outflows in 2009� Pension deficit funding of £30m in line with 5-year funding plan� 2008 interim dividend of £26m� Friends Reunited contingent consideration of £50m paid in January 2009� £250m bond repaid in March 2009� Next bond repayment £335m in October 2011

21
Current trading and strategic update
John CresswellChief Operating Officer

22
Current trading2009
(30)
(25)
(20)
(15)
(10)
(5)
0
5
January February March Q1
ITV Family NAR UK TV NAR
NAR, % change year on year
Total TV including intra-group monies, ITV Family excluding.

23
Reshaping the businessFocus on core, cost savings and cash
� Radical reassessment of ITV’s structure, activities and efficiency
� Enables ITV to manage extended economic downturn
� New plan will make ITV leaner, fitter and simpler
� Prioritising the core business, delivering cost savings and managing cash

24
Cost savingsSummary of total savings, 2009-11
175
65
40
70
2010
7050Efficiency savings
>4040Regional news
155
65
2009
>245
135
2011
Savings vs 2008
Network schedule
£m
Notes
Network schedule savings vs 2008 P&L schedule costs and based on current ITV planning
New targets include all previously announced efficiency and regional savings
No benefits included from proposals for further regional changes from 2011
3527Efficiency savings
4040Regional news
67
-
2009
75
-
2010
Savings vs 2008
Network schedule
£m
Previously announced targets New targets

25
Efficiency savings
� £50m savings in 2009, rising to £70m in 2010 � Additional headcount reduction of c600 posts� Total costs of change £40m� Tight management of capex and working capital
7050Cumulative Total
2316Central Services
44Online
1811Global Content
2519Broadcast
20102009Cumulative savings
Note: new target includes previously announced £35m saving for 2009/10; costs of change in addition to 2008 costs

26
Programme investment3-year plan to increase schedule efficiency
175105105P&L savings vs 2008
750815805867Total ITV1 network
34343434GMTV
717171112Regional
9501,0201,0201,125Total schedule costs
110
2009
100
2010
95112ITV digital channels
20112008£m
� World Cup costs back out and low committed spend� P&L aligns with lower cash spend
2011
� £65m network and £40m regional savings� Focus on entertainment and existing stock
2009
� Impact of World Cup costs to be contained� Cash spend running £100m below P&L NPB
2010

27
Broadcasting
� Greater spend efficiency
� Focus investment on peak-time
� Further savings post-World Cup from 2011
� Tight management of cash spend
� Considering options for SDN
� CRR reform on track for autumn 2009 deal round
� Continue to outperform UK TV ad market
� Drive continuing impact growth across channels

28
(8)
(7)
(6)
(5)
(4)
(3)
(2)
(1)
0
11994 1995 1996 1997 1998 1999 2000 2001 2002 2003 2004 2005 2006 2007 2008
Source: BARB Infosys / Ratings Analyser, Individuals, All time
%
BroadcastingITV holding share of viewing…
ITV Family – Year on year % change in share of viewi ng
29
(8)
(7)
(6)
(5)
(4)
(3)
(2)
(1)
0
11994 1995 1996 1997 1998 1999 2000 2001 2002 2003 2004 2005 2006 2007 2008
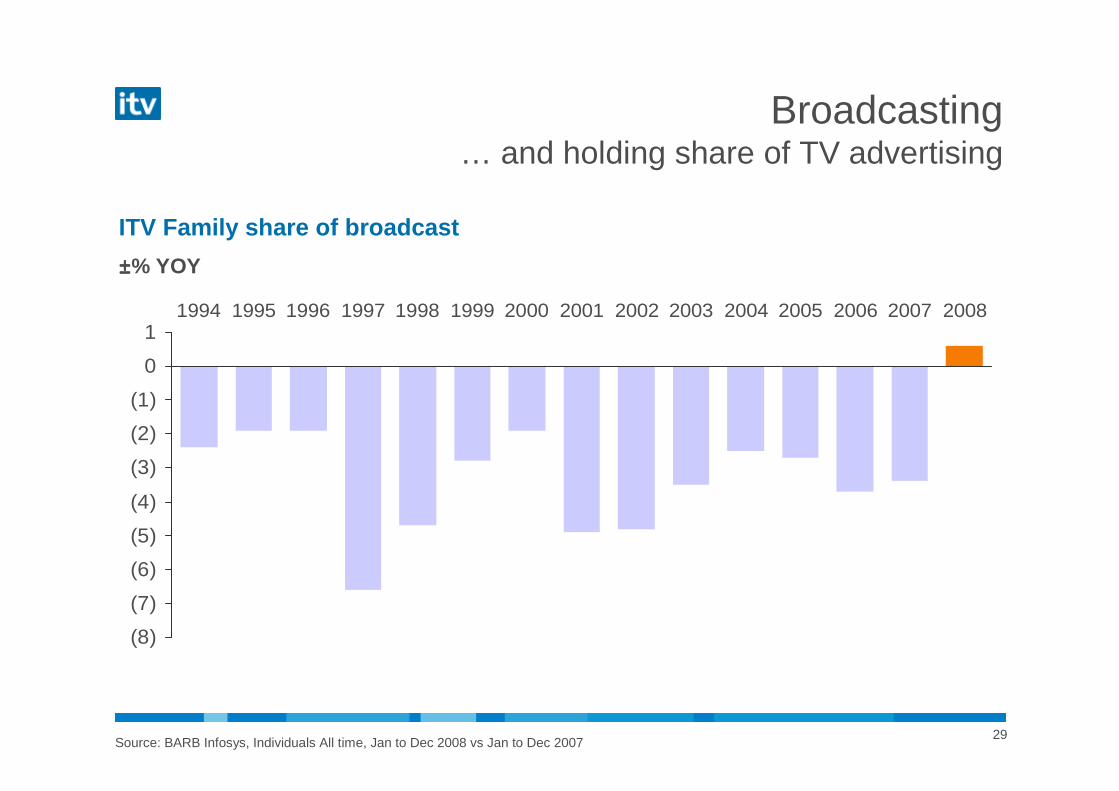
Source: BARB Infosys, Individuals All time, Jan to Dec 2008 vs Jan to Dec 2007
Broadcasting… and holding share of TV advertising
±±±±% YOY
ITV Family share of broadcast

30
0
2
4
6
8
10
12
Q1 20
04Q2
2004
Q3 20
04Q4
2004
Q1 20
05Q2
2005
Q3 20
05Q4
2005
Q1 20
06Q2
2006
Q3 200
6Q4
2006
Q1 200
7Q2
2007
Q3 200
7Q4
2007
Q1 200
8Q2
2008
Q3 200
8
DTT homes Analogue terrestrial homes
� Operating margin over 60% on £33m revenues� New channel agreement takes effect from 2009� 10th video stream from 2009� Licence renews to 2022 from 2010
SDN channels
millions
BroadcastingSDN leveraging increased digital penetration

31
Online
� Friends Reunited to be sold when time is right
� ITV Local to close as a stand alone business
� Scaling back mobile and gaming
� Integration of itv.com with Channels
� Drive growth of online video via itv.com and VOD
� Increase monetisation of unique users and video views

32
0200400600800
1000
Jan Feb Mar Apr May Jun Jul Aug Sep Oct Nov Dec
Video advertising Whitespace / sponsorship
itv.comOnline video viewing comes of age
02468
10
Unique Users(Highest Month)
Unique Users(Monthly Average)
20072008
020406080
100
Video Views
20072008
itv.com revenues£k
millionsUnique users
millionsVideo views

33
Global Content
� Building portfolio of “seed-corn” production investments / partnerships
� Reducing overheads and site costs to protect margins
� Grow international production businesses
� Maximise share of high value ITV commissions
� Focusing development on globally exploitable factual entertainment / gameshows

34
Global ContentBuilding partnerships and investments
Acquisitions Indy stakes Partnerships

35
SummaryCore, costs and cash
Reducing costs� £155m cost reduction in 2009, rising to £245m in 2011
Cash and liquidity� Reduced capex and non-core investment� Additional disposals� New financing secured
Maintaining strength of the core business� Broadcasting performance improving � Online tighter focus on core itv.com� Global Content building revenues

36
Michael GradeExecutive Chairman

37
ITV in 2009The forces shaping the business
PERFORMANCEITV performance
improving
DIGITAL SWITCHOVERPressure from
digital transition easing
REGULATIONRegulatory burden
lightening
ECONOMYEconomic context hugely uncertain

38
ITV plcFinal Results 2008
4th March 2009

39
Appendices

40Source: Datawarehouse, ITV1 (inc NCLs), ITV2, ITV3, ITV4, CITV, Men and Motors. Includes Intra Group Monies. YTD = Jan-Mar 09
YTD 09 index vsYTD 08
Index vs2007
2008 revenue£mCategory
82
90
61
111
103
83
85
73
90
84
86
93
77
97123Cosmetics & Toiletries
99138Food
111143Entertainment and Leisure
8970Telecommunications
12054Government
951,498Total ITV sales
9041Airlines, Travel and Holidays
9152Publishing and Broadcasting
9055Pharmaceuticals
9477Household Stores
8290Cars and Car Dealers
82111Finance
103292Retail
Current tradingCategory movements
Top 12 advertising categories
41
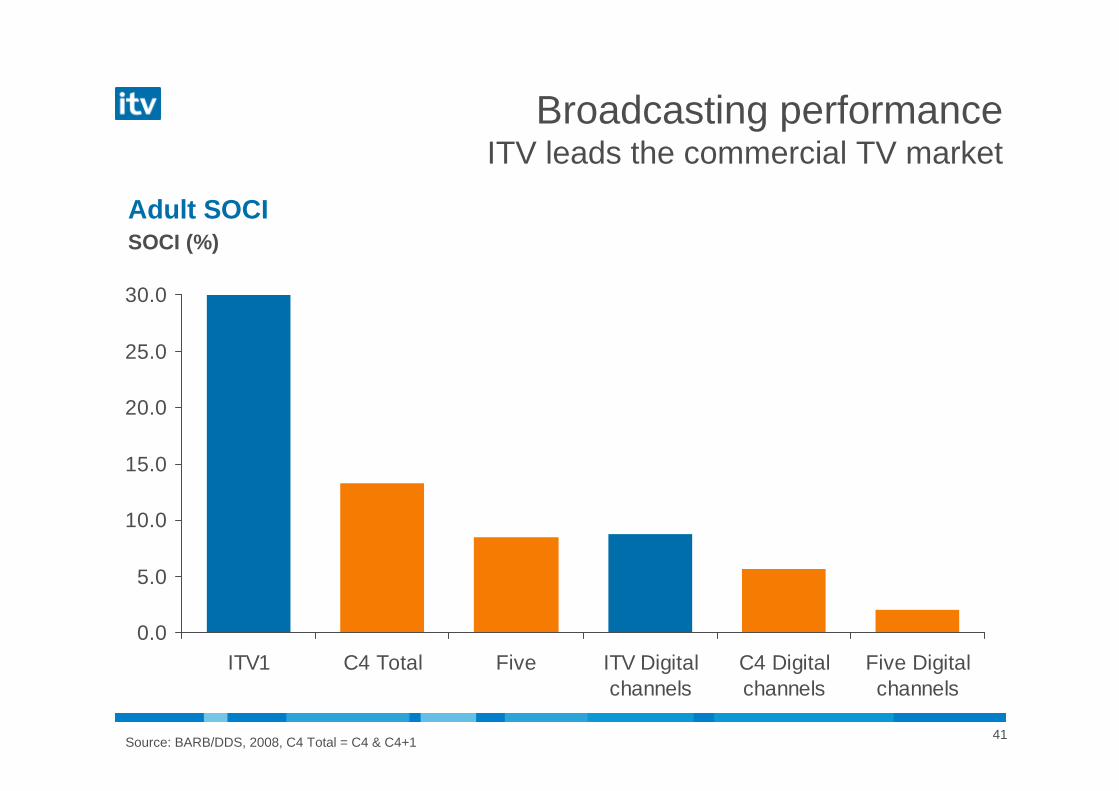
Broadcasting performanceITV leads the commercial TV market
0.0
5.0
10.0
15.0
20.0
25.0
30.0
ITV1 C4 Total Five ITV Digitalchannels
C4 Digitalchannels
Five Digitalchannels
Source: BARB/DDS, 2008, C4 Total = C4 & C4+1
Adult SOCISOCI (%)

42Source: BARB/DDS
BroadcastingITV delivering more impacts
0
50
100
150
200
250
300
350
2004 2005 2006 2007 2008
ITV1 GMTV ITV digital channels
-1% +1% - 4% +3% +4%
Volume of adult commercial impacts

43
BroadcastingITV1 delivering mass audiences
1 0 0 0 0 0 0 0250
200
400
600
800
1000
1200
1400
1600
1800
3m+ 4m+ 5m+ 6m+ 7m+ 8m+ 9m+ 10m+ 11m+
ITV1 C4 Total Five
Source: BARB/Infosys, Individuals, All time, 2008, programmes of 10 mins+ duration, C4 Total = C4/C4+1
Mass audience programmes by channelNumber of shows

44
0
200
400
600
800
1000
1200
1400
1600
1800
3m+ 4m+ 5m+ 6m+ 7m+ 8m+ 9m+ 10m+ 11m+
Global Content performancePrime deliverer of ITV ratings
Num
ber
of s
how
s
Number of viewers (millions)
Source: BARB/Infosys, Individuals, All time, 2008, programmes of 10 mins+ duration
Mass audience shows on ITV1 by source
ITV Studios
Network news programming
Other ITV1 programmes

45
Segmental performance
109(11)1EBITA(40)6740Revenue
Other (67)(12)(20)EBITA
93336RevenueOnline
-9090EBITA(1)320316Internal Revenue25244306External Revenue
Global Content(43)244140EBITA
(5)1,7381,647RevenueBroadcasting
Change%
2007Published
2008Published12 months to 31 st December £m

46
BroadcastingSchedule costs
Note: Numbers include minority share of schedule costs – 2008:£56m (2007:£56m)
4837867Total ITV1
31,0871,125Total Schedule Costs
(3)3534GMTV
11101112ITV2, 3, 4, CITV, M&M
3951979Total ITV1 inc regional
(2)114112Regional news & non news
83740ITN news & weather
524873Acquired
4140146Sport
(1)612608Commissions
Change %2007200812 months to 31 st December - £m

47
ITV Broadcasting Licence fees
324430Total
2(140)(143)Digital licence rebate
6180169PQR levy
-44Cash bid payment
Change %2007200812 months to 31 st December - £m

48
Interest charge
-30Non cash amortised cost adjustment
-(30)Non cash amortised cost adjustment
-(19)£125m facility
-(5)£110m at LIBOR+2.7% Mar 13
(62)(63)Cash interest (11)(17)Swap and bond fair value and timing differences
(18)(16)Imputed interest on net pension deficit(33)(60)P&L charge
3128Interest on cash and other1816Imputed interest on net pension deficit
(7)24Swap/Bond fair value movements(75)(98)(5)(4)Other bonds, loan notes and finance leases
(15)(14)£250m Eurobond at 6.125% Jan 17(17)(18)£325m at 5.375% Oct 15
(17)(24)€500m Eurobond at 4.75% / 6%* Oct 11(14)(14)£250m at 5.625% Mar 09(7)-£200m at 7.625% Jun 07
2007200812 months to 31 st December
* Coupon step up in 2008

49
JVs, Associates & Investment income
* 2008: relates to loan repaid previously written off
(1)(3)Kangaroo
(2)(4)Freesat
33Liverpool.com*/Arsenal.com
3(14)Total
11Investment Income
2(15)Total
(4)(3)Interest and Tax
1(1)ITNAssociates
5(7)ScreenvisionJV’s
2007200812 months to 31 st December - £m
50
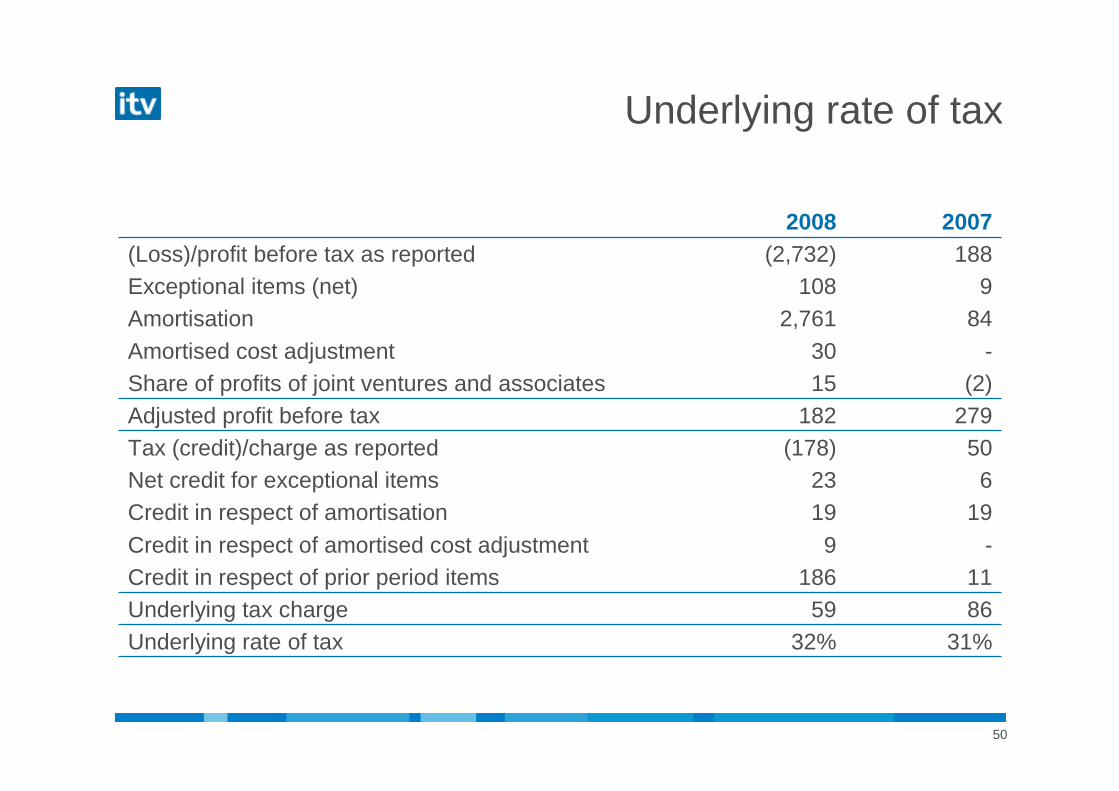
Underlying rate of tax
31%32%Underlying rate of tax8659Underlying tax charge11186Credit in respect of prior period items
19-
199
Credit in respect of amortisation Credit in respect of amortised cost adjustment
623Net credit for exceptional items 50(178)Tax (credit)/charge as reported
279182Adjusted profit before tax(2)15Share of profits of joint ventures and associates
84-
2,76130
AmortisationAmortised cost adjustment
9108Exceptional items (net)188(2,732)(Loss)/profit before tax as reported
20072008

51
Analysis of net debt
-(30)Amortised cost adjustment
668730Statutory net debt
(498)(616)Cash & cash equivalents
(100)-UBS Note
8579Finance leases#
272Other loans & loan notes
248266£250m Eurobond Jan 17
322323£325m Eurobond Oct 15
335-
346110
€500m Eurobond^ Oct 11£110m Eurobond Mar 13
249250£250m Eurobond Mar 09
Dec 2007Dec 2008
^ Net of £147m cross-currency swap asset (Dec 07: £30m)# Finance leases predominantly associated with sale and leasebacks of programmes and matched by equal cash deposits

52
Disposals
-£5.0m4. Property
5th March 2008£15.5m1. Liverpool FC.tv Limited
£35.0mTotal
10th July 2008£0.5m3. CSA assets
7th April 2008£14.0m2. Arsenal Broadband Limited
DateCashDisposal (£m)

53
Movement from reported to adjusted
21
(9)
30
Amortised cost
adjustment
3,8773,877Weighted Average
2.7p-65.9pEPS
106(2,556)Earnings
(2)(2)Minority interests
108(186)2,742(6)1774(2,554)Profit after tax
(59)(186)(19)(23)178Tax
167(2,732)Profit before tax
(30)(60)Interest
197-2,761(6)1797(2,672)PBIT
-(6)6Gain on sale of sub’s & inv’s
-17(17)Gain on sale of property
11Investment Income
(15)(15)JV’s & Associates
-2,761(2,761)Amortisation and impairment
21197114Operating EBITA
2,0292,029Revenues
AdjustedOther tax adjustments
AmortisationGain on sale of subsidiaries &
investments
Gain on sale of
property
Operating Exceptional
items
Per Annual Report
2008

54
3,8743,874Weighted Average
5.0p3.5pEPS
194137Earnings
(1)(1)Minority interests
195(11)65(17)(8)28138Profit after tax
(86)(11)(19)1(7)(50)Tax
281188Profit before tax
(33)(33)Interest
31484(17)(9)35221PBIT
0(17)17Gain on sale of sub’s & inv’s
0(9)9Gain on sale of property
11Investment Income
22JV’s & Associates
084(84)Amortisation and impairment
31135276Operating EBITA
2,0822,082Revenues
AdjustedOther tax adjustments
AmortisationGain on sale of subsidiaries &
investments
Gain on sale of property
Operating Exceptional
items
Per Annual Report
2007
Movement from reported to adjusted