j’:’~ f 1z~3 c&v’+$’5q$@)’.,
TRANSCRIPT
,
IJ4-UR-95- 1z~3
Ttle:
Author(s):
Submittedto
f.,, ,. ,,.. J’:’~‘t -
c&v’+$’5Q$@)’.,HistoricalDetectionofAtmosphericImpactsbyLargeBolidesUsingAcoustic-GravityWaves
. RECEIVEDFIAY081995
0S11DouglasO.ReVelle
InternationalSymposiumonNear-EarthObjects,United
Los AlamosNATIONAL MBORATORY
Nz[ions/ExplorersClub,New YorkCity,April24-26,1995
,.,,.,,,,::.,,,.,.:,.,,,,,,.,...,....,,,.,
:,,, : .:,..,,,,,,,,.:,,,.:~.,:.,,,.,.,,:,,,
.......,,,,... , ‘,’:,’‘,:::
:..,:.:.:/ ,,:,:,:,:.,, :
,,:,,,,,,,,,:,,,, ,,,,, ,,, ,, .,, ,,,,,!.,,:.,,: ,.,., ,,, , ,. ,.
Lm AlamM Ndond LaboraIoty an dflrmmive acUon/equal opportumty wnplo W, Is opemtad by the Unlversl of California b th. U,S, Deparmwnt ofEnor undercomroct W.7406-k-38. By u w 01Ihia arkk, the
v kg+wr rQ~n4zoo that Lw U.S. /!ovornmant r.laino a rwnwcluciva,
royal -ha Ilcance to publlah or reproduco the pu ,Ishad form of Ibis conkl uon or m ●l ow ohm 10do Bo, for US. Govarnrwtw purPaeI Tha LotAlamoI Nadonal Labahxy reqwato thal ha publisher Idfmufy M ar[klo as workparlorrnadunder tie aunptceo of the US. Oepwlmww 01Enargy,
RlcrnmlmnN nL TL41Cnm lMEhlTIcIINIhmcnMASTER
Historical Detection of Atmospheric Impacts byLarge Bolides Using Acoustic-Gravity Waves
Douglas O. ReVelleEarth and Environmental Sciences Division
Los Alamos National LaboratoryLos Alamos, New Mexico 87545
DISCLAIMER
This reprl waE prepurui M an accouni of work qmrrmal by ●n ●gency of [he United Sta(eIGovernmcrr[. Neither Ihe United SIaIus Government nor any agcrrcj thereof, nor nny of theiremployees, makes any warranty, eaprw or implied, or aseumu my legal liability or ren~si-bility for the accuracy, camplelencas, or usafulnesnof any inforrrm(ion, appnratm, product, orprocem diAraed, or mprescntn tha( i[s me would noi infringe privsicly owned rights. Refer.ence herein [o any specific commercial praJuct, p~, or mtwi~ by wade rmrna, irademark,manufacturer, or otherwisr d~ nol rreccwrily corrm(i[u(cor imply III cndomement, mcam.merrdatiorr, or favoring by Ihc United .5(WOI Government or any ●gency Ihemof. The viewnand opinions of authom expressed herein do nor McOIMriiy BISM or reflect thoee of theUniled Stata Government or any qancy the~f.
To be presented at: International Symposium on Near-EarthObjects, United Nations/Explorer’s Club, New York City, NewYork, April 24-26, 1995
1
Abstract:
During the period from about 1960 to the early 1980’s anumber of large bolides (meteor-fireballs)entered theatmosphere which were sufficiently large to generate blastwaves during their drag interaction with the air. Forexample, the remnant of the blast wave from a single kilotonclass event was subsequently detected by up to six groundarrays of microbarographs which were operated by the U.S.Air Force during this pre-satelllte period. Data have alsobeen obtained from other sources during this period as welland are also discussed in this summary of the historicaldata. The Air Force data have been analyzed in terms oftheir observable properties in order to infer the influxrate of NEO’S (near-Earth objects) in the energy range from0.2 LO 1100 kt. The determined influx is in reasonableagreement with that determined by other methods currentlyavailable such as Rabinowitz (1992), Ceplecha, (1992; 1994b)and by Chapman and Morrison (1994) despite the fact that dueto sampling deficiencies only a portion of the “true” fluxof large bodies has been obtained by this method, i.e., onlysources at relatively low elevations have been detected.Thus the weak, fragile cometary bodies which do notpenetrate the atmosphere as deeply are less likely to havebeen sampled by this type of detection system. Future workusing tk,eproposed C.T.B.T. (Comprehensive Test Ban Treaty)global scale infrasonic network will be likely to improveupon this early estimate of the global influx of NEO’Sconsiderably.
I. Introduction
A. The Bolide-Atmosphere Interaction Spectrum
We now know that in the size range of interest of theNEO (near-Earth object) populatioil,i.e., from about 1 m toseveral km across, the bolide population is comprised of atleast ordinary Chondritic materials, CarbonaceousChondrites, regular Cometary materials, “Soft” Cometarymaterials and finally Nickel-Iron materials (Ceplecha,1992; ReVelle and Ceplecha, 1594). ReVelle (1993) hasrecently analyzed the entire spectrum from small to largebodies using a unified energetic approach that can be usedto infer the observed behavior of entering bodies in a seifconsistent way. The observed bolide phenomena fit withinthis framework in such a way that if only four independentparameters are specified the consequences of the draginteraction with the atmosphere can be immediatelyanticipated. From this energetic viewpoint only sixdiscrete interaction regimes are predicted to occur. Thisunified pattern of the meteoroid-atmosphere interactionspectrum, along with its predictors are given in Table 1..
Only regimes iv). through vi). are of direct interest tothe NEO population under consideration with regard to blastwave generation and its subsegment decay to acoustic-gravitywaves that can be detected by ground based sensors. Thespecific body size that corresponds with regimes iv).through vi. depends on the meteoroid group propertiesthemselves (bulk density, ablation coefficient, materialstrength, etc.) as well as on entry parameters directly,i.e., initial velocity, entry angle, atmospheric scaleheight, surface pressure, etc..
B. The Blast Wave Interaction Remnants at Great Ranges
During the continuum flow interaction and the impactand explosion cratering regimes of bolides with theatmosphere, i.e., iv). to ‘~i).above, a line sourceexplosion is generated whic:~subsequently decays first froma strong tc a weak shock front and eventually to a nearlylinear acoustic-gravity wave, In addition, for some bodies astrong, point source terminal explosive fragmentation eventcan occur near the end of the visible trajectory as well.Multiple explosions are also possible (for example, Spaldinget. al., 1994). The recent impact of Shoemaker-Levy 9 withJupiter make the need for realistic colutions of the largebody impact regime with a planetary atmosphere far moreurgent than previously considered (Crawford et. al., 1994).
It has long been known that the fundamental period ofobserved explosive waveforms (independent of nonlinearpropagation effects or of geometric or material dispersionphenomena) is inversely related to the energy deposited intothe fluid, i.e., higher fundamental frequencies correspondto smaller energy releases in the atmosphere. Using this
consideration and the predictions of spherical andcylindrical blast wave theory, we can anticipate that thesignals of interest should range from frequencies of a fewHz down to periods approaching 1 minute or more depending onthe magnitude and altitude of the energy release by theentering bolide.
II. Detection of Airwaves from Large Bolides
A. Measurement Systems
Conventional arrays o“ microbaroqraphs with Daniels-typepipe type noise filters, were operated at numerous stationsglobally by NOAA, the U.S. Air Force (previously operated bythe U.S. Army) with the prescribed system bandpass generallyin one of two separn+e frequency intervals depending on theexpected signal amplitudes (or ranges) and associatedfrequencies of intei-est.
The basic sensor for all these measurements is arelatively high frequency acoustic capacitance microphonewhose low frequency response is adjusted using a largebacking volume which is connected thro~~gha leak valve tothe background air pressure. O~~rating below the normalauditory hearing limits of humans, these microbarographsresponded to the so-called atmospheric wave “zoo”, i.e., avery large number of nat~~raland man-made events such asaurora (including auroral electrojet surges), volcaniceruptions, meteor-fireballs (halides), earthquakes, mobntainassociated waves, severe weather (tornadoes, hurricanes,thunderstorm convective processes, etc.), atmosphericboundary layer processas such as nocturnal low-level jetsand wiridshear events like gust fronts, etc., Hicrobaroms(with the same source as Microseisms in the Earth) the PolarTroposphericjet stream, sub- and supersonic aircrait,commercial mining and other man-made chemical and nuclearexplosions, etc. (Georges and Young, 1972).
The M4 Signal Monitor operated by the U.S. Air Force hadthe following frequency bandpass characteristics (PersonalCommunication with MSgt Harold M. Baker Jr,, 1979):
i) High Frequency Filter N1O: 3 db down at 8.2 Hz and 25seconds, respectively.
ii) Low Frequency Filter N9: 3 db down at 44 and 440seconds, respectively, but a significant frequency responseextended as low as 15 minutes in period.
In addition, there was also a separate very highfrequency and close range sensor incorporated into theoverall M4 system as well, the Mill~barograph N2 systemwl!ichoperated within nearly a conskant gain (+\- 1 db) overthe range from 0.0001 to 0.1 Hz and could detect pressuresas great as 10 mb (M4 Signal Monitor Technical Manual, March
4
7, 1972: TI 141-lKA-1). The CORAL N4 system (Correlator-Analyzer) provided continuous cross-correlation of all therelevant signals of interest. The entire system wasroutinely calibrated in both frequency and amplitude toensure reliable operation in both detection and locationcapability in as near to continuous operation as possible.
Such infrasound stations are still in operation today atonly a few stations such as Los Alamos National Laboratory(Mutschlecner and Whitaker, 1988: Whitaker et. al., 1990;Whitaker et. al., 1994), at Uppsala, Sweden, (Liska, 1980),in Japan, in the Netherlands, etc., but the probability isquite good that within 5 year’s time from 60 to 75 stationswill be operating worldwide as”one integral part of the fourproposed technologies of the C.T.B.T. (Comprehensive TestBan Treaty) monitoring program. These four element arraysare currently proposed to have wide passband operation witha nominal response from 50 seconds period to about 10 Hz.
Using beamforming and cross-correlation techniques, thefollowing parameters are continuously available for signalswith sufficiently large signal to noise ratios at eachelement of the microbarograph array (usually conditions oflow wind noise):
a) Amplitude: Signal to noise ratiob) Period: For Lamb, compressional and gravity wavesc) Signal Durfitiand) Elevation Arrival Angle: Through the characteristic
~Felocity(horizontal trace velocity)e) Azimuth Arrival Angle: At maximum cross-correlationf) Power Spectral Density
Signals consist of generally lower frequency Lamb wavestraveling at signal velocities (travel distanceltravel time)that average about 0.34 km/see (Posey and Pierce, 1971:Pierce and Kinne!f,1976) followed by acoustic arrivals ataverage signal speeds from 0.29 km/see for refractivereturns from the ozonosphere (about 50 km aloft) to about0.24 km\sec for refractive returns from the lower ionosphere(about 100 km aloft). These waves are indicative of a verylarge part of the acoustic-gravity wave spectrum, which canalso be subdivided at angular frequencies much larger thanthe Brunt-Vaisala (buoyancy frequency) as a class of wavesknown as infrasound (Georges a~d Young, 1572). For suchwaves the restoring force to th= wave motiGn is not buoyancyas it is at low frequencies large compared to the inertialfrequency, but instead is dominated by the elasticity of themedium and modified by stratification effects as compared tosimple, high frequency, longitudinal and irrotational,linear acoustic waves.
These signal velocity values are indicative of data takenat Los Alamos, but are generally confirmed by the U.S. AirForce results provided in Table II..
Specific techniques have been developed to facilitateanalysis of both the Lamb wave and of the separate acousticarrivals as will be discussed below.
B. Historical Eatabase
In Table 111. to VII., the historic database of signalsdetected by such global scale microbarographs has beensummarized. In Table III., some of the event energies havealso been confirmed by other techniques as well (for exampleby seismic detection by Earth impact and for air-coupledRayleigh waves, etc.). Unfortunately only the U.S. Air Forcedata have a truly global sampling efficiency as will be seenin Table VIII. below, so that the other detections can notreadily be used in estimating the global i]]fluxof NEO’S.Previously these events were tabulated and interpreted inReVelle and Wetherill (1978a, 1978b).
The classic event that basically started researchersworking on this class of problems was the unique event ofJune 1908 in the Tunguska region of Siberia ir;the formerU.S.S.R. and reported by F.J.W. Whipple and by numerousother later authors.
Other groups have also dete~”:edmeteor-fireballs onoccasion by either the recognition of its large amplitude,low frequency signature or by noting an exceptionally largecharacteristic velocity (horizontal trace velocity acrossthe array) or by aircraft reports or other visualconfirmation of exceptionally bright, fast objects in thenight sky. On occasion an exceptionally bright bolide alsooccurs during daytime, such as the famous August 10, 1972skip fireball that was witnessed by Jacchia and #hoseorbital change was calculated initially by Ceplecha andlater refined based on refined mass estimates (Ceplecha,1994a). This event was also recorded on two U.S. infraredsatellite s}-stems(Rawcliffe et. al., 1974). Infrasonicsignals were also ~ecorded from this object which wasestimated to be about 5 meters ac~oss, but to date noinfrasonic data nave been available from the U.S. Air Forceon this u,.iqueevent, even though the author was informedthat acoustic signals from this event were detected(l?ersonalcommunication with F. L. Whipple, 19?5). Asimilar, but much larger bolide and higher velocity was alsoobsemed by both visible and infrared military satellitesensors on February 1, 1994 (Spalding et. al., 1.994),butonly a marginal detection directly confirming its associatedinfrasonic sigrlalshave been reported (personalcommur.icationwith R. Whitaker, 1994), probably due to alack of such sensors operating currently and to therelatively high frequency passband of most currentlyoperational systems ( > about 0.1 Hz). A very definitedetection of either the impact of part of the original body(jrof the blast wave itself was made by hydroacousticsensors in the Pacific however (R. Spalding, PersonalCommunication, 1995).
Other data recorded by N.O.A.A. (National Oceanographicand Atmospheric Administration) at the Wave PropagationLaboratory by A. Bedard, V. Goerke, G. Greene, J. young and
others as well as signals detected by U.S.G.S. (U.S.Geologic Sume}-) by Shoemaker and by researchers at theUniversity of Alaska (C. Wilso”n)ere given in Table V..
Analyses of these events as summarized by ReVelle(1975; 1976) and interpreted for line source explosiongeometry are given in Table VIA..
We can also compare these estimates by ReVelle (1976)with those deduced using the semi-empirical period atmaximum amplitude reiations given below in 111. C. (equation(3). From this relation which has been extensively testedand confirmed by alternative detection methods, the doubledsource er,ergyfor each of these events is given in TableVIB..
It would be very beneficial to further evaluate andrefine these data by using both realistic multi-modalanalyses (Pierce and Kinney, 1976), i.e including zonal andmeridional.steady state winds and by using the pressureamplitude wind normalization factor developed byMutschlecner and Whitaker (1988). This refinement of theabove source energy estimates could impact upon the NEO fluxestimate and associated error limits discussed in 111.E..
Still other data have been recorded using relativelyhigh frequency sensors similar to those in use today at LosAlamos (Globe Universal Sciences Model 100 C.). For thesesensors the -3 db bandpass is “fromabout 10 Hz to 0.1. Thesedata were recorded again at Boulder by N.O.A.A. researchers,by the University of Michigan in Sioux Falls, S. Dakota andat the National ResearcFlCouncil Canada at the now defunctSpringkill Meteor Obsenatory. The first event was confirmedby visual and by aircraft reports on the night in question,the second was confirmed by association with thephotographed event, PN42556 of the Smithsonian’s U.S.Prairie Network and the latter event was detected inassociation with a meteor patrol radar during the Geminidmeteor shower in 1975. These events and their analyzedproperties are detailed in Table VII.
III. Analysis of Airwave Data from Large Bolides
A. Ray Theory Approaches
This approach allows the altitude of the source and theazimuth arrival angle to deduced. As noted earlier dependingon the altitude of the ducted refractive return, differingsignal velocities are expected on the basis of previous U.S.Air Force and Los Alamos experiences, etc.. Also in the caseof PN42556 (U.S. Prairie Network Firebi.11Number), Kraemerand Bartman (1981) were able to ray trace fcrm the groundarray back to the source with very great precision. After a
7
travel of some 250 km, the back ray tracing missed the knownthree-dimensional trajectory by only 10 meters.
For truly line source signatures the entry angle of theentry is very Critical, since the steep angled entries whichare typical of smaller bodies produce corresponding raypaths which are less likely to reach ground level (ReVelle,1976). For corresponding shallower entries ray paths aremore nearly vertical and consequently are less likely tosuffer from significant refraction effects. Such argumentsare more useful at close range to the entry which seems mostapplicable to only one of the ten U.S. Air Force events (0.1kt event).
Numerous acou~tical data were reported from the firstmeteorite which was photographed and subsequently recoveredon the ground, the Pribram meteorite in the Czech Republic(formerly Czechoslovakia) in 1958. These data werecataloged by Ceplecha and illustrated the well knownanomalous propagation of sound effects first noteddramatically at Queen Victoria’s funeral in Great Britain.In such cases semi-spherical zones of audibility and ofsilence are found surrounding the acoustical source region.These zones are readily predictable on the basis of rayacoustics if the corresponding atmospheric properties,primarily the temperature and wind structure, aresufficiently well known.
B. Lamb Wave Approach
Pierce and Kinney (1976) and co-workers have developed aprediction of source yield, Y, as a function of the arrivingLamb wave period, T, at corresponding amplitude, AE, whichcan be written for distances, r, small compared to theearth’s radius in the limiting form:
log(Y) = 1.5*log(T) - 3.37 + log(Ap) + 0.5*log(r) (1)
with Ap in pbars, T in seconds, r in km and Y in kt TNT.
Lamb (or edge) waves , which are guided acoustic wavesat high frequencies and guided gravity waves at lowfrequencies, take time to develop in association with agiven source. These waves are evanescent and are only ofsignificant amplitude near the earth’s surface. Thus, forclose ranger and progressive higher frequency these wavesare less likely to be observable (ReVelle and Delingert1981). From the analysis of the meteor data ReVelle andDelinger (1981) were able to deduce an empirical fit to thearriving Lamb waves in the form:
Log(Y)= 2.O*log(T) - 3.18 log(Ap) + 0.5*log(r); r2= 0.58 (2)
C. Period at Maximum Amplitude Approach
This approach is semi-~mpirical and relates the period atmaximum amplitude to the source energy at sufficiently largerange fram the source. In a private communication betweenthe author and Dr. G. Eies (1978) the following relatioilswere disclosed (deduced from the data from low altitudenuclear explosions listed in S. Glasstonc, Effects ofNuclear Weapons, 1968), connecting the yield, Y, in kt foreach explosion and the obsened period, P, at the observedmaximum amplitude of the arriving acoustic signal:
log(Y) = 3.34*109(P) - 2.58 . : Y <= 100 kt (3)
log(Y) = 4.14*log(P) - 3.61 : y > 40 ::t (4)
In the Air Force analysis of the meteor-fireball data, anequation similar to (3). was used for the analysis forevents < 40 kt and (4) was used for events exceeding 40 kt.The yield is these equations is the source energy release,E divided by 2, corresponding to the large fraction ofr~;iation emitted during a low altitude nuclear explosionevent. This is justified since the original microbarographdata recordings used in the empirical least squares curvefit all originated from low altitude nuclear explosionevents.
Motivated by the Air Force meteoroid airwave data,ReVelle and Delinger (1981) have also interconnected theLamb wave approach and the period at maximum amplitudeapproach and derived an expression for the Lamb wave periodas a function of the period at maxixntmamplitude of thearriving explosive source wa-~eform.
D. Wa~eguide Normal Mode Analysis
Again, Posey and Pierce (1971) and Pierce and Kinney and(1976) and other earlier co-~orkers have developed waveguidemodal analyses that allow an estimation of the normal modesthat are excited by a point source explosion in theatmosphere. Such a scheme was used by Shoemaker (personalcommunication with the author, 1971) to estimate the energyrelease of the Revelstoke meteorite (Bayer and Jordan,1967). Such analyses are typically of greatest utility farfrom the source region in contrast to the ray approacheswhich are more applicable at relatively close range. Asdiscussed in ReVelle (19S0), Golitsyn and Korobeinikov,Chuskin and Shurshalov have considered the theoreticalmodeling of bolides from the line source viewpoint and inthe latter case with the addition of a terminal point sourcelike explosion at the end of the visible trajectory. In thelatter case the emphasis was on the modeling of the Tunguskafireball of 1908.
For completeness sake, we should also note that numerousrecordings have also been made of air-coupled Rayleigh waves
from large bolidc+s1980b) . Such waves
at sufficiently low altitudes (ReVelle,are traveling in the Earth at the speed
of sound in air and are readily-detected by conventionalseismic sensors.
E. NEO Influx Rate Estimation
Using the percentage area coverage of the earthinformation in Table VIII. and the 10 events listed inTables III., all provided by the U.S. Air Force, ReVelle(1980) was able to predict the influx rate of NEO’Sas a function of source energy and the cumulative massinflux per year over the earth, assuming that these signalsemanated from low altitude near-point source type explosions
We have recently refined two of the E values in TablesIII. and IV. and have again determined t~e influx rate ofNEO’S in the form (cumulative number of bodies with sourceenergy 2 Es per year over the entire earth, with Es in kt):
-1.06 -N(Es) = 12.3*Es .8 r2= 0.965 (5a)
or in the cumulative flux fore, with Es in kt:
-26 -1.06 2N(E~)= 7.61*1O * Es ; Number/(cm see) (5b)
This result was obtained by computing the highestcorrelation, least squares curve-fit of the Es versus thecumulative number of events per year on earth whose sourceenergies equalled or exceeded each of the individual eventsource energies. We have excluded the 1100 kt event duringthe cume fitting process since we found that it allowed amaximized cross-correlation coefficient to be determined forthe data being analyzed. The resulting equation was notgreatly different from the result determined using all ofthe 10 events, but the correlation was somewhat higherwithout including the largest event detected. Clearly a morerefined analysis should now be determined using all thepossible techniques discussed ‘inthis article along with amore refined discussion of possible errors.
Thus, by multiplying the cumulative number of events foreach bolide by the inverse probability of detection of eachevent in the appropriate season from Table VIII. (thecorresponding percentage coverage of the earth~s surface atthe deduced yield or E /2) and by di~’idingby the total time
Ethat the Air Force gla al network was in operation, i.e.,13.67 years, we were able to obtain the number of eventsexpected at a specified Es in kt per year of observing overthe entire earth. Also by multiplying each individual yieldby these same factors, we were able to determine the totalamount of bolide energy released per year over the entire
earth to be about 102.9 kt. This can be reduced to acumulative mass value by assuming a mean entr} velocity ofabout 17 km/see (for the deeply penetrating part of theNEO’S, i.e. the non-cometary part of the flux) to a value ofabout 3*1O(6) kg/year over the mass range from about 10(3)to 10(8) kg. Wetherill and ReVelle (1978a; 1978b) hadearlier determined a preliminary value with this same datato be about 10(6) kg/year at V.- 20 km/~ec. The analysis ofthese data reveal that we should expect at least one 10 kt,deeply penetrating event to occur every year, on theaverage, over the entire earth. In addition, using 10 HT asthe equivalent energy release of the Tunguska event (1908),we can estimate using (5a) that events of this energy canreoccur once on a timescale of about every 1464 yaarc overthe earth.
ReVelle (1980) has studied the possible error limits ofthe above result using differing source altitudes above theground and of the yield-source energy relationship and hasconcluded that equation (5a) is as reliable as can bededuced given ‘-heobsenable data and its associated errorbar uncertainties. Allowing for these various uncertaintiesin analyzing the data we can conclude that the correspondinguncertainty in the mass influx is about a factor of 2 largeror smaller than the value given above over the stated massrange. Another factor not considered previously is that ifwe include the other infrasonic detections during the periodfrom 1960 to the middle of the 1970’s besides just the AirForce data, the influx rate will become even higher (forexample, the Kincardine event in 1966 which most likelydropped meteorites into Lake Huron was clearly a Veiy largeand significant event during the above time period whichwasn’t detected by the Air Force by was by NOAA in Boulder).
The associated yield was determined using the semi-empirical method connecting the period at maximum amplitudeof the arriving signals given above for each of the ten U.S.Air Force events (a self-consistent global scale data set)and using other independently derived yields. For example,in the case of the Revelstoke Meteorite, both atmosphericand seismic signals were reliably recorded (Bayer andJordan, 1967) as noted earlier. An equation similar to (5a)was developed earlier by E.M. Shoemaker (personalcommunication, 1971) using a similar data set, but with adifferent yield-period scaling law. As a result a greatoverestimation (by ahol!tiu times) of the NEO influx waspredicted by Shoemaker and colleagues in the late 1960’s,just prior to the first U.S. manned landing on the Moon(Shoemaker and Lowery, 1967).
These results can be compared with those obtained morerecently by Rabinowitz 1991), by Ceplecha (1992; 1994b) andby Chapman and Morrison (1994). Our data are in reasonableagreement with the values deduced by Rabinowitz and co-workers using the Spacewatch Telescope. For example, ourleast-squares result given in “(5a)above, predict that aboutone If)kt event will occur over the Earth in a year’s time.
11
This is also in very g~od agreement with values of theinflux determined using the DOD global satellite monitoringsystem (personal communication with R.E. S&alding, 1995).Ceplecha (1992} has combined several widely differing meteorand fireball detection techniques in order to detemine thecumulative influx rate. His cumulative mass/year over theentire earth is about 1.7*1O(8) kg (over the entire rangefrom the micrometeoroids to the ten’s of meters size rangedetected by satellite observing systems). This is also inreasonable agreement with our deduced value above (about 56times higher), if we consider that we have probably notcompletely sampled all the types of compositional materialsarriving as noted earlier and have also only sampled over asubset of the above size range.
Ceplecha (personal communication, 1995) has alsorecently refined the global mass influx on the basis of anew analysis of the Lost City meteorite (a bronzitechondrite) and its luminous efficiency in the presence ofrotation. In the ❑ass range which is relevant to the AirForce infrasound data set, this revision results in apredicted global mass influx which is smaller by about afactor of two compared to the earlier predictions. Also, inCeplecha (1994), it was confirmed that for bodies largerthan about 10 meters across the most probable arrj,vingcomposition is of the Group IIIA/IIIB type (regular and weakcometary bodies). Such bodies are known in numerous studiesnot to penetrate the atmosphere very effectively and as suchare far less likely to have been detected by the infrasonicglobal arrays.
Also, Chapman and Morrison (1994) adopted Shoemaker’scumulative flux curve which is based in part on cratercounting statistics for the Earth and the moon and in parton the infrasonic data as well. Quite good agreement isfound despite the fact.that the acoustic-gravity waveestimate is likely to be deficient because of under samplingof the cometary part of the flux whose atmospheric endheight typically is much larger than that corresponding toeither chondritic materials of reasonable strength or ofNickel-Iron materials (ReVelle, 1979; ReVelle, 1980a;ReVelle, 1980b; ReVelle, 1985; ReVelle, 1993).
IV. Summary and Conclusions
A. Airw,ves from Large Bolides
During the period from the early 1960’s to the early1980’s a large body of acoustic-gravity wave signatures fromlarge bodies entering through the atmosphere have beenobtained by a number of research groups. The largest self-consistent dataset by far was taken by the U.S. Air Forcefrom a global scale network operating for about 14 years,From this data we have been able to deduce the global influxrate of NEO’S with the limitation that higher altitude
cometary sources have probably not been detected by any ofthese networks. Despite this limitation, the influx ratedetermined by this method is in reasonable agreement withresults obtained more recently by Rabinowitz (1992), byCeplecha (1992; 1994b) and by Chapman and Morrison (1994).
B. Future Systems
In the near future the C.T.B.T. global scale effort formonitoring of explosive events will allow a great increasein the number of bolide events that can be observedannually. Since 60 to 75, 4 element arrays of broadbandinfrasound stations have been proposed as part of theInternational Monitoring System, the prospect for retrievinga revised estimate for the global influx rate of NEO’S, atleast of the deep penetrating part of the influx, i.e.,chondrites and nickel-iron type materials, could be greatlyincreased.
V. Acknowledgements
This work was supported in part by the Department afEnergy, Office of Nonproliferation and National Security.
VI. References
Bayer, K. C. and J. N. Jordan, J. Acoust. Sot. Amer.,Seismic and Acoustic Waves from a Meteor (Abstract), 41,1580, 1967.
Bedard, A.J. and G.E. Greene, G, Case Study Using Arrays ofInfrasonic Microphones To Detect and Locate Meteors andMeteorites, J. Acoust. Sot. Amer., 69, 1277-127g, 1981.
Baker, H.M., Personal Communication, 1979.
Ceplecha, Z., Influx of Interplanetary Bodies onto Earth,Astron. Astrophys., 263, 361-366, 1992.
Ceplecha, Z., Earth-grazing daylight fireball of August 10,1972, Astron. Astrophys., 283, 287-2S8, 1994a.
Ceplecha, Z., Impacts of Meteoroids Lai-gerthan 1 m into theEarth’s Atmosphere, Astron. Astrophys., 286, 967-970, 1994b.
Ceplecha, Z., Personal Communication, 1995.
Chapman, C.R. and D. Morrison, Impacts on the Earth byAsteroids and Comets: Assessing the Hazard, Nature, 36”7,33-40, 1994.
Crawford, D.A., M.B. Boslough, T.G. Trucano and A.C.Robinson, The Impact of Comet Shoemaker-Levy 9 with Jupiter,Shock Waves, 4, 47-50, 1994. .
Georges, T.M. and J.M. Young, Passive Sensing of NaturalAcoustic-Gravity Waves at the Earth’s Surface, in RemoteSensing of the Troposphere, V.E. Derr, Ed., U.S. GovernmentPrinting Office, 21-1-21-23, 1972.
Gor{ion,E., C.D. Bartky and J.W. Wager, Dynamics of a LargeMeteor, AII.APaper 75-14, AIAA 13th Aerospace Sci. Meet.,Pasadena, Ca., January 20-22, 1-6, 1975.
Kraemer, D.R. and F.L. Bartman, Infrasound from AccuratelyMeasured Meteor Trails, Proceed. Intern. sympos. AcousticRemote Sensing of the Atmos. and the Oceans, The Univ. ofCalgary Press, Calgary, Alberta, Canada, V.-31 to V.-49,1981.
Leies, G., Pe~sonal Communication, 1978.
Li, F., C.El.Bartky, R.W. Wager and E. Gordon, Determinationof the Size of a Large Meteor, AIU Paper 75-200, AIAA 13thAerospace Sc. Meet., Pasadena, Ca., Jan. 20-22, 1-4, 1975.
Liska, L., Studies of the Stratospheric and Mesospheric WindSystem aridTemperature Distribution from Observations ofInfrasonic Waves Generated during Regular Concorie Flights,Proceed. Intern. Sympos. Acoustic Remote Sens. Atmos. andthe Oceans, The Univ. of Calgary Press, Calgary, Alberta,Canada, V.-16 to V.-3O, 1981.
McIntosh, B.A., M.D. Watson and D. O. ReVelle, Infrasoundfrom a Radar-Observed Meteor, Can. J. Physics, 54, 655-662,1976.
Mutschlecner, J.P. and R.W. Whitaker, The Correction ofInfrasound Signals for Upper Atmospheric Winds, FourthInternational Symposium on Long-Range Sound Propagation,NASA Conf. Publication 3101, Compiled by W.L. Wilshire, NASALangley Research Center, Hampton, Vs., 143-153, 1990.
Pierce, A.D. and W. A. Kinney, Computational Techniques forthe Study of Infrasound Propagation in the Atmosphere, AFGLReport TR-76-0056, 186 pp., 1976.
Posey, J.W. and A.D. Pierce, Estimation of Nuclear ExplosionEnergies from Microbarogr&ph Records, ~~ture, 232, 253,1971.
Rabinowitz, D.L., The Flux of Small Asteroids Near theEarth, in Asteroids, Comets, Meteors, 1991, Flagstaff,Arizona, Lunar and Planet. Inst., 481-485, 1992.
Rawcliffe, R.D., C.D. Bartky, F. Li, E. Gordon and D. Carta,Meteor of August 10, 1972, Nature, 247, 449-450, 1974.
Rawcliffe, R.W., Satellite Observations of Meteors(Abstract), Astrophys. J., 228, 338, 1979.
ReVelle, D. O., Studies of Sounds from Meteors, Sky andTelescope, 49, No. 2, 87-91, 1975.
ReVelle, D. O., J. Geophys. Res., On Meteor-GeneratedInfrasound, 81, 1217-1237, 1976.
ReVelle, D.O., A Quasi-Simple Ablation Model for LargeMeteorite Entry: Theory Versus Observations, J. Atmos. Terr.Phys., 41, 453-473, 1979.
ReVelle, D.O., A Predictive Macroscopic Integral RadiationEfficiency Model, J. Geophys. Res., 85, 1803-1808, 1980a.
ReVelle, D.O., Interaction of Large Bodies with the Earth’sAtmosphere, in Solid Particles in the Solar System, Intern.Astron. Sympos. No. 90, Eds. I. Halliday and B.A. McIntosh,185-198, 1980b.
ReVelle, D.O., Theoretical Fireball End Heights, in Handbookfor MAP, vol. 25, First GLOBMET Symposium (Dushanbe,U.S.S.R.), Ed. R.G. Roper, SCOSTEP Secretariat, Urbana,Illinois, 255-257, 1987.
ReVelle, D. O., The Meteoroid-Atmosphere InteractionSpectrum, Eds. J. Stohl and I.P. Williams, in Meteoroids andTheir Parent Bodies, Internat.,Astron. Sympos,, Bratislava,Slovakia, 343-346, 1993.
ReVelle, D. O. and Z. Ceplecha, Analysis af Identified IronMeteoroids: Possible Relation with M-type Earth-crossingAsteroids?, Astron. Astrophys., 292, 330-336, 1994.
ReVelle, D.O. end W.G, Delinger, Passive Acoustic RemoteSensing of Infrasound of Natural Origin, Proceed. Internat.SympoG. Acoustic Remote Sens. of the Atmosphere and Oceans,Univ. of Calgary Press, Calgary, Alberta, Canada, V.-6 to V-15., 1981.
ReVelle, D.O. and G.W, Wetherill, Terrestrial Microbarograph“AirWave” Recordings: The Global Influx Rate of LargeMeteoroids, Department of Terrestrial Magnetism, CarnegieInstitution of Washington Yearbook, 490-492, 1976a,
ReVelle, D.O. and G.W. Wetherill, Influx of Large BodiesUsing Terrestrial Airwave Data (Abstract), J. MeteoriticalSot., 13, 611, 1978b.
ReVelle, D.O. and G.W. Wetherill, Atmospheric Waves FromLarge Meteors (Abstract), J. Acoust. Sot. Amer. Suppl. 1 ,68, S4, 1980.
Shoemaker, E.M., Personal Communication, 1971.
Shoemaker, E.M., and C. J. Lowery, Airwaves from LargeMeteoroids (Abstract), J. Meteorit. Sot., 3, 123, 1967.
Spalding, R., E. Taglieferri and D.O. ReVelle, PreliminaryAnalysis of the February 1, 1994, Marshall Islands Fireball(abstract), 106th Meeting of Astron. Sot. Pacific, PreprintVolume, Ed. T. Bowell, “Completing the Inventory of theSolar System” (50th Anniversary of the Founding of theLowell Observatory), Flagstaff, Arizona, June, 1994.
Spalding, R.E., Personal Communication, 1995.
Whitaker, R.W., J.P. Mutschlecner, M. Davidson and S.D.Noel, Infrasonic Obsenations of Large-scale HE Events,Fourth International Symposium on Long-Range SoundPropagation, NASA Conf. Public. 3101, Complied by W.L.Willshire, NASA Langley Res. Center, Hampton, Vs., 133-141,1990.
Whitaker, R.W., S.D. Noel and W.R. Meadows, InfrasonicObservations and Modeling of the Minor Uncle High ExplosiveEvent, Sixth International Symposium on Long-Range SoundPropagation, National Research Council Canada, Compiled byD.I. Havelock and M.R. Stinson, Ottawa, Ontario, Canada,480-497, 1994.
R. W. Whitaker, Personal Communication, 1994.
Whipple, F-L., Personal Communication, 1975.
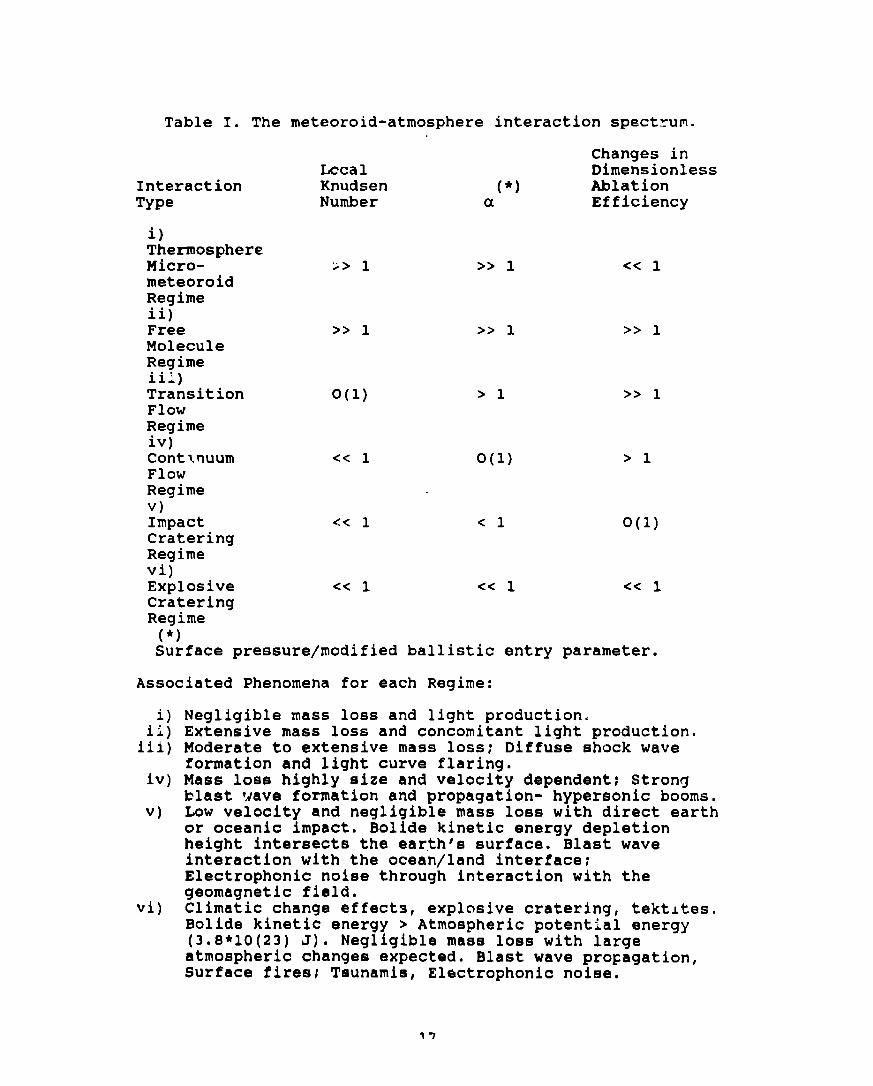
Table I. The meteoroid-atmosphere interaction spect~um.
Changes inLccal Dimensionless
Interaction Knudsen (*) AblationType Number a Efficiency
i)ThermosphereMicro- >> 1 >> 1 << 1meteoroidRegimeii)Free >> 1 >> 1 >> 1MoleculeRegimeiii)Transition o(1) >1 >> 1FlowRegimeiv)ContinuumFlowRegimev)ImpactCrateringRegimevi)Explosive << 1 << 1 << 1CrateringRegime
<< 1 o(1)
<< 1 <1
>1
o(1)
(*)
Surface pressure/modified ballistic entry parameter.
Associated Phenomena for each Regime:
i)ii)iii)
iv)
v)
vi)
Negligible mass loss and light production.Extensive mass loss and concomitant light production.Moderate to extensive mass loss; Diffuse shock waveformation and light curve flaring.Mass loss highly size and velocity dependent; Strongblast ~~aveformation and propagation- hypersonic booms.Low velocity and negligible mass loss with direct earthor oceanic impact. Bolide kinetic energy depletionheight intersects the earth’s surface. Blast waveinteraction with the ocean/land interface;Electrophonic noise through interaction with thegeomagnetic field.Climatic change effects, explosive cratering, tektites.Bolide kinetic energy > Atmospheric potential energy(3.8*1O(23) J). Negligible mass loss with largeatmospheric changes expected. Blast wave propagation,Surface fires; Tsunamis, Electrophonic noise.
17
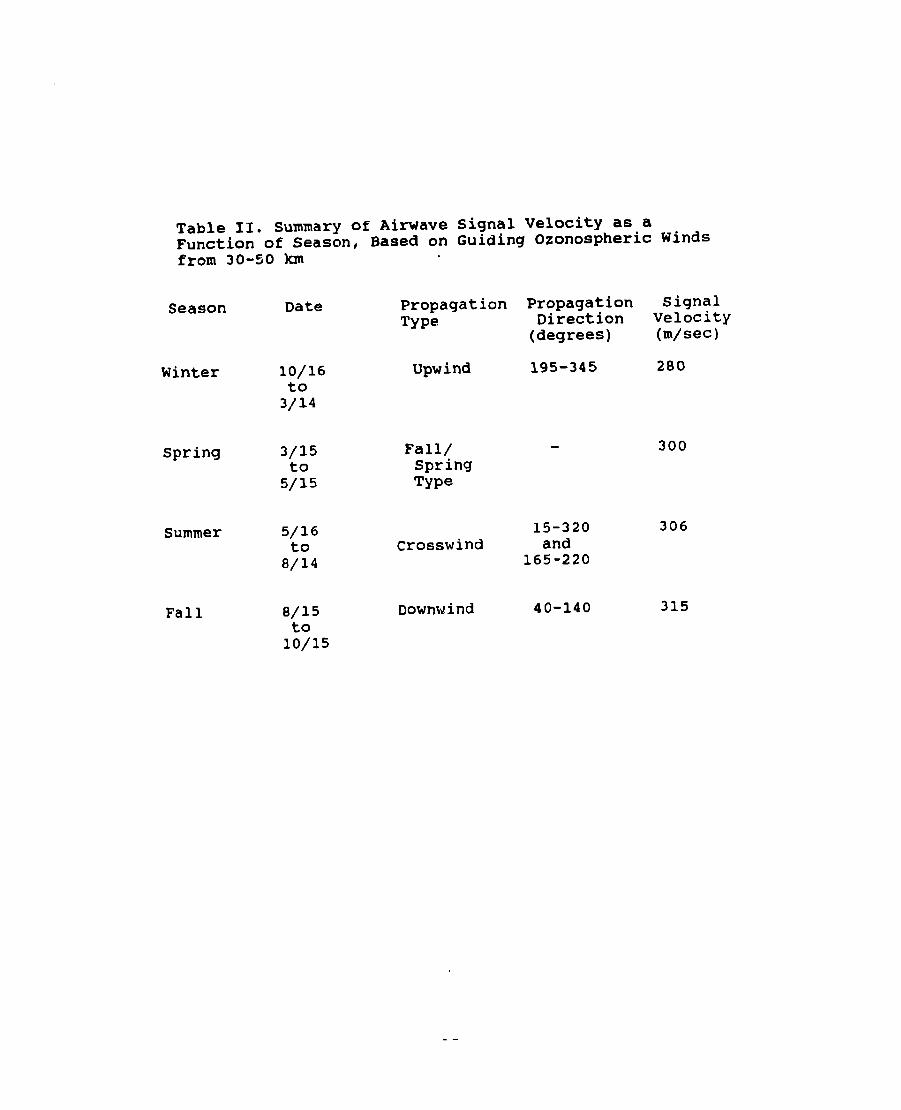
Table II. Summary of Airwave Signal Velocity as aFunction of Season, Based on Guiding Ozonospheric Windsfrom 30-50 km
Season Date Propagation Propagation SignalTyPe Direction Velocity
(degrees) (m/see)
Winter 10/16to3/14
Spring 3/15to5/15
Summer
Fall
5/16to8/14
8/15
Upwind 195-345
Fall/SpringType
15-320crosswind and
165-220
Downwind 40-140
280
300
306
315to
10/15
.-
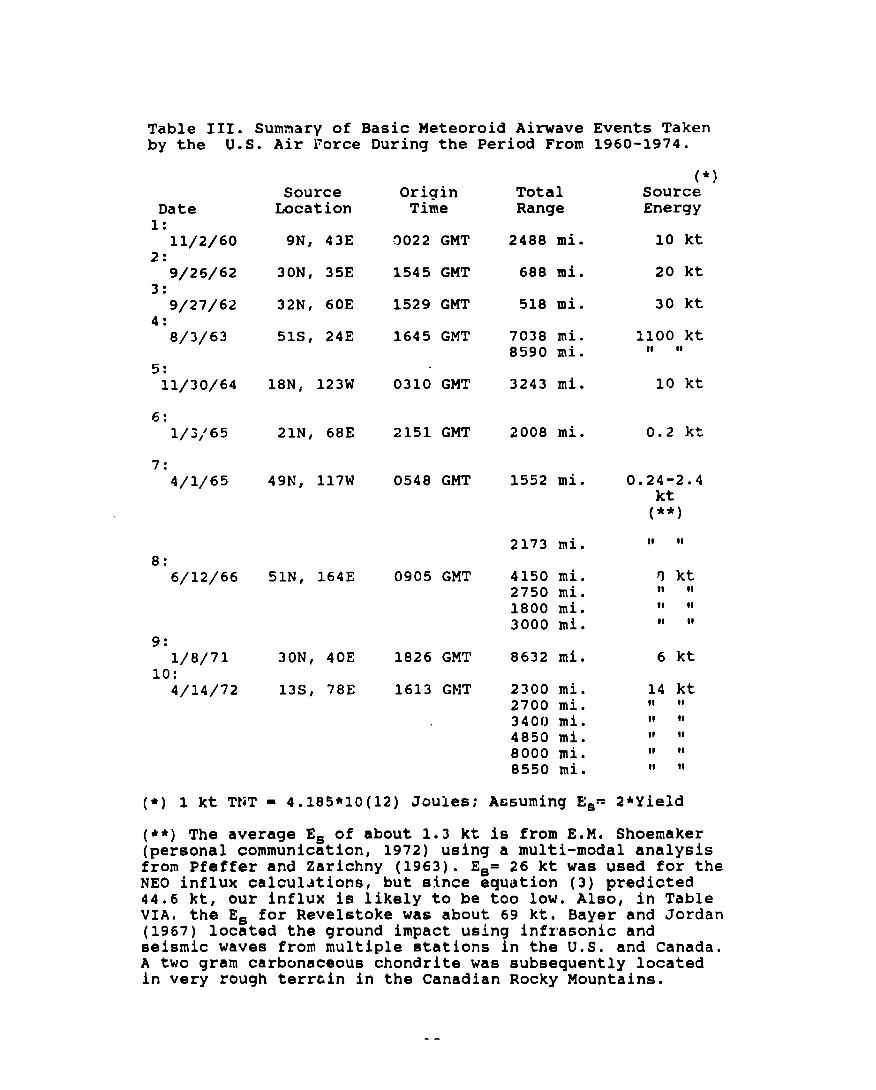
Table III. Summary of Basic Meteoroid Airwave Events Takenby the U.S. Air~orce - “ “- – “ ‘– ‘--- ----During the Perloa Fronl1960-19-14.
Date1:11/2/60
2:9/26/62
3:9/27/62
4:8/3/63
5:11/30/64
7:4/1/65
8:6/12/66
9:1/8/71
10:4/14/72
SourceLocation
9N, 43E
30N, 35E
32N, 60E
51S, 24E
18N, 123W
21N, 68E
49N, 117W
51N, 164E
30N, 40E
13S, 78E
OriqinTime
9022 GMT
1545 GMT
1529 GMT
1645 GMT
0310 GMT
2151 GMT
0548 GMT
0905 GMT
1826 GMT
1613 GMT
(*) 1 kt TNT = 4.185*1O(12) Joules;
TotalRange
2488 mi.
688 lui.
518 mi.
7038 mi.8590 mi.
3243 mi.
2008 mi.
1552 mi.
2173 mi.
4150 mi.2750 mi.1800 mi.3000 mi.
8632 mi.
2300 mi.2700 mi.3400 mi.4850 mi.8000 mi.8550 mi.
Assuming E*=
(*)
SourceEnergy
10 kt
20 kt
30 kt
1100 ktII II
10 kt
0.2 kt
0.24-2.4
(::)
II II
f) ktII II!1 IItl II
6 kt
14 ktII ttII IIII II
II II
M II
2*y~el~
Shoemaker(**) The average Es of about 1.3 kt is from E.M.(personal communication, 1972) using a multi-modal analysisfrom Pfeffer and Zarichny (1963). Es= 26 kt was used for theNEO influx calcul~tions, but since equation (3) predicted44.6 kt, our influx is likely to be too low. Also, in TableVIA. the Es for Revelstoke was about 69 kt. Bayer and Jordan(1967) located the ground impact using infrasonic andseismic waves from multiple stations in the U.S. and Canada.A two gram carbonaceous chondrite was subsequently locatedin very rough terr~in in the Canadian Rocky Mountains.
.-
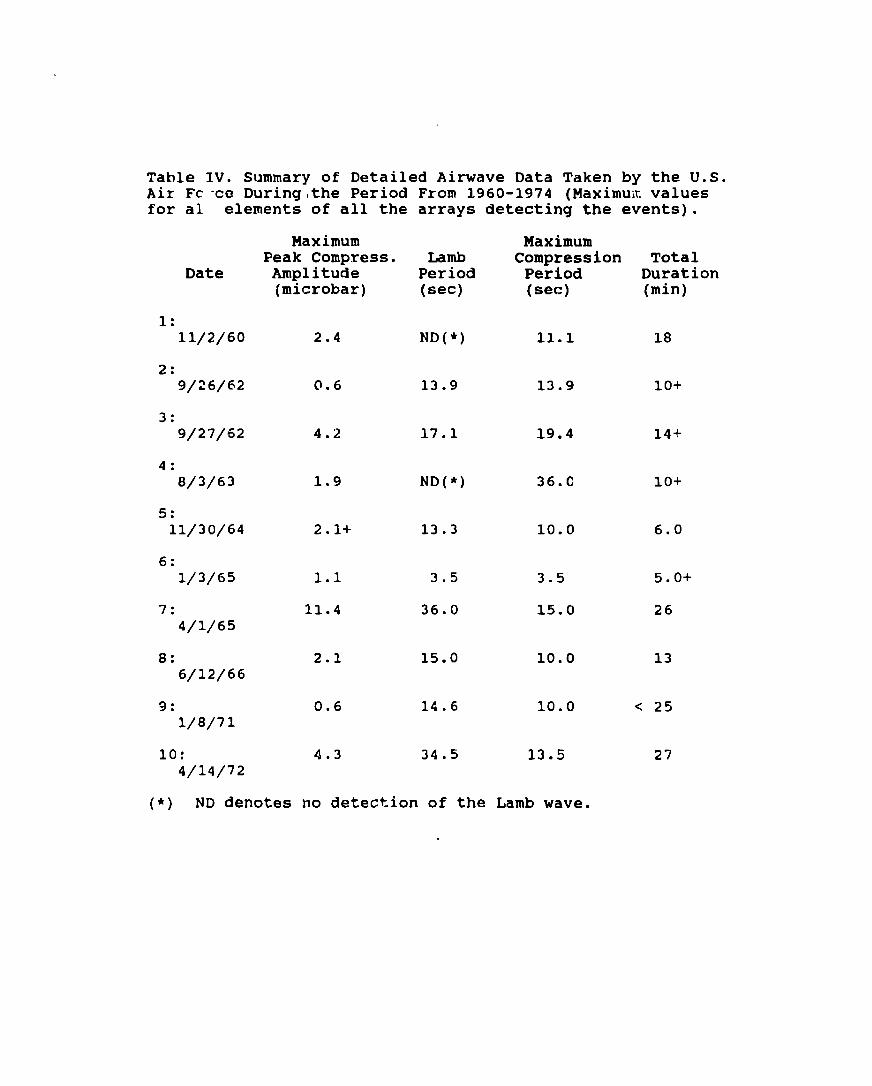
Table IV. Summary of Detailed Airwave Data Taken by the U.S.Air Fc ‘cc During ithe Period From 1960-1974 (Maximuirvaluesfor al elements of all the arrays detecting the events).
Maximum MaximumPeak Compress. Lamb Compression Total
Date Amplitude Period Period[microbar) (see) (see)
1:11/2/60 2.4 ND(*) 11.1
2:9/26/62 @.6 13.9 13.9
3:9/27/62 4.2 17.1 19.4
4:8/3/63 1.9 ND(*) 36.C
5:11/30/64 2.1+ 13.3 10.0
6:1/3/65 1.1 3.5 3.5
7: 11.4 36.0 15.04/1/65
8: 2.1 15.0 10.06/12/66
3: 0.6 14.6 10.01/8/71
10: 4.3 34.5 13.54/14/72
(*) ND denotes no detection of the Lamb wave.
Duration(rein)
18
10+
14+
10+
6.0
5.0+
26
13
< 25
27
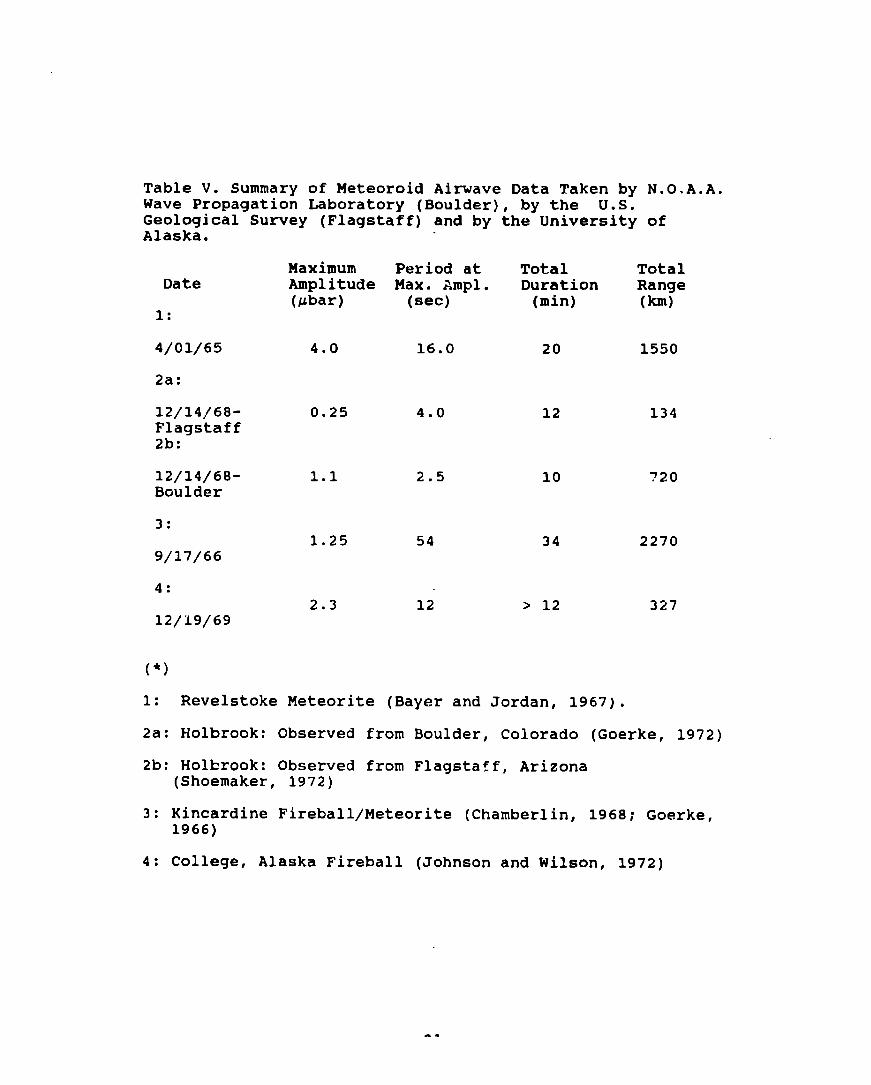
Table V. Summary of Meteoroid Airwave Data Taken by N.O.A.A.Wave Propagation Laboratory (Boulder), by the U.S.Geological Survey (Flagstaff) and by the University ofAlaska.
Maximum Period atDate Amplitude Max. Ampl.
(Ubar) (see)1:
4/01/65 4.0 16.0
2a:
12/14/68- 0.25 4.0Flagstaff2b:
12/14/68- 1.1 2.5Boulder
3:
9/17/66
4:
12/19/69
(*)
1.25
2.3
54
12
Total TotalDuration Range(rain) (km)
20 1550
12 134
10 720
34
> 12
2270
327
1: Revelstoke Meteorite (Bayer and Jordan, 1967).
2a: Holbrook: Observed from Boulder, Colorado (Goerke, 1972)
2b: Holbrook: Observed from Flagstaff, Arizona(Shoemaker, 1972)
3: Kincardine Fireball/Meteorite (Chamberlain,1968; Goerke,1966)
4: College, Alaska Fireball (Johnson and Wilson, 1972)
-.
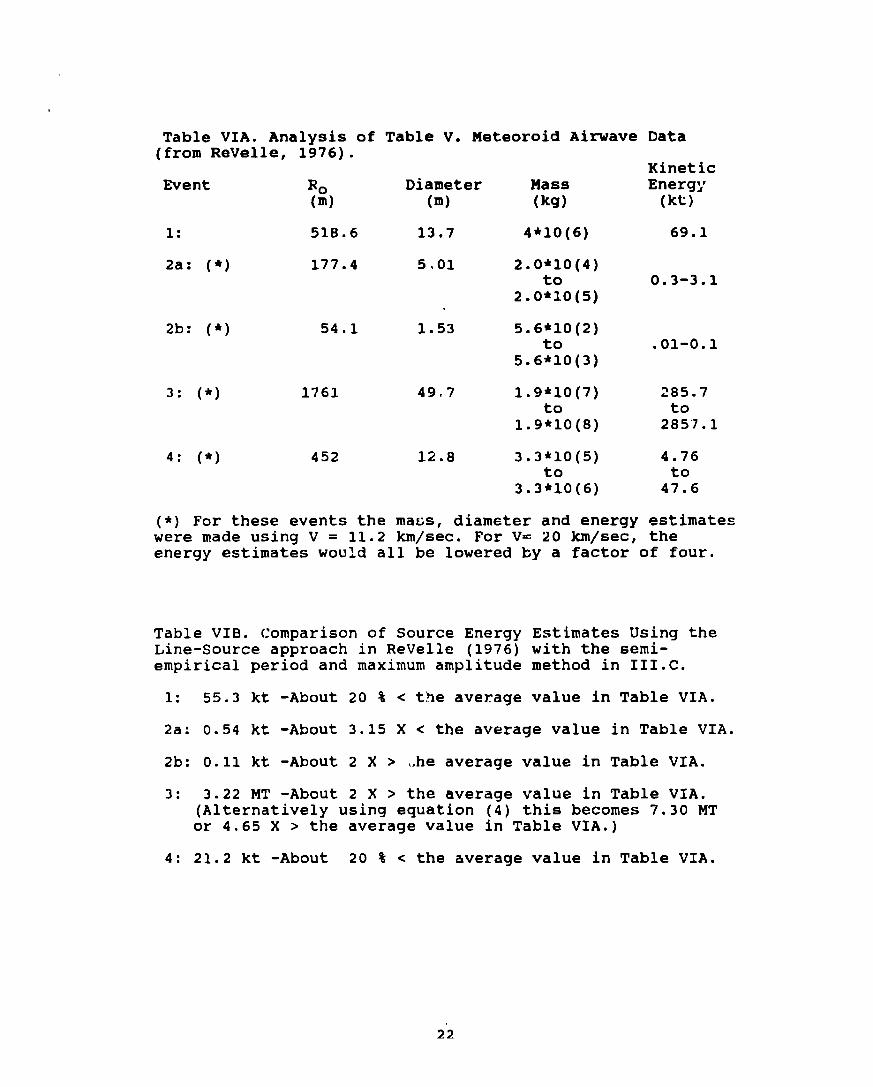
Table VIA. Analysis of Table V. Meteoroid Airwave Data(from ReVelle, 1976).
KineticEvent R. Diameter Mass Energy
(m) (m) (kg) (kt)
1: 518.6 1307 4*1O(6) 69.1
aa: (*) 177.4 5.01 2.O*1O(4)to 0.3-3.1
2.0*~0(5)
ab: (*) 54.1 1.53 5.6*1(3(2)to .O1-O.1
5.6*10(3)
3: (*) 1761 49.7 109*10(7) 285.7to to
1.9*1O(8) 285’7.1
4: (*) 452 12.8 3.3*1(3(5) 4.76to to
3.3*10(6) 47.6
(*) For these events the maus, diameter and energy estimateswere made using V = 11.2 km/see. For V= 20 km/see, theenergy estimates would all be lowered by a factor of four.
Table VIB. Comparison of Source Energy Estimates Using theLine-Source approach in ReVelle (1976) with the semi-empirical period and maximum amplitude method in 111.C.
1: 55.3 kt -About 20 % < the average value in Table VIA.
2a: 0.54 kt -About 3.15 X < the average value in Table VIA.
2b: 0.11 kt -About 2 X > ,.heaverage value in Table VIA.
3: 3.22 MT -About 2 X > the average value in Table VIA.(Alternatively using equation (4) this becomes 7.30 MTor 4.65 X > the average value in Table VIA.)
4: 21.2 kt -About 20 % < the average value in Table VIA.
22

Table VII. Other Higher Frequency Aimave Meteor Data:
Event
1:
2:
PeriodMaximum at Max. TotalAmplitude Amplitude Range Yield(*)(#bar) (see) (km) (kt)
9 1 250 2.63e-3l.le10 J
6.6 0.5-1 240 1.Ole-34.23e9 J
3: 1.4-2.3 0.21-.22 130 1.55e-56.51e7 J
1: Bedard and Greene, 1981. An independent estimate of thesource yield was not available”,but the event was certainlyquite energetic since visual magnitudes from -5 to brighterthan the full moon were estimated by ground and airplaneobservers on April 22, 1975. This event was detected by twoarrays, 40 km apart (at Boulder and Fraser, Colorado). Onearray received signals from both the ozonospheric and thelower ionospheric sound channels while the other array onlydetected the ozonospheric return.
2: McIntosh, Watson and ReVelle, 1976. On December 14, 1974the same Geminid meteor was also detected by a patrol radarat the Springhill Meteor Observatory with Vinf= 35 km/see.The above infrasonic source energy (using equation (3) withEs= 2*Yield) is 3.56 times greater at a period of 0.5 Hzthan that computed by McIntosh et. al. for this event.
3: Kraemer and Bartman, 1981. In this case the infrasonicestimate of the doubled source yield is about 3.0 timesgreater than that deduced for the 320 gram (photometricmass) carbonaceous ~hondrite (Ceplecha and McCrosky fireballGroup II.) traveling at a measured initial velocity of 16.5km/see. Due to the unusual geometry of this event relativeto the ground, the initial signals recorded on Mi--.y 24, 1975were from the upper part of the meteor trail.
(*) Based on the period at maximum ampli+,uderelation givenin III. C. in equation (3).
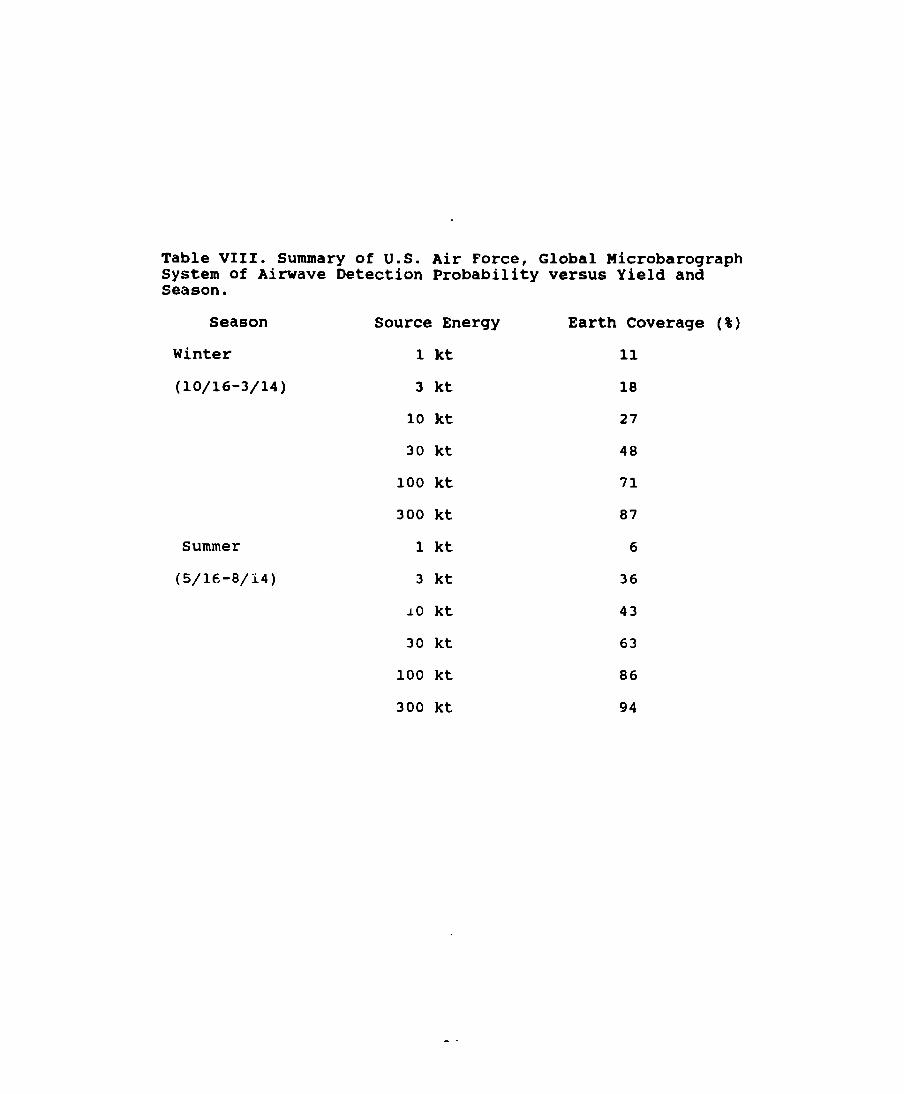
Table VIII. Summary of U.S. Air Force, Global MicrobarographSystem of Airwave Detection Probability versus Yield andSeason.
Season Source Energy Earth Coverage (%)
Winter 1 kt 11
(10/16-3/14) 3 kt 18
10 kt 27
30 kt 48
100 kt 71
300 kt 87
Summer
(5/16-8/i4)
1 kt 6
3 kt 36
10 kt 43
30 kt 63
100 kt 86
300 kt 94
-.