j. j. cosn j. 6. dslens
TRANSCRIPT

J. J. Cosn J. 6. Dslens


ORNL/TM- 10 99 7 Dist. Categories UC-505,
-522, -523
Contract No. DE-AC05-840R21400
Engineering Technology Division
USER INSTRUCTIONS FOR LEVELIZED POWER GENERATION COST CODES USING AN IBH-TYPE PC
J. J. Coen J. G. Delene
Date Published - January 1989
This document contains information of a preliminary nature. It is subject to revision or correction and therefore does not represent a final report.
Prepared by the OAK RIDGE NATIONAL LABORATORY
Oak Ridge, Tennessee 37831 operated by
MARTIN MARIETTA ENERGY SYSTEMS, INC. f o r the
DEPARTMENT OF ENERGY
3 4 4 5 6 0289347 7


iii
CONTENTS
Page
LIST OF TABLES .................................................. V
LIST OF FIGURES ................................................. vii
ABSTRACT ........................................................ 1
1. INTRODUCTION ................................................ 1
2. INDIVIDUAL POWER GENERATION COST CODES ...................... 4
3. INTEGRATED COST CODE ........................................ 22
4. EXAMPLE CALCULATIONS ........................................ 31
4.1 1100 HWe Nuclear (PWR) Power Plant Using Integrated Cost Code .............................................. 31
4.2 550 W e Coal-Fired Power Plant Using Individual Codes With MAINPWR ........................................... 37
4.3 1100 W e Nuclear (PUR) Power Plant Using Individual .................................. Codes Without MAINPWR 4 3


v
LIST OF TABLES
Table Page
2.1 List of Program Files ................................... 4
2.2 List of Data Files ...................................... 5
2.3 List of Output Files .................................... 7
2.4 Recovery Percentages .................................... 16


vii
LIST OF FIGURES
Figure
2.1
2.2
2.3
2.4
2.5
2.6
2.7
2.8
2.9
2.10
2.11
2.12
3.1
3.2
3 . 3
3.4
3.5
3.6
3.7
3.8
4.1
4.2
4 . 3
Power plant capital investment cost menu (PLANTCAP) .... 8
Nuclear power plant O&M cost menu (NUCLOM) ............. 9
Coal-fired power plant OLM cost menu (COALOM) .......... 10
Main menu for nuclear fuel costs (NFUEL) ............... 11
Nuclear fuel price data menu ........................... 12
Nuclear fuel leadllag time menu ........................ 12
Nuclear fuel process loss menu ......................... 13
Levelized coal cost menu (COALCOST) .................... 14
Fixed charge rate menu (FCRATE) ........................ 15
Nuclear power plant power generation cost menu
Coal-fired power plant power generation cost menu (LEVEL) ................................................ 18 (LEVEL) ................................................ 17
Capitalized investment cost menu (CAPITAL) ............. 19
Main menu for integrated program (MAINPWR) ............. 23
Menu for levelization routine in integrated program ................................................ 25
Menu €or capital investment cost routine in integrated program ..................................... 26
Menu for fixed charge rate routine in integrated program ................................................ 27
Menu for nuclear OdM cost routine in integrated program ................................................ 28
Menu for coal-fired ObM c o s t routine in integrated program ................................................. 29
Menu for nuclear fuel cost routine in integrated program ................................................ 2 9
Menu for coal cost routine i n integrated program ....... 30
General input parameters for reference PWR/BE power plant ............................................ 32
Capital investment c o s t summary for reference PWR/BE power plant ............................................ 33
Fixed charge rate summary for reference PWR/BE power plant ............................................ 3 4
viii
4.4
4.5
4.6
4.7
4.8
4.9
4.10
4.11
4.12
4.13
4.14
4.15
4.16
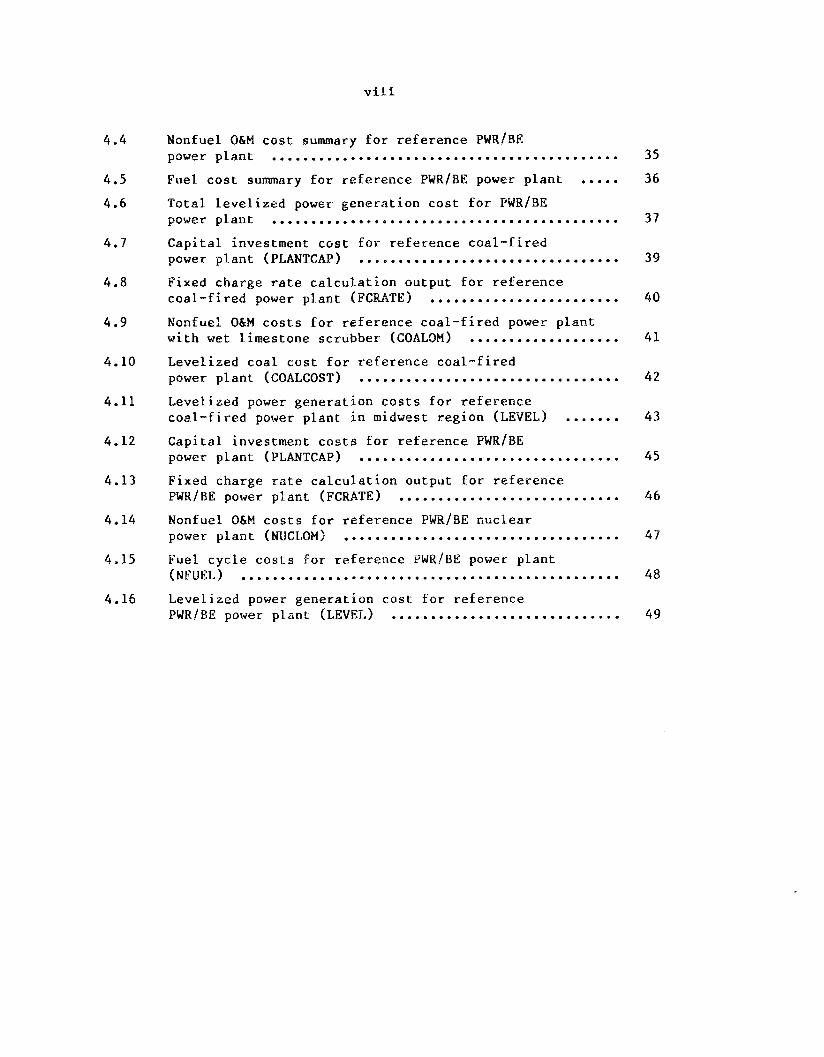
Nonfuel OCM cost summary for reference PWR/BE power plant ............................................ 35
Fuel cost summary for reference PWR/SE power plant ..... 36
Total levelized power generation cost for PWR/BE power plant ............................................ 37
Capital investment cost for reference coal-fired power plant (PIANTCAP) ................................. 39
Fixed charge rate calculation output €or reference coal-fired power plant (FCRATE) ........................ 40
Nonfuel ObM costs for reference coal-fired power plant with wet limestone scrubber (COALOM) ................... 41
Levelized coal cost for reference coal-fired power plant (COALCOST) ................................. 42
Levelized power generation costs for reference coal-fired power plant in midwest region ( L E V E L ) ....... 43
Capital investment costs for reference PWR/BE power plant (PLANTCAP) ................................. 45
Fixed charge rate calculation output for reference PWR/BE power plant (FCRATE) ............................ 46
Nonfuel OCM costs for reference PWR/BE nuclear power plant (NUCLOM) ................................... 47
Fuel cycle costs for reference PWR/BE power plant
Levelized power generation cost for reference PWRIBE power plant ( L E V E L ) ............................. 49
(NFUEL) ................................................ 48

USER INSTRUCTIONS FOR LEVELIZED POWER GENERATION COST CODES USING AN IBM-TYPE PC
J. J. Coen J. G. Delene
ABSTRACT
Programs for the calculation of levelized power genera- tion costs using an IBM o r compatible PC are described. Cost calculations for nuclear plants and coal-fired plants include capital investment cost, operation and maintenance cost, fuel cycle cost, decommissioning cost, and total levelized power generation cost.
1. INTRODUCTION
This report describes a set of microcomputer programs for estimat-
ing power generation costs for large steam-electric power plants. These
programs permit rapid evaluations using various sets of economic and
technical ground rules. The levelized power generation costs that are
calculated with these programs may be used to compare the relative
economics of nuclear and coal-fired plants based on life cyc1.e costs.
It is anticipated that these programs will be useful for making quick
analyses of power generation c o s t using alternative economic parameters,
such as interest rate, escalation rate, inflation rate, plant lead
times, capacity factor, fuel prices, etc. The two major types of elec-
tric generating plants considered are pressurized-water reactor (PWR)
and pulverized coal-fired plants. Data are also provided for the Large
Scale Prototype Breeder (LSPB) type liquid metal reactor. C o s t s f o r
plants of either one o r two units may be obtained.
The programs described in this report have their origins in several
mainframe computer programs. The capital investment cost procedures are
modeled after the CONCEPT-5 code;’ the operation and maintenance (OdM)
procedures are modeled after the OMCOST and the nuclear fuel
cycle cost procedures are based on those in the REFCO computer code.4
The levelization procedures are those described in the Nuclear Energy
Cost Data Base (NECDB).*

2
Two different types of programs are included in Lhe code package.
One diskette contains the BASIC source codes which can be loaded and run
using a BASIC interpreter. Another diskette contains compiled codes
which can be executed €rom the disk operating system (DOS). The two
diskettes produce identical results, and either can be used to perform
the necessary calculations. Unlike the compiled codes, the source codes
can be examined and understood by the user; however, the compiled codes
perform the calculations quicker than the source codes. A third
diskette is a set of run-time libraries used in conjunction with the
cornpiled codes.
The codes can be run on any IBM-Type personal computer (XT o r AT)
equipped with DOS version 2.1 o r higher. A minimum of 64K RAM is
required, along with at least one flexible disk drive. A BASIC inter-
preter (either BASICA o r GWBASIC) is required t o execute the interpreter
versions of the codes, but no interpreter o r compiler is necessary for
the compiled verions. Any IBM-compatible printer will function cor-
rectly, but if regular size paper is used ( 8 112" wide), a small portion
of the output will have to be printed using "condensed" print. Any IBM-
compatible monitor (monochrome o r color) can be used.
This report represents an update to an earlier version of these
PC-based codese6 One new code, which integrates several. of the indivi-
dual codes, has been added to the package. The current code package has
three main modes of operation. First, each individual code can be
executed by itself to determine one aspect of the total levelized power
cost, such as fuel cost o r O b M cost. Secondly, the integrated code can
be executed to calculate all aspects of the levelized power cost.
Finally, the integrated code can be used to access an individual code
which calculates one aspect of the levelized power generation cost as in
the first mode o f operation.
The codes have been revised to correspond to 1987 cast levels and
to correspond to the methodology in the 1987 Nuclear Energy Cost Data
Base (NECDB).5 Extensive revisions have been made to the code structure
and output in order to make the code package more useful and user-
friendly. As an example, the user now has the option of either sending
output to the screen, to the printer, or to be stored on a disk for

3
future use. Also, an attempt was made to improve the consistency of the
individual codes; such as all cost of money rates and escalation rates
are now entered as fractions.
Although this report is meant to be a stand-alone user guide, it
does not attempt t o describe in detail the basis of the calculations;
the interested user should consult the NECDB' or the mainframe code
reports'-4 on which the PC codes are based. Chapter 2 of this report
describes the operation of the individual cast codes. Chapter 3 con-
tains the description of the integrated code and its interaction with
the individual codes. Example problems using both the individual codes
and the integrated code are contained in Chap. 4.

4
2 . INDIVIDUAL POWER GENERATION COST CODES
A list of the individual power generation cost program files and a
brief description of each are given in Table 2.1. A similar list for
the data files accessed by the programs is given in Table 2 .2 . Each of
the codes is menu driven, and most of the entries should be self
explanatory.
Table 2-1 . List of program files
File name Description
PLANTCAP Capital investment cost for nuclear plants and coal-fired
FCRATE Fixed charge rate
COALQM Levelized QbM cost for coal-fired plants
NUCLQM Levelized 06M cost for nuclear plants
CQALCOST Levelized fuel cost for coal-fired plant
NFUEI, Levelized fuel cost for nuclear plants
LEVEL Levelized power generation cost
CAPITAL Capitalized cost from overnight cost
MASSGEN Mass balance set generation for nuclear plants
MAINPWK Driver program for PLANTCAP, FCRATE, COALOM, NUCLOM,
plants
COALCOST, NFUEL, and LEVEL
Each of the programs in Table 2.1 is supplied in two forms, a Basic
source code and a compiled code. The source codes are denoted by a
filename extension of .BAS (such a s MAINPWR.BAS); the compiled codes are
denoted by .EXE (such as MAIWPWR.EXE). Both versions are included in
the package in order to offer the user both the speed of the compiled
versions and the flexibility of the source codes.
It is assumed that the user has some experience with DQS and BASIC.
Further it is assumed that the user has an IBM-P@ or compatible micro-
computer.

5
Table 2.2. Listing of data files
Usage File name Description ~ ~ ~ ~ ~~ - - -~
Fuel cost f o r PWREXB.DAT PWR extended burnup mass balance nuclear plants data
PWRSTD.DAT PWR standard burnup mass balance data
LSPBRCY.DAT LSPB recycle mass balance data
LSPBRIB.DAT LSPB inner blanket mass balance data
LSPBRRB.DAT LSPB radial blanket mass balance data
MASFIL.DAT Data file of available mass balance sets
Capital investment PWRBE12.DAT Capital investment cost model for cost 1100 MWe (nominal) size PWR based on
better experience cost data
1100 MWe (nominal) size PWR based on median experience cost data
550 MWe (nominal) size PWR based on better experience c o s t data
1100 MWe (nominal) size improved PWR
550 MWe (nominal) size improved PWR
550 MWe (nominal) size advanced PWR
550 MWe (nominal) size pulverized coal-fired plant
PWRME12.DAT Capital investment cost model f o r
PWRBE6.DAT Capital investment cost model for
IPWR12.DAT Capital investment cost model f o r
IPWR6.DAT Capital investment cost model f o r
APWR6. DAT Capital investment cost model for
COAL5 . DAT Capital investment cost model for
O&M cost for COALWET.DAT 0&M cost model f o r coal-fired plants
COALDRY.DAT O&M cost model for coal-fired plants
COALNOS.DAT 0&M cost model f o r coal-fired plants
coal-fired plants with wet scrubbers
with dry scrubbers
without scrubbers

6
The user must also have a BASIC interpreter, such as BASICA or GW-
BASIC, in order t o use the source codes. To execute one of the source
codes, the user should load the interpreter, then load the desired pro-
gram, and enter run.
The compiled versions can be executed directly from DOS. Microsoft
run-time libraries, contained on a separate diskette supplied in the
package, are utilized to accomplish the execution. If the user is exe-
cuting the compiled versions from a hard disk where both the .EXE codes
and the run-time libraries reside, typing the name of the desired code
(with no filename extension) will begin the execution. If the user is
running the compiled versions from floppy disks, the compiled codes
should be placed in one drive and the run-time library disk in the
other. Again, typing the name of the desired code will begin the execu-
tion.
If cost model data sets (designated by .DAT in Table 2 - 2 1 are
needed t o run the program, you will first be asked: ENTER DISK CONTAIN-
ING COST MODELS (A,B, OB C)? The proper letter should be entered by the
user.
Next the main menu is shown on the screen. To change data, simply
enter the corresponding menu number and then enter the revised data. A
return without entering a number will result in a 0 (zero) for the data
value (or a blank). Selection of the 0 (zero) menu item will run the
program. You will be asked to enter a title after the 0 menu entry. A
99 menu entry will end the program run. Changing the default data in
any of the MENUS will not alter the data files in Table 2.2.
Each menu contains an item pertaining to the output destination.
After entering this number, you will be asked to select the form of
output:
SELECT OUTPUT DEVICE AS FOLLOWS:
1 = PRINTER
2 = SCREE3
3 = A:(filename).BAT
4 = C:(filename).DAT

7
A selection of 3 sends the output to disk drive A; 4 sends the output to
disk drive C. Each program sends disk output t o a different file name
as shown in Table 2 . 3 .
Table 2.3. List of output files
File name Output source
CAPOUT.DAT
FCR . DAT NUCLOM.DAT
COALOM.DAT
NFUEL . DAT COALCOST.DAT
LEVEL. DAT
CAPITAL.DAT
0UTPUT.DAT
PLANTCAP
FCRATE
NUCLOM
COALOM
NFUEL
COALCOST
LEVEL
CAPITAL
MAINPWR
Detailed information on each of the programs is as follows.
PLANTCAP: This program calculates capital investment costs using
cost model information provided in data sets. Currently 7 cost models
are available. These are PWRBE12, PWRME12, PWRBE6, IPWR12, IPWB6, APWR6
and COAL5. PLANTCAP replaces the PWRCAP and COALCAP codes used previ-
ously. It is essentially a simplified version of the CONCEPT code.’
The cost models in the data files were derived from the Energy Economic
Data Base (EEDB-9) cost models7 and are for the NECDB’ reference midwest
region (Chicago). The cost models are divided into labor, material, and
equipment costs at the two digit accounting level. Cost size scaling is
done at the two digit level using CONCEPT’ scale factors. Regional cost
differences at the two digit level were derived from CONCEPT code runs
for the various cities. The interest and escalation during construction
calculation is that described in Appendix C of the NECDB.
The input menu for PLANTCAP i s shown in Fig. 2.1. The values shown
are the default values for the PWBBE12 model, These parameters may be

a
0 = RUN CASE, DATA ENTRY COMPLETE 1 = COST MODEL NAME 2 = CONTINGENCY (fraction) 3 = CITY NUMBER 4 = ESCALATION RATE (fraction/year) 5 = YEAR OF STEAM SUPPLY SYSTEM ORDER 6 = YEAR OF CONSTRUCTTON PERMIT 7 = YEAR OF COMMERCIAL OPERATION 8 = YEAR OF CONSTANT DOLLAR OUTPUT 9 = COST OF MONEY DURING CONSTRUCTION
DEBT PREFERRED STOCK C O m O N EQUITY
10 = GENERAL INFLATION RATE (fraction) 11 = NET RATING PER UNIT ( W e ) 12 = MJNBER OF UNITS AT SITE 13 = OUTPUT DESTINATION 14 = RESET DEFAULT VALUES 99 = EXIT PROGRRM
CAPITALIZATION USED FOR AFUDC
ENTER ITEM NUMBER: 1
PWRBEl2 .loo0
5 CHICAGO .0500
1992.00 1994.00 2000.00 1987.
(AF'UDC RATE) .1135 FRACTION RATE
.500 .097
.loo .090
.400 .140 .050
1100. 1
Printer
Fig. 2.1. Power plant capital investment cost menu (PLANTCAP)
altered for a run by entering the item number and then entering the new
value for the variable. Entering a 1 ( f o r menu item 1) causes a list of
available cost models to be displayed. A new cost model can then be
selected. If menu item 3 is entered, the list of available cities and
their numbers are shown. City 5 is Chicago. Item 7 is the escalation
rate of contruction costs; this rate includes inflation. Item 9 , the
cost of money during construction, is based on the capitalization frac-
tions and nominal rates that are queried if 9 is entered. Note that
item 11 is the electric rating of a single unit and not that f o r the
entire plant.
NUCLOM: This program calculates operation and maintenance (O&M)
costs for nuclear plants. It replaces the former codes PWROM and LMROM
and is based on the recent revisions to the nuclear ObM costing proced-
u r e ~ . ~ Three cost models are imbedded in the code. These are the bet-
ter experience PWR (PWRBE), the median experience PWR (PWRME), and a
large liquid metal reactor (LMRSE) based on t h e PWRBE cost model.
The available menu options and their default values are shown in
Fig. 2.2. The salaries in item 2 are given in constant base year dol-
lars. The base year is shown in item 4 . In order to select an alter-
nate cost model, enter a 3 and then enter the model number as detailed
on the screen.

9
THE AVAIIA3LE MENU OPTIONS AND THEIR VALUES AT THIS TIME ARE: 0 = RUN CASE, DATA ENTRY COMPLETE
2 = AVERAGE ONSITE STAFF COST 36000 1 = ESCALATION RATE (fraction) .05
before payroll taxes and insurance in 1987 $ AVERAGE OFFSITE STAFF COST 51000 before payroll taxes and insurance in 1987 $
3 = COST MODEL PWRBE 4 = BASE YEAR FOR FOR COST MODEL 1987
YEAR OF P W T STARTUP 2000 REF. YEAR FOR CONSTANT DOLLAR 1987
5 = NUMBER OF UNITS PER PLANT 1 6 = BASE M A D CAPACITY FACTOR .75 7 = NET RATING OF EACH UNIT (me) 1100 a = INFLATION RATE .05 9 = OUTPUT DESTINATION 10 = RESET DEFAULT VALUES 99 = EXIT PROGRAM
Screen
ENTER A NUMBER FROM THE MENU ?
Fig. 2.2. Nuclear power plant O&M cost menu (NUCLOM)
COALOM: This program calculates O&M costs for coal-fired plants.
It replaces the former codes, WETOM, and DRYOM. It is the P C version of
the coal model portions of the OMCOST code,* updated to 1987 cost Levels
with cost/size scaling consistent with the revised nuclear O&M model^.^ Three cost data models are imbedded in the code. These are for coal-
fired plants with wet limestone scrubbers (COALWET), with dry lime SO2
removal systems (COALDRY), and without an SO, removal system
(COALNOS). The available menu options and default values are shown in
Fig. 2 . 3 . Menu item 4 refers to the sulfur content, ash content, and
heating value of rhe coal burned in the power plant. Sulfur cantent is
ignored for the model without an SO:! removal system. The COALDWY option
is recommended for analyses of low-sulfur western bituminous and sub-
bituminous coal-fired plants.
NFUEL: This program calculates levelized nuclear fuel costs. It
utilizes mass balance data for various reactor fuel cycLes stored on
separate data files. This code is based on the mainframe R E F C 0 8 3 code4
with some modifications and updating to 1987 cost levels. The code has
recently been modified to provide access in the menu to the lead and lag
times and to the process loss fractions. Previously, changes t o these

10
THE AVAILABLE MENU OPTIONS AND THEIR VALUES AT T H I S TIME ARE:
0 = RUN CASE, DATA ENTRY COMPLETE 1 = 0 AND M COST MODEL (PLANT TYPE) : COALWET 2 = ESCALATION RATE (fraction) .05 3 = PLANT NET HEAT RATE, BTU/KWM(e) 9900 4 = SULFUR (fraction] .035
ASH (fraction) .116 HEATING VALUE (BTU/lb) 11500
YEAR OF START OF OPERATION 2000 REFERENCE YEAR FOR CONSTANT DOLLARS 1987
5 = REFERENCE YEAR FOR COST FIGURES 1987
6 = NUMBER OF U N I T S PER PLANT 2 7 = BASE LOAD CAPACITY FACTOR .75 8 = NET RATING OF EACH U N I T ( m e ) 550 9 = INFLATION RATE .05
10 = OUTPUT DESTINATION Screen
99 = EXIT PROGRAM 11 = RESET DEFAULT VAUJES
ENTER A NUMBER FROM THE MENU ?
Fig. 2.3. Coal-fired power plant O&M cost menu (COALOM)
quantities could only be accomplished by modification of program state-
ments. Also, the option is now available to output levelized costs by
year of operation and by fuel batch.
In order to accomplish these changes the menu has been extensively
revised with the price data, lead and lag times and process losses being
moved to sub-menus.
The main menu for NFUEL options is shown in Fig. 2.4. The values
shown in the menu are not entirely the default option set. The default
for menu Item 3, Recycle Discharge Fuel is N for no. The Y option (for
yes) was selected so that Item 8, the plutonium tax treatment option
would appear in the menu. Item 8 is used only for recycle since i t per-
tains to credit for discharge fuels as discussed below.
Item 1 selects the mass balance set to be used in the calcula-
tion. If a 1 is entered, a list of available mass balance sets will be
shown on the screen. The name of the set to be used is then entered by
the user. The code will check the name entered against the names stored
in the MASFIL data file. If a name is entered that is not in MASFIL,
the list of available mass balance sets will be shown on the screen
again, and a new name can then be entered. Care should be taken in
manipulating files not to separate (put on another disk) MASFIL from the

1 1
THE AVAILABLE MENU OPTIONS AND THEIR VALUES AT THIS TIME ARE:
0 = RUN CASE, DATA ENTRY COMPLETE 1 = MASS BALANCE SET NAME PWREXB 2 = TAX DEPRECIATION OPTION 1 3 = RECYCLE DISCHARGE FUEL Y 4 = OUTPUT COSTS BY YEAR AND BATCH N 5 = GO TO PRICE DATA MENU 6 = GO TO LEAD/LAG TIME MENU 7 = GO TO PROCESS LOSS MENU 8 = PLUTONIUM TAX TREATMENT OPTION 1 9 = Y E A R OF STARTUP 2000
REFERENCE YEAR FOR CONSTANT DOLLARS 1987 10 = CAPACITY FACTOR .75 11 = INFLATION RATE -05 12 = EFFECTIVE COST OF MONEY 9.570001E-02 13 = INCOME TAX RATE .3664 14 = OUTPUT DESTINATION Screen 15 = RESET DEFAULT VALUES 99 = EXIT PROGRAM
ENTER A NUMBER FROM THE MENU ?
Fig. 2.4. Main menu f o r nuclear fuel costs (NFUEL)
mass balance set files of which it is keeping track. Deletion and addi-
tion of mass balance sets is preferably done using the MASSGEN code dis-
cussed later in this Chapter.
Selection of item 2 , the tax depreciation option, gives two
choices:
0 = units of production, and
1 = 5 years.
Entering 0 allows fuel to be depreciated in a given period propor-
tionally to energy produced. Entering 1 allows fuel to be depreciated
using the accelerated 5-year schedule, regardless of energy produced in
any period.
If menu item 3 is N f o r no , then no credit is given for uranium or
plutonium discharged from the fuel. I f item 3 is Y f o r yes, then credit
is taken for discharged fissile materials.
Selection of Menu Item 5 sends control to the price data menu as
shown in Fig. 2.5. This is the menu for the prices and price escalation
rates of the various commodities and services needed in the fuel
cycle. Two numbers are entered (press return after entering each number

12
PRICE DATA MENU
price in reference year and escalation rate thereafter
0 = RETURN TO MAIN MENU 1 = BASE YEAR FOR COST DATA 1987 2 = U308 PRICE AND ESCALATION ($/lb) 3 = CONVERSION PRICE WND ESCALATION ($/kgU) 4 = ENRICHMENT PRICE AND ESCALATION ($/SW) 109 .032 5 = PLUTONIUM PRICE AND ESCALATION ($/kg) 0 . 0 5 6 = FABRICATION PRICE AND ESCAUTION ($/kg HH) 7 = REPROCESSING PRICE AND ESCALATION ($/kg HM) 0 .05 8 = WASTE DISPOSAL PRICE AND ESCALATION (mills/kWh) 1 - 0 5
23 .071 8 .0605
220 . 0 5
ENTER A NUMBER FROM THE MEW ?
Fig. 2.5. Nuclear fuel price data menu
separately) for each of these items. The first is the price in base
year dollars (see menu Item 1 for base year) and the second is the esca-
lation rate between the base year and the year the money is spent.
Return t o the main menu by entering 0 when fuel price and escalation
changes are complete.
Selection of main menu item 6 sends control to the lead/lag time
menu as shown in Fig. 2.6. For menu items 1 though 5 , two entries are
needed. These are the lead times in years relative to when the batch is
loaded in the reactor for the initial core fuel, and second €or the
reload fuel. For items 6-10, lag times in years, relative t o when the
fuel is discharged from the reactor are required €or the initial core
LEAD/LAG TIME MENU FOR INITIAL CORE AND RELOAD FUEL, YEAFS
0 = RETURN TO MAIN NENU 1 = URANIZTM PURCHASE LEAD TIME 2 1.5 2 = CONVERSION PURCHASE LEAD TIME 1.5 1 3 = ENRICHMENT PURCHASE LEAD TIME 1 .75 4 = PLUTONIUM PIJRCHASE LEAD TIME 2 1 5 = FABRICATION PURCHASE LXAD TIME .75 .5 6 = URANIUM SALES LAG TIME 1 1 7 = CONVERSION SALES LA6 TIME 1 1 8 = ENRICHMENT SALES LAG TIME 1 1 9 = PLUTONIUM SALES LAG TIME 1 1 10 = REPROCESSING COST LAG TIME 1 1 11 = TOTAL LAG TIME FOR PLUTONIUM RECYCLE, CYCLES 2
ENTER A NUMBER FROM THE MENU ?
Fig. 2.6. Nuclear fuel lead/lag time menu
13
and subsequent reload fuel. Item 11 is the total time in reactor cycles
for recycle from the rime fuel is discharged from the reactor, until the
recovered plutonium is reloaded into the reactor. Return to the main
menu by entering 0.
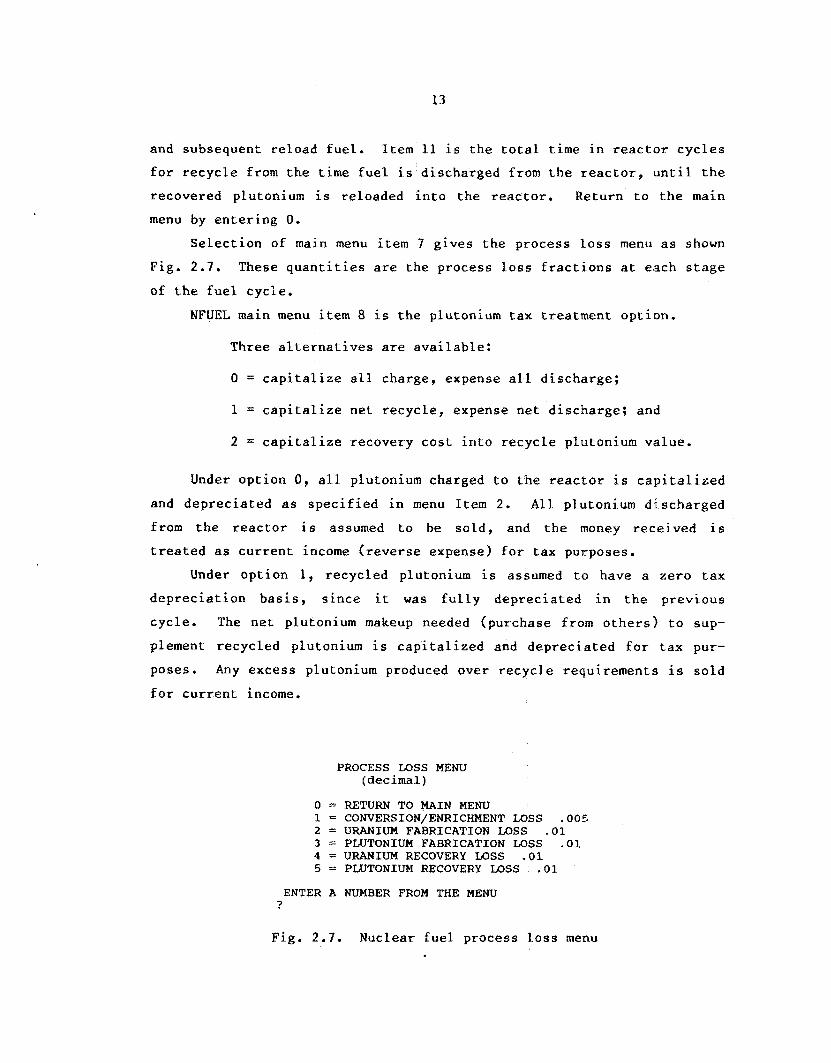
Selection of main menu item 7 gives the process loss menu as shown
Fig. 2 .7 . These quantities are the process loss fractions at each stage
of the fuel cycle.
NFUEL main menu item 8 is the plutonium tax treatment option.
Three alternatives are available:
0 = capitalize all charge, expense all discharge;
1 = capitalize net recycle, expense net discharge; and
2 = capitalize recovery cost into recycle plutonium value.
Under option 0, all plutonium charged t o the reactor is capitalized
and depreciated as specified in menu Item 2. All plutonium discharged
from the reactor is assumed to be sold, and the money received is
treated as current income (reverse expense) f o r tax purposes.
Under option 1, recycled plutonium is assumed to have a zero tax
depreciation basis, since it was fully depreciated in the previous
cycle. The net plutonium makeup needed (purchase from others) to sup-
plement recycled plutonium is capitalized and depreciated f o r tax pur-
poses. Any excess plutonium produced over recycle requirements is sold
for current income.
PROCESS LOSS MENU (decimal)
0 = RETURN TO MAIN MENU 1 = CONVERSIOW/ENRICHNENT MSS .005 2 = URANIUM FABRICATION LOSS .01 3 = PLUTONIUM FABRICATION LOSS -01 4 = URANIUM RECOVERY LOSS -01 5 = PLUTONIUM RECOVERY LOSS .01
ENTER A NUMBER FROM THE MENU 1
Fig. 2 .7 . Nuclear fuel process loss menu

14
Under option 2 , it is assumed that the cost of reprocessing to
recover plutonium from spent fuel is capitalized as the cost of recov-
ered plutonium. This cost, in addition to the cost of any makeup excess
plutonium, is then depreciated as specified in menu Item 2 of the main
menu. Excess plutonium is s o l d for current income and the cost of
recovery of this excess is expensed. Some care must be taken in using
this option. Breeder reactor systems usually must be described with
multiple mass balance sets, one for the core and perhaps axial blankets
and one €or each radial blanket. When using option 2, all plutonium
charge and discharge (whether from core or blankets) which is used in
the recycle calculation, as well as the total reprocessing throughput
rate (core 4 blankets heavy metal) must appear in the core fuel mass
balance set. This is because the blankets as well as core plutonium are
recycled to the core, and the code uses the cost of this reprocessing to
determine the tax basis of recycled plutonium. The LSPB mass balance
data set included with the code package has been adjusted i n this man-
ner.
COALCOST: This program calculates levelized fuel cost for a coal-
fired plant. The available menu options and their default values are
shown in Fig. 2.8.
FCRATE: This program calculates the fixed charge rate on the
capital investment. It is the same program listed in Appendix B of the
THE AVAILABLE MENU OPTIONS AND T H E I R VALUES AT T H I S TIME ARE:
0 = RUN CASE, DATA ENTRY COMPLETE 1 = P R I C E OF COAL, I N DOLLARS PER MILLION BTU 2 = COAL P R I C E ESCALATION RATE (fractian) 3 = REFERENCE YEAR FOR P R I C E OF COAL 4 = REFERENCE YEAR FOR CONSTANT DOLLARS 5 = YEAR OF STARTUP 6 = PLANT NET HEAT RATE (BTU/kWh) 7 = PLANT L I F E (years) 8 = GNP INFLATION RATE 9 = EFFECTIVE COST O F MONEY 10 = OUTPUT DESTINATION 11 = RESET DEFAULT VAILJES 99 = E X I T PROGRAM
ENTER A NUMBER FROM THE MENU ?
1.55 0.0626
1987. 1987. 2000. 3900" 30.
0.050 0.0957 S (2 r een
Fig. 2.8. Levelized coal cost menu (COALCOST)

15
NECDB.
Fig. 2.9. The available menu options and their default values are shown in
For menu item 4, the N stands for normalized accounting and an F stands for flow through accounting. Three alternate tax depreciation
schedules are available through menu item 5, depending on the property
class:
1 = 5-year property,
2 = 15-year property, and
3 = 20-year utility property.
A listing of the recovery percentages for each property class is shown
in Table 2.4. The 5-year class includes equipment and nuclear fuel, the
15-year class includes nuclear plants, and the 20-year class includes
coal-fired plants.
THE
.o = 1 = 2 - 3 = 4 = 5 =
6 = 7 = 8 = 9 = 10 = 11 =
AVAILABLE MENU OPTIONS AND THEIR VALUES AT THIS TIME ARE:
RUN CASE, DATA ENTRY COMPLETE INTERIM REPLACEMENT ESCALATION RATE (fraction) .05 PROPERTY TAX RATE ( fraction/year) -02 INTERIM REPLACEMENT RATE (fraction/year) .005 NORMALIZED/FLOW-THROUGH ACCOUNTING N TAX DEPRECIATION SCHEDULE 2
PROJECT LIFE, YEARS 4 0 PRINTOUT ANNUAL REVENUE REQUIREMENTS Y COMPRESSED PRINTOUT FOR REVENUE REQUIREMENTS N LEVELIZING PERIOD, YEARS 30 INFLATION RATE (DECIMAL) -05 INITIAL CAPITAL INVESTMENT AT STARTUP (millions nominal $) 4012.5
15-YEAR PROPERTY
ENTER OPTION NUMBER OR A 'RETURN' TO SEE REST OF MENU? 12 = 13 = 14 =
15 =
16 = 17 = 18 = 19 = 20 = 21 = 99 =
TAX DEDUCTABLE FRACTION OF TOTAL CAPITAL INVESTMENT .7997 EFFECTIVE INCOME TAX RATE .3664 INTEREST RATE ON DEBT .097 RETURN ON PREFERRED STOCK 9.000001E-02 RETURN ON COMMON STOCK -14 DEBT FRACTION .5 PREFERRED STOCK FRACTION .1 COMMON STOCK FRACTION . 4 YEAR OF STARTUP 2000 REFERENCE YEAR FOR CONSTANT DOLLARS 1987 TOTAL PLANT POWER LEVEL,MWe 1100 CAPACITY FACTOR . 7 5 OUTPUT DEVICE Printer RESET DEFAULT VALUES EXIT PROGRAM
ENTER A NUMBER FROM THE MENU ?
Fig. 2.9. Fixed charge rate menu (FCRATE)

16
Table 2.4. Recovery percentages
Applicable percentage €or class of property
15 year 20 year Year 5 year (nuclear fuel) (nuclear plant) (coal-fired plant)
1
2
3
4
5
6
7
8
9
10
11
12
1 3
14
1 5
16
17
18
19
20
21
20.00
32.00
19.20
11.52
11.52
5.76
5.0
9.5
8.55
7.70
6.93
6.23
5.91
5.91
5.91
5.91
5.90
5.90
5.90
5.90
5.90
2.95
3 .75
7 . 2 2
6.68
6.1%
5.71
5.28
4.89
4.52
4.47
4.47
4.46
4.46
4.46
4.46
4.46
4.46
4.46
4.46
4.46
4.46
2 .23
An entry of Y for menu item 7 will result in a printout of a break-
down of the year-by-year revenue requirements for capital. Items 7 and
8 do not appear if the screen is being used as the output device because
the schedule will not fit on the screen. An entry of N for menu item 7
will suppress the printout. Since the standard print type (Epson type
printer, 10 characters per inch) will result in a 10 inch wide printing

17
for the annual revenue requirements, those users with only a standard
width printer should enter a Y for menu item 8 in order t o obtain a
compressed printout of this table (may not work for all printers).
Menu item 6 indicates a 40-year plant life and menu item 9 indi-
cates a 30-year levelization period. The levelized fixed charge rate
will be calculated over 30 years using only those c o s t s incurred during
the first 30 years of the plant life.
The entire fixed charge rate menu is too large to fit on a single
screen listing. Therefore, the menu stops after item 11, and a menu
item number may be entered here or return may be pressed to display the
rest of the menu.
The initial capital investment in nominal dollars (menu item 11)
can be obtained from the output of PLANTCAP o r CAPITAL, as can the frac-
tion of the cost which is deductible for income tax purposes (menu
item 12).
LEVEL: This program calculates levelized power generation costs.
The input menu with default values is shown in Fig. 2.10. Menu Option
15 indicates the plant type; N signifies nuclear. If C, f o r coal, is
0 = RUN CASE, DATA ENTRY COMPLETE 1 = YEAR OF FIRST COMMERCIAL OPERATION 2000 2 = RATING, MWE 1100 & UNITS/PLANT 1 3 = ANALYSIS LIFE, YEARS 30 4 = GNP INFLATION RATE -05 5 = EFFECTIVE INCOME TAX RATE -3664 6 = CAPITALIZATION FRACTION RATE
DEBT 0.500 0.097 PREFERRED STOCK 0.100 0.090 COMMON EQUITY 0.400 0.140
7 = REFERENCE YEAR FOR CONSTANT DOLLARS 1987 8 = DECOMMISSIONING DEBT RATE .07 9 = DECOMMISSIONING COST, MILLIONS OF 1987 $ 145 10 = CAPACITY FACTOR .75 11 = PLANT INVESTMENT COST (millions nominal $) 4012 12 = FIXED CHARGE RATE -1631 13 = LEVELIZED O&M COST (mills/kwh using 1987 $ ) 9.149999 14 = LEVELIZED FUEL COST (millsikwh using 1987 $) 6.391 15 = PLANT TYPE N 16 = OUTPUT DEVICE Screen 17 = RESET DEFAULT VALUES 99 = EXIT PROGRAM ENTER A NUMBER FROM THE MENU
?
Fig. 2.10. Nuclear power plant power generation c o s t menu (LEVEL)

18
entered, the default menu changes to that shown in Fig. 2.11. There are
differences in the nuclear and coal defilult values in menu Items 2, 9,
11, 12, 13, 14, and 15.
Menu item 2 is the unit rating and number of units. Item 9 is the
decommissioning c o s t (millions of reference year dollars) €or the total
plant. Item 11, the plant investment cost, is the value calculated
using PLANTCAP, o r alternately CAPITAL. Item 13 is the levelized O&M
cost, which is the value calculated using NUCLOM or COALOH. Item 14,
the levelized fuel cost, is obtained from the NFUEL or CBALCOST results.
CAPITAL: This code can be used in place of PLANTCAP if a capital
cost model data file is not available €or the case of interest. Like
PLANTCAP, CAPITAL gives the total capitalized cost in its results. The
overnight cost of the plant is required as input far CAPITAL.
The input menu with default values is shorn in Fig. 2.12, A change
in menu item 1 will cause an automatic change in menu Items 4 , 8 , and 9
in order to reflect the new plant type. If menu Item 7 is requested,
the user will be asked t o enter each capitalization fraction and rate of
0 = RUN CASE, DATA ENTRY COMPLETE 1 = YEAR OF FIRST COMMERCIAL OPERATION 2000 2 = RATING, MWE 550 & UNITS/PLANT 2 3 = ANALYSIS LIFE, YEARS 30 4 = GNP INFLATION RATE .05 5 = EFFECTIVE INCOME TAX RATE .3664 6 = CAPITALIZATION FRACTION RATE
DEBT 0.500 0.097 PREFERRED STOCK 0.100 0.090 COMMON EQUITY 0.400 0.140
7 = REFERENCE YEAR FOR CONSTANT DOLLARS 1987 8 = DECOMMISSIONING DEBT RATE .07 9 = DECOMHISSIONING COST, MILLIONS OF 1987 $ 25 10 = CAPACITY FACTOR .75 11 = PlLANT INVESTMENT COST (n j . l l i ons nominal $) 2887 12 = FIXED CHARGE RATE .1651 13 = LEVELIZED O&M COST (mills/kwh using 1987 $) 5.92 14 = LEVELIZED FUEL COST (mills/kwh using 1987 $) 20.88 15 )= PLANT TYPE C 16 = OUTPUT DEVICE Screen 17 = RESET DEFAULT VALUES 99 = EXIT PROGRAM ENTER A NUMBER FROM THE MENU
?
Fig. 2.11. Coal-fired power plant power generation cost menu ( LEVEL 1

19
THE AVAILABLE MENU OPTIONS AND THEIR VALUES AT T H I S TIME ARE:
0 = RUN CASE, DATA ENTRY COMPLETE 1 = PLANT TYPE NUCLEAR
3 = REFERENCE YEAR 1987.0 4 = TOTAL OVERNIGHT COST(REF. YEAR $) 1673.0 5 = ESCALATION RATE .0500 6 = INFLATION RATE .0500 7 = CAPITALIZATION FRACTION RATE
DEBT .500 .097 PREFERRED STOCK .IO0 .090 COMMON EQUITY . 400 . 1 4 0
NSSS ORDER DATE 1 9 9 2 . 0 0 1 9 9 4 . 0 0 CONSTRUCTION PERMIT DATE
OPERATION DATE 2000.00
2 = PLANT S I Z E , MWe 1100.
8 = CONSTRUCTION SCHEDULE
9 = FRACT. OF MONEY SPENT BEFORE C.P. ISSUE . l o o 1 0 = OPTION TO RETURN TO BASE PARAMETERS 11 = OUTPUT DESTINATION Screen 99 = E X I T PROGRAM
ENTER A NUMBER FROM THE MENU ?
Fig. 2.12. Capitalized investment cost menu (CAPITAL)
return separately. For menu Item 8, each date will be asked € o r sep-
arately, Menu Item 9 provides the fraction of the total overnight cost
spent from the time of plant order until construction begins. The
default values of 0.1 for nuclear and 0.05 for coal are based on the
cash flow profile in the CONCEPT code.' Selection of menu Item 10 will
return the menu to its default values.
MASSGEN: The various data files may be updated through the use of
a line editor (EDLIN for example) or with word processing software. A
separate program is available to create, update, o r change fuel cycle
mass balance data sets. MASSGEN is a program for generating, deleting,
or changing fuel cycle mass balance data for use with the NFUEL
program. It does not do a physics calculation but simply enters charge
and discharge quantities in the proper format for use in the fuel cycle
cost code.
You are first asked:
For Ending Session: Enter E
For Adding a New Mass Balance Set: Enter A
For Deleting an Existing Mass Balance Set:
For Changing an Existing Mass Balance Se t :
Enter D
Enter C

20
If A is entered, the names of existing mass balance sets are shown
and you are asked for the name of the new set. IF the new set has the
same name a s an existing set, you are asked if you want to replace it
with the new information. If the answer is N for no, you return to the
initial menu. If the answer is Y € o r yes, you are asked in turn for:
umber of batches? (number of separate batches for which
information will be provided)
Plant capacity factor? (fraction)
Batchesjcore? (number of cycles an average batch remains in
core 1 Electric power, e? (unit power rating)
You are then asked in turn €or the following information for each of the
Number of batches'': I*
Total uranium load, kg?
U-235 load, kg?
Fissile glutoni
discharge, kg?
U-235 discharge, kg?
Fissile plutonium discharge, kg?
Total heavy m e t a l charge, kg?
Total heavy metal discharge, kg?
If the data are the same f o r the remainder o f the batch a s for the pre-
vious batch, entering 99999 will set the mass flows equal to the previ-
ous batch values.
When you have finished entering data for all of the number of
batches specified in N ber of batches? the information will be shown on
the screen, and you will be asked whether it is correct. If it is,
enter Y, and the new mass balance data will be added to the List of
available data sets. If it is not, enter N, and you will be asked,
Number of batch to be corrected? Enter the batch number, where 0 speci-
fies the initial information. After correcting the information, the
above procedure is repeated until an answer of Y i s given t o the Data
correct? question.

21
If D is entered f o r the initial menu, you are shown the names of
the existing mass balance sets and asked, Name of file to be deleted?
Enter the desired file from the list. If the name entered is on the
list, it will be deleted. If it is not, you will be asked, Try again?
Y or N? I f you answer Y, you get another chance, if you enter N, you
will be returned to the initial menu.
I f C is entered f o r the initial menu query, you can change an
existing data set. The names of existing data sets are shown on screen
and you are asked: Change Which Mass Balance Set? Enter name of set
from list and you will be asked, Do you Want t o Change Name and Save as
a New Set? (Y or N). If you want to correct data and not create a new
set, enter N, and you will move t o the data change procedure. If you
want to create a new data set, enter Y. You will be asked to Enter N a m e
of New Mass Balance Set. Enter the new name (eight characters or
less). You will now be shown the existing data and asked, Is This
Information Correct? The procedure from this point on is the same as
for correcting data discussed under the "A" option f o r the initial menu.

22
3 . DESCRIPTION OF INTEGRATED COST CODE
The integrated cost code, MAINPWR, utilizes the individual codes
described in Chap. 2. Like the individual codes, MAiNPWR is menu
driven. MAINPWR allows €or two different modes of operation. One mode
allows the execution of the individual codes in the same manner as was
described in Chap. 2. The other mode is an automated execution of the
different individual codes to determine the total levelized power gen-
eration cost.
The previous version of the codes used in calculating levelized
power generation costs called for executing each individual code, noting
the results of the code, and using these results as input to the next
code. In consolidating these codes into a unified program, two basic
purposes are served. First, the user does not have to keep track of the
results of each code; these values are stored in memory and recalled
when necessary. Secondly, many items of the input data for each of the
individual codes are repetitive. The same parameter, such as general
inflation rate o r capacity factor, is often used in all the codes. To
facilitate easier use of the codes, the consolidated code requires input
of these common parameters only once. T h e values are stored in memory
and recalled when necessary. The parameters which are comon to all the
codes are entered at the beginning of the execution. The parameters
which are unique to a specific code are entered at the beginning of that
particular routine of the consolidated codec.
MAINPWR, short For main power, can be thought of as the central
driver program from which branching to the individual codes occurs.
Although data entry takes place in MAIWPWR, no calculations are per-
formed in this particular program.
When MAINPWR is executed, the first prompt to the user is EMlTER
ING DISK (A, R, OR Cd. MAINPWR can operate from either drive A,
B, or C , but it cannot operate from more than one drive during t h e exe-
cution. Thus, other than the output file (and the runtime libraries
when executing the compiled codes), all files including program MAINPWR
and the other codes shown in Tables 2.1 and 2,2 must be consolidated on
one disk drive. The main menu of program MAINPWR then appears on the
screen.

23
The main menu for program MAINPWR is shown in Fig. 3 . 1 . Selection
of item 1 allows the user to calculate total levelized power generation
costs, including capital investment costs, fuel costs, O&M costs, and
decommissioning costs. If item 1 is selected, MAINPWR branches to pro-
gram LEVEL. Item 2 allows the user to calculate capital investment
costs only, and upon selection of item 2, MAINPWR branches to program
PLANTCAP. Calculation of the fixed charge rate by branching to program
FCRATE is accomplished by selecting item 3 . Item 5 allows the user to
calculate total levelized fuel costs by branching t o either program
NFUEL or program COALCOST, depending on the type of plant, which is
specified in menu item 6 . Levelized O&M costs can be calculated from
either NUCLOM or COALOM, which are accessed using item 4.
Selection of items 2-5 causes execution of one of the individual
codes as detailed in Chap. 2 with some modifications. Since the user
has already specified the operating disk drive, the individual codes do
not ask for this information. Similarly, the individual codes do not
ask for the output destination, since this information is contained in
the main menu of MAINPWR. A l s o , entering a "99" at the menu stage of
each code returns the user to the main menu of program MAINPWR instead
of stopping execution.
Item 6 allows the user to change the plant type. The plant type is
initially nuclear, but entering a 6 at the main menu will cause the
The user should enter the number of the desired selection.
M A I N M E N U
The following options are available at this time:
(1) Calculate Total Levelized Power Generation Costs (2) Calculate Capital Investment Costs ( 3 ) Calculate Fixed Charge Rate ( 4 ) calculate Operating 61 Maintenance Costs (5) Calculate Fuel Costs (6) Change Plant Type from NUCLEAR (7) Change Output Destination from SCREEN ( 8 ) Reset default values (99) Exit Program
Input number of desired selection
Fig. 3.1. Main menu for integrated program (MAINPWR)
?

24
Item 8 is the default value reset, Selection of item 8 causes all
variables in the individual codes to be reset t o their default values.
The plant type and output destination in MAINPWR are not affected by the
reset
Selection of item 99 stops the execution of the program.
A s previously stated, selection of item 1 allows the calculation of
total levelized power generation costs. Two possibilities exist at this
stage. In the first scenario, the user already has access to the values
of capital investment cost, fixed charge rate, levelized fuel cost, and
levelized O&M c o s t . If this is t h e case, the user needs only to execute
LEVEL as a separate code. A more likely second scenario, however, is
that the user does not know these values and will need to determine
these quantit.ies using programs PLANTCAP, FCRATE, NFUEL o r COALCOST, and
NUCLOM or COALOM. Recognizing these two possibilities, MAINPWR prompts
the user in the following manner:
The calculation of the tatal levelized power generation costs
requires that the levelized values of capita1 c o s t s , fuel costs, and O&H
costs, as well as the fixed charge rate, be karswn, It is possible ta
generate thi s necessary data using this progr or if these values are
already h o r n , they m y be inpuced separately.
Do you wish to calculate the data using the integrated progr
Y = Yes
N = No
Select the appropriate response.
?
I f the user d o e s already know Lhe necessary values, he should respond
with an N and execute program LEVEL as detailed in Chap. 2. If instead
the user needs t o calculate these individual costs, he s h o u l d respond
with a Y to use the integrated code and aut;ornatically branch to LEVEL,
PLANTCAP, FCKATE, NUCLOM or COALQM, NFUEL or COALCOST, and LEVEL
(again). To do s o , the user should respond with a Y.
Upon entering a Y, the user sees the menu for the levelization
routine appear on the screen. This menu, shown in Fig. 3.2, is a madi-
fied menu for program LEVEL. MAINPWR has automatically branched to

25
generate this necessary data using this program, or if these values are
already known, they may be inputed separately.
Do you vish to calculate the data using the integrated program?
Y = Y e s
I = No
Select the appropriate response.
?
If the user does already know the necessary values, he should respond
with an N and execute program LEVEL as detailed in Chap. 2. If instead
the user needs to calculate these individual costs, he should respond
with a Y t o use the integrated code and automatically branch t o LEVEL,
P W T C A P , FCRATE, WUCLObi or COALOM, NFUEL or COALCOST, and LEVEL
(again). To do so, the user should respond with a Y.
Upon entering a Y, the user sees the menu for the levelization
routine appear on the screen. This menu, shown in Fig. 3.2, is a modi-
fied menu for program LEVEL. MAINPWR has automatically branched to
program LEVEL. The default values for items 3, 4, 5 , 6 , 8 , 9 , and 10
are the values recommended in the NECDB’ for either a coal-fired or
a nuclear plant. The plant type does not appear in the menu; it has
already been determined from the main menu of MAINPWR. A selection of
item 99 at this point by the user brings back the main menu for program
Menu f o r Levelization routine
THE o = 1 = 2 = 3 = 4 = 5 = 6 =
7 = 8 = 9 = 10 = 99 =
AVAILABLE MENU OPTIONS AND THEIR VALUES AT THIS TIME ARE: RUN CASE, DATA ENTRY COMPLETE YEAR OF FIRST COMMERCIAL OPERATION 2000 RATING, MWE 1100 & UNITS/PLANT 1 ANALYSIS LIFE, YEARS 30 GNP INFLATION RATE .05 EFFECTIVE INCOME TAX RATE .3664 CAPITAL1 ZATION FRACTION RATE DEBT 0.500 0.097 PREFERRED STOCK 0.100 0.090 COMMON EQUITY 0.400 0.140 REFERENCE Y E A R FOR CONSTANT DOLLARS 1987 DECOMMISSIONING DEBT RATE -07 DECOMMISSIONING COST, MILLIONS OF 1987 $ 145 CAPACITY FACTOR .75 EXIT PROGRAM
ENTER A NUMBER FROM THE MENU ?
Fig. 3.2. Menu for levelization routine in integrated program

26
MAINPWR. Selection of item 0 causes intermediate output to the printed
and the menu for the capital investment cost routine to he displayed, as
shorn in Fig. 3 . 3 .
When the menu for the capital investment cost routine is on dis-
play, control has automatically been shifted from program LEVEL t o pro-
gram PLANTCAP. Menu item 1 is the name of the capital investment cost
model. Entering a 1 will cause a list of possible cost models to be
displayed. These cost models have their roots in the EEBB-97 and are
described in more detail in Chap. 2. The contingency fraction in item 2
is multiplied by the sum a€ the indirect and direct costs t o obtain the
contingency allowance. Item 3 is the city number; selection of 3 causes
a list of cities to be displayed. Item 4 is the construction cost
escalation rate including inflation. Items 5 and 6 should be self-
explanatory. The default values for items 2, 4 , 5, and 6 are the values
recommended in the NECDB’ for the type o f plant which has been specified
by the user. Selection of item 0 causes intermediate output for the
capital investment cost routine to be printed. Control is next
transferred to program FCRATE.
The next sequence appearing on the screen is the menu €or the fixed
charge rate routine, shorn in Fig. 3 . 4 . Item 3 is the fraction of the
total initial capital investment that is t o be allocated annually €or
equipment replacement. Item 1 is the annual escalation rate in the cost
of this equipment. Item 7 allows the user to specify that a year-by-
Menu for Capital Investment Cost routine
THE AVAILABLE MEW OPTIONS AND THEIR VALUES AT T H I S TIME ARE:
0 = RUN CASE, DATA ENTRY COMPLETE 1 = COST MODEL NAME 2 = CONTINGENCY (fraction) 3 = C I T Y NUMBER 4 = ESCALATION RATE (fraction/year) 5 = YEAR OF S T E M SUPPLY SYSTEM ORDER 6 = YEAR OF CONSTRUCTION PERMIT
99 = E X I T PROGRAEi
ENTER ITEM NUNBER: ?
PWRBE 12 . l o o 0
5 CHICAGO .0500
1992.00 1994.00
Fig. 3 . 3 . Menu f o r capital investment cost routine in integrated program

27
Menu for Fixed Charge Rate routine
THE
o = 1 = 2 = 3 = 4 = 5 =
6 = 7 = 8 =
99 =
AVAILABLE MENU OPTIONS AND THEIR VALUES AT THIS TIME ARE:
RUN CASE, DATA ENTRY COMPLETE INTERIM REPLACEMENT ESCALATION RATE (fraction) .05 PROPERTY TAX RATE (fraction/year) . 0 2 INTERIM REPLACEMENT RATE (fraction/year) . 0 0 5 NORMALIZED/FLOW-THROUGH ACCOUNTING N TAX DEPRECIATION SCHEDULE 2
PROJECT LIFE, YEARS 40 PRINTOUT ANNUAL REVENUE REQUIREMENTS Y COMPRESSED PRINTOUT FOR REVENUE REQUIREMENTS N EXIT PROGRAM
15-YEAR PROPERTY
ENTER A NUMBER FROM THE MENU ?
Fig. 3 . 4 . Menu for fixed charge rate routine in integrated program
year revenue requirement schedule is to be printed in the output. Since
this schedule is not available for screen output, items 7 and 8 do not
appear in the menu if the user has selected the screen as the output
destination. All other menu items should be self-explanatory. The
default values for items 1-6 are the values recommended in the NECDB5
for the type of plant, seen in the main menu of MAINPWR. Entering a 0
causes intermediate output from the fixed charge rate routine to be
printed . The 06M routine is the next program in the series. If a nuclear
plant has been specified by the user, control is transferred to program
NUCLOM. If a coal plant has been specified, control is transferred to
program COALOM.
The menu for nuclear O&M costs routine within the integrated pro-
gram is shown in Fig. 3.5. It is a simpler menu than the stand-alone
NUCLOM code. Item 1 allows the user t o use the default general escala-
tion rate, input a general escalation rate, or input separate escalation
rates. All of these escalation rates include inflation. The user is
cautioned that the values of the salaries in item 2 must be in constant
dollars of the base year for the cost model. This cost model is item 3;
the base year is item 4 . The cost models are described in Chap. 2. The
base year for all the cost models contained in this package is 1987.
Therefore, unless new models are added, the user should always use 1987

Menu for Nuclear ObrM Costs routine
THE AVAILABEE MENU OPTIONS AND THEIR VALUES AT THIS TIME ARE: 0 = RUN CASE, DATA ENTRY COMPLETE
2 = AVERAGE ONSITE STAFF COST 36000 1 = ESCALATION IRATE (fraction) .05
before payroll taxes and insurance i n 1987 $
before payroll taxes and insurance in 1987 $
AVERAGE OFFSITE STAFF COST 51000
3 = COST MODEL PrnBE 4 = BASE YEAR FOR FOR COST MODEL 1987
ENTER A NUMBER FROM THE MENU 99 = EXIT PROGRAM
?
Fig. 3.5. Menu for nuclear Q&M cost routine in integrated program
€or item 4 and the staff costs in item 2 should always be in 1987
dollars.
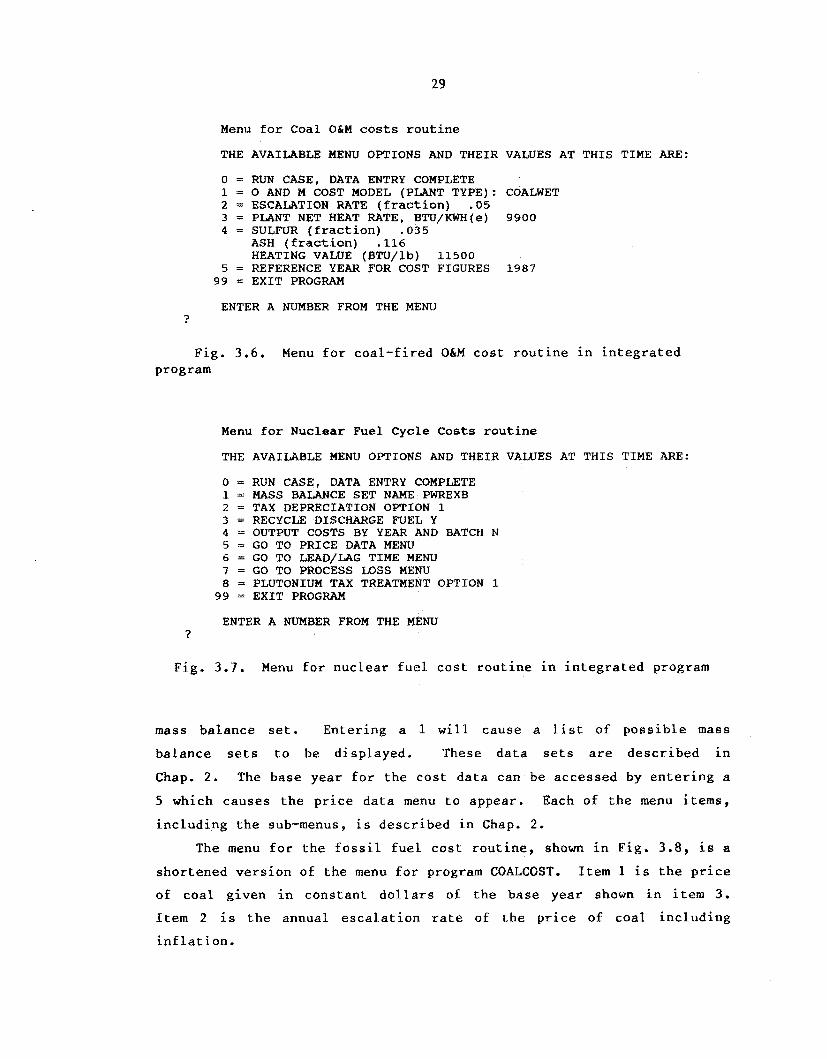
NUCLOM's coal counterpart is program COALOM. The menu for the
fossil fuel O&M cost routine, shown in Fig. 3 . 6 , is B simplified version
of the menu of program COALOM. Item 1 is the name of the O&M cost
model; the available c o s t models are described in Chap. 2. Entering a 1
will cause a list of possible models to be displayed. Item 2 is the
escalation rate of O&M costs including inflation. Item 5 is the base
year for the OrEM c o s t model in item 1. As in the nuclear case, all of
the coal 0&M models contained in this package are based on 1987 prices,
so unless other models are added, 1987 should always bo used for
item 5. The other menu items should be self-explanatory.
The user should take care to avoid confusing the reference year for
constant dollars and the base year f o r costs. The base year for costs
is the year in which the costs, which serve as input, are expressed.
The reference year for constant dollars is the year in which the user
wishes the output to be expressed.
A menu entry of 0 for either COALOM o r NUCLQM causes the Odpl por-
tion to be executed and the intermediate output to be printed. Control
is then Lransferred t o the appropriate fuel cost routine; NUCLOM
branches to NFUEL while CQALOM branches to COALCOST.
The menu for the nuclear fuel cycle cost routine, a derivative of
the menu f o r NFUEL, is shown in Fig. 3.7. Item 1 is the name o f the
29
Menu for Coal O&M costs routine
THE
o = 1 = 2 = 3 = 4 =
5 = 99 =
AVAILABLE MENU OPTIONS AND T H E I R VALUES AT T H I S TIME ARE:
RUN CASE, DATA ENTRY COMPLETE 0 AND M COST MODEL (PLANT T Y P E ) : COALWET ESCALATION RATE (fraction) .05 PLANT NET HEAT RATE, BTU/KWH(e) 9900 SULFUR (fraction) .035 ASH (fraction) .116 HEATING VALUE ( B T U / l b ) 11500 REFERENCE YEAR FOR COST FIGURES 1987 E X I T PROGRAM
ENTER A NUMBER FROM THE MENU ?
Fig. 3 . 6 . Menu for coal-fired O&M cost routine in integrated program
Menu for Nuclear Fuel Cycle Costs routine
THE AVAILABLE MENU OPTIONS AND T H E I R VALUES AT T H I S TIME ARE:
0 = RUN CASE, DATA ENTRY COMPLETE 1 = MASS BALANCE S E T NAME PWREXB 2 = TAX DEPRECIATION OPTION 1 3 = RECYCLE DISCHARGE FUEL Y 4 = OUTPUT COSTS BY YEAR AND BATCH N 5 = GO TO P R I C E DATA MENU 6 = GO TO LEAD/LAG TIME MENU 7 = GO TO PROCESS LOSS MENU 8 = PLUTONIUM TAX TREATMENT OPTION 1
99 = E X I T PROGRAM
ENTER A NUMBER FROM THE MENU ?
Fig. 3.7. Menu €or nuclear fuel cost routine in integrated program
mass balance set. Entering a 1 will cause a list of possible mass
balance sets to be displayed. These data sets are described in
Chap. 2. The base year for the cost data can be accessed by entering a
5 which causes the price data menu to appear. Each of the menu items,
including the sub-menus, is described in Chap. 2.
The menu for the fossil fuel cost routine, shown in Fig. 3 . 8 , is a
shortened version of the menu for program COALCOST. Item 1 is the price
of coal given in constant dollars of the base year shown in item 3 .
Item 2 is the annual escalation rate of the price of coal including
inflation.

30
Menu for F o s s i l Fuel Costs routine
THE AVAILABLE MENU OPTIONS AND THEIR VALUES AT T H I S TIME ARE:
0 = RUN CASE, DATA ENTRY COMPLETE 1 = PRICE OF COAL I N D0LLAlR.S PER MILLION BTU 1 . 5 5
0 . 0 6 2 6 2 = COAL PRICE ESCALATION IRATE ( f r a c t i o n ) 3 = REFERENCE YEAR FOR PRICE OF COAL 1987.
99 = E X I T PROGRAM
ENTER A NUMBER FROM THE MENU ?
Fig. 3 . 8 . Menu for coal cost routine in integrated program
A menu selection of 0 for either of the fuel cost routines will
cause the fuel cost portion to be executed and output to be printed.
This printing is the last stage of intermediate output.
The final output begi-ns by giving a summary of key parameters cal-
culated during the different routines. This summary includes the values
of the total plant capital investment cost and the fraction of the total
capital investment which is tax deductible (both from the capital
investment cost routine, PLANTCAP), the fixed charge rate from the fixed
charge rate routine (FCRATE), the levelized O&M cost from the ObM cost
routine (NUCJBM or COALOM), and the levelized fuel cost from the fuel
cost routine (NFUEL o r COALCOST). After the summary, the final results
showing the total levelized power generation costs are printed,
In summary, t h e integrated program MAINPWR-BAS allaws for two modes
of operation. In one mode, the individual codes as detailed in Chap. 2
are accessed and executed in order to calculate one aspect of the. total
levelized power generation cost, such as capital investment cost or the
fixed charge rate. In the other mode, by automatically branching to the
individual codes, the integrated-code allows the user to calculate total
levelized power generation costs in both nominal and constant dollars
without prior knowledge of levelized values of plant. capital investment
costs, fuel costs, Q&M costs, and decommissioning costs.
This se ti
4.
31
EXAMPLE CALCULATIONS
is inte ded to demonstrate the o e tion
the three modes of operation of the code package; to this
f each of
end three
examples will be presented. The first example, which demonstrates uti-
lizing the integrated code MAINPWR to automatically link all necessary
codes, is for the NECDB reference PWR power plant. The second example,
which demonstrates utilizing MAINPWR to run the individual codes on a
separate basis, is for the NECDB reference coal-fired power plant. The
last example calculates the reference PWR power plant again, this time
using the individual codes without MAINPWR.
It is assumed that the user has an IBM compatible personal computer
with advanced basic (BASICA or GGJBASIC) on the disk operating system and
is familiar with loading and operating BASIC programs.
4.1 1100 MWe Nuclear (PWR) Power Plant
The calculation of levelized power generation costs for the refer-
ence PWR Power Plant can be accomplished by running program MAINPWR,
either from DOS or BASIC (see Chap. 1). After the operating drive has
been selected, the main menu (see Fig. 3.1) appears on the screen. The
default value for item 6 , the plant type, is nuclear, so no changes need
to be made in item 6 . Item 1 is selected to calculate the total
levelized power generation costs. The response to the prompt f o r run
identification, which may be left blank, is i n this case "Nuclear PWR
Example." Since this example will demonstrate using the integrated code
to automatically link the individual codes, a Y, for yes, is answered
when the prompt "DO you wish to calculate these values using the
integrated program?" is displayed.
The default values for each stage of the calculation have been set
to the values of the reference PWR plant in the NECDB. Therefore, at
the menu stage of each routine, all that is required of the user is to
enter a 0 to signify that the data are correct and that the execution of
that stage should begin.

32
Intermediate output is printed after each routine has been c ~ m -
pleted, Each stage of this output, other than the first stage, prints
the input parameters that are unique to the particular routine and then
gives the results of the routine. The first set of output, shown in
Fig. 4,1, is a summary of the general input values from the levelization
routine. The capital investment cost summary (Fig. 4 . 2 ) is then
printed. The plant capital investment cost in nominal dollars and the
tax deductible fraction of the total capital will be used by the code at
a later time when necessary. A summary o f the fixed charge rate results
(Fig. 4.3) is then printed. The year-by-year schedule of revenue
requirements could have been deleted from the output by changing the
default value of item 7 in the fixed charge rate menu (see Fig. 3 . 4 )
from a Y to a N. The nominal fixed charge rate will be used later by
the code. A summary of the annual non-fuel 0bM costs (Fig. 4.4) is
next. Note that the values i n this output are given in constant. dol-
lars. The code uses the total levelized ObM cost (including A & GI at a
later time. A summary of the nuclear fuel cycle cost, shown in
Fig. 4.5, i s then printed. The lewelized fuel cost in constant dollars
L E V E L I Z E D P O W E R G E N E R A T I O N C O S T C O D E
VERSION 09 -0 1- 19 8 8 RUN DATE 09-20-1988
Summary of General Input Parameters
Nuclear PWR Example YEAlR OF FIRST COMMERCIAL OPERATION RATING PER UNIT (MWe) UNITS PER PLANT CAPACITY FACTOR ANALYSIS LIFE (years) GNP INFLATION RATE EFFECTIVE INCOME TAX RATE
CAPITAL1 ZATION FRACTION DEBT 0.500 PREFERRED STOCK 0.100 COMMON EQUITY 0.400
EFFECTIVE COST OF MONEY CONSTANT DOLLAR LEVELIZED COST YEAR
RATE 0.097 0.090 0.140
2000. 1100.
1. 0 . 7 5
30. 0.050 0.3664
0.0957 1987.
Fig. 4.1. General input parameters for reference PWR/BE power plant

33
Capital Investment Cost Summary Nuclear PWR Example
PWRBE12 POWER PLANT YEAR OF STEAM SUPPLY SYSTEM ORDER YEAR OF CONSTRUCTION PERMIT YEAR OF COMMERCIAL OPERATION COST OF MONEY DURING CONSTRUCTION (AFUDC RATE) ESCALATION RATE (fraction/year) CONTINGENCY (fraction) PLANT IACATION ---------------- DIRECT COSTS ($MILLIONS 1987 DOLLARS)
20 LAND 21 STRUCTURES 22 REACTOR PLANT 23 TURBINE PLANT 24 ELECTRIC PLANT 25 MISC PLANT 26 MAIN COND HEAT
SUBTOTAL DIRECTS REJ
1992.00 1994.00 2000.00
.1135
.0500
.1000 CHICAGO
5 . 184. 290. 213. 76. 44. 46.
858.
INDIRECT COSTS 91 CONSTR SERVICES 205. 92 HOME OFFICE ENGRG 211. 93 FIELD OFFICE 109. 94 OWNER COSTS 138.
SUBTOTAL INDIRECTS
SUBTOTAL DIRECTS AND INDIRECTS CONTINGENCY ALLOWANCE TOTAL OVERNIGHT COSTS BEFORE ESCALATION
ESCALATION BEFORE STEAM SUPPLY ORDER ESCALATION AFTER STEAM SUPPLY ORDER TOTAL ESCALATED DIRECT AND INDIRECT COSTS
TOTAL INTEREST DURING CONSTRUCTION
TOTAL CAPITAL INVESTMENT
PLANT CAPITAL INVESTMENT COST NOMINAL DOLLARS (3647. $/€Me) CONSTANT 1987 DOLLARS (1934.$/KWe)
TAX DEDUCTIBLE FRACTION IN TOTAL CAPITAL =
663 .)
1521. 152. 1673.
462. 473. 2609.
1403.
4012.
4012. 2128.
-7997
Fig. 4.2. Capital investment c o s t summary for reference PWR/BE power plant
is used later by the code. The nuclear fuel cycle output is the last
stage of intermediate output.
A summary is printed next, showing a11 of the values that the code
is using to compute the total levelized power generation costs. The
final results are then printed in both nominal and constant dollars as
shown in (Fig. 4 . 6 ) .

34
S u m m a r y of Fixed C h a r g e R a t e Nuc lea r PWX E x a m p l e
PROJECT L I F E ( y e a r s )
I N I T I A L C A P I T A L INVESTMENT AT STARTUP, MILLION $ TAX DEDUCTABLE FRACTION O F TOTAL CAPITAL INVEST. PROPERTY TAX RATE ( f r a c t i o n / y e a r ) INTERIM REPLACEMENT RATE ( f r a c t i o n / y e a r ) NORMALIZED ACCOUNTING ACRS CLASS: 15-YEAR PROPERTY
I N T E R I M REPLACEMENT ESCALATION R a T E ( f r a c t i o n )
------------
ANNUAL REVEUUE REQUIREk!EWTS ( M I L L I O N DOLLARS)
YEAR .___ 2000.
2001.
2002.
2003.
2004.
200s.
2006.
2007.
2008.
20139.
2010.
201 1 . 2012.
2013.
2014.
2015.
2016.
2017.
2018.
2019.
2020.
2021.
2022.
2023.
2024.
2025.
2026.
2027.
2028.
2029.
RATE RETURN BOOR T A X I TAX BASE OM CAP DEPR DEPR CURR -_-_._ ___.__ _.--- _.___ ._____ 4012.0 455.4 100.3 160.4 133.0
3882.3 440.6 100.3 304.8 75.3 3699.7 419.9 100.3 274.3 79.6 3528.3 400.5 100.3 247.0 83.1
3366.9 382.1 100.3 222.3 8 6 . 1
3214.5 3W.8 100.3 199.9 88.6
3070.3 348.5 100.3 189.5 87.0 2930.0 332.6 100.3 189.5 81.7
2789.7 316.6 100.3 189.5 76.5
2649.4 300.7 100.3 189.5 71.2
2509.0 284.8 100.3 189.5 65.9
2368.7 268.8 100.3 189.5 60.6 2228.4 252.9 100.3 189.5 55.4 2088.1 237.0 100.3 189.5 50.1
1947.7 221.1 100.3 189.5 44.8 1807.4 205.1 100.3 94.5 74.3
1701.9 193.2 100.3 0.0 105.0 1631.0 185.1 100.3 0.0 102.3 1560.0 177.1 100.3 0.0 99.6
1489.1 169.0 100.3 0.0 97.0
1347.3 152.9 100.3 0.0 91.6
1418.2 161.0 100.3 0.0 94.3
1276.4 144.9 100.3 0.0 89.0
1205.5 136.8 100.3 0.0 86.3 1134.6 128.8 100.3 0.0 83.7 1063.7 120.7 100.3 0.0 81.0
992.8 112.7 100.3 0.0 78.3
921.8 104.6 100.3 0.0 75.7 850.9 96.6 100.3 0.0 73.0 780.0 88.5 100.3 0.0 70.3
4 0 . 0.05 4012. .7997
* 02 0.005
REVENUE REWKR. PCUER COST I T A X PROP IMTRM (MILLIOW f ) ( C e n t s I K U H e )
1987. 0 NCMNL I DEFER TAX REPL _ _ _ _ _ _ .___ _.___ 29.4 80.2 21.1
82.3 80.2 22.1
71.1 80.2 23.2
61.1 80.2 24.4
52.1 80.2 25.6
43.8 80.2 26.9
40.0 80.2 28.2
40.0 80.2 29.6
40.0 80.2 31.1
40.0 80.2 32.7
40.0 80.2 34.3
60.0 80.2 36.0
40.0 80.2 37.8
40.0 80.2 39.7
40.0 80.2 41.7
5.2 80.2 43.8
-29.4 80.2 46.0
-29.4 80.2 48.3
-29.4 80.2 50.7
-29.4 80.2 53.2
-29.4 80.2 55.9
-29.4 80.2 58.7
-29.4 80.2 61.6
-29.4 80.2 64.7
-29.4 80.2 67.9
-29.4 80.2 71.3
-29.4 80.2 74.9
-29.4 80.2 78.6
-29.4 80.2 82.6
-29.4 80.2 M . 7
NOnML I ____.__ 819.4
800.8
774.4
749.6
726.5
704.7
684.3
654.5
644.8
625.1
605.6
586.1
566.7
547.4
528.1
509.0
495.3
486.9
478.6
470.4
462.3
454.4
446.6
439.0
431.5
424.2
417.0
410.1
403.3
396.7
SUM OF PRESENT W R T H OF REVENUE REQUIREMEWTS A T STARTUP : 6394.
F I X E 0 CHARGE RATE LEVELIZED PGWER COS1 (FRACTIOW) (Cents /KUHe)
N W I N A L DOLLARS = ,1631 9.05
1987 DOLLARS = ,0962 2.83
._____ 413.8
385.2
354.7
327.1
301.9
278.9
257.9
238 5
220.4
203.5
187.8
173.1
159.4
146.6
134.7
123.7
114.6
107.3
100.4
94.0
88.0 82.4
77.1
72.2
67.6
63.3
59.2
55.5
52.0
48.7
- - - - . - - 11.34
11.08
10.71
10.37
10.05
9.75
9.47
9.19
8.92
8.65
8.38
8.11
7.84
7.57
7.31
7.04
6.85
6.14
6.62
6.51
6.40
6.29
6.18
6.07
5.97
5.87
5.77
5.67
5.58
5.49
1987. I
5.73
5.33
4.91
4.53
4.18
3.86
3.57
3.30
3.05
2.82
2.60
2.39
2.21
2.03
1 .a5 1.71
1.59
1.48
1.39
1.30
1.22
1.14
1.07
1 .oo 0.94 0.88
0.82
0.77
0.72
0.67
Fig. 4 . 3 . Fixed charge rate summary €01- reference PWR/BE power plant

35
Summary of Annual Nonfuel O&M Costs Nuclear PWR Example
O&M COST HODEL NAME PWRBE ESCALATION RATE (fraction/year) 0.05 AVERAGE ONSITE STAFF COST 1987 $/year 36000. before payroll taxes & insurance AVERAGE OFFSITE STAFF COST 1987 $/year 51000. before payroll taxes, insurance, and overhead BASE YEAR FOR COST MODEL 1987.
POWER GENERATION COSTS ( 1987 $million/year) --_____--_---^_-----_________II_________----
ONSITE STAFF ( 520. persons) 20.59
MAINTENANCE MATERIALS FIXED VARIABLE
SUPPLIES AND EXPENSES FIXED VARIABLE
6.24 4.75 1.48
10.29 8.13 2.17
OFFSITE TECHNICAL SUPPORT ( 100. persons) 8.67
SUBTOTAL, DIRECT O&M COSTS FIXED VARIABLE
------- 45 .79
42.14 3.65
ADMINISTRATIVE AND GENERAL COSTS 20” 37 PENSIONS AND BENEFITS 5.96 NUCLEAR REGULATORY FEES 1.25 LIABILITY INSURANCE 0.60 PROPERTY INSURANCE 4.10 REPLACEMENT POWER INSURANCE 1.60 OTHER GENERAL EXPENSES 6.87
TOTAL NONFUEL O&M COSTS FIXED VARIABLE
mills/kWh (without A&G, 1987 $) 6.33 mills/kWh (with A&G, 1987 $) 9.15
Fig. 4 . 4 . Nonfuel O&M c o s t summary for reference PWR/BE power plant

36
Summary of Nuclear Fuel Costs Nuclear PWR Example
MASS BALANCE SET USED LAG TIME (years) NO CREDIT FOR DISCHARGED FISSILE BASE YEAR FOR COST DATA
REFERENCE YEAR PRICES U308 ($/lb) CONVERSION (S/kg) ENRICHMENT ($/SWU) PLUTONIUM ( $ / g m ) FABRICATION ($/Kg) BACK END (reprocessing) ($/kg) WASTE DISPOSAL (mills/kWh)
PRICE ESCALATION RATES U308 CONVERSION ENRICHMENT PLUTONIUM FABRICATION BACK END (reprocessing) WASTE DISPOSAL
LEVELIZED COSTS BY YEAR AND BATCH,
BATCH BATCH COST YEAR
1 2 3 4 5 6 7 8 9 10 11 12 13 14 15 16 17 18 19 20 21 22 23 24 25 26 27 28 29 30 31 32 33 34
28.96 16.13 11.90 3.82 8.59
12.70 13.83 15.28 16.09 17.03 17.99 18.94 19.95 21.02 22.14 23.34 24.60 25.94 27.36 28.86 30.45 32.13 33.92 35.81 3'7.82 39.95 42.21 44.61 47.15 49.85 61.46 80.65
118.80 232.79
2000 2001 2002 2003 2004 2005 2006 2007 2008 2009 2010 2011 2012 2013 2014 2015 2016 2017 2018 2019 2020 2021 2022 2023 2024 2025 2026 2027 2028 2029 2030 2031 2032 2033
M i l ls/kWh
YEARLY COST
15.08 11.83 11.37 12.04 13.30 14.99 16.04 17.07 18.00 18.99 20.01 21.08 22.21 23.41 24.68 26.02 27.44 28.95 30.54 32.23 34.03 35.93 37.94 40.08 42.35 44.76 49.06 56.74 71.58
108.71 0.00 0.00 0.00 0.00
PWREXB 0.5
1987.
23.00 8.00
109.00 0.00
220.00 0.00 1.00
.071
.061
.032
.050
.050
.050
.050
F i g . 4.5. F u e l c o s t summary f o r reference PWR/RE power plant

37
LEVELIZED FUEL CYCLE COSTS, MILLS/KWH
URANIUM PURCHASE CONVERSION PURCHASE ENRICHMENT PURCHASE PLUTONIUM PURCHASE FABR I CAT1 ON URANIUM CREDIT CONVERSION CREDIT ENRICHMENT CREDIT PLUTONIUM SALES REPROCESSING WASTE DISPOSAL
TOTAL
NOMINAL DOLLARS
8.399 0.866 5.485 0.000 2.488 0.000 0.000 0.000 0.000 0.000 3.196
20.433 ------
F i g . 4 . 5 (continued)
1987 DOLtARS
2.627 0.271 1.716 0.000 0.778 0.000 0.000 0.000 0.000 0.000 1.000
6.391 __---_
Input for Levelized Power Generation Costs Nuclear PWR Example
0.1631 FIXED CHARGE RATE PLANT INVESTMENT COST (year 2000 $millions) 4012. DECOMMISSIONING FUND INTEREST RATE 0.070 DECOMMISSIONING COST (1987 $millions) 145.
LEVELIZED FUEL COST (1987 mills/kWh) 6.39 LEVELIZED O&M COST (1987 mills/kWh) 9.15
F I N A L R E S U L T S
LEVELIZED POWER GENERATION COSTS (mi 11 s/kwh)
1987 $ NOMINAL $
CAPITAL O&M FUEL DECOM ~
28.31 9.15 6.39 0.54
44.4
90.5 29.3 2 0 . 4 1.7
141.9 -------
Fig. 4 . 6 . Total levelized power generation cost € o r PWR/BE power plant
4.2 550 MWe Coal-Fired Power Plant
Levelized power generation costs f o r the reference coal-fired power
plant can be calculated by running the following sequence of programs:
1. PLANTCAP
2. FCRATE

38
3 . COALQM
4 . COALCOST
5. LEVEL
These codes can be accessed from t h e main menu of program MAINPWR by
selecting options 2, 3 , 4 , 5, and 1, respectively. After completing
each code, a "99" should be entered at the menu level of the particular
individual code t o return the user to the main menu of MAINPWR.
To start the example calculation, program HAINPWR should be exe-
cuted either directly from DOS o r through the BASIC interpreter (see
Chapter 1). The operating disk drive then must be specified. The main
menu of MAINPWR will then appear; the user should enter a 6 , followed by
a C in order to change the plant type to a coal-fired plant.
PLANTCAP: Selection of menu item 2 will allow the capital invest-
ment cost to be calculated using PLANTCAP. When the menu for PLANTCAP
appears (see Fig. 2.11, all of the default values will be set for the
reference coal-fired case. A 0 should then be entered, along with a run
identification if the default values are desired by the user. Output
from PLANTCAP, as seen in Fig. 4.7, shows both the input parameters and
the results of the calculations. The plant capital investment cost in
millions of nominal dollars (2887) will be used as input t o both LEVEL
and FCKATE. FCRATE will also require the tax deductible fraction of the
total capital investment (.8559). Entering a "99" will cause the main
menu of MAINPWR to appear on the screen.
FCKATE: Selection of item 3 of the main menu will cause FCRATE
to be selected. In FCRATE, items 11 and 12 (see Fig. 2.91, the initial
capiLal investment cost and the tax deductible fraction of the total
capital investment, are from the output of PLAMTCAP; these values are
the default values. Item 5, the tax depreciation schedule (schedule
3: 20-year property) is correct for the coal-fired example. Note that
item 18 is the total plant power level (in this case: 2 units x
550 MWe/unit = 1100 We). All of the data are correct for the example,
so a 8 should be entered to begin execution.
Output from program FCRATE is printed, as shown in Fig. 4.8. The
year-by-year revenue requirements could have been omitted by changing

C A P I T A L C O S T E S T I M A T E
VERSION 09-01-1988 RUN DATE 0 9 - 2 0 - 1 9 8 8
C o a l - f i r e d E x a m p l e NECDB-1987 COST B A S I S COALS POWER PLANT YEAR O F STEAM SUPPLY SYSTEM ORDER YEAR O F CONSTRUCTION PERMIT YEAR O F COMMERCIAL OPERATION YEAR O F CONSTANT DOLLAR OUTPUT COST O F MONEY DURING CONSTRUCTION (AFUDC RATE) ESCALATION RATE ( f r a c t i o n / y e a r ) GENERAL INFLATION RATE ( f r a c t i o n ) CONTINGENCY ( f r a c t i o n ) NET RATING PER U N I T ( W e ) NUMBER O F U N I T S AT S I T E PLANT LOCATION
DIRECT COSTS ($MILLIONS 1987 2 0 LAND 2 1 STRUCTURES 2 2 REACTOR PLANT 2 3 TURBINE PLANT 2 4 ELECTRIC PLANT 2 5 MISC PLANT 2 6 M A I N COND HEAT R E J
SUBTOTAL DIRECTS
INDIRECT COSTS 9 1 CONSTR SERVICES 9 2 HOME O F F I C E ENGRG 93 F I E L D O F F I C E 94 OWNER COSTS
SUBTOTAL INDIRECTS
1 9 9 4 . 0 0 1 9 9 5 . 7 5 2000.00 1 9 8 7 .
.1135
.0500
.050
. l o o 0 550.
CHICAGO 2
DOLLARS) 5.
108. 4 3 0 . 199.
67. 35. 4 2 .
8 8 7 .
108. 4 3 . 4 0 .
108.
SUBTOTAL DIRECTS AND INDIRECTS CONTINGENCY ALMWANCE TOTAL OVERNIGHT COSTS BEFORE ESCALATION
ESCALATION BEFORE STEAM SUPPLY ORDER ESCALATION AFTER STEAM SUPPLY ORDER TOTAL ESCALATED DIRECT AND INDIRECT COSTS
TOTAL INTEREST DURING CONSTRUCTION
TOTAL CAPITAL INVESTMENT
PLANT CAPITAL INVESTMENT COST NOMINAL DOLLARS (2624.$ /KWe) CONSTANT 1987 DOLLARS ( 1 3 9 2 .$/We)
TAX DEDUCTIBLE FRACTION I N TOTAL CAPITAL =
2 9 8 .
1185. 118.
1 3 0 3 .
530. 3 2 7 .
2160.
726.
2887.
2 8 8 7 . 1531.
- 8 5 5 9
Fig. 4.7. Capital investment c o s t for reference coal-fired power plant (PLANTCAP)
the default value of item 7 in the menu from a Y to a N. The nominal
dollar fixed charge rate (.1651) will be used as input to LEVEL. A 99
entered at the menu Level than returns the user to the main menu of
MAINPWR.
COALOM: Entering a 4 at the main menu of MAINPWR causes CQALOM to
be selected. All of the default data in the menu (see Fig. 2 . 3 ) is

40
F I X E D C H A R G E R A T E
VERSION 05-13-1988 RUN DATE 09-20-1988
Coal -fired Example
INPUT DATA
PROJECT LIFE (years) 40. LEVELIZINC PERIOD (years) 30. INFLATION RATE 0.05 INTERIM REPIACEMENT ESCALATION RATE (fraction) 0.05 EFFECTIVE INCOME TAX RATE . 3 6 6 4
INITIAL CAPITAL INVESPMLAT AT STARTUP, MILLION $ TAX DEDUCTABLE FRACTION OF TOTAL CAPITAL INVEST. .a559 INTEREST RAPE ON DEBT .0970
2887.
RETURN ON PREFERRED STOCK .0900 .1400 .5000
RETURN ON COXMON STOCK DEBT FRACTION PREFERRED STOCK FRACTION . l o o 0 COMNON STOCK FRACTION .4000 PROPERTY TAX RATE (fraction/year) .02 INTERIM REPLACEMENT RATE (fractlon/year) 0.005 START OF OPERATIOM(YEAR) 2000.00 REFERENCE YEAR FOR CONSTANT DOLLARS 1987.00 REACTOR POWER LEVEL, NWe LIFETIME AVERAGE CAPACITY FACTOR NORMALXZED ACrnllNTTNC ACRS CLASS:
- - -. . - -. . - 20-YEAR PUBLIC UTILITY PROPERTY
1100. 0.75
ANWUAL RFYFMUF REMI IREYENTS (MILLION OOLLARS)
REVEWUE R E W I R . POUER cosr RATE RETURN B r a TAX I TAX I TAX PROP I N T W (MILLIW 3) (Cents/KWHe)
Y E A R BASE M( CAP DEPR D E P I CURR DEFER TAX REPL WCHWL f 1987. f NCHNL f 1987. f .... ...... ...... . 2000. 2887.0 327.7
2001. 2803.5 318.2 2002. 2688.6 305.2
2003. 2578.6 292.7
2004. 2473.1 280.7
2005. 2371.9 269.2 2006. 2274.5 258.2
2007. 2180.7 247.5 2008. 2090.2 237.2
2009. 2U00.3 227.0
2010. 1910.4 216.8
2011. 1820.5 206.6
2012. 1730.5 196.4
2013. 1640.6 186.2
2014. 1550.7 176.0 2015. 1460.8 165.8
2016. 1370.9 155.6
2017. 1260.9 145.4
2018. 1191.0 135.2
2019. 1101.1 125.0
2020. 1011.2 114.8
2021. 941.3 106.8
2022. 891.7 101.2
2023. 842.2 95.6 2024. 792.7 90 .0
2025. 743.1 84 .3 2026. 693.6 78.7 2027. 644.0 73.T 2028. 594.5 67.5
2029. 544.9 61.9
.... ..... _ _ _ _ _ _ 72.2 92.7 103.2 72.2 178.4 68 .7
72.2 165.1 69.2
12.2 152.7 69.6
72 .2 141.1 69.9 72.2 130.5 70.0
72.2 120.8 69 .9
72.2 111.7 69 .7
72.2 110 .2 66.8 72.2 110.2 63.5
12.2 110.2 60.1
72.2 110.2 56 .7
72.2 110.2 53.3 72.2 110.2 49.9
72.2 110.2 46.6
R . 2 110.2 43.2
72.2 110.2 39.8
72.2 110.2 36.4
72.2 110.2 33.0 12.2 110.2 29.7
72.2 55.6 46.3
72.2 0.0 64.0 72.2 0.0 62.2
72.2 0.0 60.3 72.2 0 .0 58.4 72.2 0.0 56.6
72.2 0.0 54 .7
72.2 0.0 52.9
72.2 0.0 51.0
72.2 0.0 49.1
.... ..... ..... ....... 11.3 57.7 15.2 587.3
62.7 57.7 15.9 575.4 37.8 57.7 16.7 558.9
33.3 57.7 17.5 543.1 29.1 57.7 18.4 528.0 25.2 57.7 19.3 513.6
21.6 57.7 2 0 . 5 499.9
18.3 57.7 21 .3 486.7
17.7 57.7 22.4 474.1 17.7 57.7 23.5 461.7 17.7 57.7 24 .7 449.3 17.7 57.7 25.9 4 M . 9
11.7 57.7 27.2 424.6 17.7 57.7 28.6 412.4 17.7 57.7 30.0 400.2 17.7 57.7 31.5 388.1 17.7 57.7 33.1 376.1
17.7 57.7 34.7 364.2 1 7 . 7 5 7 . 7 36.5 352.4 1 7 . 7 5 7 . 7 38.3 340.6 - 2 . 3 57.7 40.2 328.9
-22 .6 57.7 42.2 320.4 -22 .6 57.7 64.3 315.0
-22 .6 57.7 46.6 309.7 -22 .6 57.7 48.9 301.6 -22 .6 57.7 51.3 299.5
-22 .6 57.7 53.9 294.6 -22 .6 57.7 56.6 289.8 -22 .6 57.7 59.4 285.2
-22 .6 57.7 62.4 280.7
SUM OF ?RESENT VORTM OF REVENIJE REQUIREMEUTS AT STARTUP = 4660.
FIXED CHARGE RAT6 LEVELlZED PCWER COST
(FRACTION) (CenWKUHe)
NWIMAI. DOLLARS = .1651
1987 DOLLARS = .0974 6.M)
2.06
296.6
276.8
256.0
236.9
219.4
203.3
188.4
174.7
162.1
150.3
139.3
129.0
119.4
110.5
102.1
94 .3
87.0
80.3
73.9
68.1
62.6
58.1 54.4
50.9
47.7
44.7
41.8
39.2
36.7
34.4
. . . . . . . . . 8.13
7.96
7.73
7.51
7.31
7.11
6.92
6.73
6.56
6.39
6.22
6 . 0 5
5 .88
5.71
5.54
5.37
5.20
5.04
4 .88
4.71
4.55
4.43
4.34
4.29
4.21
4.14
4.08
4.01
3.95 3.88
4.10
5.83
3.54
3.28
3.04
2.81
2.61
2.42
2.24
2.08
1.93
1.79
1.65
1.53
1.41
1.30
1.20
1.11
1.02
0.94
0.87
0.80
0.75
0.70
0.66
0.62
0.58
0.54 0.51
0 .48
Fig. 4.8. Fixed charge rate calculation output for reference coal- fired power p l a n t (FCRATE)

41
appropriate for the example, so a 0 should be entered to run COALOM.
The output from COALOM, shown in Fig. 4 . 9 , is then printed. All of the
values in the output are in constant dollars. The total levelized non-
fuel ObM costs with A & G in mills/kWh (5.92) will be needed by LEVEL.
Entering a 99 causes the main menu for MAINPWR to appear.
SUUMARY OF ANNUAL NONFUEL OSM COSTS COAL-FIRED POWER PLANTS
VERSION 06-30-1988 RUN DATE 09-20-1988
Coal-fired Example COST DATA MODEL USED FOR ANALYSIS NET RATING O F EACH UNIT ( W e ) NUMBER OF UNITS PER PLANT BASE U)AD CAPACITY FACTOR ESCALATION RATE (fraction/year) INFLATION RATE(fraction/year) SULFUR (decimal) ASH (decimal) HEATING VALUE ( B T U / l b ) THERMAL INPUT PER UNIT ( M W t ) PLANT NET HEAT RATE (BTU/kWh) PLANT NET EFFICIENCY (decimal) YEAR OF STARTUP REFERENCE YEZLR FOR COST ESTIMATES REFERENCE YEAR FOR CONSTANT DOLLARS ANNUAL NET GENERATION (million kWh) ------------
DIRECT COSTS ( 1987 $million/year) STAFF ONSITE (295. PERSONS AT $30888.)
MAINTENANCE MATERIAL FIXED VARIABLE
SUPPLIES AND EXPENSES FIXED VARIABLE - PLANT - LIMESTONE - ASH, FGD SLUDGE
O F F S I T E SUPPORT SERVICES
INDIRECT COSTS ( 1987 $million/year) ADMINISTRATIVE AND GENERAL
FRINGE BENNEFITS PROPERTY INSURANCE OTHER AG
COSTS ( 1987 $million/year) TOTAL FIXED DIRECTS AND INDIRECTS TOTAL VARIABLE DIRECTS AND INDIRECTS TOTAL NONFUEL OM
UNIT COSTS (mills/kwh) FIXED DIRECTS AND INDIRECTS VARIABLE DIRECTS AND INDIRECTS TOTAL NONFUEL OM (w/o AG 1987 dollars) TOTAL NONFUEL OM (w/ AG 1987 dollars)
COALWET 550.
2. * 75
0.05 0.050
.035
.116 11500. 1596. 9900.
2000.
1987. 7232.
. 3 4 5
1987.
9.11
4 . 9 3 3.78 1.14
19.50 5.30 1.05 6.28 6.88
1.07
8.23 2.54 0.50
5.19
27.5 15..3
4 2 . 8
3.80 2.12
4.78 5.92
Fig. 4 . 9 . Nonfuel O&M c o s t s for reference coal-fired power plant with wet limestone scrubber (COALOM)

42
COALCOST: Entering a 5 at this point causes COALCOST to be
selected. The default values are correct for the example case, so a 0
should be input t o execute the program. The key parameter in the output
of COALCOST (Fig. 4.10) is the levelized cost of coal in constant dol-
lars (20.88 mills/kWh) that is used in LEVEL. Entering a 99 causes the
main menu from MAINPWR t o appear.
LEVEL: LEVEL can be accessed by entering a 1 at the main menu of
MAINPWR. The user may then input a run identification or a n u l l line.
The following prompt then appears:
The calculation of the total levelized power generation costs
requires that the levelized values of capital costs, fuel costs, and 06rH
costs, as well as the fixed charge rate, be ~QQM. It i s possible to
generate this necessary data using this program, or if these values are
already b o r n , they may be inputed separately.
Do you vish to calculate the data using the integrated progr
Y = Yes
w = Ma
Select the appropriate response.
?
Since the user does already know the values in question, an "N"
should be input in response to the prompt. The menu for program LEVEL
L E V E L I Z E D C O A L C O S T
RUN DATE 09-20-1988
INPUT DATA
C o a l - f i r e d E x a m p l e PRICE OF COAL I N DOLIMS PER MILLION BTU REFERENCE YEAR FOR PRICE OF COAL REFERENCE YEAR FOR CONSTANT DOLLARS YEAR OF PLANT STARTUP PLANT L I F E (years) GNP INFLATION RATE COAL PRICE ESCALATION RATE ( f r a c t i o n ) EFFECTIVE COST OF MONEY PLANT NET HEAT RATE (Btu/kWh) ----------I
1.55 1987 1987 2000
30 0.050 0.0626 0.0957 9900
LEVELIZED COST OF COAL CONSTANT 1987 DOLLARS NOMINAL DOLLARS
m i 1 ls/kWh 20.88 66.75
Fig. 4.10. Levelized coal cost for reference coal-fired power plant (COALCOST)

43
then appears on the screen (see Fig. 2.11). Item 15, the plant type,
has already been specified in the main menu of MAINPWR. Item 11 is the
capital investment cost in millions of nominal dollars (2887) from
PLANTCAP, item 12 is the fixed charge rate (.1651) from FCRATE, item 13
is the levelized O&M cost in constant dollar mills/klrlh (5.921, and item
14 is the levelized coal cost in constant dollar mills/kWh (20.88). All
of the data are correct for the example, so a 0 should be input. The
final results are then printed as shown in Fig. 4.11.
L E V E L I Z E D P O W E R G E N E R A T I O N C O S T C O D E
VERSION 09-01-1988 RUN DATE 09-20-1988
Coal-fired Example PLANT TYPE COAL YEAR OF FIRST COMMERCIAL OPERATION 2000. RATING PER UNIT ( W e ) 5 5 0 . UNITS PER PLANT 2 . CAPACITY FACTOR 0.75 ANALYSIS LIFE (years) 3 0 . GNP INFLATION RATE 0.050 EFFECTIVE INCOME TAX RATE 0.3664
CAPITALIZATION FRACTION RATE DEBT 0.500 0.097 PREFERRED STOCK 0. L O O 0.090 COMMON EQUITY 0.400 0.140
EFFECTIVE COST OF MONEY 0.0957 CONSTANT DOLLAR LEVELIZED COST YEAR 1987. FIXED CHARGE RATE 0.1651 PLANT INVESTMENT COST (year 2000 $millions) 2887. DECOMMISSIONIWG FUND INTEREST RATE 0.070 DECOMMISSIONING COST (1987 $millions) 25. LEVELIZED O&M COST (1987 mills/kwh) 5.92 LEVELIZED FUEL COST (1987 mills/kwh) 20.88
LEVELIZED POWER GENERATION COSTS (mills/kWh)
1987 $ NOMINAL $
CAPITAL O&M FUEL DECOM .
20.63 5.92 20.88
0.09 .------ 47.5
66.0 18.9 66.8 0.3
151.9 I------
Fig. 4*11. Levelized power generation c o s t s f o r reference coal- fired power plant in midwest region (LEVEL)
4.3 1100 MWe Nuclear (PWR) Power Plant
Power generation costs may also be calculated using the set of
individual PC codes, outside of program MAINPWR. This section describes

44
the procedure for calculating power costs with the individual codes for
the reference PWR plant. The following sequence of programs is exe-
cuted:
1. PLANTCAP
2. FCRATE
3 . NUCLOM
4. NFUEL
5 . LEVEL
All of the default values in each program will be correct for the
reference plant, so the user needs only to enter a 8 to signify that the
data are correct in each program
PLANTCAP: The output from PLANTCAP is shown in Fig. 4.12. The
total capital investment cost in millions of nominal dollars ( 4 0 1 2 ) and
the tax deductible fraction in total capital ( . 7 9 9 7 ) will be used as
input for FCRATE. The total capital investment cost will also be u s e d
by LEVEL.
--__I
FCRATE: Output from FCRATE, which consists of two pages, is shown
in Fig. 4.13. The first page lists the input parameters. The second
page begins with a tabulation of the annual revenue requirements. The
sum of the present worth (to startup) of the revenue requirements is
shown next followed by the constant and nominal dollar Fixed Charge
Rates (FCR) and cost of power [cents/kWh(e)] attributable to the capital
investment. The nominal dollar FCR (0.1631) is needed for input to the
LEVEL program. Note that the year-by-year power costs in the last two
columns of the revenue requirements table are for the capital investment
portion only. The annual revenue requirements printout may be sup-
pressed through menu Item 7, in which case the fixed charge rates will
be printed on the first page of output.
NUCLOM: Output from NUCLOM, which consists of two pages, is shown
in Fig. 4.14. The input data are listed on the first page. The second
page give a breakdown of the c o s t s in millions OF dollars, and finally,
the cost in mills/kWh(e) with and without AM. The value for the total
non-fuel O&M cost [9.15 mills/kWh(e)] i s required as input to the LEVEL
Program *

45
C A P I T A L C O S T E S T I M A T E
VERSION 09-01-1988 RUN DATE 09-20-1988
NECDB-1987 COST BASIS PWRBEl2 POWER PLANT YEAR OF STEAM SUPPLY SYSTEM ORDER YEAR OF CONSTRUCTION PERMIT YEAR OF COMMERCIAL OPERATION YEAR OF CONSTANT DOLLAR OUTPUT COST OF MONEY DURING CONSTRUCTION (AFUDC RATE) ESCALATION RATE ( f r a c t i o n / y e a r ) GENERAL INFLATION RATE ( f r a c t i o n ) CONTINGENCY ( f r a c t i o n ) NET RATING PER UVIT ( m e ) NUMBER OF UNITS AT SITE PLANT LOCATION
1992.00 1994.00 2000.00 1987.
,1135 .0500 .050 -1000
1101).
CHICAGO 1
DIRECT COSTS ($MILLIONS 1987 20 LAND 2 1 STRUCTURES 2 2 REACTOR PLANT 23 TURBINE PLANT 24 ELECTRIC PLANT 25 MISC PLANT 26 MAIN COND HEAT REJ
SUBTOTAL DIRECTS
DOLLARS) 5.
184. 290. 213. 76. 44. 4 6 .
858,
INDIRECT COSTS 91 CONSTR SERVICES 205. 92 HOME OFFICE ENGRG 211. 93 FIELD OFFICE 109. 94 OWNER COSTS 138.
SUBTOTAL INDIRECTS
SUBTOTAL DIRECTS AND INDIRECTS CONTINGENCY ALLOWANCE TOTAL OVERNIGHT COSTS BEFORE ESCALATION
ESCALATION BEFORE STEAM SUPPLY ORDER ESCALATION AFTER STEAM SUPPLY ORDER TOTAL ESCALATED DIRECT AND INDIRECT COSTS
TOTAL INTEREST DURING CONSTRUCTION
TOTAL CAPITAL INVESTMENT
PLANT CAPITAL INVESTHENT COST NOMINAL DOLLARS (3647.$/IWe) CONSTANT 1987 DOLLAW (1934. $ / W e )
TAX DEDUCTIBLE FRACTION IN TOTAL CAPITAL =
663.
1521. 152. 1673.
462. 4 7 3 . 2609.
1403.
4012.
4012. 2128.
.7997
Fig. 4.12. Capital investment costs for reference PWR/BE power plant (PLANTCAP)
NFUEL: The three pages of output from NFUEL are shown in
Fig. 4.15. A listing of the input data is given on the first page. The
second page, which is optional. upon selection of menu Item 4 , gives the
levelized costs for each fuel batch and year of operation. The final
page gives a breakdown of the levelized fuel cycle c o s t in both nominal

46
F I X E D C H A R G E R A T E
VERSION 05-13-1988 RUN DATE 09-20-1988
INPUT DATA
PRaJECT LIFE (years) LEVELIZING PERIOD (years) INFIATION RATE INTERIM REPLACEMENT ESCAIATION RATE (fraction) EFFECTIVE INCOME TAX RATE INITIAL CAPITAL INVESTMENT AT STARTUP, MILLION TAX DEDUCTABLE FRACTION OF 'TOTAL CAPITAL INVES7 INTEREST RATE ON DEBT RETURN ON PREFERRED STOCK RETUKN ON COMXON STOCK
INITIAL CAPITAL INVESTMENT AT STARTUP, MILLION TAX DEDUCTABLE FRACTION OF 'TOTAL CAPITAL INVES7 INTEREST RATE ON DEBT RETURN ON PREFERRED STOCK RETUKN ON COMXON STOCK DEBT FRACTION PREFERRED STOCK FRACTION
REACTOR POWER LEVEL, m e LIFETIME AVERAGE CAPACITY FACTOR NORHALI ZED ACCOUNT1 NG ACRS CIASS: 15-YEAR PROPERTY
ANNUAL REVENUE REWIPEYEYTS ( M I L L I O 1 DOLLARS)
4 0 . 30.
0.05 0.05 3 6 6 4
$ 4012. '. ,7997
,0970 0900 ,1400 .5000 . l o o 0 . 4 0 0 0
. 0 2 0 . 0 0 5
2 0 0 0 . 0 0 1987.00
1100. 0 . 7 5
YEAR .... 2000.
2001.
7002.
2003.
2004.
2005.
2006.
2007.
2008.
2009.
2010.
2011.
2012.
2013.
2014.
2015.
2016.
2017.
2018.
2019.
2020.
2021.
2022.
2023.
2024.
2025.
2026.
2027.
2028.
2029.
RATE RETURN B I X U TAX I TAX BASE 01 CAP DEPR OEPR cuai ...... ...... ..... ..... ......
6012.0 455.4 100.3 160.4 133.0
3882.3 440.6 100.3 304.8 75.3 3699.7 419.9 100.3 214.3 79.6
3528.3 400.5 100.3 247.0 85.1 3366.9 382.1 100.3 222.3 86.1
3714.5 W.8 100.3 199.9 88.6
3070.3 348.5 100.3 189.5 87.0
2QSO.O 332.6 100.3 189.5 81.7
2789.7 316.6 100.3 189.5 76.5
2649.4 300.7 100.3 189.5 71.2
2509.0 284.8 100.3 189.5 65.9
2368.7 268.8 100.3 189.5 60.6
2228.4 252.9 100.3 189.5 55.4
2 W . 1 237.0 100.3 189.5 50.1
1947.7 221.1 100.3 189.5 44.8
1807.4 205.1 100.3 94.5 74.3
1701.9 193.2 100.3 0.0 105.0
1631.0 185.1 100.3 0.0 102.3
1560.0 177 .1 100.3 0.0 89.6
1489.1 169.0 100.3 0 .0 97.0
1418.2 161.0 100.3 0.0 91.3
1347.3 152.9 100.3 0 .0 91.6
1276.4 144.9 100.3 0.0 89.0
1205.5 136.8 100.3 0.0 M.3
1134.6 128.8 100.3 0.0 83.7
1063.7 120.7 100.3 0.0 81.0
992.8 112.7 100.3 0 .0 78.3
921.8 104.6 100.3 0.0 75.7
850.9 96.6 100.3 0 .0 73.0 780.0 8 8 . 5 100.3 0.0 70.3
I TAX PROP I N T R Y
DEFER TAX REPL ..... ..... .....
29.4 80.2 21.1
82.3 80.2 22.1
71.1 80.2 23.2
61.1 80.2 24.4
52.1 80.2 25.6
43.8 80.2 26.9
60.0 80.2 28.2
LO.0 80.2 29.6
40.0 80.2 31.1
40.0 80.2 32.7
40.0 80.2 S . 3 40.0 80.2 36.0
40.0 80.2 37.8
60.0 80.2 39.7
60.0 80.2 41.7
5.2 80.2 43.8
-79.4 80.2 46.0
-29.4 80.2 48.3
-29.4 80.2 50.7
-29.4 80.2 53.2
-29.4 80.2 55.9
-29.4 80.2 58.7
-29.4 80.2 61.6
-29.4 80.2 64.7
-29.4 80.2 67.9
-29.4 80.2 71.3
-29.4 80.2 74.9
-29.4 80.2 78.6
-29.4 80.2 82.6
-29.4 80.2 E4.7
REVEMUE REQUIR. ( M I L L I C U I )
K U U L t 1987. f ....... ...... 819.4 413.8
ma.8 ~ 1 5 . 2
771.4 354.7
749.6 327.1
726.5 301.9
704.7 278.9
681.3 257.9
M4.5 238.5
u 4 . a 220.4
625.1 203.5
605.6 187.8
586.1 173.7
566.7 159.4
547.4 146.6
528.1 134.7
509.0 123.7
495.3 114.6
486.9 107.3
478.6 100.4
470.4 94.0
462.3 08.0 456.4 82.4
446.6 77.1
439.0 72.2
431.5 67.6
424.2 63.3
417.0 59.2
410.1 55.5
403.3 52.0
396.7 48.7
SbM OF PRESENT UORTH OF REVENUE R E W I R E H E M T S A T STARTUP = 6394
F I X E D CHARGE RATE L E V E L l Z E D POVER COS1
( F R A C T I W ) (CentslKUne)
NCMlNbL DOLLARS = .1631
1987 DOLLARS = .OW2 9.05
2.83
P M R COST
(CmtS/KWHe) YcllWL I 1987. I ......- ......
11.34 5.73
11.C8 5.33
10.71 4.91
10.37 4.53
10.05 4.18
9.75 3.86 9.47 3.57
9.19 3.30
8.92 3.05
8.65 2.82
8.38 2.60
8.11 2.39
7.84 2.21
7.57 2.03
7.31 1.86
7.04 1.71
6.05 1.59
6.74 1.48
6.62 1.39
6.51 1.30
6.40 1.22
6.29 1.14
6.18 1.07
6.07 1.00
5.97 0.96
5.07 0.64 5.77 0.82
5.67 0.77
5.58 0.72
5.49 0.67
Fig. 4.13. Fixed charge rate calculation output for reference PWR/BE power plant (FCBATE)

47
SUMMARY O F ANNUAL NONFUEL O&U COST FOR NUCLEAR POWER PLANTS
VERSION 09-01-1988 RUN DATE 0 9 - 2 0 - 1 9 8 8
O&U COST MODEL NAME PWRBE U N I T NET RATING, UWe 1100. NUMBER OF U N I T S PER PLANT 1. CAPACITY FACTOR (fraction) .75 ESCALATION RATES, fraction
WAGES AND SALARIES .05 MATERIALS AND S U P P L I E S . 0 5 NUCLEAR REGULATORY FEES .05 NUCLEAR INSURANCE .05
AVERAGE ONSITE S T A F F COST 1987 $/year 3 6 0 0 0 . before payroll taxes & insurance AVERAGE O F F S I T E S T A F F COST 1987 $/year 51000. before payroll taxes, insurance, and overhead ANNUAL NET GENERATION, million kWh 7 2 3 2 . YEAR OF STARTUP 2000. BASE YEAR FOR COST MODEL 1987. REF. YEAR FOR CONSTANT DOLLAR 1987. INFLATION RATE . a50 -__-----__------
POWER GENERATION COSTS ( 1987 Smillion/year)
ONSITE S T A F F ( 5 2 0 . persons) 2 0 . 5 9
MAINTENANCE MATERIALS FIXED VARIABLE
S U P P L I E S AND EXPENSES F I X E D VARIABLE
6 . 2 4 4 . 7 5 1.48
10.29 8 . 1 3 2.17
O F F S I T E TECHNICAL SUPPORT ( 100. persons) 8.67
SUBTOTAL, DIRECT O&M COSTS F I X E D VARIABLE
---I--_
4 5 . 7 9 42.14
3 . 6 5
ADMINISTRATIVE AND GENERAL COSTS 20.37 PENSIONS AND BENEFITS 5.96 NUCLEAR REGULATORY FEES 1 . 2 5 L I A B I L I T Y INSURANCE 0.60 PROPERTY INSURANCE 4 . 1 0 REPLACEMENT POWER INSURANCE 1 .60 OTHER GENERAL EXPENSES 6.87
TOTAL NONFUEL O&M COSTS F I X E D VARIABLE
66.17 6 2 . 5
3.7
mills/kwh (without A&G, 1 9 8 7 $) 6.33 mills/kwh (with A&G, 1 9 8 7 $) 9.15
Fig. 4.14. Nonfuel O&M costs for reference PWR/BE nuclear power plant (NUCLOM)
and constant dollars. The constant dollar fuel cycle cost r6 .39 mills/
kWh(e)] is required as input to the LEVEL Program.
LEVEL. The output from LEVEL, containing the total levelized power
generation cost, is shown in Fig. 4.16. The capital investment cost, _I_
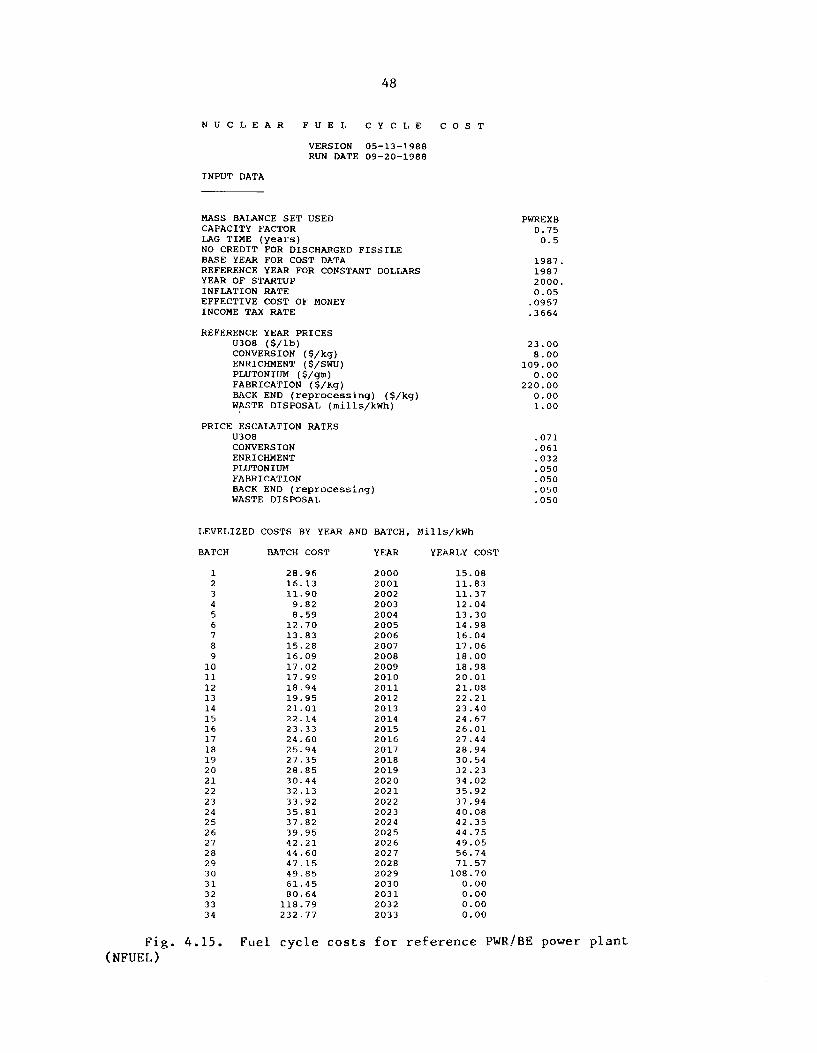
48
N U C L E A R F U E L C Y C L E C O S T
VERSION 05-13-1988 RUN DATE 09-20-1988
INPUT DATA
MASS BALANCE S E T USED CAPACITY FACTOR
NO CREDIT FOR DISCHARGED F I S S I L E BASE YEAR FOR COST DATA REFERENCE YEAR FOR CONSTANT DOLLARS YEAR O F STARTUP INFLATION RATE EFFECTIVE COST OF MONEY INCOME TAX RATE
REFERENCE YEAR P R I C E S U308 ( $ / l b ) CONVERSION ($/kg) ENRICHMENT ($/SWU) PLUTONIUM ( $ / g i n ) FABRICATION ($/Kg) BACK END (reprocessing) ( $ / k g ) WASTE DISPOSAL ( m i l l s / k W h )
LAG TIME (years)
P R I C E ESCALATION RATES U308 COWERS ION ENRICHMENT PMJTONIUM FABRICATION BACK END (reprocessing) WASTE DISPOSAL
LEVELIZED COSTS BY YEAR AND BATCH, Mil ls /kWh
BATCH
1 2 3 4 5 6 7 8 9 10 11 12 13 14 15 16 17 18 19 20 21 22 23 24 25 26 27 28 29 30 31 32 33 34
Fig. 4.15. ( N F U E L )
BATCH COST
28.96 16.13 11.90 9.82 8.59
12.70 13.83 15.28 16.09 17.02 17.99 18.94 19.95 21.01 22.14 23.33 24.60 25.94 27.35 28.85 30.44 32.13 33.92 35.81 37.82 39.95 42.21 44.60 47.15 49.85 61.45 80.64
118.79 232.77
YEAR
2000 2001 2002 2003 2004 2005 2006 2007 2008 2009 2010 2011 2012 2013 2014 2015 2016 2017 2018 2019 2020 2021 2022 2023 2024 2025 2026 2027 2028 2029 2030 2031 2032 2033
YEARLY COST
15.08 11.83 11.37 12.04 13.30 14.98 16.04 17.06 18,OO 18.98 20.01 21.08 22.21 23.40 24.67 26.01 27.44 28.94 30.54 32.23 34.02 35.92 37.94 40.08 42.35 44.75 49.05 56.74 71.57
108.70 0.00 0.00 0.00 0.00
PWREXB 0.75 0.5
1987. 1987 2000. 0.05 .0957 .3664
23.00 8.00
109.00 0.00
220.00 0.00 1.00
.071
.061
.032
.050
.050
.050
.050
Fuel cycle costs for reference PWR/BE power plant
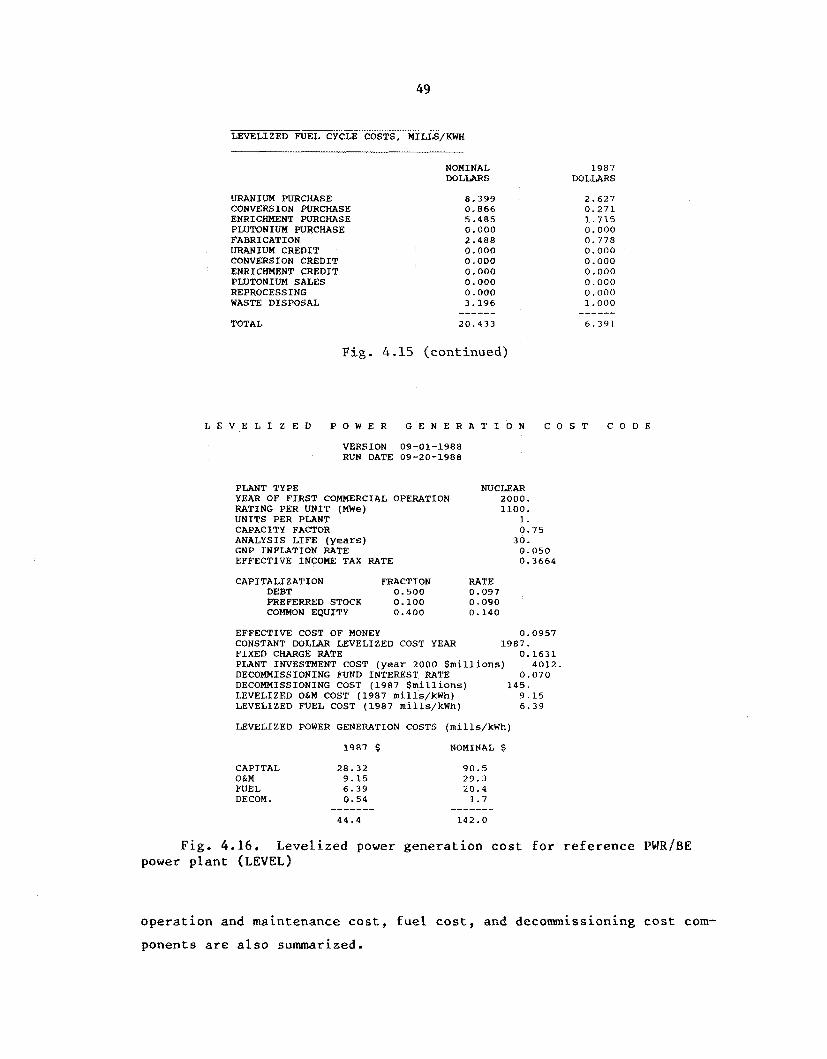
LEVELIZED FUEL CYCLE COSTS, MILLS/KWH
URANIUM PURCHASE CONVERSION PURCHASE ENRICHMENT PURCHASE PLUTONIUM PURCHASE FABRICATION URANIUM CREDIT CONVERSION CREDIT ENRICHMENT CREDIT PLUTONIUM SALES REPROCESSING WASTE DISPOSAL
TOTAL
NOMINAL DOLLARS
8 I 399 0.866 5.485 0.000 2.488 0.000 0.000 0.000 0.000 0.000 3.196
20.433 ------
1987 DOLLARS
2.627 0.271 1.715 0.000 0.778 0.000 0.000 0.000 0 .000 0 .000 1 .000
6.391
Fig. 4.15 (continued)
L E V E L I Z E D P O W E R G E N E R A T I O N C O S T C O D E
VERSION 09-01-1988 RUN DATE 09-20-1988
NUCLEAR PLANT TYPE YEAR OF FIRST COMMERCIAL OPERATION 2000. RATING PER UNIT ( m e ) 1100. UNITS PER PLANT 1. CAPACITY FACTOR 0.75 ANALYSIS LIFE (years) 30. GNP INFLATION RATE 0.050 EFFECTIVE INCOME TAX RATE 0.3664
CAPITALIZATION FRACTION RATE DEBT 0.500 0.097 PREFERRED STOCK 0.100 0.090 COMHON EQUITY 0.400 0.140
EFFECTIVE COST OF MONEY 0.0957 CONSTANT DOLLAR LEVELIZED COST YEAR 1987. FIXED CHARGE RATE 0.1631 PLANT INVESTMENT COST (year 2000 $millions) 4012. DECOMMISSIONING FUND INTEREST RATE 0.070 DECOMMISSIONING COST (1987 $millions) 145. LEVELIZED O&M COST (1987 mills/kWh) 9.15 LEVELIZED FUEL COST (1987 rnills/kWh) 6.39
LEVELIZED POWER GENERATION COST5 (mills/kWh)
1987 $ NOMINAL $
CAPITAL 28.32 90.5 O&M 9.15 29.3 FUEL 6.39 20.4 DECOM. 0.54 1.7
44.4 142.0 ------- -------
Fig. 4.16. Levelized power generation cost f o r reference PWR/BE power plant (LEVEL)
operation and maintenance cost, fuel cost, and decommissioning cast com-
ponents are a l s o summarized.

50
REFERENCES
1.
2.
3.
4.
5 .
6.
7.
C. R. Hudson 11, CONCEPT-5 User's Manual, ORNL-5470, Oak Ridge National Laboratory (January 1979).
M. L. Myers, L. C, Fuller, and H. I. Bowers, Non-fuel Operational and Maintenance Costs f o r Large Steam-Electric Power Plants - 1982, NUREG/CR-2844 (ORNL/TM-8324), Oak Ridge National Laboratory (September 1982).
H . I. Bowers, L. C. Fuller, and M. Le Myers, Cost Estimating Rela- tionships f o r Nuclear Power Plant Operations and Maintenance, QRML/TM-10563, Oak Ridge National Laboratory, November 1987.
J. G. Delene and 0, W. Herman, REFCO-83 User's Manual, NUREG/CR-3800 (ORNL/TM-9186), Oak Ridge National Laboratory (June 1984).
U.S . Department of Energy, Office of Nuclear Energy, "Nuclear Energy Cost Data Base, A Reference Data Base f o r Nuclear and Coal-Fired Power Plant Power Generation Cost Analysis" (DOE/NE-0095, September 1988) .)
L , C. Fuller, User's Manual for Levelized Power Generation Cost using an IBM-PC, ORNL/TM-9575, Oak Ridge National Laboratory (June 1985).
United Engineers and Constructors Inc., Phase IX U p d a t e (1987) R e p o r t for the Energy Economic D a t a Base Program E E D B - - I X , DOE/NE-0091, U.S. Department of Energy, Office of Nuclear Energy (July 1988).

51
1. 2.
3-7. 8-12.
13. 14. 15 16. 17.
18-22. 23. 24.
39.
40.
41.
42.
43. 44.
45.
46.
47.
48.
49.
50.
ORNL/TM-10997 Dist. Category UC-505
UC-522 UC-523
INTERNAL DISTRIBUTION
T. D. Anderson R. S. Booth J. J. Coen J. G. Delene D. M. Eissenberg E. C . Fox L. C. Fuller J. A. Gets; F. J. Homan C. R. Hudson J. E. Jones Jr. J. R. Merriman
25. 26. 27. 28. 29. 3 0 . 31. 32. 33. 3 4 . 35.
36-3 7 38.
J. C. Moyers B. E. Prince J. P. Sanders G. R. Smolen M. J. Taylor H. E. Trammel1 D. fl. Trauger K. A. Williams ORNL Patent Office CentraL Research Library Document Reference Section Laboratory Records Department Laboratory Records (RC)
EXTERNAL DISTRIBUTION
Office of Assistant Manager f o r Energy Research and Develop- ment, Department of Energy, Oak Ridge Operations, Oak Ridge, TN 37831 National Energy Software Center, Argonne National Laboratory, 9700 South Cass Avenue, Argonne, IL 60439 R. E. Allen, EEDB Program Project Manager, United Engineers and Constructors, Inc., P.O. Box 8223, Philadelphia, PA 19101 L. L. Bennett, Head, Planning and Economic Studies Section, International Atomic Energy Agency, Wagremesstrasse 5, P.O. Box 100, A-1400, Vienna, Austria H. I . Bowers, 104 Adelphi Road, Oak Ridge, TN 37830 W. W. Brandfon, Sargent & Lundy, 55 East Monroe, Chicago, IL 60603 Chaim Braun, Electric Power Research Institute, 3412 Hillview Avenue, P.O. Box 10412, Palo Alto, CA 94305 Y. I. Chang, Bldg. 208, Argonne National Laboratory, 9700 S. Cass Avenue, Argonne, IL 60439 J. Colsh, NE-40:GTN, Department of Energy, Washington, DC 20545 A. H. Fuldner, EI-542, 2G-060, Energy Information Administra- tion, Forrestal Bldg., 1000 Independence Avenue SW, Washington, DC 20585 J. C. Geidl, EI-50, BG-041, Energy Information Administration, Forrestal Bldg., 1000 Independence Avenue SW, Washington, DC 20585 M. Gielecki, EI-532, BF-115, Energy Information Administration, Forrestal Bldg., 1000 Independence Avenue SW, Washington, DC 20585

52
51.
52
53.
54 *
55.
56.
57.
58 .I
59.
60.
61
62.
63. 64.
65.
6 6 .
67.
68 a
69. 70-94.
75.
76.
77.
78.
79.
80-311
L. Grantham, Rockwell International Corporation, Rocketdyne Division, 6633 Canoga Avenue, Canoga Park, CA 91304 J. Grif€ith, NE-40:GTN, Department of Energy, Washington, DC 20545 M. Grunspan, NE-44:GTN9 Department of Energy, Washington, DC 20545 J. Hewlett, EI-532, BF-115, Energy Information Administration, Farrestal Bldg., 1000 Independence Avenue SW, Washington, DC 20585 K. K. Hudson, DP-5.1:GTN, Department of Energy, Washington, BC 20545 B. A. Hutchins, General Electric Company, P.8. Box 530954, San Jose, CA 95153 M. P. LaBar, Gas-Cooled Reactor Associates 10240 Sorrento Valley Rd., San Diego, CA 92121 S. J. Lanes, NE-50:GTN, Department of Energy, Washington, DC 20545 E. G. Lazur, DP-5.1:GTN, Department of Energy, Washington, DC 20545 E. F. Mastal, NE-53:GTN, Department of Energy, Washington, DC 20545 D. J. McGoff, ME-40:GTN, Department of Energy, Washington, DC 20545 A. C. Millunzi, NE-451:GTN, Department of Energy, Washington, DC 20545 M. L. Myers, 5404 Palmetto Road, Knoxville, TN 37921 J. D. Nulton, NE-45:GTN, Department of Energy, Washington, DC 20545 R. G. Oehl, NE-44:GTN9 Department of Energy, Washington, DC 20545 B. J. Rock, NE-46:GTN9 Department of Energy, Washington, DC 20545 E. Rodwell, Electric Power Research Institute, P.O. Box 10412, Palo Alto, CA 94303 H . H. Rohm, NE-40; B-415, GTN, Department of Energy, Washing- ton, DC 20545 G. Santos-Leon, DOE-Oak Ridge Operations, Oak Ridge, TN 37831 W. F. Savage, NE-44:GTN, Department of Energy, Washington, DC 20545 B . H. Shapiro, NE-l2:GTN, Department of Energy, Washington, DC 20545 Stan Vejtasa, Electric Power Research Institute, 3412 Hillview Avenue, P.O. Box 10412, Palo Alto, CA 94305 Rhonda Walker, Lawrence Livermore National Laboratory, c / o Jeannette Morris, AVLIS Program, L-467, P.O. Box 808, L i v e r - more, CA 94330 H. L. Walton, EI-53, BG-057, Energy Information AdminisLraLion, Forrestal BPdg., 1000 Independence Avenue SW, Washington, DC 20585 T. A. Werner, NE-44:GTN, Department of Energy, Washington, DC 20545 Given distribution as shown in DOE/OSTI-4500-INTERIM 3 under categories UC-505 (Mathematics and Computer Science), UC-522 (Gas Cooled Reactor Technology), and UC-523 (Light Water Reactor Technology)