jac laubscher chief economist comments on the annual report of the south african reserve bank...
TRANSCRIPT
Jac LaubscherChief Economist
Comments on the Annual ReportComments on the Annual Report
of theof theSouth African Reserve BankSouth African Reserve Bank
Parliamentary Committeeon Finance
28 September 2001
Key points from SARB reports
International economic outlook
Implications for South Africa
Monetary policy implications
Some thoughts on inflation targeting
Agenda
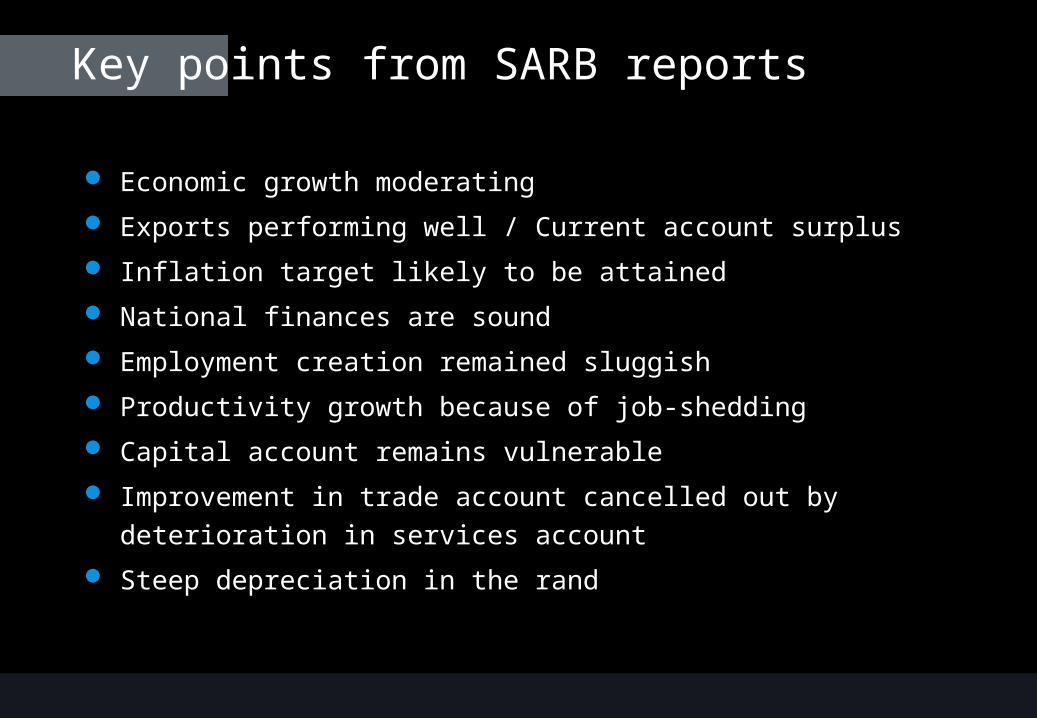
Key points from SARB reports
Economic growth moderating
Exports performing well / Current account surplus
Inflation target likely to be attained
National finances are sound
Employment creation remained sluggish
Productivity growth because of job-shedding
Capital account remains vulnerable
Improvement in trade account cancelled out by deterioration in
services account
Steep depreciation in the rand
International economic outlook
Further weakening expected

40
45
50
55
60
96 97 98 99 00 01
1
2
3
4
5
6NAPM (lhs) GDP (rhs)
index%
ceg118
USA NAPM vs. GDP growth

International economic outlook
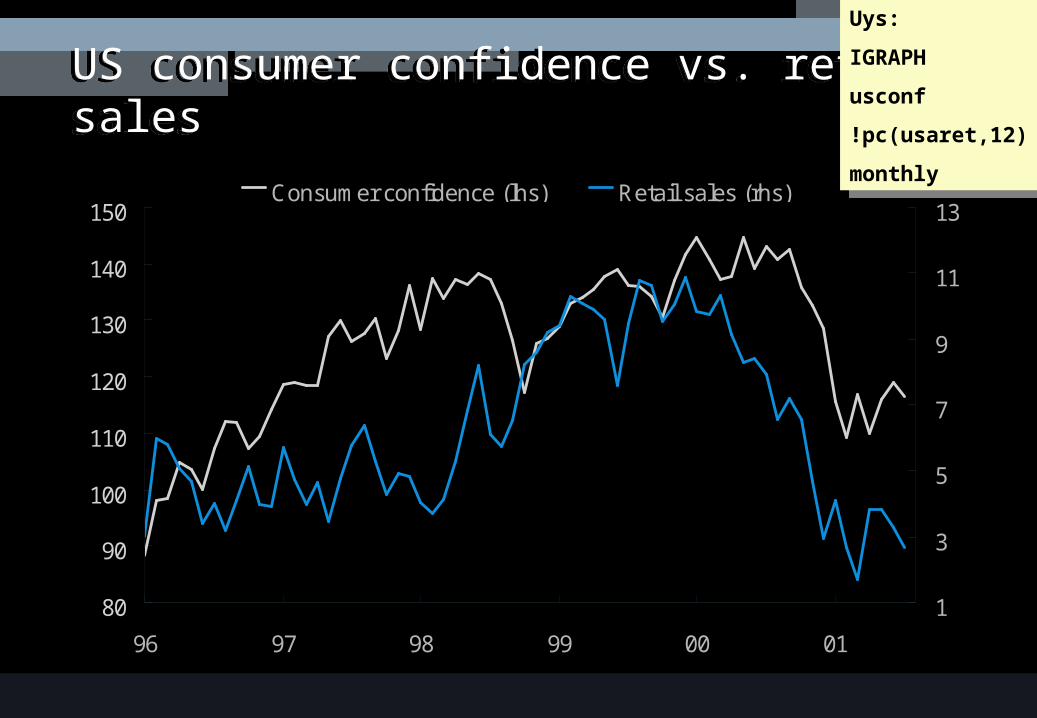
Further weakening expected
Heavily dependent on consumer confidence
80
90
100
110
120
130
140
150
96 97 98 99 00 01
%
1
3
5
7
9
11
13Consumer confidence (lhs) Retail sales (rhs)
US consumer confidence vs. retail salesUS consumer confidence vs. retail salesUys:
IGRAPH
usconf
!pc(usaret,12) -
monthly
Uys:
IGRAPH
usconf
!pc(usaret,12) -
monthly
International economic outlook
Further weakening expected
Heavily dependent on consumer confidence
Lower turning point postponed
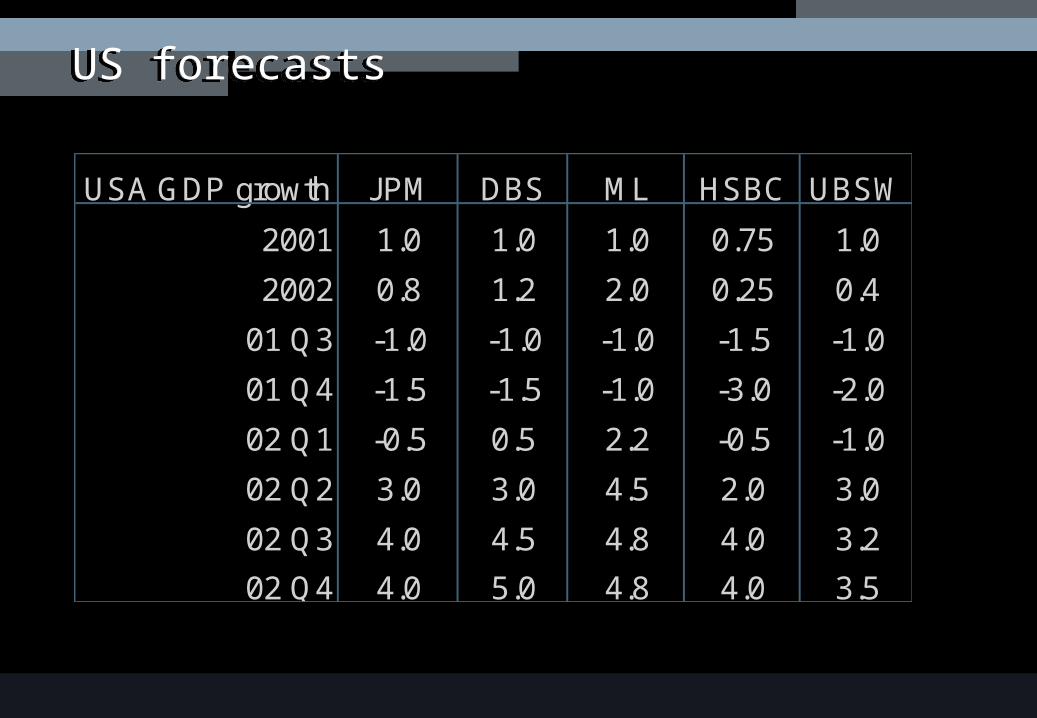
US forecastsUS forecasts
USA GDP growth JPM DBS ML HSBC UBSW
2001 1.0 1.0 1.0 0.75 1.0
2002 0.8 1.2 2.0 0.25 0.4
01 Q3 -1.0 -1.0 -1.0 -1.5 -1.0
01 Q4 -1.5 -1.5 -1.0 -3.0 -2.0
02 Q1 -0.5 0.5 2.2 -0.5 -1.0
02 Q2 3.0 3.0 4.5 2.0 3.0
02 Q3 4.0 4.5 4.8 4.0 3.2
02 Q4 4.0 5.0 4.8 4.0 3.5
International economic outlook
Further weakening expected
Heavily dependent on consumer confidence
Lower turning point postponed
Commodity prices under pressure
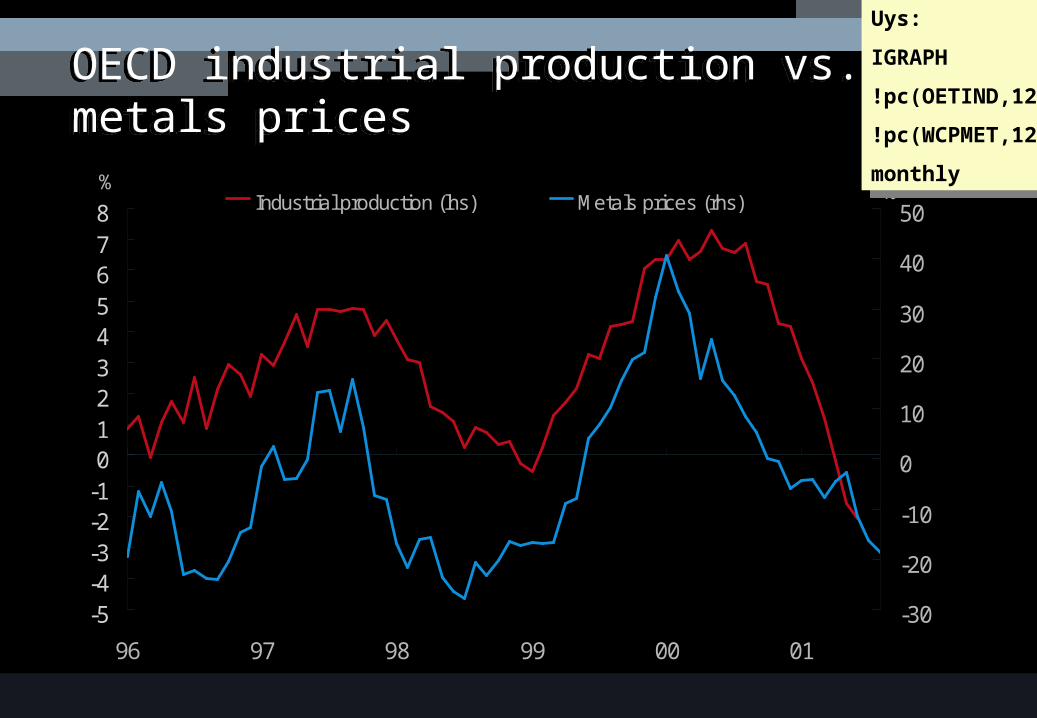
-5-4-3-2-1012345678
96 97 98 99 00 01
%
-30
-20
-10
0
10
20
30
40
50%Industrial production (lhs) Metals prices (rhs)
OECD industrial production vs. metals pricesOECD industrial production vs. metals pricesUys:
IGRAPH
!pc(OETIND,12)
!pc(WCPMET,12)
monthly
Uys:
IGRAPH
!pc(OETIND,12)
!pc(WCPMET,12)
monthly
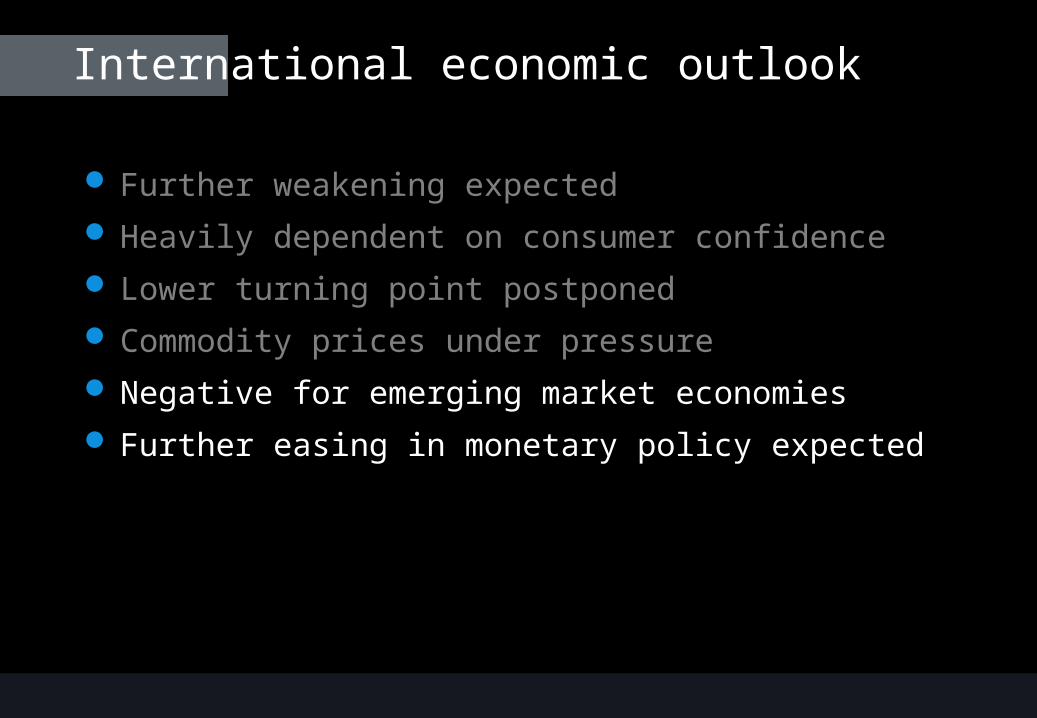
International economic outlook
Further weakening expected
Heavily dependent on consumer confidence
Lower turning point postponed
Commodity prices under pressure
Negative for emerging market economies
Further easing in monetary policy expected
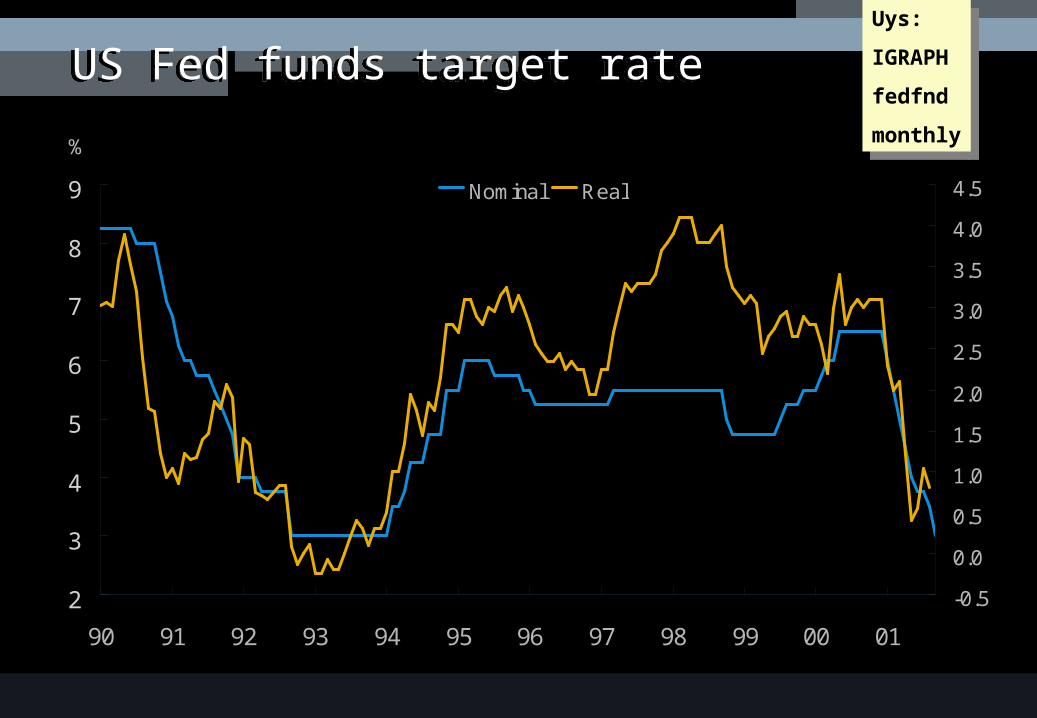
US Fed funds target rateUS Fed funds target rate
2
3
4
5
6
7
8
9
90 91 92 93 94 95 96 97 98 99 00 01
%
-0.5
0.0
0.5
1.0
1.5
2.0
2.5
3.0
3.5
4.0
4.5Nominal Real
%
Uys:
IGRAPH
fedfnd
monthly
Uys:
IGRAPH
fedfnd
monthly
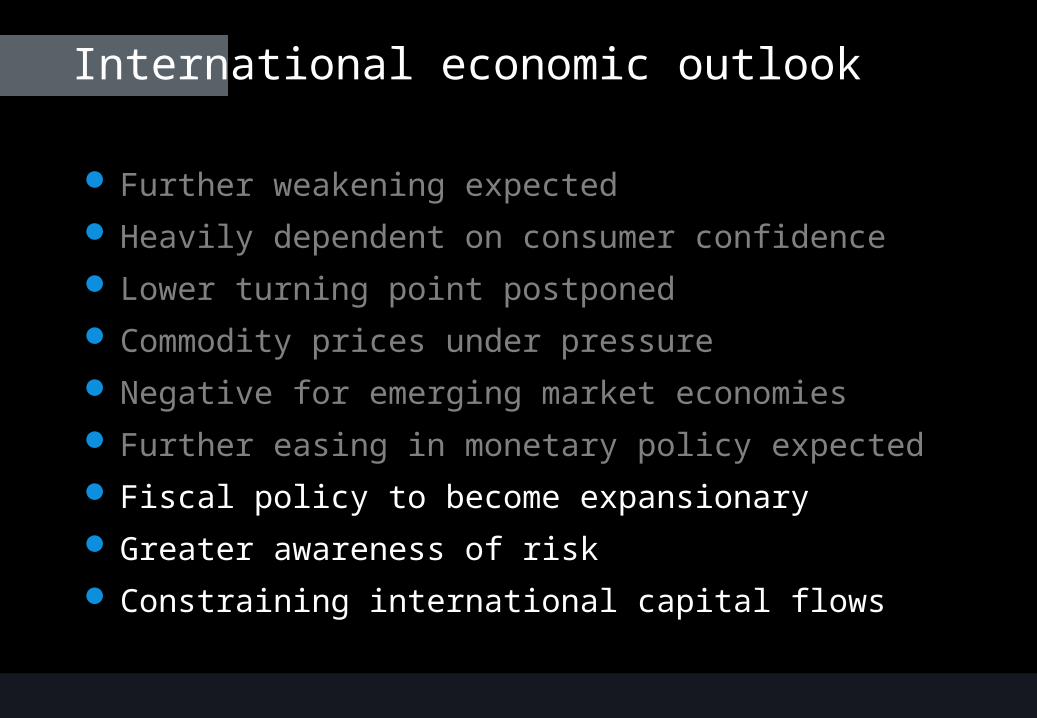
International economic outlook
Further weakening expected
Heavily dependent on consumer confidence
Lower turning point postponed
Commodity prices under pressure
Negative for emerging market economies
Further easing in monetary policy expected
Fiscal policy to become expansionary
Greater awareness of risk
Constraining international capital flows

Implications for South Africa
Rand weakness
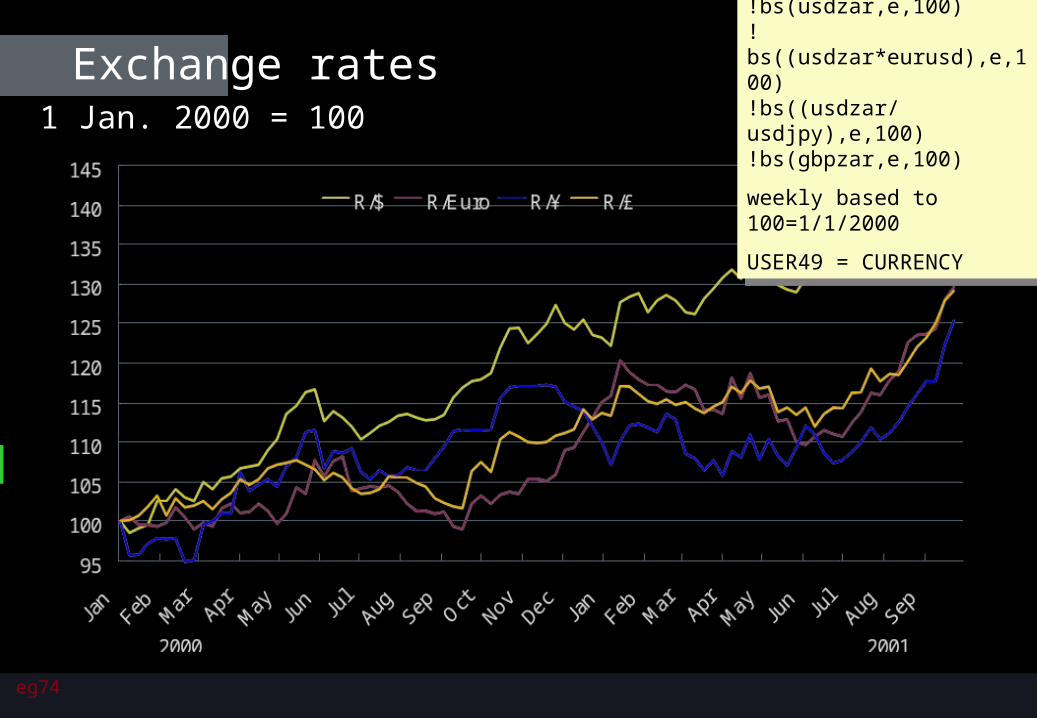
1 Jan. 2000 = 100
Exchange rates
eg74
IGRAPH data
!bs(usdzar,e,100)!bs((usdzar*eurusd),e,100)!bs((usdzar/usdjpy),e,100)!bs(gbpzar,e,100)
weekly based to 100=1/1/2000
USER49 = CURRENCY
IGRAPH data
!bs(usdzar,e,100)!bs((usdzar*eurusd),e,100)!bs((usdzar/usdjpy),e,100)!bs(gbpzar,e,100)
weekly based to 100=1/1/2000
USER49 = CURRENCY

Currency movements vs. US dollar
-57%
-28%
-17%
-14%
-13%
-11%
-10%
-9%
-8%
-7%
Turkey
Brazil
Chile
South Africa
Sweden
Australia
Pakistan
Sri Lanka
New Zealand
Israel
1 January to 26 September 2001

Dividend payments to foreigners
0
5000
10000
15000
20000
25000
30000
35000
40000
45000
50000
1995 1996 1997 1998 1999 2000 2001
9
10
11
12
13
14Dividends (lhs) % of exports (rhs)
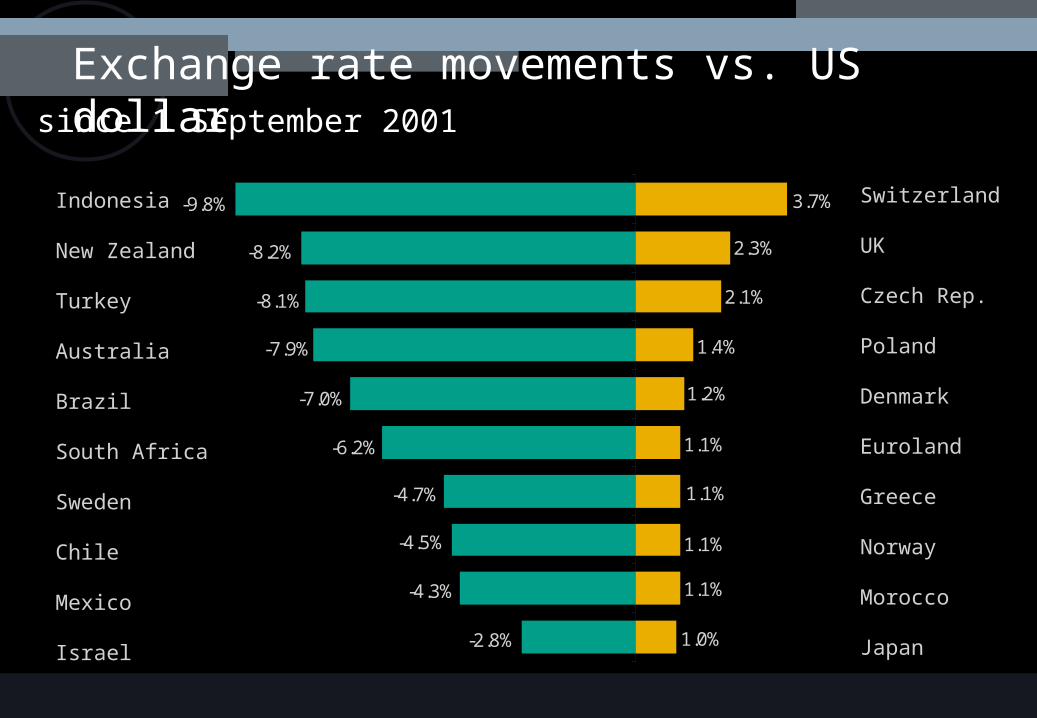
Exchange rate movements vs. US dollarsince 1 September 2001
-9.8%
-8.2%
-8.1%
-7.9%
-7.0%
-6.2%
-4.7%
-4.5%
-4.3%
-2.8%
2.3%
2.1%
1.4%
1.2%
1.1%
1.1%
1.1%
1.1%
1.0%
3.7%
-0.15 -0.1 -0.05 0 0.05
1
2
3
4
5
6
7
8
9
10
Indonesia
New Zealand
Turkey
Australia
Brazil
South Africa
Sweden
Chile
Mexico
Israel
Switzerland
UK
Czech Rep.
Poland
Denmark
Euroland
Greece
Norway
Morocco
Japan
Implications for South Africa
Rand weakness
Lower export volumes

Exports/GDP ratio
1
2
3
4
5
6
7
8
9
10
11
12
13
14
85 87 89 91 93 95 97 99 01
IGRAPH:EXPT/NGDPF
quarterly
IGRAPH:EXPT/NGDPF
quarterly
Implications for South Africa
Rand weakness
Lower export volumes
Weaker current account
Lower economic growth
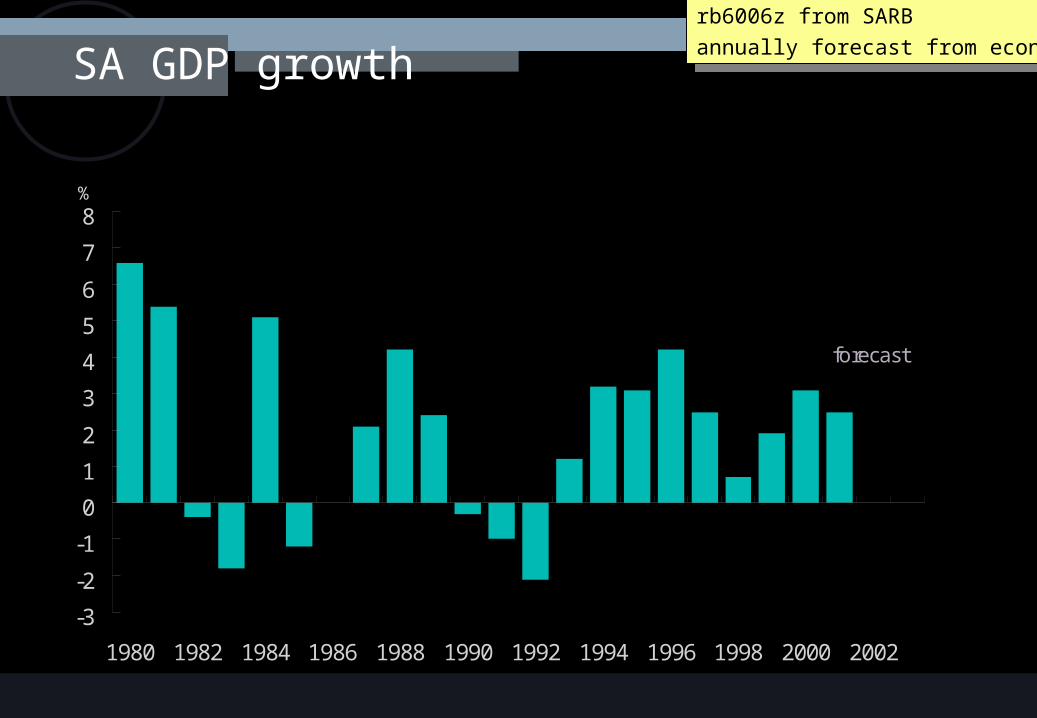
SA GDP growth
-3
-2
-1
0
1
2
3
4
5
6
7
8
1980 1982 1984 1986 1988 1990 1992 1994 1996 1998 2000 2002
%
forecast
IGRAPH:rb6006z from SARB
annually forecast from economic spreadsheet
IGRAPH:rb6006z from SARB
annually forecast from economic spreadsheet

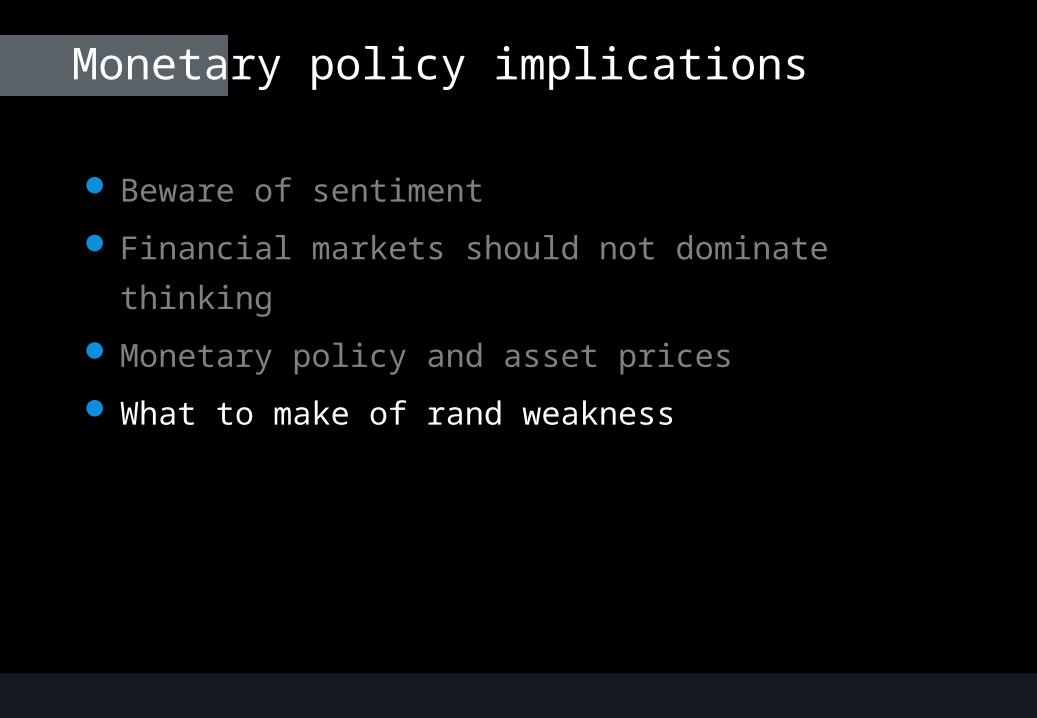
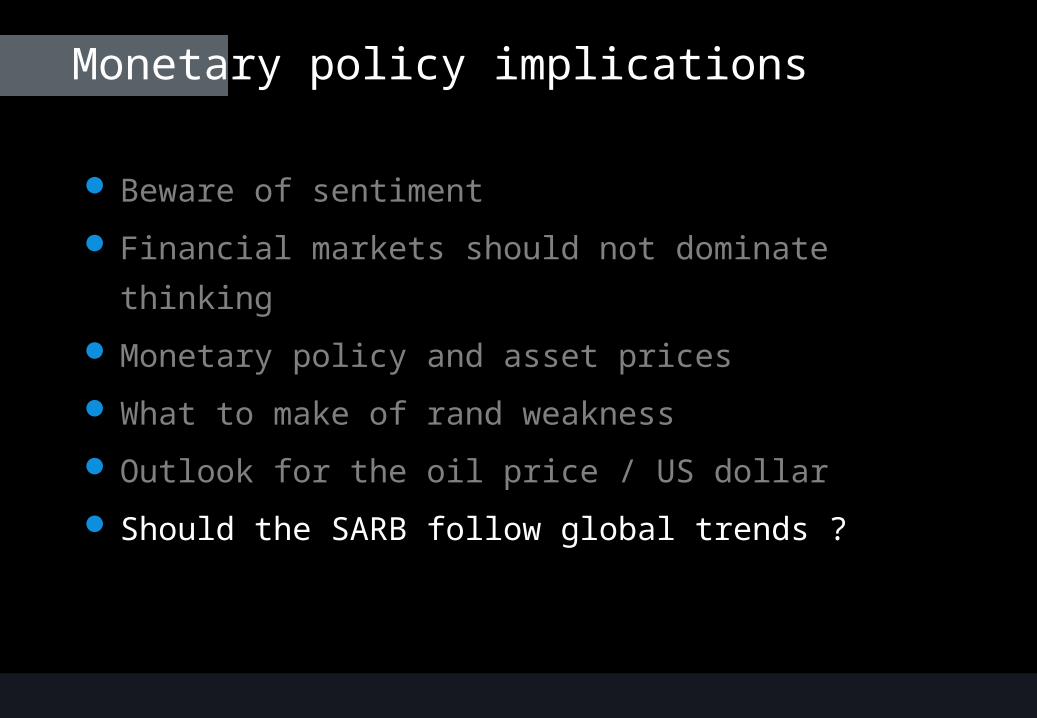
Monetary policy implications
Beware of sentiment
Financial markets should not dominate thinking

Weekly change in All Share Index
-20
-15
-10
-5
0
5
10
15
95 96 97 98 99 00 01
%
Mean = 0.13Std.Dev. = 2.82

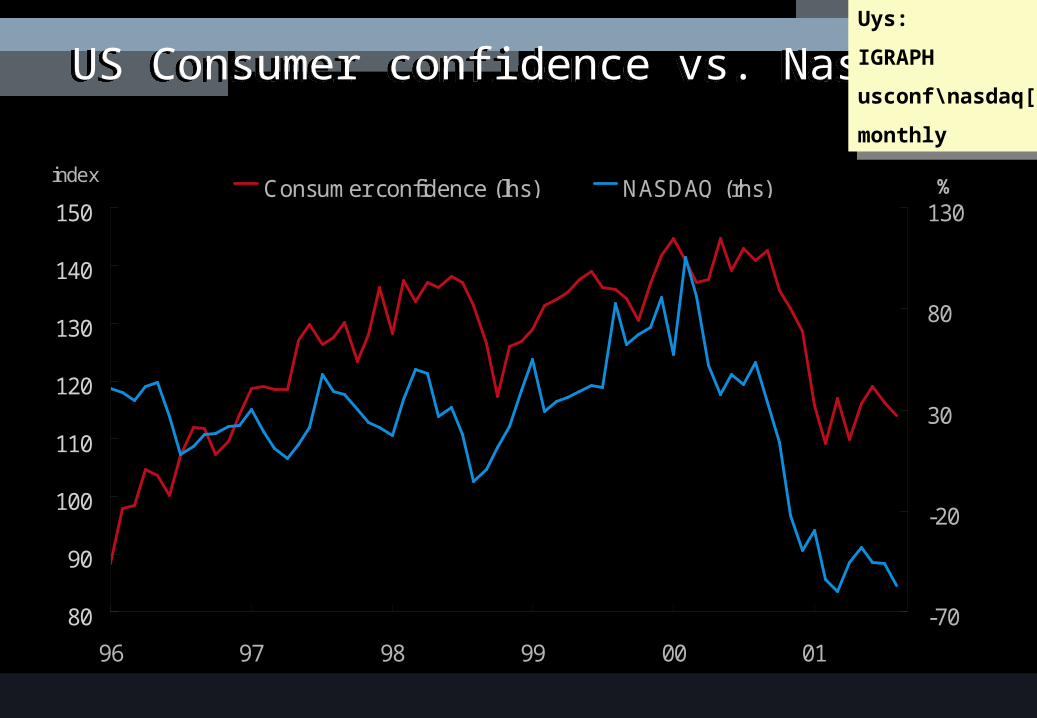
Monetary policy implications
Beware of sentiment
Financial markets should not dominate thinking
Monetary policy and asset prices
80
90
100
110
120
130
140
150
96 97 98 99 00 01
index
-70
-20
30
80
130%Consumer confidence (lhs) NASDAQ (rhs)
US Consumer confidence vs. NasdaqUS Consumer confidence vs. NasdaqUys:
IGRAPH
usconf\nasdaq[cl]
monthly
Uys:
IGRAPH
usconf\nasdaq[cl]
monthly
Monetary policy implications
Beware of sentiment
Financial markets should not dominate thinking
Monetary policy and asset prices
What to make of rand weakness

PPI Inflation : Imported vs. Domestic
-5
5
15
25
35
86 88 90 92 94 96 98 00
%
Imported Domestic
IGRAPH: (file jlgrowth – user49)
!pc(ppimps,12)\!pc(ppisas,12)
monthly
IGRAPH: (file jlgrowth – user49)
!pc(ppimps,12)\!pc(ppisas,12)
monthly
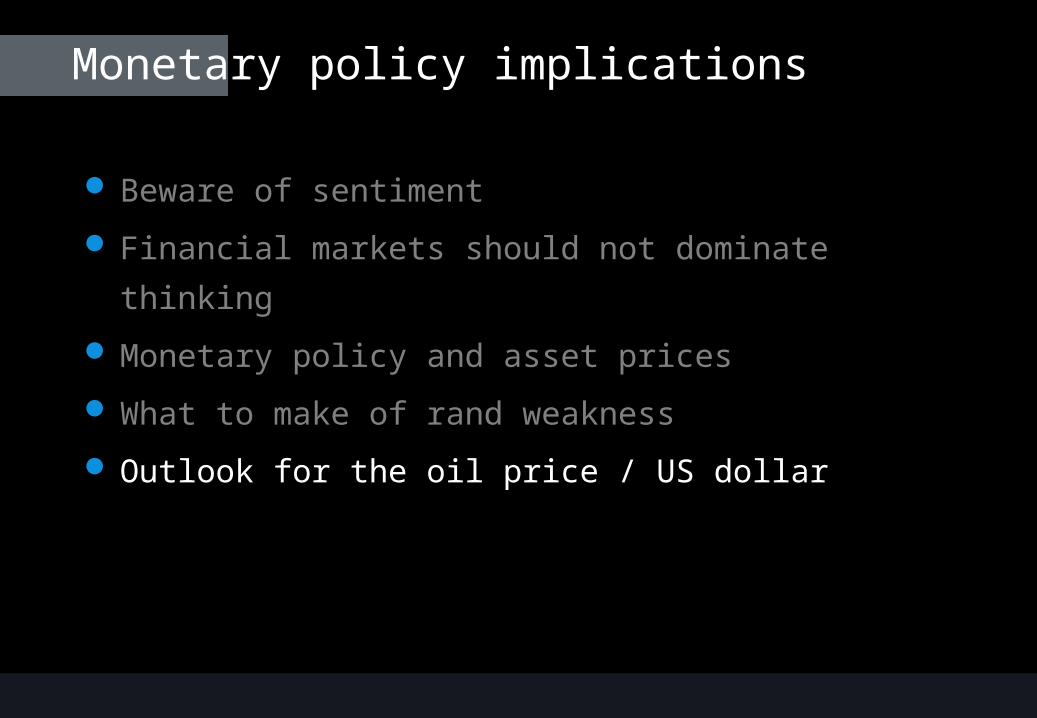
Monetary policy implications
Beware of sentiment
Financial markets should not dominate thinking
Monetary policy and asset prices
What to make of rand weakness
Outlook for the oil price / US dollar

Oil price vs. US dollar
5
10
15
20
25
30
35
40
85 87 89 91 93 95 97 99 01
price
-30
-20
-10
0
10
20
30
40
50
60
70
%
Oil price (lhs) US Dollar (rhs)
IGRAPH: BRSPOT\USDZAR[CL]
monthly
IGRAPH: BRSPOT\USDZAR[CL]
monthly
Monetary policy implications
Beware of sentiment
Financial markets should not dominate thinking
Monetary policy and asset prices
What to make of rand weakness
Outlook for the oil price / US dollar
Should the SARB follow global trends ?
Some thoughts on inflation targeting
Is inflation targeting still the appropriate monetary policy
regime ?

SARB Repo rate vs. Fed funds rate
8
12
16
20
24
Jan-98 Jul-98 Jan-99 Jul-99 Jan-00 Jul-00 Jan-01 Jul-01
%
2.0
2.5
3.0
3.5
4.0
4.5
5.0
5.5
6.0
6.5
7.0
%
SA Repo rate (lhs) Fed funds target rate (rhs)
IGRAPH: SAREP1\FEDFND
monthly
IGRAPH: SAREP1\FEDFND
monthly
Some thoughts on inflation targeting
Is inflation targeting still the appropriate monetary policy
regime ?
Escape clause should be communicated explicitly, or…
…the target redefined
Now is not the time for a tighter target range
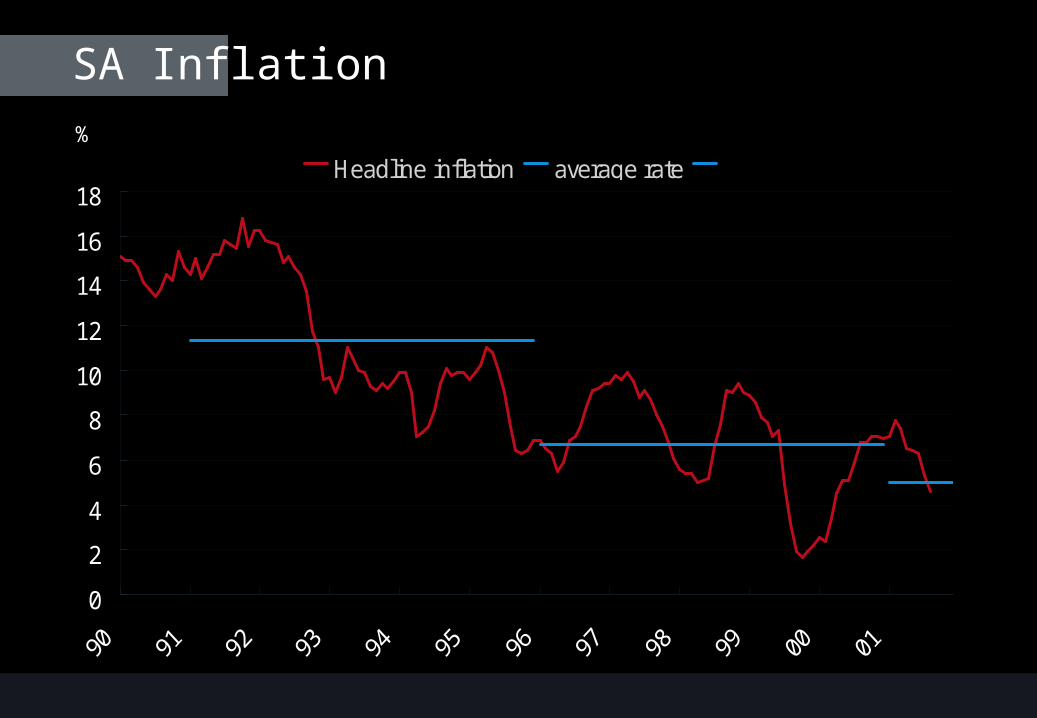
SA Inflation
0
2
4
6
8
10
12
14
16
18Headline inflation average rate
%