james sutherland & richard soulsby - hr...
TRANSCRIPT

James Sutherland & Richard Soulsby
HRPP509 1
Sediment Dynamics James SUTHERLAND & Richard SOULSBY
1
1 HR Wallingford Ltd, Howbery Park, Wallingford, Oxfordshire OX10 8BA, UK
(Email: [email protected])
Chapter 4 A User’s Guide to Hydraulic Modelling and Experimentation,
L.E. Frostick, S.J. McLelland & T.G. Mercer
4.1. Introduction
This chapter provides descriptions of essential features of modelling of a broad range of problems involving
many classes of sediment, flow, applications and research top¬ics. The experimental reproduction of
hydraulic processes involving sediment dynam¬ics is focussed on the sediments and not the hydrodynamic
processes, which are covered in other chapters. Since a great deal of experimental research on sediment
dynamics remains to be done, laboratory experiments to elucidate process knowledge (research) as well as
physical modelling of site-specific applications (consultancy) will be covered.
The following items are not discussed within this chapter:
� Soil mechanics and geotechnics, which constitute a major subject area in their own right
� Fluidisation/liquefaction of the bed by upward flows or wave action
� Permeable flows.
� Neither numerical models nor field measurements are discussed.
A thorough and readable account of physical modelling in coastal engineering, including a substantial
chapter on sediment transport models, is given in the book by Hughes (1993). He offered the opinion:
“Understanding sediment transport in coastal regions is a perplexing challenge that in all likelihood will
continue to frustrate coastal researchers and engineers for generations to come”. This opinion could be
applied to non-coastal situations such as rivers with equal force, and is as true today as it was in 1993. The
present guideline is not intended to duplicate the detailed (and still generally applicable) accounts given in
this and other books. Instead the aim is to summarise key results, and add knowledge derived in recent
years, particularly that based on the experience of HYDRALAB partners.
Most established laboratories that perform physical modelling have their own particular methods for
conducting model studies. Some of the techniques have evolved over time as a result of experience, while
other techniques have been acquired from other laboratories doing similar types of modelling. In
practice physical modelling procedures in various laboratories vary widely in their methods, such as
water and sediment circulation, waves (regular/irregular, long/short-crested), natural or low density
sediments, scaling methods, methods of measuring sediment concentrations, transport, bottom
topography, analysis techniques, etc.
Considering first research into sediment processes, a great deal of understanding has been gained in the
past 50 years by means of both laboratory and field experiments. However, there are still important gaps in
knowledge and the pace of experimentation carries on undiminished into the future. On the other hand, the
consultancy use of physical models for the prediction of site-specific sediment response has decreased
somewhat over the years as the capabilities of numerical models have increased. Yet there are still many

James Sutherland & Richard Soulsby
HRPP509 2
classes of application for which a physical model is either the cheapest or the most reliable approach, or is
an alternative or complement to a numerical model (composite modelling, the subject of the CoMIBBS JRA),
and this is likely to remain true well into the foreseeable future.
The following books, which are widely accepted in the field of physical modelling of sediment dynamics, are
used as an underlying basis for this document:
� Yalin, M.S., 1971
� Dalrymple, R.A., 1985
� Hughes, S.A., 1993
� Van Rijn, L.C., 2007.
4.2. Objectives and approach
The following general approach applies to consultancy applications involving physi¬cal modelling of
sediment dynamics, and to some extent to research experiments as well. Steps 1 to 10 will normally be
considered during the preparation of the proposal, and then refined once the work commences. The layout of
this chapter broadly fol¬lows the steps of this approach.
1. The objectives of the study must be clearly identified, and a written statement agreed with the client.
Misunderstandings at this stage are very difficult to cor¬rect later. For example, in a beach study is the
plan shape, the cross-shore profile, or the longshore transport rate of primary concern? Establish
whether the client wants only the model data, or an interpretation of what the data means. Establish what
level of Quality Assurance the client requires.
2. The relevant physical processes must be identified and their approximate magni¬tudes estimated. The
dominant processes must be reproduced in the model, and omission (or non-scaled reproduction) of
lesser processes must be justified by consideration of the ratios of omitted to include processes (e.g.
ratio of terms in the momentum equation).
3. Decide if the problem can justifiably be treated as having one horizontal dimen¬sion (1DH), or whether
both horizontal dimensions (2DH) must be modelled. In the former case, a (narrow) current or wave
flume will suffice. In the latter case, for rivers either a broad current flume or a full 2DH physical flow
model is required, and for coastal and offshore problems a wave basin is required. Using a flume will
reduce costs compared with 2DH facilities, and/or a larger number of tests could be performed, but at the
expense of omitting cross-flume processes.
4. Consider the scaling issues and the scaling approach to be adopted. Decide whether natural
density or low-density sediment will be used and what the minimum scale is that will ensure that non-
scaled phenomena have a negligible effect. Determine whether a vertically distorted model should/can
be used. Choose the geometric scale (and vertical exaggeration, for distorted models) and calculate
the scale of other variables (time, velocity, etc.).
5. Decide what the requirements are for flow generation (where appropriate). This includes considering how
the flows will be circulated and the necessary measures for straightening the flows and ensuring that
entrance conditions are gradual and turbulence levels are natural.
6. Decide what the requirements are for wave generation (where appropriate):
a. Regular vs irregular waves
b. Long-crested vs short-crested waves

James Sutherland & Richard Soulsby
HRPP509 3
c. Consideration of wave reflections (use of active or passive absorption)
d. Low frequency waves
e. Wave velocity- or acceleration skewness
f. Re-circulation of water (e.g. from longshore currents)? See Chapter 2.
7. Decide how (and if) sediment will be re-circulated.
8. Choose the most appropriate model facility, bearing in mind all the above considerations. Decide
whether the scaling benefits of using a large facility (e.g. near-full-scale wave flume, oscillating water
tunnel) outweigh the considerable added costs, time and staff resource needed.
9. Decide what needs to be measured and which instruments to use. Consider whether their
calibration requirements, accuracy, data logging requirements and data storage.
10. Plan a test series. Leave adequate time for calibrations and preliminary tests and for turn-around
between tests.
11. Estimate the costs in conjunction with planning the test series. This is best done as a fixed sum for
commissioning (and de-commissioning) the facility including preliminary tests and calibrations, plus a
unit cost per test. Estimate the time necessary to complete the test series, allowing 10–20%
contingency time for breakdowns etc. Consult with the client to ensure that cost and time are in line
with his expectations.
12. Design the model, including moulding of the bed, construction of structures, placement of rock armour
or scour protection.
13. Perform the calibrations of the instruments and the current and/or wave generation facilities.
Perform preliminary tests to establish the best routine for the main test series.
14. Perform the test series. Examine the first few tests particularly carefully, analysing the data as far as
possible, and noting the time taken per test. Adapt the procedures and test series if necessary.
Log the data in an organised manner.
15. Keep detailed notes in a dedicated log-book (one book for the whole study, not separate ones kept
by different individuals). Ensure that everything is recorded, including sketches where useful.
Remember to record water temperature, especially if suspended sediments are involved. Don’t trust
to memory, or assume that something is too obvious to require a note.
16. Analyse the data, preferably as the test series proceeds.
17. Interpret the data, including conversion of model results to prototype scale.
18. Establish the sources and magnitudes of errors, and quote these together with the interpreted results.
19. Write a report on the study.
20. Archive the data and paperwork in a way that will be retrievable over the number of years required by
the client or by QA requirements.
4.3. General principles
A large number of interacting physical processes can be operating in the prototype situation. These must be
considered, and where possible reproduced, in the physical model. Some or all of the following should be
considered, depending on the type of problem being tackled.
� Type of forcing: current, tidal, waves, wind, buoyancy, Coriolis;
� Type of sediment: cohesive, noncohesive, mud, sand, gravel, mixtures;

James Sutherland & Richard Soulsby
HRPP509 4
� Mode of transport: threshold of motion, bedload transport, suspended transport;
� Bedforms: ripples, dunes, megaripples, sand waves;
� Waves;
� Long-crested, short-crested;
� Asymmetry, skewness, low-frequency waves;
� Longshore currents;
� Undertow, rip currents, rip cells;
� Boundary-layer streaming, mid-water return flows;
� Longshore drift of sediment;
� Breaker bar formation;
� Permeability;
� Beaches (sand, shingle, both);
� Soil mechanics/geotechnics;
� Fluidisation/liquefaction of the bed;
� Biological activity.
Some of these are discussed in further detail below. A fuller understanding of the principles and processes
involved, especially in the prototype situation, can be gained from standard texts on sediment transport such
as Fredsøe & Deigaard (1992), Nielsen (1992), Van Rijn (1993, 1998) and Soulsby (1997) (see
Bibliography).
4.3.1. Multi-directional versus uni-directional waves
In deep water the sea-states generated by storms are multi-directional. As these waves approach the coast
they shoal and refract and the directional spreading of the sea-states reduces. By the time waves break near
the shoreline they are commonly quite long crested and it is common practice to represent the sea-state in a
physical model as a uni-directional irregular series of waves. This is a better approximation inshore than
offshore.
In recent years there has been an increase in the availability of multi-directional wave paddles and so there
is less need to make such an approximation in cases where the incident seastate can reliably be shown to
be multi-directional (See Chapter 2).
4.3.2. Wave skewness and asymmetry
In deep water, the time series of surface elevations at a point is commonly assumed to be Gaussian, with a
Rayleigh distribution of wave heights (Chapter 2). As waves enter shallow water, their shapes evolve from
sinusoidal to peaky (like a Stokes wave) with sharp wave crests separated by broad, flat wave troughs.
These waves have positive skewness, but near zero asymmetry (of their surface elevation). It has been
hypothesized that the larger onshore velocities under the peaked wave crests transport more sediment than
the offshore velocities under the troughs.
As waves continue to shoal and break, they evolve from profiles with sharp peaks to asymmetrical, pitched-
forward shapes with steep front faces. Broken, sawtooth waves have positive asymmetry, but near zero
skewness (of their surface elevation). Water rapidly accelerates under the steep wave front, producing high
James Sutherland & Richard Soulsby
HRPP509 5
onshore veloci¬ties, followed by smaller decelerations under the gently sloping rear of the wave. Large
accelerations generate strong horizontal pressure gradients that act on the sediment. Although the precise
mechanisms are not fully understood, it has been hypothesized that if accelerations increase the amount of
sediment in motion, there will be more shoreward than seaward transport under pitched-forward, asymmetric
waves.
It is therefore important that the correct skewness and asymmetry be generated in the laboratory, in order
that the correct form of sediment transport may be generated. This can best be done by generating waves in
deeper water and giving them sufficient time and space to shoal naturally before the test section with
sediment is reached.
4.3.3. Critical bed-shear stress
Particle movement will occur when the instantaneous fluid force on a particle is just larger than the
instantaneous resisting force related to the submerged particle weight and the friction coefficient. The
degree of exposure of a grain with respect to the surrounding grains (hiding of smaller particles resting
or moving between the larger particles) can affect the forces at initiation of motion. In-bed pressure
gradients can lift small embedded particles out of the bed. Cohesive forces are important when the bed
consists of appreciable amounts of clay and silt particles.
Initiation of motion in steady flow occurs when the dimensionless bed-shear stress (Shields parameter)
= / [(⟩s–⟩ f)gD50 ] is larger than a threshold value cr = cr/ [(⟩s–⟩ f) gD50]. Thus: > cr, with
cr = critical bed-shear stress for movement of noncohesive sediment, ⟩s = sediment density, ⟩ f =
f luid density, D50 = median sediment diameter and g = gravitational acceleration.
The -factor depends on the hydraulic conditions near the bed, the particle
cr
shape and the particle position relative to the other particles. The hydraulic conditions near the bed can be
expressed by either the grain Reynolds number Re* = u*Dg/k or by a dimensionless particle
size D* = D50[(s 1)g/k 2 ]1 /3,
s = ⟩s /⟩ = relative density, u* = friction velocity and k = kinematic
viscosity. The Reynolds number and the Shields parameter should ideally be the same in model and
prototype, but this can usually only be accomplished in facilities which represent the processes at full (or
nearly-full) scale, otherwise a compromise must be made.
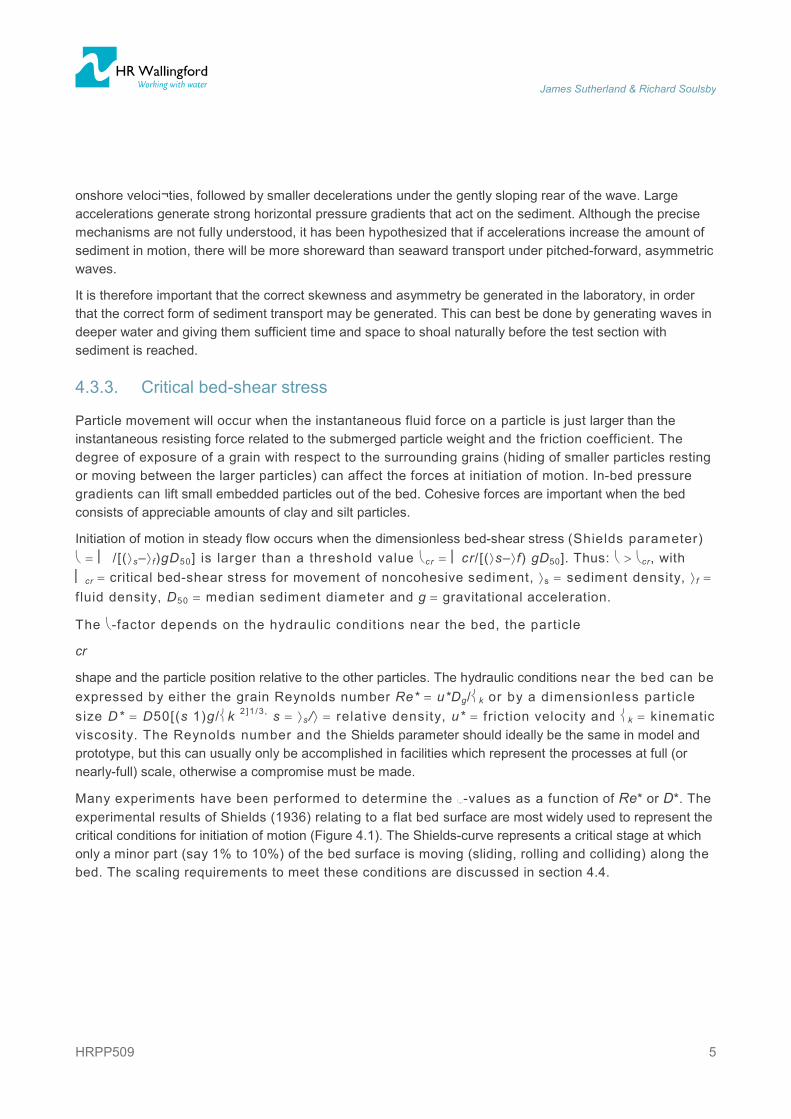
Many experiments have been performed to determine the c r-values as a function of Re* or D*. The
experimental results of Shields (1936) relating to a flat bed surface are most widely used to represent the
critical conditions for initiation of motion (Figure 4.1). The Shields-curve represents a critical stage at which
only a minor part (say 1% to 10%) of the bed surface is moving (sliding, rolling and colliding) along the
bed. The scaling requirements to meet these conditions are discussed in section 4.4.
James Sutherland & Richard Soulsby
HRPP509 6
Figure 4.1 Initiation of motion according to Shields (1936), as presented by Van Rijn (1993).
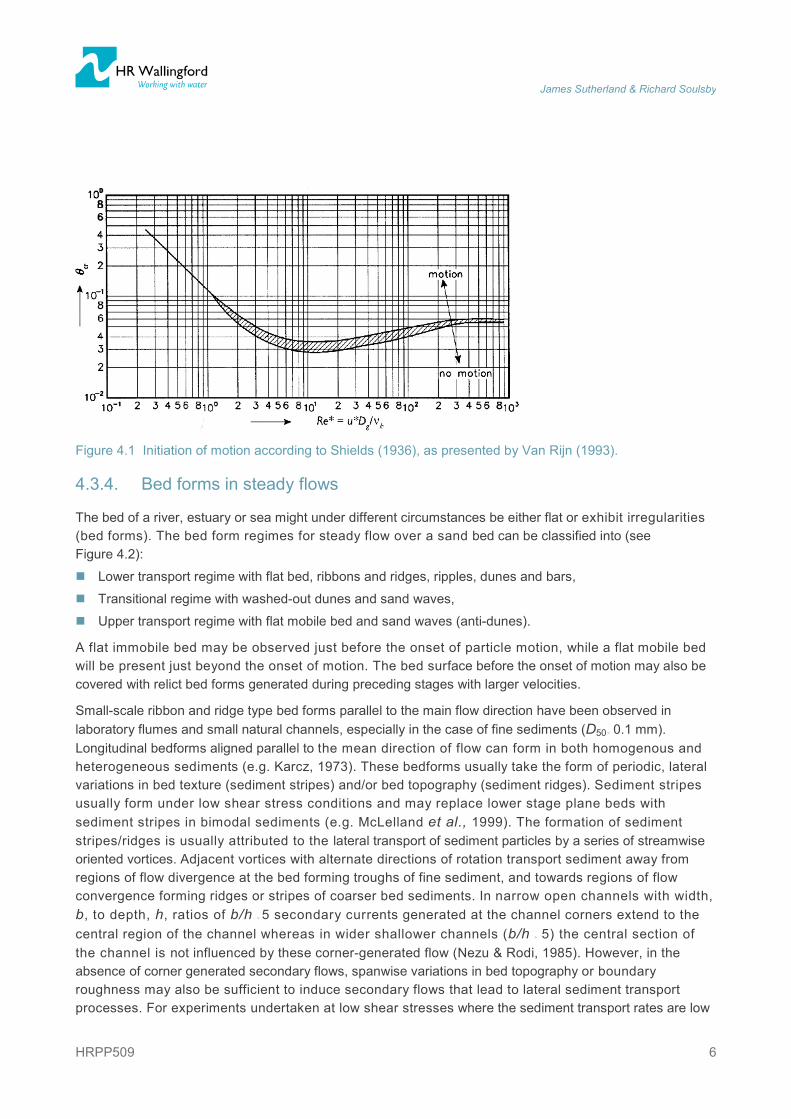
4.3.4. Bed forms in steady flows
The bed of a river, estuary or sea might under different circumstances be either flat or exhibit irregularities
(bed forms). The bed form regimes for steady flow over a sand bed can be classified into (see
Figure 4.2):
� Lower transport regime with flat bed, ribbons and ridges, ripples, dunes and bars,
� Transitional regime with washed-out dunes and sand waves,
� Upper transport regime with flat mobile bed and sand waves (anti-dunes).
A flat immobile bed may be observed just before the onset of particle motion, while a flat mobile bed
will be present just beyond the onset of motion. The bed surface before the onset of motion may also be
covered with relict bed forms generated during preceding stages with larger velocities.
Small-scale ribbon and ridge type bed forms parallel to the main flow direction have been observed in
laboratory flumes and small natural channels, especially in the case of fine sediments (D50 < 0.1 mm).
Longitudinal bedforms aligned parallel to the mean direction of flow can form in both homogenous and
heterogeneous sediments (e.g. Karcz, 1973). These bedforms usually take the form of periodic, lateral
variations in bed texture (sediment stripes) and/or bed topography (sediment ridges). Sediment stripes
usually form under low shear stress conditions and may replace lower stage plane beds with
sediment stripes in bimodal sediments (e.g. McLelland et al., 1999). The formation of sediment
stripes/ridges is usually attributed to the lateral transport of sediment particles by a series of streamwise
oriented vortices. Adjacent vortices with alternate directions of rotation transport sediment away from
regions of flow divergence at the bed forming troughs of fine sediment, and towards regions of flow
convergence forming ridges or stripes of coarser bed sediments. In narrow open channels with width,
b, to depth, h, ratios of b/h < 5 secondary currents generated at the channel corners extend to the
central region of the channel whereas in wider shallower channels (b/h > 5) the central section of
the channel is not influenced by these corner-generated flow (Nezu & Rodi, 1985). However, in the
absence of corner generated secondary flows, spanwise variations in bed topography or boundary
roughness may also be sufficient to induce secondary flows that lead to lateral sediment transport
processes. For experiments undertaken at low shear stresses where the sediment transport rates are low

James Sutherland & Richard Soulsby
HRPP509 7
it is therefore important to consider the width to depth ratio of the channel since this will affect the resulting
flow structure and development of longitudinal bedforms.
Figure 4.2 Bed forms in steady flows (rivers), as presented by Van Rijn (1993).
When the bed form crest is perpendicular (transverse) to the main flow direction, the bed forms are called
transverse bed forms, such as ripples, dunes and anti-dunes. Ripples have a wave length which is practically
independent of the water depth, and may be much smaller than the water depth, whereas dunes have a
length scale much larger than the water depth. Ripples and dunes travel downstream by erosion at the
upstream face (stoss-side) and deposition at the downstream face (lee-side). Bed forms with their crest
parallel to the flow are called longitudinal bed forms such as ribbons and ridges. In the literature, various
bed-form classification methods for sand beds are presented. The types of bed forms are described in terms
of basic parameters (Froude number, suspension parameter, particle mobility parameter, dimensionless
particle diameter).
When the velocities are somewhat larger (by 10%–20%) than the critical velocity for initiation of motion and
the median particle size is smaller than about 0.5 mm, small (mini) ripples are generated at the bed surface.
Ripples that are developed during this stage remain small with a ripple length much smaller than the water
depth. Current ripples have an asymmetric profile with a relatively steep downstream face (lee-side) and a
relatively gentle upstream face (stoss-side). Their height is typically 2 cm and their wavelength typically 20
cm. Some evidence suggests that their dimensions depend only weakly on grain size, and are independent
of flow velocities if the experiment is allowed sufficient time for the ripples to fully reach equilibrium. As the
velocities near the bed become larger, the ripples become more irregular in shape, height and spacing

James Sutherland & Richard Soulsby
HRPP509 8
yielding strongly three-dimensional ripples. The largest ripples may have a length up to the water depth and
are commonly called mega-ripples.
Another typical bed form type of the lower regime is the dune-type bed form. Dunes have an asymmetrical
(triangular) profile with a rather steep lee-side and a gentle stoss-side. The length of the dunes is strongly
related to the water depth (h) with values in the range of 3 to 15 h.
The largest bed forms in the lower regime are sand bars, which usually are generated in areas with relatively
large transverse flow components (bends, confluences, expansions). Alternate bars are features with their
crests near alternate banks of the river. Transverse bars are diagonal shoals of triangular-shaped plan along
the bed. One side may be attached to the channel bank. These type of bars generally are generated in steep
slope channels with a large width-depth ratio.
Bed forms generated at low velocities are washed out at high velocities. Flume experiments with sediment
material of about 0.45 mm show that the transition from the lower to the upper regime is effected by an
increase of the bed form length and a simultaneous decrease of the bed form height. Ultimately, relatively
long and smooth sand waves with a roughness equal to the grain roughness are generated.
In the transition regime the sediment particles will be transported mainly in suspension. This will have a
strong effect on the bed form shape. The bed forms will become more symmetrical with relatively gentle lee-
side slopes. Flow separation will occur less frequently and the effective bed roughness will approach that of
a plane bed.
In the supercritical upper regime the bed form types will be plane bed and/or anti-dunes (which travel
upstream) with a length scale of about 10 times the water depth. Bedforms can be washed out at any
Shields number under large Froude numbers (Fr = Uc/(gh)1/2
> 0.84), and by large Shields parameters
( = /[(⟩s⟩)gD50] ><0.8) for subcritical flows.
By including a description of the pertinent physical processes, linear stability analysis can explain the
formation of bed forms on an initially plane sediment bed, and the theory can account for the conditions
under which the bed will remain plane. The linear stability analysis starts from a model for the flow and
sediment transport over a plane bed. The bed is given a small amplitude harmonic perturbation and the
perturbed flow and sediment transport field is described from the linearized equations. The sediment
transport field may modify the bed perturbations causing migration and growth or decay. The analysis can be
made for all possible perturbations (wave length and orientation relative to the mean flow). If all perturbations
are found to decay the bed will remain plane, while if some perturbations tend to grow the bed is unstable
and bed forms will emerge. The perturbation with the fastest growth rate will determine the initial dimensions
of the emerging bed forms, but the shape and length scale may be modified as the bed forms grow and the
assumption of the amplitude being small is no longer valid. The stability analysis covers bed forms of
practically all length scales from ripples, dunes, anti-dunes, alternate bars to braid bars. Stability theories for
bed forms in rivers were developed in the 1960s and 1970s and were applied to describe the formation of
analogous marine bed forms (sand waves, linear tidal sand banks) in the 1990s.
4.3.5. Bed forms under waves
In coastal regions the non-linear interactions between the flow and the non-cohesive sandy bottom may
induce significant modifications in the bottom morphology leading to the appearance of several types of
bedforms of different sizes and shapes, from small scale (ripples) to medium (dunes, megaripples) and
large scale (sand waves). The bed generally is dominated by small-scale and large-scale ripples and

James Sutherland & Richard Soulsby
HRPP509 9
plane beds depending on the wave conditions. The nature of the sea bed (either ripples or plane bed)
has a fundamental role in the transport of sediments by waves and currents. The configuration of the sea
bed controls the near-bed velocity profile, the shear stresses and the turbulence and, thereby, the
mixing and transport of the sediment particles. For example, the presence of ripples reduces the
near-bed velocities, but it enhances the bed-shear stresses, turbulence and the entrainment of
sediment particles resulting in larger overall suspension levels.
Several types of bed forms can be identified, depending on the type of wave-current motion and the bed
material composition. Focussing on fine sand in the range of 0.1 to 0.3 mm, there is a sequence starting with
the generation of rolling grain rip¬ples, to vortex ripples and, finally, to upper plane bed with sheet flow for
increasing bed-shear. Rolling grain ripples are low relief ripples that are formed just beyond the stage of
initiation of motion. These ripples are transformed into more pronounced vortex ripples due to the generation
of sediment-laden vortices formed in the lee of the ripple crests under increasing wave motion. These ripples
are characterized by a height of the order of a few centimetres and a length of the order of some tens of
centimetres, comparable to the amplitude of fluid oscillation close to the bed and increasing with the
sediment coarseness (Figure 4.3b). Steep ripples are formed by relatively low waves in relatively deep water
(i.e. typical offshore conditions). Such ripples tend to be long crested (two-dimensional), and they have
steepness (height/ length) greater than about 0.15.
In the lab, the appearance of ripples is controlled by the value of the orbital ampli¬tude, the sediment grain
size, and the wave characteristics. In particular, when the bot¬tom orbital amplitude is not big enough to
mobilize the sand bed, the bottom remains flat. When the velocity increases and it exceeds about 1.2 times
the critical value above which the sediments start to move, ripples appear. Finally, when the orbital velocity
generates such shear stresses to mobilize the sandy bottom entirely, bedforms reach a maximum height and
then decline and eventually disappear resulting in plane bed sheet flow characterised by a thin layer of large
sediment concentrations.
When making experiments to investigate the formation of bed-forms, the bed should be carefully
smoothed out without compacting the sand, as any sand grain can act as a disturbance to ripple
evolution. The evolution of the rippled bed, starting from a flat bed, tends asymptotically towards
equilibrium with a time scale of some hundreds of wave periods. At equilibrium, bedforms are
characterised by a wavelength depending on the flow and the sediment Reynolds numbers and migrate
at a rate depending on the same non-dimensional parameters (Faraci & Foti, 2002). Ripple crests are
oriented perpendicular to the wave propagation direction. However in the presence of superimposed
orthogonal currents, a waviness of the crest line occur, in the range 0.2 < Uc/ Uw<0.6 (Uc being the
current velocity and Uw the orbital velocity), while for stronger currents ripple crest lines become irregular
(Andersen & Faraci, 2003).
Dunes and megaripples have been sometimes considered as a single category, as their characteristics
show very small differences. They are characterized by a height of 0.1–0.5 m and a wavelength of 1–5 m.
Megaripples tend to become aligned in such a way that the sediment transport normal to the bedform crest is
maximized and therefore they migrate (Gallagher et al., 1998). Even in this case most of the studies
refer to field conditions.
Large scale bedforms are characterized by a median length of hundreds of meters and an amplitude of
about 5 m (Hulscher, 1996) and their formation is related to the presence of steady recirculating cells
generated by the interaction of the oscillatory tidal flow and the bottom waviness (Figure 4.3a). Their

James Sutherland & Richard Soulsby
HRPP509 10
reproduction at reduced scale in laboratory is difficult due to the matching of hydrodynamic forcing and
morphodynamic response and therefore most of the studies are referred to field conditions.
Figure 4.3 (a) sand waves in the Messina Strait (b) ripple bed formed at University of Catania Hydrau-lics Laboratory.
4.3.6. Bed roughness
Nikuradse (1932) introduced the concept of an equivalent or effective sand roughness height (ks) to
simulate the roughness of arbitrary roughness elements of the bottom boundary. In the case of a
movable bed consisting of sediments the effective bed roughness mainly consists of grain roughness
generated by skin friction forces and of form roughness generated by pressure forces acting on the
bed forms. Similarly, a grain-related bed-shear stress and a form-related bed-shear stress can be
defined. The effective bed roughness for a given bed material size is not constant but depends on the
flow conditions.
There is an essential difference between the sediment transport processes that occur above rippled
and plane sand beds. The roughness (ks) of a rippled bed is equivalent to about 3–4 ripple heights.
Beneath steeper waves in shallower water (for example, at edge of the surf zone), the ripples start to
become washed out; their steepness decreases, causing ks to decrease, and they tend to become shorter
crested (transitional 2D-3D profiles). Finally, beneath very steep and breaking waves, the ripples are
washed away completely, the bed becomes plane (‘sheet flow’ regime), and ks decreases still further
(scaling on the sand grain diameter). However, the roughness during sheet flow is larger than it
would be due to grain roughness alone as a result of momentum transfer by saltiating grains, resulting
in a roughness of typically
ks < 100 D50.
Correct modelling of the effective roughness in the hydraulically rough regime requires that for steady
currents the ratio of water depth h and effective bed roughness ks, and for waves the ratio of wave
orbital excursion A to ks, is the same in the scale model and in the prototype. Generally, this cannot be
achieved in a movable bed model. Corrections are necessary to deal with this.
4.3.7. Rivers
The amount of water conveyed through a river section during a year is known as the hydrograph, which
essentially is a plot of discharge versus time. Changes in discharge cause changes in water level of the
river channel. At very high discharges (greater than bank-full discharge) a river may overflow its
banks on to the adjacent plains (flood plain). The flood plains are generally narrow in the upper

James Sutherland & Richard Soulsby
HRPP509 11
reaches and wide in the lower reaches. In heavily populated areas the flood plain is usually intersected
(reduced in width) by artificial banks (dykes). Natural rivers often show meandering patterns within the
flood plain areas, while controlled rivers are confined within the fixed banks (dykes). In other cases,
natural rivers may have single or braided channels. Sediments transported by a river are in the
range from very fine clay minerals to large-scale cobbles and boulders. The sediment accumulated in
the river bed is the alluvial part of the sediment load. The fine sediments not present in the bed are
carried in suspension as wash load. The total sediment outflow from a catchment area is called the
sediment yield of that area.
Scale models are specifically useful for the design of river improvement works and hydraulic
structures related to three-dimensional and time-dependent phenomena. Model calibration should
be done by using data of the known actual situation.
4.3.8. Coastal areas
Physical scale models have been used frequently to study coastal engineering problems. Scaling laws for
movable bed models are well established (Noda, 1972; Kamphuis, 1972, 1982; Hughes, 1993), but the
errors due to scale effects are less well understood.
Bed load and suspended load
Sand transport in a coastal environment generally occurs under the combined influence of a variety
of hydrodynamic processes such as winds, waves and currents. Figure 4.4 gives a schematic
representation of sand transport mechanisms along a cross-shore bed profile of a straight sandy
coast.
Sand can be transported by wind-, wave-, tide- and density-driven currents, by the oscillatory wave
motion itself due to the transformation of short waves under the influence of decreasing water depth (wave
skewness), or by a combination of currents and short waves. The waves generally act as sediment
stirring agents; the sediments are then transported by the mean current. Low-frequency waves
interacting with short waves may also contribute to the sediment transport process.
In deeper water outside the breaker (surf) zone the transport process is generally concentrated in a
layer close to the sea bed; bed-load transport and suspended transport may be equally important. Bed load
transport dominates in areas where the mean currents are relatively weak in comparison with the wave
motion (small ratio of depth-averaged velocity and peak orbital velocity). Suspension of sediments
can be caused by ripple-related vortices. Suspended load may dominate even in the absence of a
current, when the suspended sediment is concentrated in the thin turbulent near-bed wave boundary-
layer. The suspended load transport becomes increasingly important with increasing strength of the
tide- and wind-driven mean current, due to the turbulence-related mixing capacity of the mean
current (shearing in boundary layer). By this mechanism the sediments are mixed up from the bed-
load layer to the upper layers of the flow.
In the surf zone of sandy beaches the transport is generally dominated by waves through wave breaking and
the associated wave-induced currents in the longshore and cross-shore directions. The longshore transport
in the surf zone is also known as the longshore drift. The breaking process together with the near-bed wave-
induced oscillatory water motion can bring relatively large quantities of sand into suspension (stirring) which
is then transported as suspended load by net (wave-cycle averaged) currents such as tide-, wind- and

James Sutherland & Richard Soulsby
HRPP509 12
density (salinity)-driven currents. The concentrations are generally maximum near the plunging point and
decrease sharply on both sides of this location.
Figure 4.4 Sand transport mechanisms along cross-shore profile. Top: cross-shore distribution of wave heights, Middle: cross-shore distribution of longshore current, Bottom: sand transport proc¬esses along cross-shore profile.
Gravel and shingle beaches
Gravel beds and shingle beds are also amenable to physical model studies, and, indeed, this is often the
best way of determining impacts of projects (e.g. blocking of longshore transport by jetties, training walls,
etc.) and the effectiveness of control structures (e.g. groynes, sea walls). The transport is almost entirely by
bedload, which simplifies the scaling arguments. Permeability is an important process, particularly in the
achieving the steepness associated with many shingle beaches, and the formation of berms. The use of low-
density sediments can be helpful in achieving the necessary permeability at the same time as achieving
similitude of transport rates. Experiments can have relatively short durations because the beaches adapt
quickly to the imposed wave conditions, especially if low-density sediments are used. However, as noted in
section 4.4.3, low-density sediments should only be used with a full appreciation of the theoretical and
practical problems associated with them.
Correct modelling of bed load transport and suspended load transport requires that the dimensionless
parameters controlling bed and suspended load transport processes are the same in the scale model and in
the prototype. These controlling parameters are:
� Dimensionless particle size D* = D50[(s1)g/k 2]1/3;
� Shields parameter –cr;
� Current suspension number Z = ws/u* with ws = fall velocity, u* = bed-shear velocity; and
� Wave suspension number (or Dean fall speed parameter) H/ wsT with H, T = wave height, period.

James Sutherland & Richard Soulsby
HRPP509 13
When planning the duration of experiments with a sand bed, it should be borne in mind that ripples can take
a long time to become fully developed, especially under flow velocities that are not much above threshold.
Some exploratory experiments might help to determine the necessary durations.
Cross-shore morphology
Although, coastal morphology is three-dimensional, a two-dimensional cross-shore modelling approach
(wave flume) is meaningful for conditions with a straight uniform coastline and parallel depth contours.
However, along a uniform beach long-shore features like beach cusps, rhythmic bars, rip channels and other
phenomena may also occur and cannot be rigorously ignored. To a certain extent the longshore variability
can be eliminated by spatial averaging (over a typical longshore scale; say order of 1 km) yielding longshore-
averaged profiles.
Various subzones can be distinguished in cross-shore direction:
� Dunes (fore and back dunes):the supratidal zone landward of the toe of the foredune;
� Beach (fore and back beach):the intertidal zone between the toe of the foredune and the low tide line;
berms may be present on the back beach; swash bars may be present on the forebeach;
� Shoreface (upper, middle, lower):the subtidal zone consisting of:
� upper shoreface with breaking waves and breaker bars (surf zone),
� middle shoreface with shoaling waves and
� lower shoreface merging into the shelf zone.
Ripples are usually the dominant type of small-scale bed forms in the upper, middle and lower shoreface
zone. As the current component gains in strength, the ripples become more asymmetrical and larger in
height and length. Generally, the ripples in the upper and middle shoreface are washed out during
storm events and moderate waves to leave a flat bed in the surf and swash zones.
Various descriptive classifications are used to identify the type of cross-shore profile (including the beach):
� Equilibrium and non-equilibrium profiles,
� Barred and non-barred profiles,
� Dissipative and reflective profiles.
Equilibrium and non-equilibrium profiles
An equilibrium profile is an idealized profile that has adjusted to the sediment, wave, and water level
fluctuations at the site of interest. A cross-shore profile is defined to be in a state of (dynamic) equilibrium if
the volume of sand accumulated under the profile and a chosen horizontal datum is constant in time. Ideally,
an equilibrium profile represents a bed profile generated under constant wave energy conditions with a
constant water level in the absence of longshore transport gradients for such a long time that a stable profile
is obtained. Laboratory flume experiments are often designed to simulate the formation of such profiles.
Non-equilibrium profiles caused by the presence of longshore and cross-shore transport gradients, can be
classified as eroding/accreting, steepening/flattening and shifting. Eroding profiles can typically be observed
downdrift of man-made structures normal to the coastline such as long breakwaters, and in the vicinity of
sediment-importing tidal inlets. Erosion of the upper shoreface may lead to profile steepening, if the position
of the shoreline is maintained by beach nourishment (with or without a sea wall). Accreting (and flattening)
profiles can be observed in the updrift zone of headlands or structures normal to the coastline. Often,

James Sutherland & Richard Soulsby
HRPP509 14
accreting profiles have an upward convex shape in the surf zone. These profiles can be found in areas with
abundant sediment supply: in front of forelands, at distal ends of spits, along delta coasts and along outer
edges of coastal plains. Shifting profiles can be associated with the effect of sea level rise. The nearshore
profile maintains its shape while it is continuously adjusting to the rising sea level.
Barred and non-barred profiles
A profile exhibiting a monotonically sloping bed surface is termed a non-barred pro¬file. Under certain
conditions bed features are generated along the profile, which are known as bar-trough systems with their
crests more or less parallel or sometimes at a very small angle to the coastline. Single or multiple bar
systems may be generated. Bars may be either intertidal or subtidal features.
Storm waves attacking a monotonically sloping profile, will often produce off¬shore transport resulting in the
generation of a single submerged bar. After the storm event during periods with low wave energy the
sediments are transported in onshore direction by asymmetric shoaling (non-breaking) waves and a berm
type profile (or step type profile) is gradually formed and the beach will eventually be restored. The berm on
the beach can also be interpreted as a swash bar formed by wave runup processes and welded to the
beach.
Dissipative and reflective profiles
Focusing on the hydrodynamic processes, the reflective and dissipative profiles can be distinguished.
Features of reflective profiles are:
� Most of the incident wave energy is reflected on a relatively steep beach;
� Featureless profile associated with erosion (although sometimes a reconstructive swell can make them
accretive);
� Predominantly occurring on ocean-fronted beaches composed of relatively coarse material, on beaches
in eroding areas and in deeply indented com¬partments.
Features of dissipative profiles are:
� Most of the wave energy is dissipated by breaking of waves in a wide surf zone consisting of a concave
upward nearshore zone and a flat shallow beach;
� Profile exhibits many features such as ridges and runnels, swash bars, longshore breaker bars and
troughs, rip channels;
� Predominantly occurring on exposed high-energy beaches in deltaic regions com¬posed of medium/fine
sands (open marginal sea coasts).
With regards to modelling, a clear distinction should be made between quasi-equilibrium
profiles and time-developing profiles. The distinction between the processes occurring on (steep)
reflective beaches and (shallow-gradient) dissipative beaches is important to recognise in experiment
design, because wave flumes are usually too short to accommodate a shallow-gradient (e.g. 1:50–
1:100) beach. Hence it is easier to simulate reflective than dissipative beaches in flumes. Distorted
models (vertical scale different to horizontal scale) are sometimes used, although the breaking
processes and run-up may not be correct. These scale effects can be compensated to some extent by
modifying the grain-size scale, but this will inevitably be a compromise and some other aspects
might not be adequately represented.

James Sutherland & Richard Soulsby
HRPP509 15
Longshore morphology
The morphology of both small-scale alongshore beach forms (beach cusps, breaker bars, rip channels, sand
waves) and large-scale shoreline forms (beach plains, head¬lands, bays, tombolos, spits, forelands) is
related to depositional and erosional processes acting along the coast under the influence of waves and
currents.
Generally, three main groups of shoreline configuration are distinguished:
� Low-lying (low-gradient) relatively straight coastal plains;
� Irregular indented or embayed coasts;
� Protruding steep-gradient cliff-type or headland-type coasts.
The evolution of coastlines is related to two basic groups of morphological processes, those causing coastal
straightening and those causing coastal irregularity. Further details of these processes are given by Van Rijn
(1998). With regards to modelling distorted models should not be used for scale models of coastal plan
studies as the refraction patterns will not be correct. It is not clear how these scale effects can be corrected
for.
Beach drift and permeability
A characteristic feature in the swash zone during low-energy conditions is the zig-zag movement of the
sediment particles which is also known as beach drifting. In case of oblique wave incidence, the swash will
run up the beach in the direction of wave propagation, but the backwash will move down the steepest slope
under the influence of gravity. This latter movement usually is at a right-angle to the shore. Sediment
particles being moved by the swash and backwash will follow a zig-zag pattern along the shore, parallel to
the front of the breaking waves.
The water carried in the uprush percolates partly through the sediment surface down to the water table,
which typically lies a little above the instantaneous tidal level. This percolation reduces the volume of
downwash, particularly for coarse gravel/shingle beaches, causing the sand carried up to be deposited partly
on the beach face. This build-up of the beach continues during low-energy conditions. During high-energy
conditions with breaking waves (storm cycles), the beach and dune zones of the coast are heavily attacked
by the incoming waves, resulting in a raised water table and erosion of the beach (Nielsen, 1999).
4.4. Sediments and scaling laws
4.4.1. Properties of sediment
Types of sediments
Most sediments are derived from the weathering of rock on land by the action of wind, water and ice
under the influence of temperature, pressu re and chemical reactions. Such particles range in size from large
boulders to colloidal size fragments and vary in shape from rounded to angular. They also vary in specific
gravity and mineral composition (quartz and clay minerals). Clay particles have a sheet-like structure, and
cohere together due to electrostatic forces (cohesive forces) in a saline environment. Consequently, there
is a fundamental difference in sedimentary behaviour between sand and clay minerals.
Sediment particles between 0.062 and 2 mm are usually referred to as sand particles. Based on
mineral and chemical composition, three types of sand can be distinguished:

James Sutherland & Richard Soulsby
HRPP509 16
� Silicate sands (quartz and feldspar);
� Carbonate sands (calcite and aragonite, originating from shell and coral fragments);
� Gypsum sands (crystal forms of gypsum, moderately soluble in water).
Many beaches and shorefaces consist of quartz sand. Some beaches consist of materials from volcanic
sources, such as the black sand beaches of Hawaii and Iceland. Beaches may also consist of biogenic
materials like carbonates (white sands) from coral reef sources. Shells and shell fragments are found on
many beaches, especially in the tropics. They can usually be treated for physical modelling purposes as
being hydraulically similar to the mineral grains they are found with (i.e. only the mineral grains are
considered in the physical model and the shell fragments are assumed to behave similarly).
In some places in this chapter the grain-size is written in terms of D50 (the median grain diameter by mass).
Where appropriate, other grain percentiles such as D90 (the size for which 90% of the sediment by mass
is finer) are specified. The most important distinction for modelling purposes is between non-cohesive
sediments and cohesive sediments.
Non-cohesive sediments
Fluvial bedload transport
Physical modelling of sediment transport using gravel-sized sediments is important for improving and
validating theoretical models of bedload transport rates where field data may be limited. Gravel-sized
sediments have been used to model transport rates for a single characteristic grain size such as the median
grain diameter (D50) and to investigate fractional transport rates for different sizes within a grain size
distribution. The grain size distribution of the sediment used is important since different grain sizes will have
different relative mobilities for a given set of hydraulic conditions (flow velocity, water depth and slope).
Whilst grain size distributions can be chosen to replicate natural environments with appropriate information
from a prototype environment, it is more difficult to reproduce the boundary conditions such as upstream
sediment supply and bed surface texture and structure. Upstream sediment supply may be simulated by
controlling the sediment feed rate and composition, but this may be limited by a lack of field data.
Reproducing natural bed surface textures and structure is more complex since the nature of bed surface
deposit will depend upon the antecedent hydraulic regime and the characteristics of the sediment supplied to
a reach. Natural bed surface textures and structures cannot easily be reproduced and the nature of the initial
bed surface may affect the sediment transport rate. In natural streams, rivers and offshore areas, the bed
may be armoured, in which the finer grains have been winnowed away leaving a surface layer in which the
gaps between coarse grains a filled with successively finer grains, sometimes with biological adhesion as
well. Armoured beds are only mobile under extreme flow conditions.
Mixtures
Graded sediments or mixtures often characterise river and coastal sandy beds. How¬ever, as pointed out by
Parker (1991), the problem of mixtures was in the past mainly faced by generalising results obtained on
uniform materials. However, as coastal sedi¬ment typically has a wide range of grain size, in recent decades
laboratory studies concerning grain sorting have assumed a greater relevance. Such relevance is even more
crucial when problems related to bottom morphology are concerned. Indeed laboratory experiments carried
out with sediment mixtures have shown that when the bedforms are analysed, a selective sediment transport
may take place, enhanced by the presence of sedimentary structures. In the case of ripples, for example, as
shown in Figure 4.5, the coarser fraction tends to accumulate along the ripple crests and the finer fraction in
the troughs, even though large fluctuations of the grain size dis¬tribution within the wave cycle occur (Foti &

James Sutherland & Richard Soulsby
HRPP509 17
Blondeaux, 1995). As a result, mixed sediments tend to stabilize the bottom, thus delaying the appearance
of bedforms. Furthermore, bedforms which appear in the presence of graded sediments are charac¬terized
by longer wavelengths than those produced on uniform sand characterised by the same median diameter
under the same wave conditions.
Graded sediments influence sediment transport significantly: larger particles have a smaller mobility than
smaller ones, leading to a selective transport process of size fractions in a mixture. In order to consider such
a mechanism, the so called hiding function, introduced by Einstein (1950) and Hirano (1971) among others,
has to be taken into account. Moreover during sediment transport due to currents a vertical sorting takes
place in the upper layers of the sandy bed, affecting also the concentration profiles: within such
phenomenon, fine fractions seem to be driven by diffusive processes, while coarse sediments seem to be
controlled by advective processes. Laboratory observations with graded sands showed that suspended sand
sizes are smaller than the original sand bed, increasing with the height above the bed. This is due to
discrimination with respect to entrainment, although once in suspen¬sion finer and coarser grain fractions
show similar concentration profiles (Nielsen, 1983, 1992).
Dibajnia & Watanabe (1996) observed that the transport rate of the finer fraction is reduced by the presence
of coarse sediments, which behave as if there were no finer sand present, thus indicating that hiding effects
takes place; for sand mixtures sheet flow occurs under lower oscillatory velocities than for uniform sand; a
higher velocity is required to wash out ripples formed with widely-graded sand than in the case of a uniform
one.
Figure 4.5 Top view of a rippled sandy bed characterized by a bimodal mixture at two different instants within the wave cycle.
Bimodal sediment mixtures in flume experiments usually consist of sand sized sediment (D50 < 2 mm)
and gravel sized sediment (D50 > 2 mm) in different proportions. Bimodal mixtures are used for
modelling the effects of sediment sorting processes such as downstream fining (e.g. Paola et al., 1992)
and the gravel-sand transition (e.g. Sambrook-Smith & Ferguson, 1996) and to estimate transport
rates where local size information is insufficient to resolve the transport rate on a fraction by fraction
basis (e.g. Wilcock, 1998).
Sambrook-Smith & Ferguson (1996) identified that Froude scaling of mixed gravel/sand sized
sediment can be problematic since finer gravel-sized sediments may need to be replaced by sand
which may have different shape characteristics leading to different packing arrangements, and sand
sized sediment may need to be replaced by silt-sized sediments which will exhibit cohesive
characteristics. Therefore, experiments may need to retain the original prototype sediment size
distribution and use lower depths and higher slopes to achieve equivalent shear stresses. Although

James Sutherland & Richard Soulsby
HRPP509 18
this may introduce some hydraulic distortion it is possible to maintain grain Reynolds numbers Re* =
(u*D90)/vk indicative of fully rough turbulent flow and subcritical flow conditions. Warburton & Davies
(1998) suggest that if the grain Reynolds number is greater than about 70 then rough turbulent flow
will occur which is independent of viscous effects; following this principle it is suggested that to fulfil
approximate dynamic similarity the following requirements must be satisfied:
� Sediment density is the same in the model and prototype;
� Model grain sizes are scaled geometrically;
� Water is used as the fluid;
� Bed slope is the same in the model and prototype;
� Flow is rough-turbulent; and
� Froude number similarity.
It may prove difficult to achieve all these requirements in practice, e.g. scaling all the grain-sizes in a
widely-graded mixture at a small geometric scale might result in the finest grains exhibiting cohesive
properties. Sometimes the bed slope is increased in small flumes to compensate for a shallow water
depth in order for the Shields parameter to be maintained. One problem with this is that the near-bed
turbulence changes in very shallow flows, so that threshold condition also changes.
Experiments using mixtures of sand and gravel have shown that the transport rates of sand and gravel
depend on the proportion of each size fraction present in the bed which controls the availability of each size
fraction (Wilcock, 1998). However, the critical shear stress required to transport the gravel-sized fraction also
decreases as the sand content of the mixture increases (Wilcock, 1998). Moreover, the structure of the bed
changes from clast-supported to matrix-supported when the sand fills up the pores of the gravel entirely,
affecting the bed roughness and bedforms.
Cohesive sediments and mud
Sediment mixtures with a fraction of clay particles larger than about 10% have cohesive properties because
electro-static forces comparable to or higher than the gravity forces are acting between the particles.
Consequently, the sediment particles do not behave as individual particles but tend to stick together forming
aggregates known as flocs, whose size and settling velocity are much larger than those of the individual
particles. Settling velocities of individual particles (deflocculated) are in the range of 0.1 to 1 mm/s.
The grain size scale of the American Geophysical Union for sediments with parti¬cle sizes smaller than 2
mm consists of about 13 subclasses ranging from very coarse sand to very fine clay. Herein, five somewhat
broader subclasses are distinguished:
Coarse sand (non-cohesive) 0.5 to 2 mm (500 to 2000 m)
Fine sand (non-cohesive) 0.062 to 0.5 mm (62 to 500 m)
Coarse silt (sometimes cohesive) 0.032 to 0.062 mm (32 to 62 m)
Fine silt (weakly cohesive) 0.008 to 0.032 mm (8 to 32 m)
Clay+very fine silt (very cohesive) < 0.008 mm ( < 8 m)
The cohesive fraction with clay and very fine silt is taken to consist of particles with diameters smaller than 8
m (clay-silt dominated fraction). Bed samples consisting of mixtures of clay, silt and sand can be
classified as in Table 4.1.

James Sutherland & Richard Soulsby
HRPP509 19
The transport of bed material particles may be in the form of either bed-load or bed-load plus
suspended load, depending on the size of the bed material particles and the flow conditions. The
suspended load may also include some wash load (usually, clay-silt dominated fraction smaller than 8 m).
Cohesive properties become effective when the clay-silt dominated fraction is larger than about 10%. The
critical mud fraction (particles 62 m) will be a factor 2 to 3 larger (20% to 30%).
Table 4.1 Types of sand-mud mixtures
Type of sediment Organic material
Clay + fine silt
(<8 m)
Silt (8 to 62 m) Sand (>62 m)
Sand (non-cohesive) 0% 0% 0% 100%
Muddy Sand (weakly-cohesive) 0–10% 0–5% 20–40% 60–80%
Sandy Mud (cohesive) 0–10% 5–10% 30–60% 60–30%
Mud (cohesive) 0–20% 10–20% 50–70% 0–10%
Silty Mud (cohesive) 0–20% 10–40% 60–80% 0%
Clayey Mud (cohesive) 0–20% 40–60% 40–60% 0%
The use of physical models for studies involving cohesive sediments is not current practice in most
hydraulic laboratories, but their use has been promoted both in France (principally by Sogreah) and in
China. These experiences are described below.
Physical modelling with mud in France
The use of mud in physical models was developed in France by Dr. Claude Migniot between 1955 and 1987
along two main lines: (a) a proper characterization of mechanical properties of natural muds in various
environments, and (b) for prediction of siltation in harbour basins, navigation channels and water intakes
located mainly in estuaries (current–dominated environment).
Standard laboratory tests on natural muds were developed by Migniot in the fifties and early sixties to
characterize their mechanical properties. A large database has been gathered in fluvial, coastal, estuarial
and industrial environments and reported (in French) in two major publications in La Houille Blanche
(Migniot, 1968, 1989). These results have been disseminated internationally by Migniot & Hamm (1990) and
Hamm & Migniot (1994) and also through two European projects (MAST-G6M and MAST2- G8M projects)
between 1990 and 1995 (MAST-G6M, 1993). Such tests included:
� Deposition tests in calm water with deflocculated (in fresh water) and flocculated (in salty water)
sediments;
� Consolidation tests including changes in the rheological properties of the deposit;
� Erosion and deposition tests under current action on consolidated beds;
� Mobility of fluid mud in calm water.
The technical details of the test procedures and instrumentation have been documented during the G6-M
Coastal Morphodynamics European project (MAST G6M, 1993). Experiments of flume measurement of
mud transport on a flat bottom under steady and alternating currents was fully documented in the
MAST-G8M project (Viguier et al., 1994a).

James Sutherland & Richard Soulsby
HRPP509 20
Two important points should be stressed here. First, natural mud samples are used and care should
be taken with organic matters which induce rapid evolution of mud characteristics when transferred in
the lab. Usually, organic matters are neutralized before the experiments. This is a strong limitation when
they play a major role in the field. Secondly, adequate and specialized instrumentation should be used;
most particularly to measure vertical concentration profiles and rheological properties in deposits.
Physical scale model techniques have been developed empirically by Migniot for solving practical siltation
problems in a series of about ten port developments. Such models were highly distorted by a factor 4 to
12. Two kinds of sediments have been used in such models depending on the percentage of clays. When
this percentage was low, bakelite powder was used. On the other hand when it was significant, treated
natural mud was used. This treatment was aiming at getting a correct settling velocity
and critical shear stress for erosion in similitude (Caillat, 1987). It included an elimination of the coarse part
of the sediment and a chemical treatment of the mud and the water with sodium pyrophosphate to
reduce the cohesion of the mud.
Recent models of this kind included: the Mont-Saint-Michel sedimentation study where silts and fine
sands were dominant (Viguier et al., 2002); and the Loire estuary studies where three models were built
and used to predict siltation rates in port developments (Caillat, 1987). One of these models
(siltation in a transverse trench) was documented during the MAST-G8M project in order to be used
as a benchmark for numerical siltation models (Viguier et al., 1994b). Sogreah has also used a
physical scale model to study the behaviour of ships progressing in fluid mud (Brossard et al.,
1990).
However, such mud models have not been run at Sogreah for the last five years for two reasons.
Firstly, mechanical properties of muds are measured in-situ and secondly 3D numerical
morphodynamic models of mud transport have now reached a similar or even better level of
efficiency to predict siltation at a much lower cost and with higher flexibility. The case where such a
scale model could be envisaged in the near future is to reproduce channel meandering on silty tidal
flats where numerical models are still not able to make reliable long-term predictions. In such cases
we recommend the use of very light artificial sediments like sawdust (see Mont Saint-Michel study).
Physical modelling of fine sediments in China
Most of the Chinese water systems are rich of fine sediments (high to hyper concentrations) and
sedimentation of fines is a serious problem at many sites. These problems have been studied by scale
models based on the theoretical analyses of Guoren Dou (1998). According to his approach, all particles and
all forms of sediment transport can be reproduced simultaneously in one model. The main difficulty is that
the time scale of bed deformation related to suspended load is very different from that related to bed load.
His analysis indicated that the difference in time scales of bed deformation was caused by the fact that the
similarity of incipient motion was not considered for suspended load transport models, while the similarity of
particle settling was not considered for bed load transport models. If both similarity criteria are satisfied, the
difference in time scales of bed deformation will disappear.
Guoren Dou (1998) present a set of scaling laws including the Froude scale, the settling velocity scale, the
sediment transport scale and the time scale involved.
The settling velocity scale is: Nws NU (Nl /Nh)−1
(Nh)0.5
(Nl /Nh)−1
.
Here Nl, Nh, are model geometric scale factors in the horizontal and vertical directions (distorted model), and
Nws and NU are scale factors for settling velocity and current speed.
James Sutherland & Richard Soulsby
HRPP509 21
Depth and length scales are of the order of 100 and hence the settling velocity scale is of the order of 10.
Given the fact that the suspended sediments in the prototype are already very fine, the model sediment
would have to be very fine, resulting in the use of light-weight materials. Often, polystyrene with a base
density of 1060 kg/m3 or bakelite powder with a base density of 1450 kg/m
3 have been used as model
sediment. For example, to study the sedimentation problems related to the fluctuating back water zone of the
Three-Gorges Dam in the Yangtze River, a scale model (Nl -250, Nh -100) with a length of 800 m was made.
Scouring and deposition patterns in the scale models have been found to show very good agreement with
prototype patterns.
4.4.2. Scaling laws
General principles
The basic philosophy for movable-bed models can be formulated as ensuring that the relative magnitudes of
all dominant processes are the same in model and prototype. Preferably, the scale model should be
validated using field (prototype) data, but often this is not feasible and large-scale model results are used as
prototype data. The scaling must be considered for both the hydrodynamics and the sediment dynamics, and
correct scaling of the former does not necessarily lead to correct scaling of the latter.
Two “tricks of the trade” are sometimes used to assist with obtaining scale-similarity:
� Use of a distorted-scale model, in which the vertical scale-factor is smaller than the horizontal scale-
factor (i.e. vertical exaggeration);
� Use of low-density model sediment, which gives an extra variable that can be utilised to obtain scale-
similarity of more than one parameter.
Despite their apparent advantages, both of these techniques introduce extra uncertainty into the
interpretation of model results at prototype scale, so they should be avoided if possible, or used with a full
understanding of the consequences if they are adopted. Further discussion of these techniques is given
later in this section. However, we will start by considering an undistorted model, and natural-density
sediment.
The model scale factor, NX, of a physical parameter X is defined as the ratio of the prototype value of X to
the model value of X. Thus the geometric model scale factor in an undistorted model is Nl, where l is
any characteristic length (e.g. defining the bathymetry, or the size of a structure). In a distorted-scale
model Nl is the geometric scale factor in the horizontal direction, and Nh is the (usually smaller) geometric
model scale factor in the vertical direction (including water depth h). In undistorted models, Nh = N l,
while in distorted models the vertical exaggeration is Nl /Nh. Similarly, model scale factors can be
defined for any other physical variables; for example, Nt, Nws, Nqb are the scale factors for time t,
settling velocity ws, and bedload transport rate qb.
Hydrodynamics: Froude scaling
The most widely used, and generally applicable, scaling law used for the hydrodynamics of free-surface
flows in physical models is Froude scaling. If the geometric scale (i.e. the ratio of lengths l in the prototype to
those in the model) of an undistorted model is N l, then with Froude scaling all times are scaled by
N t, where Nt = (Nl)1/2
. This scaling law was developed in the 19th century by William Froude on the basis of
his pioneering model tests of ship dynamics in towing tanks. Furthermore, it can be shown from
consideration of the momentum equations that Froude scaling is applicable in general to free-surface flows

James Sutherland & Richard Soulsby
HRPP509 22
where the dominant controlling force is gravity. This scaling follows from the need to maintain constant ratios
between the various terms in the equations of motion in order to have dynamic similarity between model and
prototype. The relationship Nt (Nl)1/2 is required because the gravitational acceleration, g (units [LT−2]),
is normally the same in model and prototype (with the exception of centrifuges for modelling of soil
mechanics). This scaling is equivalent to the requirement that the Froude number U/(gh)1/2 is the same at
model and prototype scales, where U is (current or wave-orbital) velocity, and h is water depth. For open
channel flow the Froude number is a very important parameter describing the character of the flow: tranquil
or shooting flow, whether disturbances can propagate upstream or not and the magnitude of variations in the
surface level when the flow is disturbed. For surface gravity waves no similar important dimensionless
Froude number can be defined – even though surface gravity waves are some of the hydrodynamic
phenomena best reproduced in a scale model based on Froude’s model laws.