jan 80 a a s!annetti. .j c erickson w. innuu · this report has been reviewed by the esd...
TRANSCRIPT

7 " AIR FORCE GEOPHYSICS LAB HANSCOM AFB MA F/ 9/6AFSL BALLOON TELEMETRY FACILITY. (U)JAN 80 A A S!ANNETTI. .J C ERICKSON
UNCLASSIFIED AFOL.-TR-80-0029 W.
iI innuu.....T

APGL.TOR.8-002VSSTATON PAPSUS, NI. 2111
AFGL Balloon Telemetry Facility
ARTHUR A. GIANNETTI
J. CRAIG ERICKSON
23 January 1980
Approved for publi release; dlstrlbution unlimlted.
8W AEROSPACE INSTRUMENTATION DIVISION PROJECT 6665e. AIR FORCE GEOPHYSICS LABORATORYU~" HACQ APB, MAssACuseTs 01731
AIR FORC SYSTEMS COMMAND, USAF

* ~ .Y.,~-.--...-*,.-.xf
This report has been reviewed by the ESD Information Office (01) and isreleasable to the National Technical information Service (NTIS).
This technical repork has been reviewed andis approved for publication.
FOR THE COMMANDER
Qualified requestors may obtain additional copies from theDefense Documentation Center. All others should apply to theNational Technical Information Service.

Unclassified3ECURITY CLASFICATION Of THIS 4GE eft- flat., ,I-.d)
REPORT MOqENTATION PAGE BFRE COMPLETINORM
-:--- I - - 1rMVT CniiSIN W0. 1. RECIP"FNY'S CATALOG N-UMUUrt
-- _TITLE- S--.- . TYrE OF REPORT II PERIOD COVER1EO
AFGL BALLOON TELEMETRY FACILITY / Final- / S. PERFORMING ONG. REPORT NUMBER
_____________________IP No. 7284 V
7. AUTrHOR(.L S. COMIRACT ON GRAN TINUMEERO.)
Arthur A. /GiannettiJ. Craig/jErickson
S. ERFORMING ORGANIZATION NAME ANO AORSS1PGA LMW-ROE.TSIAir Force Geophysics Laboratory (LCC) A A WORIrANIr MBER
Hanscom AFB V 620 .. f~~lF ;
Massachusetts 01731 /& 666503804II. CONTROLLING OFFICE NAME AND ADDRESS1-.R"TVJL_
Air Force Geophysics Laboratory (LCC) 7/-23 Janve= 148ffHans corn A FB 4 M AS
Massachusetts 01731 22/7 I WI4._RN.99CAMiLLA A~f.1UdLU~m.J2inVCfLVADL2W.c) IS. SECURITY CLASS. (of this MPofl)
~, /, rI UnclassifiedIs.. OECLASSIFICATIONIDOWNURtAING
Il SCHEDULE
L !U!AQ TM'I4T . / ) -R f/I.Y
Approved for public release; distribution unlimited.
17. DISTRIBUTION STATEMENT (af I. hbi,6d .Ifferdin DfocA 0 i I..,,I.. w
IS. SUPPLEMENTARY NOTES
PSL-/NMvSU
IS. KEY WORDS (Cortim~ m, -w..ee aide it ,.oesy amd 156.1117& by bI,.k . .b..)
TelemetryComputerDataPulse code modulation
20. "AI~TRACT (C.-tI- - ,.. ei5. if no...~- M identif by Sf@,,k RIS.V)
This paper desjcribes the recently modernized permanent and mobilefacilities for recovering and processing PCM and FM telemetry data fromballoon-borne scientific experiments and engineering tests at Air Force Geo-physics Laboratory, Detachment 1, Holloman Air Force Base, New Mexico.Mobile units are run either as stand-alone ground stations for launches fromremote launch sites, or with telephone communications link to extend theoperable range from the permanent ground station on Holloman AFB.
D IN7 1473 EDITION Of I NOV 45 IS OBSOLETE UnclassifiedSECURITY CLASSIFICATIONW OF THNIS PAGE (U9t. D*I* esmd)

SCCURITY CLASSIFICATION OF THIS PAGE(UYUI DINA E"f.-d)
StCURITY CLASSIFICATION OF THIS PAGE(WSMf DIl. EM-cf.))

AoesUSoo For
NTIS @PAIec TAS
lbmmOUIc ed
Dist Special
Contents
1. INTRODUCTION5
2. GENERAL DESCRIPTION 6
3. RECEIVING SUB3SYSTEM 8
4. PCM TELEMETRY SUBSYSTEMI 9
5. PDP-11/40 PROCESSOR it
63. PDP-11 PERIPHERALS 13
7. SOFTWARE 15
8. TIMING 19
9. DATA DISPLAY SUIBSYSTEM 20
10. DATA RECORDING 21
It. MOBILE GROUND SUPPORT 22
Illustrations
1. Fixed Telemetry Facility 72. Telemetry Support Systemn 73. Data Receiving Subsystem 8
3

Illustrations
4. PCM Subsystem 9
5. Processor Subsystem 12
6. Real-Time Program 16
7. Example of PCM Data Set Format 17
8. PCM Interface, Raw Data Edit 17
9. Real-time Program, Raw Data Edit 18
10. Real-Time Program, Raw Data Average 18
11. Pressure/Altitude 18
12. Record and Display Subsystem 20
13. Mobile Telemetry Facility 22
4

AFGL Balloon Telemetry Facility
i. INTRODUCTION
This report describes the data acquisition and display capability available to
scientific experimenters for developmental projects utilizing a balloon vehicle
from the Air Force Geophysics Laboratory (AFGL), Detachment 1, Holloman AFB,
New Mexico.
Under IHWU 66650804, the capability to provide real-time data reduction and
display using a PDP 11/40 minicomputer and a PCM ground station was developed.
The average experimenter or "user" is primarily concerned with the balloon-
borne scientific apparatus or test package that is the basis of his mission. For
collection, telemetry, recording and display of the data, and command-control of
the experiment, the scientist usually relies upon the personnel and instrumentation
at the test facility. This paper discusses the capabilities available at AFGL Det 1
for reception, collection, manipulation, and display of telemetry data transmitted
from the balloon-borne instrumentation.
The ground system operates either with standard, balloon-borne PCM data
encoders provided by AFGL, or in special circumstances, with encoders supplied
by the experimenter. Multiple displays present information in real time from the
on-board scientific apparatus. The collected data are recorded on analog and dig-
ital magnetic tapes for analysis either at the ground station, or later, at the user's
(Received for publication 22 January 1980)
59

home station. The ground tation is configured about a Digital Equipment Corpo-
ration PDP-11/40 computer and its peripherals and EMR telemetry equipment.
A modernization program has been underway to improve the ground-support
instrumentation at the permanent station and in mobile units. The Aerospace In-
strumentation Division of AFGL, and the Physical Sciences Laboratory of New
Mexico State University under AF Contract F19628-78-C-0070, have been imple-
menting this program. Motivation for this program has been to replace some
aging, inadequate equipment with modern, more reliable and versatile electronics
and to minimize the cost of these support functions. Economies can be realized
through commonality and standardization of support hardware and software. The
unique requirements of each experiment are not constrained; in fact, the experi-
ment usually is enhanced by taking advantage of the extensive experience and
equipment available at AFGL Detachment 1.
2. GENERAL DESCRIPTION
The AFGL Detachment 1 balloon flight facility is located in Building 850 on
Holloman Air Force Base, near Alamogordo, New Mexico. All real-time data col-
lection and scientific display capabilities are conveniently located within a single
room. Figure 1 is a photograph of this room. Directly across the corridor is"mission control". Here the mission controller is primarily concerned with bal-
loon launch, flight control, safety and recovery operations.
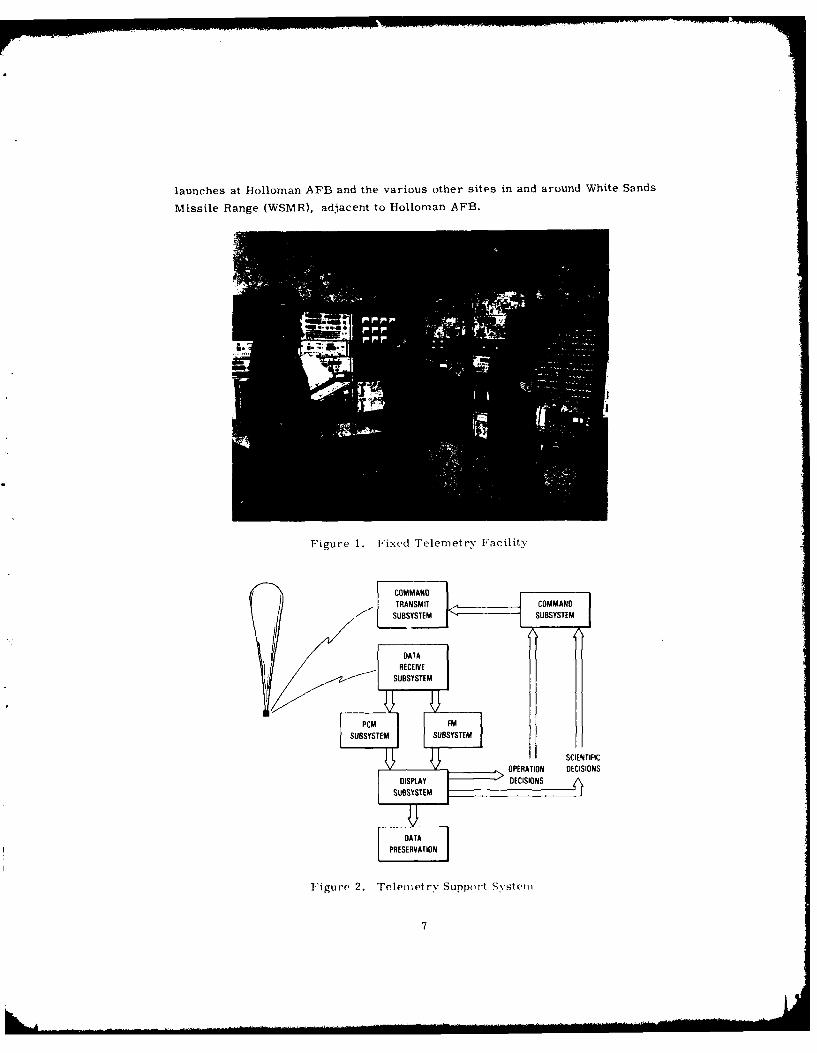
This AFGL facility has a very versatile communication system for in-flight
data recording, display and uplink commands. Both Frequency Modulation (FM)
and Pulse-Code Modulation (PCM) telemetry systems are available with a variety
of equipment which allows the scientific user accurately to recover, display and
record data from balloon-borne experiments. A block diagram of this system is
shown in Figure 2. Line printers, cathode ray tubes (CRT's), analog pen record-
ers, nine-track digital tape units, and disks allow the user to record and/or mon-
itor vital data received from the balloon in real time. By utilizing the information
on the display system, the scientist can make timely decisions to alter experi-
ment operations, or to change the balloon trajectory. With such powerful tools as
the PDP-11/40 digital computer, the experimenter can manipulate the received
signals so that data parameters can be displayed in scientific form for ease of
interpretation. All recorded data can be replayed at real-time speed or more
slowly, either to verify operational readiness, or in preparation for subsequent
flights. For in-depth data reduction and analysis, the data recorded from the sys-
tem can be compatible to large-scale, data-reduction facilities. The base facili-
ties at AFGL, Detachment I can provide scientific support in real time for balloon-
borne devices at operating ranges as far as 250 miles away when the balloon altitude
is 50, 000 ft or higher. This coverage allows routine operational support for
6
launches at Holloman AFB and the various other sites in and around White Sands
Missile Range (WSMR), adjacent to Holloman AF13.
Figure 1. Fixed Telemetry Facility
OPANSMATIOMNDEIOS
l'igurSSTE S.TUBmtrYSTEMtSvte
7AT

A mobile facility with similar data acquisition capabilities is also available
to the user who requires coverage from remote launch locations, or extended
coverage for flights from Detachment 1. For the latter purposes, that is, at
ranges greater than 250 miles, the mobile facility can be strategically located,
with a telephone communication link to the base facilities. This arrangement will
provide continuous display of scientific data back at the base facility, but because
of the limited data rates achievable over standard telephone lines, only subsets of
the total data packages will be displayed.
Due to the flexibility of the PCM system, the bit rates, bit order, word sizes,and data content can be adapted to a wide range of formats. Nominal data rates
for most applications is in the lower kilobit range. Data rates as high as 512, 000
bits per second and 1600 frames per second have been successfully received and
processed and the data displayed. Bit rates as high as 2, 000, 000 bits per second
could be handled. Standard software is available for the "standard" data set, and
special programs can be developed for users with individual requirements. For
example, Dr. Earl Good of AFGL recently conducted an experimental program to
obtain data for modeling upper atmosphere turbulence. Special data-manipulationsoftware was generated together with special displays that enabled him to con-
tinuously monitor the status of his experiment and make immediate decisions to
control it.
3. RECEIVING SUBSYSTEM
The receiving subsystem is the "front end" of the telemetry data system.
Signals are received from the balloon-borne transmitters and are routed to the
subsystem which can convert it back into intelligent data. An Andrews Corporation
steerable-antenna system is used to receive these signals. A functional block
diagram of this system is shown in Figure 3.
ANTENNA
CONTROL POSITION
FROM RECEIVER R POS .COMMANO CONTROLXMIT ANDO
SUBSYSTEMOITSUBSYSTEM TO PCMIFM SUBSYSTEMS MONITOR
Figure 3. Data Receiving Subsystem
8

Signals can be received during setup for launch and while the balloin is mov-
ing out of the launch area. The manually-controlled antenna can be , iwed in anydirection in order to optimize reception of the signals. Fi or I he ar, ,T. N'Stem
the signals are routed to a multicoupler. The multicoupler arc ents 1.e Sfl Q, ,I-
put and generates multiple outputs. These outputs are presented to t,. ?Iodxn(
1100 AR receivers.
The receivers can be tuned to discern the preassLg d transmitter frequency
signals from among others that may be present. With inputs in the S-Band fre-
quency ranges, the receiver provides outputs which can be presented to either the
PCM subsystem or the FM subsystem.
4. PCM TELEMETRY SUBSYSTEM
Within the telemetry system there are two distinct capabilities, PCM and FM.
In general, the PCM system provides more flexibility in data encoding and trans-
mission. The PCM subsystem is configured around the Digital Equipment Cor-
poration (DEC) PDP-11/40 digital computer. Data flows into and out of the com-
puter via the flexible DEC UNIBUS. A block diagram of the PCM subsystem is
shown in Figure 4.
FROM RECEIVE SUBSYSIEM
WORD SIMULATORA EL
OCM T PROCESSOR
TO DISPLAYSUBSYSTEM
Figure 4. PCAI Subsystem

Data is obtained from the two receivers of the receiving subsystem. The
information is presented to an EMR 720 Bit Synchronizer. The Bit Synchronizer
accepts the PCM data in the presence of noise and other perturbations and gener-
ates reconstructed, coherent PCM data and multiple clock outputs. EMR can
process all standard Inter-Range Instrumentation Group (IRIG) PCM codes, which
include NRZ-L, NRZ-M, NRZ-S, Bio-L, Bio-S, BiM, RZ, DM-.M and DM-S.
The unit offers a high level of performance over the range of I bps to 5, 000, 000
bps. It can handle from one to four different signal inputs. rurrently, these
include the two receivers and a PCM Simulator. The 720 can be either manually
controlled or controlled by the PDP-ll/40. The multiple inputs allow rapid selec-
tion of the different signal sources so that data reception and system testing can
be optimized.
The NRZC PCM data and timing outputs of the EMR 720 Bit Synchronizer are
routed to an EMR 710 Decommutator which performs frame synchronization and
serial-to-parallel conversion, and provides a parallel data multiplex output with
synchronization information. Any frame-synchronization pattern between four
and 33 bits, with frame lengths of up to 512 words and bit rates as high as
2, 000, 000 bps, can be accommodated. The 710 parallel output and synchroniza-
tion information is presented to an EMR 713 Programmable Word Selector. Serial
NRZC data from the 720 Bit Synchronizer, and frame-synchronization information
from the 710 are presented to the computer interface.
At the EMR 713 Word Selector, the received PCM data and frame-synchroni-
zation information is used to convert se'ected 8-bit and 12-bit data words to analog
form. The selection process is done by a manual patchboard which can select up
to 32 different data words in each frame. Both main-frame data words as well as
subframe-data words can be selected. Output analog data words are represented
by a dc voltage of 0 to 10 volts. These 32 analog channels are updated at the frame
and subframe rate of the incoming data. Data word least-significant-bit (LSB) and
most-significant-bit (MSB) alignment takes place at the patchboard so that data
from any balloon-borne encoder can be accommodated. Each of the 32 analog out-
put data channels is routed to a display patchboard for assignment to selected ana-
log display devices optimum for the scientific user.
The serial NRZC PCM data output of the 720 Bit Synchronizer and the frame-
synchronization information from the 710 Decommutator are routed to the special
purpose PCM interface unit. This unit is specifically designed to meet the vary-
ing needs of the PCM subsystem. Its purpose is to preprocess the incoming PCM
data, multiplex time-of-day information with it, and pass the parallel data to the
PDP-11/40 processor. By utilizing a patchboard within the unitt, the aata presented
to the computer can be optimized so that data-word formats will essentially re-
main constant in light of inputs which will vary from one balloon-borne experiment
10

to another. Such things as data-word bit alignment (ILSB/lSB reversals), place-
ment within the computer word, automatic parity checking, and deletion of un-
needed data words within the mainframe are performed by the interface. The
resulting PCAI data is then merged with the time-of-day (TOD) information for
data time tagging. Time tags selected can be from milliseconds, to the day of
the year, according to the user needs. Flexibility exists for the user to be able
to select the event to which the TOD information is applicable, for example, to
the mainframe sync, the first data word, etc. Additional status information is
also merged into the data buffer which is then transferred to the computer. This
frame/data word processing and time multiplexing can take place at frame rates
of several thousands per second, limited only by the PDP-11/40 processor.
The parallel data from the PCM Interface are then presented to an EMR 2763
Buffered Data Channel. This unit, under program control and initiation, will
transfer data words from the interface into program-selected segments of the
PDP-11/40 processor memory. This transfer takes place under Direct Memory
Access (DMA) and interrupt control, which minimizes attention required by the
program and maximizes throughput rates. Up to 250, 000 16-bit words per second
can be transferred to the processor memory by this device. Communication be-
tween the 2763 and the PDP-11/40 is through the PDP 56-line UNIBUS. At this
point, selected PCM data received from the balloon-borne experiment are pre-
sented in real-time to a digital program being executed within the PDP-11 /40
processor. The data are available for display or manipulation according to
algorithms defined by the scientific user. Output displays and permanent record-
ings are also selected according to the data collection requirements.
For pre-mission testing and system evaluation, an EAIR 2795 PCM Simulator
is used to generate signals like those to be received from the balloon-borne tele-
metry package. 2795 formats can be generated with up to 599 words in the main-
frame and tp to 599 words in the subcommutated frame, and with word lengths from
one to 33 bits. Serial PICM signal outputs can be in any one of eight codes which
include NRZ-M, NRZ-S, RZ, Bio-L, 13i-M, BiO-S, and DM-S at bit
rates roin 1 bps to 2, 000, 000 bps.
5. PI)P-I I/I PRO(ESSOR
The center o)f the PC'M procssing system is v PDP-11/40 Computer. This
ctmaputer accepts the, PCM and time inputs, processes selected data according to
pre-defined algorithms, and outputs the results to displays or permanent storage
devices. The digital real-time program which resides in the processor controls
this data rl,,w and performs the data manipulations. A block diagram of the PDP-
11 40 pr cessr subsystem is shown in Figure 5.
11

POP-11/40 56 LINE UNIBUSPROCESSOR
PC05K05C
PISKK TAPE
r AUDIO EM 73 AINEl LA 36COUPLER DATA CHANNEL L CRT I ECWRITER
LA 3 HAZELTINE DIGITAOECWRITER CRT DISPlAY
OPERATIONS CONTROL CENTER
Figure 5. Processor Subsystem
The PDP-11/40 computer is a 16 bit, general purpose, parallel logic, micro-
programmed computer using single- and double-operated instructions and "2's
complement" arithmetic. The system contains a multiple-word instruction proc-
essor which directly addresses up to 28, 000 words of core memory. All com-
munications among the system components (including processor, core memory,
and peripherals) are performed on a single high-speed bus, the UNIBUS. Because
of the bus concept, all peripherals are compatible, and device-to-device transfers
can be accomplished at the rate of 2. 5 million words per second.
The central processor unit (CPU) is a KD1l-A which decodes the instructions;
accepts, modifies and outputs data; performs arithmetic operations; and controls
allocation of the UNIBUS among external devices. The processor contains 16 hard-
ware requestors, eight of which are programmable. The processor recognizes
four levels of interrupts with each major level containing sublevels. The priority
level of the processor is itself programmable, allowing a running program to se-
lect the priority level of permissible interrupts. Additional speed and power are
added to the interrupt structure through the use of the fully vectored interrupt
scheme.
Contained within the CPU is the Extended Instruction Set option (EIS) which
provides the capability of performing hardwired fixed-point arithmetic. Also
within the CPU, is the Floating Point Unit option which allows the execution of four
12

I
special instructions for floating point addition, subtraction, multiplication and
division. Together, the EIS and Floating Point capabilities allow significant
execution time and program implementation improvements over the comparable
software routines. In effect, complex mathematical algorithms can be performed
in less time, thus enabling the processor to handle larger user-task routines.
Core memory of the processor is a MF11-U which is a read/write, random
access coincident current magnetic core type, with a maximum cycle time of 980
nanoseconds (ns) and a maximum access time of 425 ns. The word length is 16
bits and consists of 32, 768 words (32K words), of which only 28K are program
accessible.
6. PDP-1I PERIPHERALS
A number of peripherals are attached to the PDP-11/40 to optimize program
development, user output display, and system control. These units consist of
hardcopy units, CRT's, disk drive, magnetic tape drive, numeric display, paper
tape system and an audio coupler. Two hardcopy devices are used within the
system: an LA30 and an LA36 DECwriter. The LA30 DECwriter is a dot-matrix
impact printer and keyboard capable of printing a set of 64 ASCII characters at a
speed of up to 30 characters/second on a sprocket feed 9-7/8-inch wide continuous
form. Each line is 80 character 'vjsitions in length with a spacing of 10 charac-
ters per inch, and a vertical spacing of six lines per inch. This unit is located in
the balloon operations control center as an output device for balloon operational
information such as altitude, temperature, pressure, etc.
The 1,A36 DECwriter II hardcopy device is located in the telemetry/display
room where information for the scientific user can be displayed. An LA36
DECwriter II is a medium-sized, interactive data-communication terminal with a
standard ASCII-coded keyboard (consisting of alpha-numeric characters and non-
printing characters) and prints at a horizontal spacing of 10 characters per, inch
with a maximum of 132 characters per line, and a vertical spacing of 6 lines per
inch. The printer is capable of handling continuous multipart- and multiform-line
printer paper from 3 to 14-7/8 inches wide. The print rate is selectable from 10,
15 or 30 characters per second. In addition to being available as a scientific data
output device, it is also used as the primary program setup and initiation input
device by the operator'.
For real-time processing program development and for program execution
use, there are two RK05 Disk Drives. The RK05 Disk Drive is a self contained,
random access, data-storage device which uses a high-density single-disk, 12-
sector and l1;-sector cartridge as its storage medium. Two movable heads can
13

record or read up to 406 data tracks which can store up to 25 million bits of on-
line data. Maximum bit transfer rate is 1. 44 million bits per second.
For maintenance test program loading and use as a special storage medium,
the PC05 Paper Tape System is used. It is available for use between a user com-
puter system and the AFGL data support system, but isn't normally used because
of its low speed.
The PC05 High-Speed Paper Tape Reader is an electromechanical tape-feed
system from which information is read from eight-level, 1-inch perforated tape,
at a maximum rate of 300 characters per second. The tape punch is also an elec-
tromechanical tape-feed and punch system capable of punching five-, seven-, or
eight-level tape.
Two CRT units are incorporated into the system to display dynamic data to
the viewer. One CRT is located in the operation control room where the mission
controller can access special routines within the processor. Utilizing the two-
task program execution system of the processor, the mission controller can call
up special programs for execution. These programs yield information such as
ballasting or valving effects versus amount of ballast dropped, or amount of helium
valved with considerations such as altitudes, pressures, temperatures, time of
day, etc. Positioning programs could also be used for locating the balloon with
respect to any local OMEGA station. Other special routines, such as parachute
drift, time to impact, etc., could be called up for assisting in recovery decisions.
The second CRT is located in the telemetry/display room and is available for
display of user-selected parameters. Generally, the data displayed is dynamic
information updated at the sampled frame rate. Battery voltages and currents,
positions, etc. can be displayed in a fixed format on the CRT. Additional assists
to the user are available by defining critical parameter-monitor algorithms, for
example, allowing the processor to automatically monitor battery voltages, and
providing output alerts to the operator via the CRT if they exceed predefined
values. These algorithms can be as versatile as needed by the specific user.
The two CRT's used in the system are Hazeltine 1500's. The 1500 has both a
video terminal as well as a keyboard for data entry. The keyboard is the same as
a standard typewriter plus a keypad which together include the upper- and lower-
case ASCII character set. The video screen will accommodate 24 lines of infor-
mation with 80 characters per line with both foreground and background display
modes. Also available to the user is full cursor control using direct cursor
addressing plus individual cursor control keys.
For primary PCt, data recording, a magnetic tape unit is available. Raw
input data or the intermediate and/or final results of calculation can be recorded
on digital tape which is compatible to most user computer facilities. A Precision
Instrument, PI-1400, Digital Magnetic Tape System is used for recording this data
14

from the processor. The 1400 accommodates reel sizes up to 10-1/2 inches in
diameter with computer-standard hubs. The tape medium is 1/2 inch wide by
1. 5 mil thick mylar, standard computer tape. The data is placed on the tape in
nine tracks at a speed of 37-1/2 inches per second. Recording densities are
selectable from either 556 or 800 bits per inch using either even or odd parity.
The physical characteristics are common for data to be reel compatible with other
large-, medium-, or small-scale computer systems.
An audio coupler is also present within the system to allow remote input of
data over telephone lines. This capability will be used when data is captured,
assimilated and sent to the PDP-11/40 from a remote site.
7. SOFTWARE
The PDP-11/40 processor can process, display and record telemetry data as
received from the balloon. This is achieved by special real-time software which
resides in, and is executed by, the computer. Within the software are contained
the algorithms necessary to perform all required tasks, such as data conversion,
data recording, operator display, real-time logging to the hard copy devices, and
real-time computations.
In order to make the system as flexible as possible, the software has been
structured as a collection of closely related but independent modules required to
perform the desired tasks. Many functions such as Input/Output handlers have
been coded at the assembly level and integrated into the RT-11 operating system.
Other more "mission specific" functions are coded in FORTRAN to allow easy
modification as requirements dictate. This concept is depicted in Figure 6.
More flexibility is also realized by utilizing a priority structure whereby the
more time-critical functions are performed at the expense of the less critical
functions such as hardcopy logging. This keeps the slower I/O devices from slow-
ing down the rest of the system.
For program development and real-time executions, the RT-11 F/B Operating
System is used. The RT-11 is a high-performance Foreground/Backgrounoi Oper-
ating System with user-oriented software. The RT-11 Operating System actually
provides two monitors, the single-job monitor and the F/B monitor. The F/B
monitor allows two programs to operate, where the real-time program is accom-
plished in the foreground which has priority. For ease of use, the user-oriented
algorithms are implemented using FORTRAN IV language as defined in the
ANSIX3. 9 1966 Standards. Other languages such as BASIC could be used if the
need arises.
15

EXECUTIVE. SCHEDULE* CONTROL
INPUT PCM i
[ DATA J CONSTANT
RECEFLIGH
CONVERT CALIBRATION DATA
Figure 6. Real-Time Program
Real-time and support programs are the two types of' programs employed at
the facility. The support programs are those which are structured to do various
special purpose tasks such as system checkout, maintenance, calibration, etc.
The primary program will be the real-time program. Execution in real-time
implies that the dimens ion of time must be incorporated into the execution of the
instruction sets. For the telemetry system, this will be accomplished by subdivid-
ing each second into equal intervals. Within each interval the operational program
set of instructions will be executed. When completed, the processor will 'idle"
until the start of the next interval. This process is repeated for each interval. If
there are more tasks to be executed in any given cycle than there is time to'do it,
those functions (or tasks) with the lowest priority will be deferred until a later
cycle.
Real-time data processing is highly dependent upon the quantity of input data
and its input rate, and the amount of processing required. As described earlier,
the raw data is presented to the computer from the special purpose PCM Interface.
Recall that the data received at the computer is a composite of scientific informa-
tion as well as balloon status data, which is further merged with time-of-day and
ground-system status, graphically represented in Fig~ure 7. The specifics (,f the
16
DAT

data rates and contents shown in Figure 7 are from a recent scientific balloon
flight from HAFB.
To maximize the available computer computational time, the PCM Interface
is utilized as a raw-data edit device. For example, if a balloon-bone encoding
system is sending a new frame of data to the ground every 625 microseconds
(1600 frames per second), the computer could not keep up with the tasks of receiv-
ing, processing, displaying and recording. Through the use of the PCM Interface,
however, only one out of 10 frames would be passed to the computer in real time,
or a rate of 160 frames per second (Figure 8). Each of the 160 frames is equally
spaced in time.
These 160 frames per second are further edited by the real-time software so
that only 10 frames per second result, as shown in Figure 9. These 10 frames
per second are also equally spaced and are subjected to a special software routine
which will average the 10 data points to yield a single data point per second as
shown in Figure 10. This single point is then used throughout the rest of the real-
time data manipulations.
Of course, the entire 1600 frames per second data set is continuously recorded
on analog magnetic tape so that no data is lost. Post operations usually include
digitizing of all data during selected periods of interest using the PDP-11/40 com-
puter, with differ !nt programs being executed. In this phase, all 1600 frames per
second of data are formatted and placed on nine-track tape in a form which is
compatible to the users large-scale data processing center. (Throughout the above
BAIWON APPARAIUSSTATUS AND STATUS ANDIfNATl ION WOATIM
512 TSJFRAW RATlE am= " - J
LU__ p I
aU OFW " FTM E S TIM MIA~U~RjM
Figure 7. Example of PCM Data Figure 8. PCM Interface, Raw DataSet Format Edit
17

Figure 9. Real-Time Program, Figure 10. Real-Time Program,Raw Data Edit Raw Data Average
__________________________________________ ESTABLISH pRAWINDSONOE DATA P VS ALT
POP-11/40 COMPUTER
FigSURE VOLAG PresureAlttud
18

example, the use of 1600 frames per second is only one of several which have
actually been used; the system can be set up to handle other data rates and for-
mats. )
The continuous calculation and presentation of balloon altitude is an example
of a typical real-time computation used both by the scientist as well as the opera-
tional personnel. The altitude computation involves several stages, as shown in
Figure 11. Prior to a balloon flight, the normal procedures include the acquisition
of Rawinsonde data which define the relationship of pressure versus altitude for
that particular time. Further, calibrations of the balloon-borne pressure trans-
ducer are also entered into the computer to establish the relationship between the
transducer voltage and actual pressure.
During the balloon flight (in real time), the single-averaged transducer volt-
age data point is received and converted to pressure using the pre-flight data base.
With a pressure value, the altitude can then be quickly calculated from the
Rawinsonde data base. These two parameters are then dynamically displayed.
Further calculations can be made using the altitude information to yield ascent
and descent rates.
8. TIMING
For all experiments or missions, it is important that the element of time be
involved in order to assure later reconstruction of the operation or for data reduc-
tion and correlation. A station WWV receiver is used to synchronize the time de-
coders within the system to a standard source.
The output of the WWV Receiver is routed to a Datametrics SP-100 Time Code
Generator. This unit generates timing in IRIG formats for recording on the analog
recorder and use on the strip-chart recorders.
A second time code reader, a PSI. Model 10938 Time (ode Reader/Generator,
is also incorporated into the system. The time code reader will accept the output
of the Datametrics generator, or the recorded time on the analog tape, in order to
generate parallel time for the PCM interface. In the event time is not available,
the generator portion of the unit can provide this output. Additionally, time can be
routed to the analog devices if required. The Model 10938 is capable of decoding
or generating any of 13 different line-level, carrier-modulated standard IRIG!
NASA time codes.
19

9. DATA DISPLAY SUBSYSTEM
In any real-time operation it is very important to the flight control personnel
as well as the scientific user to be able to monitor received data visually in real
time. Based upon the information received, the cognizant personnel can make
judgmental decisions for continued experiment operations. A functional block
diagram of the recording and display subsystem is shown in Figure 12.
Information can be displayed in both digital and analog form. For the displaywhere trends as a function of time are desirable, analog strip-chart records canbe used. Five Brush recorders, models 260 and 481 (6 channel and 8 channel)
provide 36 channels of analog data displays. Each recorder can be continuously
annotated with time-of-day (TOD) information for interval correlation of multiple
data comparison. The recorders can be run at various speeds to optimize the
details of the displayed parameters.
Where information regarding the instantaneous relationship of a parameter
with maximum or minimum values is desired, the analog meter bank can be used.
This display device contains 20 analog voltage meters, each accessible from the
display and record patchboard.
RECORDING AND DISPLAY PATCHBOARD
ANALOG M E -1RECORDER C 6C C SC
ANALOG METER DISPLAY PANEL ANALOG STRIP CHART RECORDERS
MA43TAPE HARD COPYI TRE
POP-11/40 :Z :3 NUMERICPOES-R - ] DISPLAY
CR1DISK
Figure 12. Record and Display Subsystem
20

Standard information from the PCM data received from the balloon is proc-
essed by the computer and is displayed in such forms as altitudes, pressures and
temperatures. This is accomplished through various algorithms defined by rela-
tionships between sampled pressures by instruments on the balloon and preflight
radiosonde data. Such processing can yield data which can be displayed for use by
the scientific user. By implementing these scientific user pre-defined algorithms
and relationships in a digital program prior to the mission, valuable information
can be displayed to assist the scientist. These information outputs can be assigned
to various digital display devices dependent upon the type of data.
The capabilities of the hardcopy devices (LA30 and LA36) are explained in
earlier sections. Each data set or event to be hardcopied can be time tagged for
correlation with other data. Typically, this would be information significant to
the operational or experimental decision-making processes so that the resulting
time history can be reviewed during post-operation analysis.
Instantaneous values of various parameters can be displayed on the CRT's.
This data is generally updated at input frame rates. Warning messages can be
displayed to alert the user of parameters which are exceeding pre-defined bounds.
Other displays such as the numeric displays are also used in the system to facil-
itate the conduct of the operations.
10. DATA RECORDING
The end result ,f most experiments is the data which is collected during the
mission. This data is generally used for further in-depth analysis at the experi-
menter's laboratory. It is therefore important that the user be able to get data
in a medium compatible to whatever reduction facility may be used. Digital and
analog recording are the two primary forms of data recording used.
The digital recordings are made via the PDP-11/40 processor subsystem.
Whatever is recorded on the nine-track output tape (described in the PDP-11/40
Processor Subsystem section) is completely selectable by the data requestor. Allraw data, or only selected data, may be recorded, always with time information.
If specific formats are required they can be provided. The digital data tapes ofthe PCM data are usually made after the mission, so that the experimenter can
select segments of interest instead of reviewing several hours of non-usable data.
Whenever information is being received from a balloon-borne experiment, it
is recorded by a Sangamo SABRE IV analog recorder. This is a 1/2 inch, seven-channel device capable of recording PCM high data-rate signals as well as FM
data. Playback features allow the replaying of this data for subsequent digitizing
or special display.
21

11. MOBILE GROUND SUPPORT
A mobile van for field deployment has functioned with a capability similar to
the base facility described above. The mobile van contains a PCM and FM/FM
telemetry system with somewhat limited computational capabilities. The computer
is a PDP-11/10 which is somewhat slower and has less memory available than its
counterpart in the base facilities. However, the mobile system can provide ade-
quate support for almost all applications. That software is transportable between
the PDP-11/40 and the PDP-11/10 provides for further advantages. A picture of
the mobile van is shown in Figure 13.
Figure 13. Mobile Telemetry Facility
22