january 2012 statistics release
TRANSCRIPT
8/3/2019 January 2012 Statistics Release
http://slidepdf.com/reader/full/january-2012-statistics-release 1/11
News ReleaseThe Canadian Real Estate Association
Canadian home sales pull back in January
OTTAWA – February 15, 2012 – According to statistics 1 released today by The Canadian Real Estate Association (CREA),national resale housing activity retreated in January 2012 from the strong nish reported for December 2011.
Highlights:• Home sales were down 4.5% from December to January.• Actual (not seasonally adjusted) activity came in 4.0% above levels in January 2011, and stood even with the 5 and 10
year averages for January sales.• The number of newly listed homes edged down 1.4% from December to January.• With sales down by more than new listings, the national market shifted further into balanced territory.• The national average home price was up less than 2% year-over-year in January, ranking it among the smallest
increases of the past year.
Sales activity recorded through the MLS ® Systems of real estate Boards and Associations in Canada fell 4.5 per cent from December
2011 to January 2012. This marks the rst monthly decline in national activity since August 2011 and the biggest monthly declinesince July 2010. The monthly decline reversed a string of monthly increases over the closing months of last year, and returnednational activity to where it stood at the end of the third quarter of 2011.
“The national housing market is stabilizing and remains well balanced,” said Gary Morse, CREA’s President. “That said, forecastsfor economic and job growth going forward vary widely for different parts of the country, suggesting a possible continuation of asoftening trend in some markets, as well as the potential that demand will pick up based on strong fundamentals in others. All realestate is local, so talk to your local REALTOR ® to understand how price trends in your neighbourhood are shaping up.”
Activity was down in over half of all local markets in January from the previous month. Led by declines in Greater Toronto andMontréal, demand also softened in a number of other major urban centres including the Fraser Valley, Calgary, Edmonton, Winnipeg,Ottawa, and Greater Vancouver.
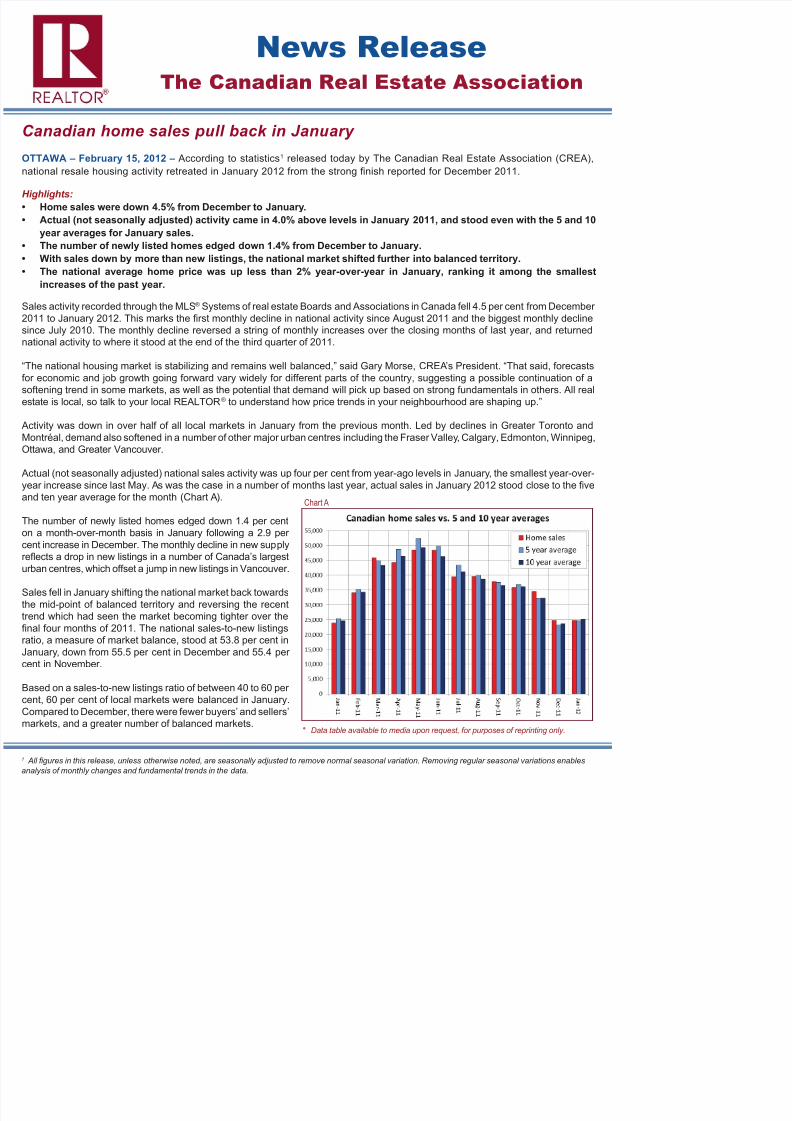
Actual (not seasonally adjusted) national sales activity was up four per cent from year-ago levels in January, the smallest year-over-year increase since last May. As was the case in a number of months last year, actual sales in January 2012 stood close to the veand ten year average for the month (Chart A).
The number of newly listed homes edged down 1.4 per cent
on a month-over-month basis in January following a 2.9 per cent increase in December. The monthly decline in new supplyre ects a drop in new listings in a number of Canada’s largesturban centres, which offset a jump in new listings in Vancouver.
Sales fell in January shifting the national market back towardsthe mid-point of balanced territory and reversing the recent
Chart A

8/3/2019 January 2012 Statistics Release
http://slidepdf.com/reader/full/january-2012-statistics-release 2/11
News ReleaseThe Canadian Real Estate Association
The number of months of inventory stood at six months at the end of January on a national basis, up from 5.7 months in December 2011 and returning it to where it stood in October 2011. The number of months of inventory represents the number of months it wouldtake to sell current inventories at the current rate of sales activity, and is another measure of the balance between housing supplyand demand.
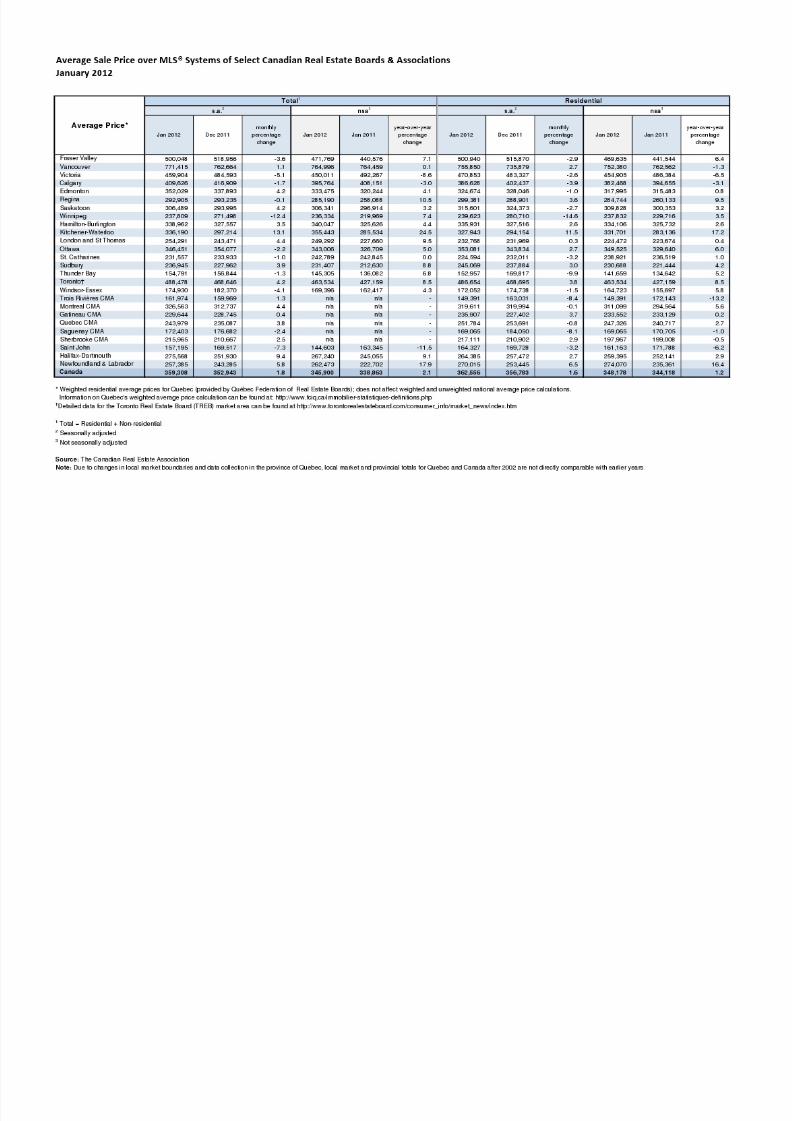
The actual (not seasonally adjusted) national average price for homes sold in January 2012 was $348,178, representing an increaseof 1.2 per cent from its year-ago level. This ranks among the smallest increases since late 2010.
On a seasonally adjusted basis, the national average home price rose 1.6 per cent on a month-over-month basis, marking a reboundfrom a decline of similar magnitude in December. This pattern mirrors the one playing out in the newly-launched MLS ® Home PriceIndex (HPI), published on February 6.
“Year-over-year comparisons in the national average price are expected to become volatile and may turn negative, re ecting averageprice developments in the rst half of 2011 in Vancouver,” said Gregory Klump, CREA’s Chief Economist. “At that time, high-endhome sales in Vancouver’s priciest neighbourhoods surged to all-time record levels, which skewed the national average priceupward considerably. A replay of this phenomenon is not expected this year. As a result, comparisons for national average price to
year-ago levels over the coming months will re ect an upwardly skewed base effect. For this reason, year-over-year comparisonsshould be kept in perspective. Developments in the MLS ® HPI will provide important guidance on price trends, since it is not affectedby the problem of compositional shifts in the mix of sales activity.”
The MLS ® HPI also takes into account the contributions toward the price of a home made by a broad range of quantitative andqualitative housing features, allowing it to track Canadian home price trends better than any other measure.
PLEASE NOTE: The information contained in this news release combines both major market and national MLS ® salesinformation from the previous month.
CREA cautions that average price information can be useful in establishing trends over time, but does not indicate actualprices in centres comprised of widely divergent neighbourhoods or account for price differential between geographic areas.Statistical information contained in this report includes all housing types.
MLS® is a co-operative marketing system used only by Canada’s real estate Boards to ensure maximum exposure of properties listedfor sale.
The Canadian Real Estate Association (CREA) is one of Canada’s largest single-industry trade associations, representing more than
100,000 REALTORS®
working through more than 100 real estate Boards and Associations.
Further information can be found at http://www.crea.ca/public/news_stats/media.htm .
- 30 -

8/3/2019 January 2012 Statistics Release
http://slidepdf.com/reader/full/january-2012-statistics-release 3/11
News ReleaseThe Canadian Real Estate Association
Chart 1 Chart 2
Chart 3 Chart 4
Chart 5 Chart 6

8/3/2019 January 2012 Statistics Release
http://slidepdf.com/reader/full/january-2012-statistics-release 4/11
8/3/2019 January 2012 Statistics Release
http://slidepdf.com/reader/full/january-2012-statistics-release 5/11
January 2012
Jan 2012 Dec 2011monthly
percentagechange
Jan 2012 Jan 2011year-over-year
percentagechange
Jan 2012 Dec 2011monthly
percentagechange
Jan 2012 Jan 2011year-over-year
percentagechange
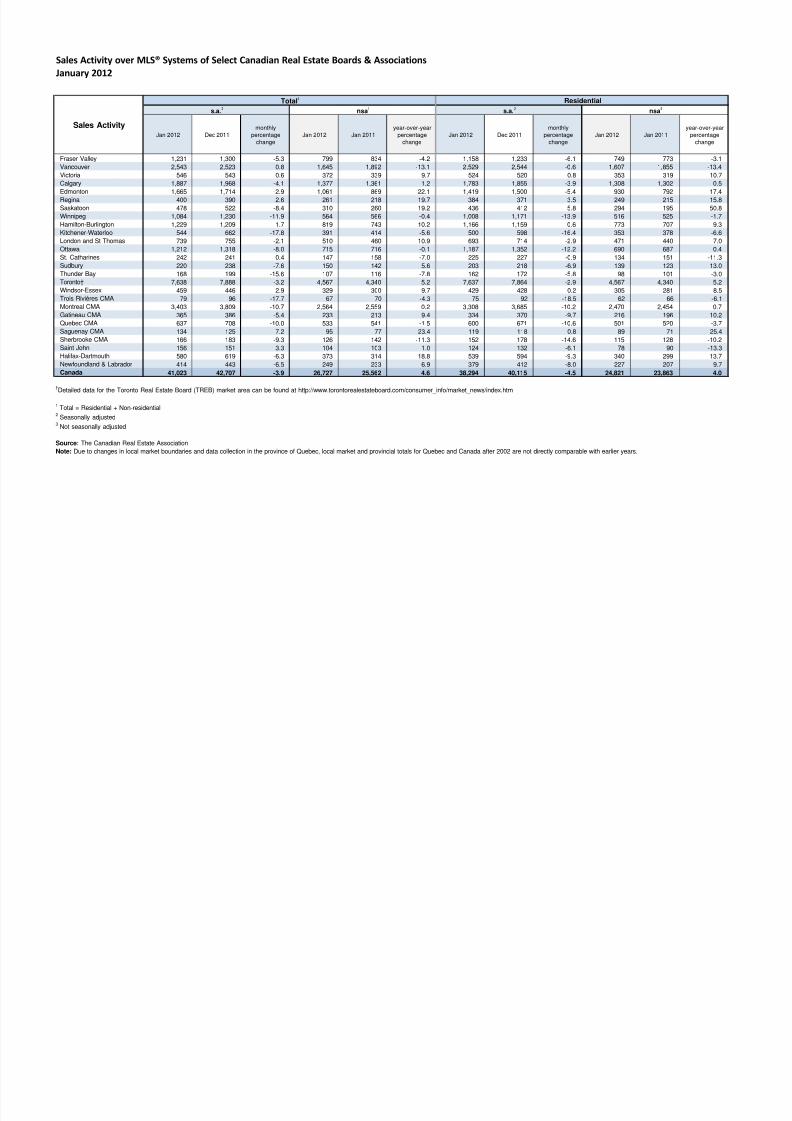
Fraser Valley 1,231 1,300 -5.3 799 834 -4.2 1,158 1,233 -6.1 749 773 -3.1Vancouver 2,543 2,523 0.8 1,645 1,892 -13.1 2,529 2,544 -0.6 1,607 1,855 -13.4Victoria 546 543 0.6 372 339 9.7 524 520 0.8 353 319 10.7Calgary 1,887 1,968 -4.1 1,377 1,361 1.2 1,783 1,855 -3.9 1,308 1,302 0.5Edmonton 1,665 1,714 -2.9 1,061 869 22.1 1,419 1,500 -5.4 930 792 17.4Regina 400 390 2.6 261 218 19.7 384 371 3.5 249 215 15.8Saskatoon 478 522 -8.4 310 260 19.2 436 412 5.8 294 195 50.8Winnipeg 1,084 1,230 -11.9 564 566 -0.4 1,008 1,171 -13.9 516 525 -1.7Hamilton-Burlington 1,229 1,209 1.7 819 743 10.2 1,166 1,159 0.6 773 707 9.3Kitchener-Waterloo 544 662 -17.8 391 414 -5.6 500 598 -16.4 353 378 -6.6London and St Thomas 739 755 -2.1 510 460 10.9 693 714 -2.9 471 440 7.0Ottawa 1,212 1,318 -8.0 715 716 -0.1 1,187 1,352 -12.2 690 687 0.4St. Catharines 242 241 0.4 147 158 -7.0 225 227 -0.9 134 151 -11.3Sudbury 220 238 -7.6 150 142 5.6 203 218 -6.9 139 123 13.0Thunder Bay 168 199 -15.6 107 116 -7.8 162 172 -5.8 98 101 -3.0Toronto† 7,638 7,888 -3.2 4,567 4,340 5.2 7,637 7,864 -2.9 4,567 4,340 5.2Windsor-Essex 459 446 2.9 329 300 9.7 429 428 0.2 305 281 8.5Trois Rivières CMA 79 96 -17.7 67 70 -4.3 75 92 -18.5 62 66 -6.1Montreal CMA 3,403 3,809 -10.7 2,564 2,559 0.2 3,308 3,685 -10.2 2,470 2,454 0.7Gatineau CMA 365 386 -5.4 233 213 9.4 334 370 -9.7 216 196 10.2Quebec CMA 637 708 -10.0 533 541 -1.5 600 671 -10.6 501 520 -3.7Saguenay CMA 134 125 7.2 95 77 23.4 119 118 0.8 89 71 25.4Sherbrooke CMA 166 183 -9.3 126 142 -11.3 152 178 -14.6 115 128 -10.2Saint John 156 151 3.3 104 103 1.0 124 132 -6.1 78 90 -13.3Halifax-Dartmouth 580 619 -6.3 373 314 18.8 539 594 -9.3 340 299 13.7Newfoundland & Labrador 414 443 -6.5 249 233 6.9 379 412 -8.0 227 207 9.7Canada 41,023 42,707 -3.9 26,727 25,562 4.6 38,294 40,115 -4.5 24,821 23,863 4.0
†Detailed data for the Toronto Real Estate Board (TREB) market area can be found at http://www.torontorealestateboard.com/consumer_info/market_news/index.htm
1 Total = Residential + Non-residential2 Seasonally adjusted3
Not seasonally adjusted
Source: The Canadian Real Estate AssociationNote: Due to changes in local market boundaries and data collection in the province of Quebec, local market and provincial totals for Quebec and Canada after 2002 are not directly comparable with earlier years.
Sales Activity over MLS® Systems of Select Canadian Real Estate Boards & Associations
Sales Activity
Total 1 Residentials.a. 2 nsa 3 s.a. 2 nsa 3

8/3/2019 January 2012 Statistics Release
http://slidepdf.com/reader/full/january-2012-statistics-release 6/11
8/3/2019 January 2012 Statistics Release
http://slidepdf.com/reader/full/january-2012-statistics-release 7/11

8/3/2019 January 2012 Statistics Release
http://slidepdf.com/reader/full/january-2012-statistics-release 8/11
8/3/2019 January 2012 Statistics Release
http://slidepdf.com/reader/full/january-2012-statistics-release 9/11

8/3/2019 January 2012 Statistics Release
http://slidepdf.com/reader/full/january-2012-statistics-release 10/11

8/3/2019 January 2012 Statistics Release
http://slidepdf.com/reader/full/january-2012-statistics-release 11/11