january 2018 – march 2018 – measuring progress report · indicators (kpi) detailed in the ......
TRANSCRIPT

LANCASHIRE COMBINED FIRE AUTHORITY PERFORMANCE COMMITTEE Meeting to be held on 7th June 2018 PERFORMANCE MANAGEMENT INFORMATION FOR 4TH QUARTER 2017/18 (Appendices 1 and 2 refer) Contact for further information: David Russel, Assistant Chief Fire Officer – Tel No. 01772 866801
Executive Summary This paper provides a clear measure of our progress against the Key Performance Indicators (KPI) detailed in the Integrated Risk Management Plan 2017-2022 Recommendation The Performance Committee is asked to endorse the Quarter 4 Measuring Progress report and note the contents of the 3 negative KPI Exception Reports.
Information As set out in the report. Business Risk High Environmental Impact High Equality & Diversity Implications High – the report apprises the Committee of the Authority's progress. HR Implications Medium Financial Implications Medium

Local Government (Access to Information) Act 1985 List of Background Papers Paper Performance Management Information
Date
Contact David Russel (ACO)
Reason for inclusion in Part 2, if appropriate: N/A

Measuring Progress 2017-18 Quarter 4 Combined Fire Authority 7th June 2018
Lancashire Fire and Rescue Service

making Lancashire safer 2
This page is intentionally left blank

making Lancashire safer 3
Lancashire Fire and Rescue Service Measuring Progress Jan 18 - Mar 18 The following pages set out Lancashire Fire and Rescue Service’s Performance Framework, an explanation of how our Key Performance Indicator’s (KPI) are measured and how we are performing.
This is followed, where appropriate, by an analysis of the KPI’s which are classified as being in exception, along with an analysis of the cause and actions being taken to improve performance. The remainder of the document illustrates our performance across all other KPI’s.
Table of Contents Page (s)
Introduction 3
Performance Framework 5
Explanation of Performance Measures 5 - 6
KPI Exception Overview 7
KPI Exception Report Analysis 9 - 16
Key Performance Indicators 17 - 36
Introduction

making Lancashire safer 4
This page is intentionally left blank
making Lancashire safer 5
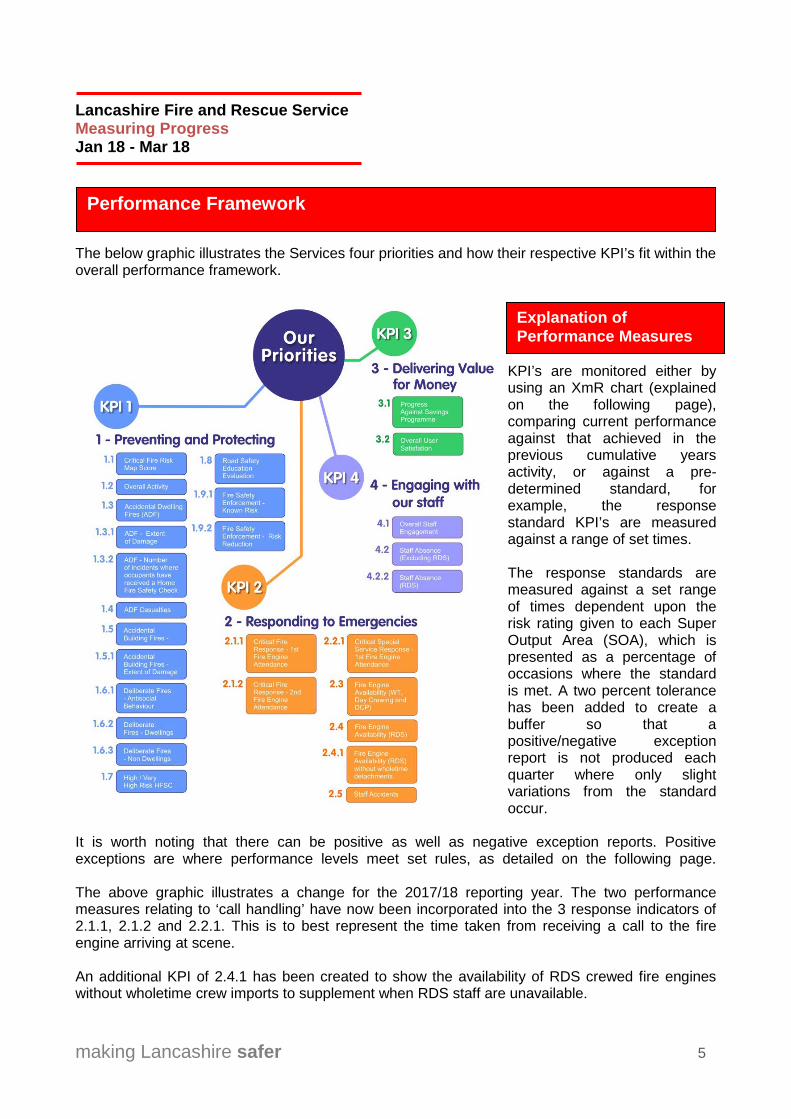
Lancashire Fire and Rescue Service Measuring Progress Jan 18 - Mar 18 The below graphic illustrates the Services four priorities and how their respective KPI’s fit within the overall performance framework.
KPI’s are monitored either by using an XmR chart (explained on the following page), comparing current performance against that achieved in the previous cumulative years activity, or against a pre-determined standard, for example, the response standard KPI’s are measured against a range of set times. The response standards are measured against a set range of times dependent upon the risk rating given to each Super Output Area (SOA), which is presented as a percentage of occasions where the standard is met. A two percent tolerance has been added to create a buffer so that a positive/negative exception report is not produced each quarter where only slight variations from the standard occur.
It is worth noting that there can be positive as well as negative exception reports. Positive exceptions are where performance levels meet set rules, as detailed on the following page. The above graphic illustrates a change for the 2017/18 reporting year. The two performance measures relating to ‘call handling’ have now been incorporated into the 3 response indicators of 2.1.1, 2.1.2 and 2.2.1. This is to best represent the time taken from receiving a call to the fire engine arriving at scene. An additional KPI of 2.4.1 has been created to show the availability of RDS crewed fire engines without wholetime crew imports to supplement when RDS staff are unavailable.
Performance Framework
Explanation of Performance Measures

making Lancashire safer 6
Lancashire Fire and Rescue Service Measuring Progress Jan 18 - Mar 18 XmR chart explanation (Value [X] over a moving [m] range [R])
An XmR chart is a control chart used to highlight any significant changes in activity so that interventions can be made before an issue arises. It can also highlight where activity has decreased, potentially as a result of preventative action which could be replicated elsewhere.
Activity is deemed to be within standard if it remains within set upper and lower limits. These limits are set using a standard deviation calculation based upon the previous three years activity. An exception report is generated if the XmR rules are breached. Note that a ‘positive’ exception could also be generated. The following rules are applicable to the XmR charts and define when an exception has occurred:
1. A single point beyond the control limit 2. Two out of three consecutive points near the control limits 3. A trend of six consecutive points either up or down 4. A shift of eight or more consecutive points above or below the mean line
XMR chart key definitions:
Example XmR chart: In the example below, KPI 1.3 would produce a negative exception for meeting rule 1, as the activity, represented as a dark blue line, for December 2014 ( ) is above the Upper Control Limit (UCL).
Explanation of Performance Measures
50
60
70
80
90
100
110
120
Apr-
12
Jun-
12
Aug-
12
Oct
-12
Dec-
12
Feb-
13
Apr-
13
Jun-
13
Aug-
13
Oct
-13
Dec-
13
Feb-
14
Apr-
14
Jun-
14
Aug-
14
Oct
-14
Dec-
14
Feb-
15
UCL – Upper Control Limit
UWL – Upper Warning Limit
Previous three year Mean
Current Mean
LWL – Lower Warning Limit
LCL – Lower Control Limit

making Lancashire safer 7
Lancashire Fire and Rescue Service Measuring Progress Jan 18 - Mar 18 The KPI Exception Overview highlights those KPI’s that are classified as being in exception. Each KPI is shown with an indicator to illustrate whether performance is: Improving (), indicating a
positive exception or, Declining (), which would produce a negative exception. This is followed by any relevant exception reports, which detail the reasons for the exception, analysis of the issue, and actions being taken to improve performance. For the period January 2018 – March 2018 three KPI’s are classified as being in negative exception.
KPI Description Progress Exception Positive / Negative Page (s)
2 - Responding to Emergencies
2.2.1 Critical Special Service – 1st Fire Engine Attendance – 9
2.4 Fire Engine Availability - Retained Duty System – 11
2.4.1 Fire Engine Availability - Retained Duty System (without wholetime detachments)
Subset of KPI 2.4 and provided for information
only 13
4 - Engaging with our Staff
4.2.1 Staff Absence - Excluding Retained Duty System – 14
KPI Exception Overview

making Lancashire safer 8
This page is intentionally left blank

Lancashire Fire and Rescue Service Measuring Progress Jan 18 - Mar 18
making Lancashire safer 9
Critical special service incidents are non-fire incidents where there is a risk to life, for example, road traffic collisions, rescues and hazardous materials incidents. For these incidents there is a single response standard which measures call handling time and fire engine response time. The response standard for the first fire engine attending a critical special service call is 13 minutes. Standard: 90% of occasions. Quarter four response percentage pass rate 82.95%, previous year quarter four 85.29%
1st pump cumulative attendance standard
Year to Date
2017/18 Quarter 4
Previous year to Date
2016/17 Quarter 4
83.75% 82.95% 86.68% 85.29%
What are the reasons for an Exception Report This is a negative exception report due to critical Special Service 1st pump response being below the standard. Overall, quarter four pass rate was 82.95%, with a cumulative pass rate of 83.75%, which is outside of the 90% standard and 2 percent tolerance.
80818283848586878889909192939495
1st Pump Cumulative Attendance
2% toleranceStandard% Pass
2.2.1 Lancashire Emergency Response Standard - Critical Special Service - 1st Fire Engine Attendance

Lancashire Fire and Rescue Service Measuring Progress Jan 18 - Mar 18
making Lancashire safer 10
Analysis Each month of quarter 4 recorded a pass rate below the standard, with the month of January recording the lowest pass rate of the quarter at 77.24%. Whilst February and March returned above yearly average response times the high failure rate during the colder temperatures in the New Year contributed to January recording one of the highest RTC counts in the year which, along with extended travel times, led to January recording the second lowest pass rate over the last 12 months. The Officer in Charge (OIC) is now required to provide a specific narrative from a set list for the failure to respond to an incident within standard. Analysis of quarter 4 narratives implies that the travel distance involved, along with heavy traffic en-route, are the main reasons for missed attendance times. Failure to book in attendance at an incident is also cited for a small number failures. Shown below are the actual failures and monthly totals over the previous 12 months, along with the percentage pass rate.
2017/18 Apr May Jun Jul Aug Sep Oct Nov Dec Jan Feb Mar
Failed 8 12 15 14 20 15 18 76 14 28 16 23 Incidents 101 115 114 141 122 122 127 225 134 123 108 162 % Pass 92.1% 89.6% 86.8% 90.1% 83.6% 87.7% 85.8% 66.2% 89.6% 77.2% 85.2% 85.8%
Over the quarter four period, 15% of the failures failed by less than 60 seconds. Call handling is a contributing factor as this is now included within the overall response time. The individual monthly [median] call handling times are shown below in seconds.
2017/18 Median
Seconds Apr May Jun Jul Aug Sep Oct Nov Dec Jan Feb Mar 127 127 127 131 131 131 138 138 138 134 134 134
Actions being taken to improve performance? Head’s of Service Delivery (HoSD) are implementing and monitoring performance measures to remedy deficiencies and drive improvement. Service Delivery Managers (SDM) are also monitoring WT crew reaction times and instigating local improvements where required. The importance of recording pump response failures has also been impressed upon SDM’s which, in conjunction with mandatory completion and the use of defined failure reasons, will aid recording accuracy and develop understanding of failure reasons. It is hoped that on-going initiatives to address these issues will bring the cumulative standard back to within the 2% tolerance.

Lancashire Fire and Rescue Service Measuring Progress Jan 18 - Mar 18
making Lancashire safer 11
Performance indicator: 2.4 Fire Engine Availability – Retained Duty System This indicator measures the availability of fire engines that are crewed by the retained duty system (RDS). It is measured by calculating the percentage of time a fire engine is available to respond compared to the total time in the period.
Fire engines are designated as unavailable (off-the-run) for the following reasons:
• Manager deficient • Crew deficient • Not enough BA wearers • No driver
The percentage of time that RDS crewed engines are available for quarter four was 89.96%, previous year quarter four 89.87%, an improvement of 0.09%. The previous quarter (October to December 2017) recorded 90.74%.
Standard: Above 95%. A negative exception report has been produced due to percentage availability being below the standard.
858687888990919293949596979899
100
Availability - RDS
2% toleranceStandard% Available
Exception report: 2.4 Fire Engine Availability - Retained Duty System

Lancashire Fire and Rescue Service Measuring Progress Jan 18 - Mar 18
making Lancashire safer 12
What are the reasons for an Exception Report This is a negative exception report due to the cumulative RDS availability to the end of quarter four being below the standard and outside of the two per cent tolerance. Analysis Quarter 4 availability decreased slightly over that reported for quarter 3, by 0.78%. Local level monitoring continues with additional analysis at pump level, along with a new KPI (2.4.1) which measures RDS availability without wholetime staff imports. Continuing the analysis reported in quarter 3; the number of RDS personnel who were successful in obtaining a wholetime position has had an impact on available RDS hours. This is due to leaving the RDS service, being able to commit fewer hours due to W/T commitment or being unavailable due to development (W/T recruit course). With an ageing workforce, the loss of staff due to retirement also has an impact on the ability to fully crew an appliance, and a number of retirements, along with a number of resignations, albeit, some temporarily which has also reduced coverage. Continuing work by the Retained Duty System Recruitment and Improvement Group (RIG) will be responsible for progressing areas for improvement. This isn’t being viewed as a project with start and finish dates but as a number of ongoing pieces of work which will strive to deliver incremental improvements in order to strengthen and support the Retained Duty System. Actions being taken to improve performance The new recruits, which started in May of 2017, will begin to show an improvement in RDS crew availability when the respective qualifications of BA and BA Team Leader have been completed, and they have gained experience to start acting up to cover the OIC role. There is a minimum of 6 months before a Firefighter is BA qualified, and a further 6 month period of BA experience before acquiring further BA Team Leader skills. As such, results in availability may only start to be realised during the 2018/19 year. Similarly, some stations which have suffered from a lack of an available driver will start to show improvements when staff members continue to build driving hours in preparation for their Emergency Fire Appliance Driving course (EFAD). There are stations where staff on dual contracts makeup half of the RDS crew, with the inevitable impact on RDS availability. The Retained Support Officer (RSO) role will assist in some of these areas, particularly around recruitment and firefighter/officer development, and in conjunction with the various Strengthening and Improving work streams, the service should see a positive effect on availability over time. The forthcoming Wholetime (WT) recruitment campaign is also being used as an opportunity to promote RDS vacancies. RSO’s are supporting the ‘Have a Go’ days and will collate information from potential applicants.

Lancashire Fire and Rescue Service Measuring Progress Jan 18 - Mar 18
making Lancashire safer 13
Performance indicator: 2.4.1 Fire Engine Availability – Retained Duty System (without wholetime detachments). Subset of KPI 2.4 and provided for information only. This indicator measures the availability of fire engines that are crewed by the retained duty system (RDS) when wholetime detachments are not used to support availability. It is measured by calculating the percentage of time a fire engine is available to respond compared to the total time in the period.
Fire engines are designated as unavailable (off-the-run) for the following reasons:
• Manager deficient • Crew deficient • Not enough BA wearers • No driver
The percentage of time that RDS crewed engines are available for quarter four was 86.07%. This excludes the wholetime detachments shown in KPI 2.4 Standard: As a subset of KPI 2.4 there is no standard attributable to this KPI.
2.4.1 Fire Engine Availability - Retained Duty System (without wholetime detachments).

Lancashire Fire and Rescue Service Measuring Progress Jan 18 - Mar 18
making Lancashire safer 14
4.2.1 Staff Absence - Excluding Retained Duty System The cumulative number of shifts (days) lost due to sickness for all wholetime, DCP, DC and support staff divided by the total number of staff. Annual Standard: Not more than 5 shifts lost. (Represented on the chart as annual shifts lost ÷ 12 months)
Cumulative total number of monthly shifts lost 6.154 What are the reasons for an Exception Report This is a negative exception report due to the number of shifts lost through absence per employee being above the Service target for three months during quarter four. Analysis During quarter four January 2018 - March 2018, absence statistics shows we have been above target for all three months. Shifts lost showed a monthly increase from January through to March in both non-uniformed and uniformed personnel. The main reasons continue to be cases of mental health, musculo-skeletal and cold/flu. Another contributing factor for being over the target is due to having fourteen long term absences which still remain open at this time.
0
0.1
0.2
0.3
0.4
0.5
0.6
0.7
0.8
Apr May June July Aug Sep Oct Nov Dec Jan Feb Mar
Mon
thly
shift
s los
t
Staff Absence - Excluding RDS
Shifts LostStandard
Exception report: 4.2.1 Staff Absence - Excluding Retained Duty System

Lancashire Fire and Rescue Service Measuring Progress Jan 18 - Mar 18
making Lancashire safer 15
At the end of March the cumulative totals show that non-uniformed staff absence was above target at 7.23 shifts lost per employee, for whole-time staff absence was 5.80 shifts lost per employee. Overall absence for all staff (except Retained Duty System) was 6.15 shifts lost which is above the Service target for yearend of 5.0 lost shifts. Actions being taken to improve performance To reduce this, the Service aims to continue with:
• Early intervention by OHU doctor/nurse/physiotherapist,
• HR supporting managers in following the Absence Management Policy managing individual long term cases, addressing review periods/triggers in a timely manner and dealing with capability off staff due to health issues.
• Absence management presentations/training and question and answer sessions on the ILM course and for newly appointed managers.
• To be included again within the leadership conference to assist future managers understanding and interpretation of the policy.
• Encouraging employees to make use of our Employee Assistance Programme provider Health Assured and The Firefighters Charity.
• HR to be in attendance at Stress Risk assessment meetings, to support managers and to offer appropriate support to the employee along with signposting.
• OHU to organise health checks for individuals on a voluntary basis.
New Actions:
• Support from Service Fitness Advisor/PTI’s
• Promotion of health, fitness and wellbeing via the routine bulletin and Employee Assistance programme.

making Lancashire safer 16
This page is intentionally left blank

Lancashire Fire and Rescue Service Measuring Progress Jan 18 - Mar 18
making Lancashire safer 17
This section gives an overview of the performance direction of the KPI’s which are not in exception.Each KPI is shown within its priority with an indicator to illustrate whether performance
is: Improving (), Maintaining () or Declining (), followed by a summary of the current position.
KPI Description Progress Page (s)
1 - Preventing and Protecting
1.1 Risk Map Score 18
1.2 Overall Activity 19
1.3 Accidental Dwelling Fires 20
1.3.1 ADF - Extent of Damage 21
1.3.2 ADF - Number of Incidents Where Occupants have Received a HFSC 21
1.4 Accidental Dwelling Fire Casualties
22
1.5 Accidental Building Fires (Non Dwellings) 23
1.5.1 ABF (Non Dwellings) - Extent of Damage 24
1.6 Deliberate Fires 25
1.7 Home Fire Safety Checks 26
1.8 Road Safety Education Evaluation 27
1.9.1 Fire Safety Enforcement - Known Risk 28
1.9.2 Fire Safety Enforcement - Risk Reduction 28
2 - Responding to Emergencies
2.1.1 Critical Fire Response - 1st Fire Engine Attendance 29
2.1.2 Critical Fire Response - 2nd Fire Engine Attendance 30
2.3 Fire Engine Availability - Wholetime, Day Crewing & Day Crewing Plus 31
2.5 Staff Accidents 32
3 - Delivering Value for Money 3.1 Progress Against Savings Programme 33
3.2 Overall User Satisfaction 34
4 - Engaging with our Staff 4.1 Overall Staff Engagement n/a 35
4.2.2 Staff Absence - Retained Duty System 36
Key Performance Indicators

Lancashire Fire and Rescue Service Measuring Progress Jan 18 - Mar 18
making Lancashire safer 18
This indicator measures the fire risk in each SOA. Risk is determined using fire activity over the previous three fiscal years along with a range of demographic data, such as population and deprivation. Specifically, the risk score for each SOA is calculated using the following formula:
Once an SOA has been assigned a score, it is then categorised by risk grade.
Standard: To reduce the risk in Lancashire - an annual reduction in the County risk map score. The County risk map score is updated annually, before the end of the first quarter. An improvement is shown by a year on year decreasing ‘score’ value. Current score 32398, previous year score 32990.
Score Category Grade
Score
(12-15)
SOA Count
(12-15)
Score
(13-16)
SOA Count
(13-16)
Score
(14-17)
SOA Count
(14-17) Less than 36 L 12366 533 11944 519 11980 521
Between 36 & 55 M 12130 281 13578 314 13722 321
Between 56 & 75 H 5440 86 4890 76 4654 74
Greater than 75 VH 3332 41 2578 32 2042 25
Grand Total 33268 941 32990 941 32398 941
Risk Grade Very High High Medium Low Overall Risk Score
2016 count 32 76 314 519 32990 2017 count 25 74 321 521 32398
Change -22%
Overall reduction in Very High risk
SOA’s
-3% Overall reduction in High risk SOA’s
2% Overall increase in Medium risk
SOA’s
0% Overall reduction in Low risk SOA’s
-2% Overall reduction in
fire risk
1.1 Risk Map
Dwelling fires Total dwellings
Dwelling fire casualties Resident population
Building fire count IMD = Risk Score + + x 4 x 2 +

Lancashire Fire and Rescue Service Measuring Progress Jan 18 - Mar 18
making Lancashire safer 19
The number of incidents that LFRS attend with one or more pumping appliances. Includes fires, special service calls and false alarms. Quarter four activity 3501, previous year quarter four activity 3283, a decrease of 8.91%.
Included within this KPI is a new incident type of ‘Gaining Entry’. This is where we have attended on behalf of the North West Ambulance Service. During quarter four we attended on 199 occasions.
1.2 Number of attended incidents
Year to Date
2017/18 Quarter 4
Previous year to Date
2016/17 Quarter 4
15841 3501 15157 3283
The grey line on the XmR chart denotes the mean monthly activity over the previous 3 years and the pale blue line the current mean.
Current Mean
3 year Mean
Monthly Mean
2016/17 2015/16 2014/15
1320 1217 1263 1286 1102
1.2 Overall Activity

Lancashire Fire and Rescue Service Measuring Progress Jan 18 - Mar 18
making Lancashire safer 20
The number of primary fires where a dwelling has been affected and the cause of fire has been recorded as ‘Accidental’ or ‘Not known’.
A primary fire is one involving property (excluding derelict property) or any fires involving casualties, rescues, or any fire attended by five or more appliances. An appliance is counted if either the appliance, equipment from it or personnel riding on it, were used to fight the fire.
Quarter four activity 232, previous year quarter four activity 216, an increase of 7%.
1.3 Accidental Dwelling Fires Year to
Date 2017/18
Quarter 4 Previous year
to Date 2016/17
Quarter 4
935 232 850 216
The grey line on the XmR chart denotes the mean monthly activity over the previous 3 years and the pale blue line the current mean.
Current Mean
3 year Mean
Monthly Mean
2016/17 2015/16 2014/15
77 74 70 78 74
1.3 Accidental Dwelling Fires

Lancashire Fire and Rescue Service Measuring Progress Jan 18 - Mar 18
making Lancashire safer 21
ADF criteria as 1.3. Extent of fire and heat damage is limited to: Item ignited first, Limited to room of origin, Limited to floor of origin and Spread beyond floor of origin. *The ADF activity count is limited to only those ADF’s which had an extent of damage shown above. An improvement is shown if the total percentage of ‘Item first ignited’ and ‘Room of origin’ is greater than the comparable quarter of the previous year. Percentage of accidental dwelling fires limited to item 1st ignited in quarter four 24%, quarter four of previous year 25%. Percentage limited to room of origin in quarter four 62% quarter four previous year 59%, limited to floor of origin in quarter four 8%, quarter four previous year 9% and spread beyond floor 6%, previous year 7%.
2017/18 / 2016/17
*ADF
activity
Item 1st
ignited
Room of
origin
Floor of
origin
Spread beyond floor of origin Pr
ogre
ss
Item 1st
ignited
Room of
origin
Floor of
origin
Spread beyond floor of origin
Quarter 1 178 23% 59% 11% 7% 19% 63% 13% 6%
Quarter 2 149 23% 61% 7% 9% 22% 65% 10% 3%
Quarter 3 192 20% 69% 5% 6% 23% 67% 8% 3%
Quarter 4 176 24% 62% 8% 6% 25% 59% 9% 7%
ADF criteria as 1.3. The HFSC must be a completed job (i.e. not a refusal) carried out by LFRS personnel or partner agency. The HFSC must have been carried out within 12 months prior of the fire occurring.
2017/18 2016/17
ADF’s with previous HFSC
% of ADF’s with previous HFSC
ADF’s with previous HFSC
% of ADF’s with previous HFSC
Quarter 1 15 6% 15 7%
Quarter 2 20 10% 13 7%
Quarter 3 15 6% 20 8%
Quarter 4 18 8% 21 10% Analysis: Of the 18 accidental dwelling fire incidents that had received a HFSC within the previous 12 months, seven had ‘Heat and smoke damage only’, four resulted in damage ‘Limited to item first ignited’, six ‘limited to room of origin’ and one to ‘Limited to floor of origin’.
1.3.1 ADF - Extent of Damage
1.3.2 ADF - Number of Incidents Where Occupants have Received a HFSC

Lancashire Fire and Rescue Service Measuring Progress Jan 18 - Mar 18
making Lancashire safer 22
ADF criteria as 1.3. The number of fire related fatalities, slight and serious injuries. A slight injury is defined as; a person attending hospital as an outpatient (not precautionary check). A serious injury is defined as; at least an overnight stay in hospital as an in-patient.
Four fatalities occurred during quarter four. One casualty is recorded as serious and 6 slight. Quarter four of the previous year recorded 3 fatalities, 5 serious and 7 slight.
Casualty Status
Year to Date
2017/18 Quarter 4
Previous year to Date
2016/17 Quarter 4
Fatal 6 4 3 3
Victim went to hospital, injuries appear Serious 7 1 16 5
Victim went to hospital, injuries appear Slight 30 6 29 7
Total 43 11 48 15
The grey line on the XmR chart denotes the mean monthly activity over the previous 3 years and the pale blue line the current mean.
Current Mean
3 year Mean
Monthly Mean
2016/17 2015/16 2014/15
3 4 4 4 5
1.4 Accidental Dwelling Fire Casualties

Lancashire Fire and Rescue Service Measuring Progress Jan 18 - Mar 18
making Lancashire safer 23
Primary fire criteria as 1.3. The number of primary fires where; the property type is ‘Building’ and the property sub type does not equal ‘Dwelling’ and the cause of fire has been recorded as ‘Accidental’ or ‘Not known’.
Number of accidental building fires quarter four activity 79, previous year quarter four activity 85.
1.5 Accidental Building Fires Year to
Date 2017/18
Quarter 4 Previous year
to Date 2016/17
Quarter 4
370 79 344 85
The grey line on the XmR chart denotes the mean monthly activity over the previous 3 years and the pale blue line the current mean.
Current Mean
3 year Mean
Monthly Mean
2016/17 2015/16 2014/15
30 30 28 30 32
1.5 Accidental Building Fires (Non Dwellings)

Lancashire Fire and Rescue Service Measuring Progress Jan 18 - Mar 18
making Lancashire safer 24
ABF criteria as 1.5. Extent of fire and heat damage is limited to: Item ignited first, Limited to room of origin, Limited to floor of origin and Spread beyond floor of origin.
*The ABF activity count is limited to only those ABF’s which had an extent of damage shown above.
An improvement is shown if the total percentage of ‘Item first ignited’ and ‘Room of origin’ is greater than the comparable quarter of the previous year. Percentage of accidental building fires limited to item 1st ignited in quarter four 21%, quarter four of previous year 23%. Percentage limited to room of origin in quarter four 40%, quarter four previous year 36%, limited to floor of origin in quarter four 13%, quarter four previous year 15% and spread beyond floor 27%, previous year 26%.
2017/18 / 2016/17
*ABF
activity
Item 1st
ignited
Room of
origin
Floor of
origin
Spread beyond floor of origin Pr
ogre
ss
Item 1st
ignited
Room of
origin
Floor of
origin
Spread beyond floor of origin
Quarter 1 95 18% 30% 13% 39% 11% 41% 17% 31%
Quarter 2 65 31% 34% 12% 23% 6% 52% 13% 29%
Quarter 3 71 20% 42% 15% 23% 14% 51% 15% 21%
Quarter 4 63 21% 40% 13% 27% 23% 36% 15% 26%
1.5.1 ABF (Non Dwellings) - Extent of Damage

Lancashire Fire and Rescue Service Measuring Progress Jan 18 - Mar 18
making Lancashire safer 25
The number of primary and secondary fires where; the cause of fire has been recorded as ‘Deliberate’. Secondary fires are the majority of outdoor fires including grassland and refuse fires unless they involve casualties or rescues, property loss or 5 or more appliances attend. Includes fires in single derelict buildings.
1.6.1 Deliberate fires (ASB) quarter four activity 305, previous year quarter four activity 280. 1.6.2 Deliberate fires (Dwellings) quarter four activity 28, previous year quarter four activity 29. 1.6.3 Deliberate fires (Non dwellings) quarter four activity 23, previous year quarter four activity 29.
Deliberate Fire Type Year to Date
2017/18 Quarter 4
Previous year to Date
2016/17 Quarter 4
1.6.1 Deliberate Fires - ASB 1890 305 1811 280
1.6.2 Deliberate Fires - Dwellings 107 28 113 29
1.6.3 Deliberate Fires - Non Dwellings 142 23 146 29
The grey line on the XmR chart denotes the mean monthly activity over the previous 3 years and the pale blue line the current mean.
Current Mean
3 year Mean
Monthly Mean
2016/17 2015/16 2014/15
157 158 150 171 152
1.6 Deliberate Fires
Chart refers to KPI 1.6.1

Lancashire Fire and Rescue Service Measuring Progress Jan 18 - Mar 18
making Lancashire safer 26
The percentage of completed HFSC’s, excluding refusals, carried out by LFRS personnel or partner agencies where the risk score has been determined to be high.
An improvement is shown if:
1) the total number of HFSC’s completed is greater than the comparable quarter of the previous year and,
2) the percentage of high HFSC outcomes is greater than the comparable quarter of the previous year.
Count of HFSC’s in quarter four 2979, percentage of high risk HFSC outcomes in quarter four 71%. Count of HFSC’s in quarter four of the previous year 2937, percentage high risk 72%.
2017/18 / 2016/17
HFSC completed
% of High HFSC outcomes
Progress HFSC
completed % of High HFSC
outcomes
Quarter 1 3110 68% 1931 79%
Quarter 2 3241 72% 2556 75%
Quarter 3 2624 68% 3030 74%
Quarter 4 2979 71% 2937 72%
1.7 Home Fire Safety Checks

Lancashire Fire and Rescue Service Measuring Progress Jan 18 - Mar 18
making Lancashire safer 27
The percentage of participants of the Wasted Lives and RoadSense education packages that show a positive change to less risky behaviour following the programme. This is based on comparing the overall responses to an evaluation question pre and post-delivery of the course. An improvement is shown if the percentage positive influence on participants behaviour is greater than the comparable quarter of the previous year.
The ‘Safe Drive Stay Alive’ programme has seen by 2,273 students during quarter 4. The ‘Crashed cars’ shown at events, have been seen by approximately 8,341 people to date.
There was a total of 6,290 participants during quarter 4, with a percentage of positive influence[1] on participant’s behaviour for the current year to date of 85%.
2017/18 (Cumulative) / 2016/17
(Cumulative) Total
participants % positive influence
on participants behaviour
Prog
ress
Total participants
% positive influence on participants
behaviour
Quarter 1 1441 85% 1832 87%
Quarter 2 2259 85% 2847 85%
Quarter 3 3938 85% 6398 85%
Quarter 4 10228 85% 8733 85% [1] From a sample
1.8 Road Safety Education Evaluation

Lancashire Fire and Rescue Service Measuring Progress Jan 18 - Mar 18
making Lancashire safer 28
The percentage of premises that have had a Fire Safety Audit (as recorded in the CFRMIS system to date), as a percentage of the number of all known premises (as recorded in the Address Base Premium Gazetteer) in Lancashire to which The Regulatory Reform (Fire Safety) Order 2005 applies.
Total number of premises within system 32532, number of premises audited to date 17960 (55%).
Number of premises Number of premises
audited to date
% of all premises audited
to date: 2017/18
% of all premises audited
Year end: 2016/17
32532 17960 55% 56%
The percentage of Fire Safety Audits carried out within the period resulting in enforcement action. Enforcement action is defined as one or more of the following; notification of deficiencies, action plan, enforcement notice, alterations notice or prohibition notice.
An improvement is shown if the ‘Satisfactory Audits’ percentage is greater than the comparable quarter of the previous year.
Satisfactory audits in quarter four 18%, previous year quarter four 29% Requiring formal activity in quarter four 5%, previous year quarter four 8% Requiring informal activity in quarter four 74%, previous year quarter four 61%
2017/18 / 2016/17
Satisfactory audits
Requiring formal activity
Requiring informal activity
Progress Satisfactory
audits Requiring
formal activity
Requiring informal activity
Quarter 1 26% 8% 64% 27% 9% 59%
Quarter 2 26% 10% 65% 31% 9% 60%
Quarter 3 26% 5% 67% 26% 9% 63%
Quarter 4 18% 5% 74% 29% 8% 61%
1.9.1 Fire Safety Enforcement - Known Risk
1.9.2 Fire Safety Enforcement - Risk Reduction

Lancashire Fire and Rescue Service Measuring Progress Jan 18 - Mar 18
making Lancashire safer 29
Critical fire incidents are defined as incidents that are likely to involve a significant threat to life, structures or the environment. Our response standards, in respect of critical fires, are variable and are determined by the risk map (KPI 1.1) and subsequent risk grade of the Super Output Area (SOA) in which the fire occurred.
The response standards include call handling and fire engine response time for the first fire engine attending a critical fire, and are as follows:
• Very high risk area = 6 minutes • High risk area = 8 minutes • Medium risk area = 10 minutes • Low risk area = 12 minutes
We have achieved our standard when the time between the ‘Time of Call’ (TOC) and ‘Time in Attendance’ (TIA) of the first fire engine arriving at the incident is less than the relevant response standard. Standard: 90% of occasions. Quarter four 1st pump response 88.32%, previous year quarter four 83.38%.
1st pump cumulative attendance standard
Year to Date
2017/18 Quarter 4
Previous year to Date
2016/17 Quarter 4
88.57% 88.32% 85.82% 83.38%
80818283848586878889909192939495
1st Pump Cumulative Attendance
2% toleranceStandard% Pass
2.1.1 Lancashire Emergency Response Standards - Critical Fires - 1st Fire Engine Attendance

Lancashire Fire and Rescue Service Measuring Progress Jan 18 - Mar 18
making Lancashire safer 30
Critical fire incidents are defined as incidents that are likely to involve a significant threat to life, structures or the environment. Our response standards, in respect of critical fires, are variable and are determined by the risk map (KPI 1.1) and subsequent risk grade of the Super Output Area (SOA) in which the fire occurred.
The response standards include call handling and fire engine response time for the second fire engine attending a critical fire, and are as follows:
• Very high risk area = 9 minutes • High risk area = 11 minutes • Medium risk area = 13 minutes • Low risk area = 15 minutes
We have achieved our standard when the time between the ‘Time of Call’ and ‘Time in Attendance’ of second fire engine arriving at the incident is less than the relevant response standard.
Standard: 85% of occasions. Quarter four 2nd pump response 86.36%, previous year quarter four 86.00%.
2nd pump cumulative attendance standard
Year to Date
2017/18 Quarter 4
Previous year to Date
2016/17 Quarter 4
86.61% 86.36% 86.00% 85.95%
80
81
82
83
84
85
86
87
88
89
90
2nd Pump Cumulative Attendance
2% tolerance
Standard
% Pass
2.1.2 Lancashire Emergency Response Standards - Critical Fires - 2nd Fire Engine Attendance

Lancashire Fire and Rescue Service Measuring Progress Jan 18 - Mar 18
making Lancashire safer 31
This indicator measures the availability of fire engines that are crewed by wholetime, day crewing and day crewing plus shifts. It is measured as the percentage of time a fire engine is available to respond compared to the total time in the period.
Fire engines are designated as unavailable for the following reasons:
• Mechanical • Debrief • Crew deficient • Lack of equipment • Engineer working on station • Miscellaneous • Alternate crew • Unavailable • Appliance change over • Welfare
Standard: Above 99.5% Quarter four availability 99.45%, previous year quarter four 99.49%.
97.8
98.0
98.2
98.4
98.6
98.8
99.0
99.2
99.4
99.6
99.8
100.0
Q1 Q2 Q3 Q4 Q1 Q2 Q3 Q4 Q1 Q2 Q3 Q4 Q1 Q2 Q3 Q4
2014/15 2015/16 2016/17 2017/18
Availability - WT, DC and DCP
Standard
% Available
2.3 Fire Engine Availability - Wholetime, Day Crewing and Day Crewing Plus

Lancashire Fire and Rescue Service Measuring Progress Jan 18 - Mar 18
making Lancashire safer 32
The number of staff accidents. An improvement is shown if the average number of staff accidents per quarter is lower than the mean of the previous three years.
Number of staff accidents in quarter four 16. Previous year quarter four 18.
Total number of staff accidents Year to
Date 2017/18
Quarter 4 Previous year
to date 2016/17
Quarter 4 59 16 58 18
The grey line on the XmR chart denotes the mean quarterly activity over the previous 3 years and the pale blue line the current
Current Mean
3 year Mean
Quarterly Mean
2016/17 2015/16 2014/15
15 15 15 15 16
2.5 Staff Accidents
Q1 Q2 Q3 Q4 | Q1 Q2 Q3 Q4 | Q1 Q2 Q3 Q4 2015/16 2016/17 2017/18

Lancashire Fire and Rescue Service Measuring Progress Jan 18 - Mar 18
making Lancashire safer 33
The total cumulative value of the savings delivered to date compared to the year’s standard and the total.
Budget to end of quarter four £53.9 million. The spend for the period is £53.9 million. As a public service we are committed to providing a value for money service to the community and it is important that once a budget has been agreed and set, our spending remains within this.
The annual budget for 2017/18 was set at £53.9 million. The spend for the year is currently £53.9 million, although the closure of the accounts process during May (including year-end accounting adjustments in respect of items such as provisions and reserves transfers and capital accounting) has yet to be finalised. Following completion of the year end process, this is expected to result in a broadly break even position, which will be reported to Resources Committee in May.
Variance: 0.00%
3.1 Progress Against Savings Programme

Lancashire Fire and Rescue Service Measuring Progress Jan 18 - Mar 18
making Lancashire safer 34
The percentage of people who were satisfied with the service received as a percentage of the total number of people surveyed. People surveyed include those who have experienced an accidental dwelling fire, a commercial fire or a special service incident that we attended.
The standard is achieved if the percentage of satisfied responses is greater than the standard. 77 people were surveyed in quarter four, 75 responded that they were very or fairly satisfied.
Question Total Number Satisfied
% Satisfied
% Standard
% Variance
Taking everthing in to account, are you satisfied, dissatistfied, or neither with the service you received from Lancashire Fire and Rescue Service?
1838 1822 99.13% 97.50% 1.67%
There have been 1838 people surveyed since April 2012.
In quarter four of 2017/18 - 77 people were surveyed. 75 responded that they were ‘very satisfied’ or ‘fairly satisfied’ with the service they received.
3.2 Overall User Satisfaction

Lancashire Fire and Rescue Service Measuring Progress Jan 18 - Mar 18
making Lancashire safer 35
All staff are asked the same questions in an online survey covering feelings of pride, advocacy, attachment, inspiration and motivation - factors that are understood to be important features shared by staff who are engaged with the organisation. The survey mirrors the questions asked by the Civil Service People Survey.
From these responses: An index score to show the degree to which the response group answers positively to a number of questions about their engagement with LFRS.
This is calculated by attributing a weighting to each of the five possible answers ranging from 0% to 100%, in 25% increments. The percentage scores are then totalled and divided by the number of questions (5). This individual person score is then totalled across the service then divided by the number of respondents.
An improvement is shown if the percentage engagement index is greater than the previous survey.
An engagement index score is derived from the answers given by staff about questions relating to how engaged they feel with the Service. A comprehensive survey will be undertaken in the new fiscal year. This will be reported in quarter 1 of 2018/19. Previous results are shown below for information.
2016/17
Period Number of
replies Engagement
index 1 220 62% 2 141 64% 3 141 64%
4.1 Overall Staff Engagement

Lancashire Fire and Rescue Service Measuring Progress Jan 18 - Mar 18
making Lancashire safer 36
The percentage of contracted hours lost due to sickness for all RDS staff. An individual’s sickness hours are only counted as absent where they overlap with their contracted hours.
Cumulative retained absence, as a percentage of available hours of cover at end of quarter four, 0.72%
Annual Standard: No more than 2.5% lost as % of available hours of cover.
Cumulative retained absence (as % of available hours of cover) 0.72%
0.00%
0.50%
1.00%
1.50%
2.00%
2.50%
3.00%
Staff Absence - Retained Duty System Retained Absence % Standard
4.2.2 Staff Absence - Retained Duty System