january 22, 2014 - health management
TRANSCRIPT
IN FOCUS: MEDICAID MANAGED CARE ENROLLMENT UPDATE – Q4 2013
EXCHANGE PLAN SIGN-UPS ACCELERATE
NEW YORK DELAYS DUALS DEMO IMPLEMENTATION
MICHIGAN, WASHINGTON CONTEMPLATE MENTAL HEALTH PROGRAM
CHANGES
KANCARE DD EXPANSION SCHEDULED FOR FEBRUARY 1
COOK COUNTY HOSPITAL CEO STEPPING DOWN
GEORGIA BUDGET PROPOSAL INCLUDES FUNDING FOR HIPF
UNITED REPORTS 2013 YEAR-END RESULTS
GATEWAY HEALTH PLAN NAMES CEO
MEDICAID MANAGED CARE ENROLLMENT UPDATE – Q4 2013
This week, our In Focus section reviews recent Medicaid enrollment trends in capitated risk-based managed care in 20 states. Many state Medicaid agencies elect to post month-ly enrollment figures by health plan to their websites for their Medicaid managed care population. We believe this data allows for the timeliest analysis of enrollment trends across states and managed care organizations. Many of these 20 states have released monthly Medicaid managed care enrollment data through much of the fourth quarter (Q4) of 2013.
In the discussion below, we describe recent enrollment trends in the states where we track data.
It is important to note the limitations of the data that is presented. First, we note that not all states report the data at the same time during the month. As a result, some of these figures reflect beginning-of-the-month totals, while others reflect an end-of-the-month snapshot. Second, in some cases the data is comprehensive in that it covers all of the state-sponsored health programs for which the state offers managed care; in other cases, the data reflects only a subset of the broader managed Medicaid population. This is a significant limitation of the data and the key limiting factor in drawing direct ties be-
IN FOCUS
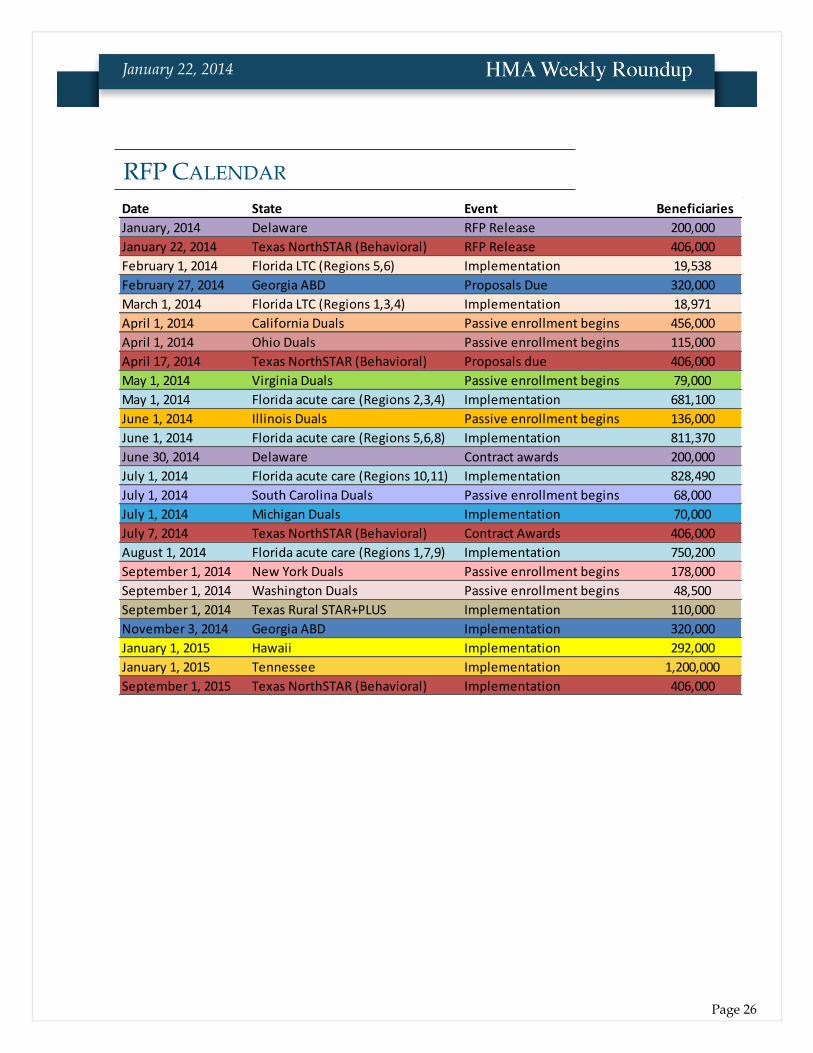
RFP CALENDAR
DUAL ELIGIBLES
CALENDAR
HMA NEWS Edited by:
Greg Nersessian, CFA Email
Jim Kumpel, CFA Email
Andrew Fairgrieve Email
January 22, 2014
THIS WEEK
Page 2
January 22, 2014
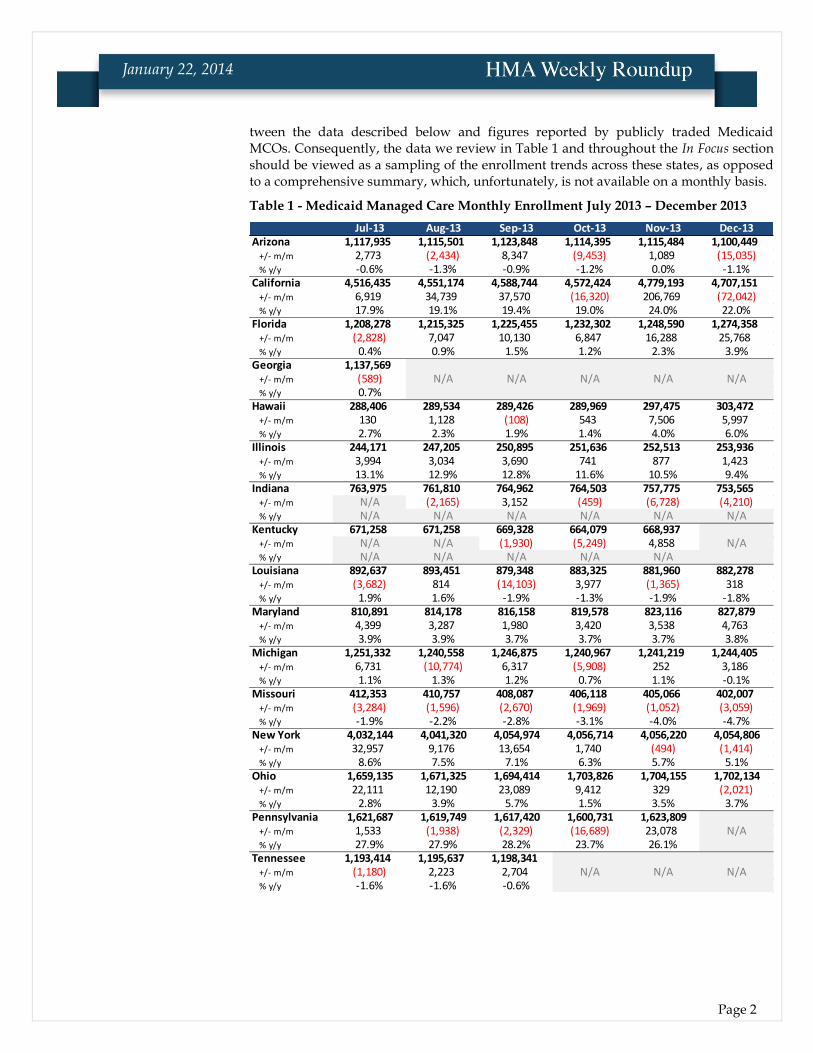
tween the data described below and figures reported by publicly traded Medicaid MCOs. Consequently, the data we review in Table 1 and throughout the In Focus section should be viewed as a sampling of the enrollment trends across these states, as opposed to a comprehensive summary, which, unfortunately, is not available on a monthly basis.
Table 1 - Medicaid Managed Care Monthly Enrollment July 2013 – December 2013
Jul-13 Aug-13 Sep-13 Oct-13 Nov-13 Dec-13Arizona 1,117,935 1,115,501 1,123,848 1,114,395 1,115,484 1,100,449
+/- m/m 2,773 (2,434) 8,347 (9,453) 1,089 (15,035)% y/y -0.6% -1.3% -0.9% -1.2% 0.0% -1.1%
California 4,516,435 4,551,174 4,588,744 4,572,424 4,779,193 4,707,151+/- m/m 6,919 34,739 37,570 (16,320) 206,769 (72,042)% y/y 17.9% 19.1% 19.4% 19.0% 24.0% 22.0%
Florida 1,208,278 1,215,325 1,225,455 1,232,302 1,248,590 1,274,358+/- m/m (2,828) 7,047 10,130 6,847 16,288 25,768% y/y 0.4% 0.9% 1.5% 1.2% 2.3% 3.9%
Georgia 1,137,569+/- m/m (589) N/A N/A N/A N/A N/A% y/y 0.7%
Hawaii 288,406 289,534 289,426 289,969 297,475 303,472+/- m/m 130 1,128 (108) 543 7,506 5,997% y/y 2.7% 2.3% 1.9% 1.4% 4.0% 6.0%
Illinois 244,171 247,205 250,895 251,636 252,513 253,936+/- m/m 3,994 3,034 3,690 741 877 1,423% y/y 13.1% 12.9% 12.8% 11.6% 10.5% 9.4%
Indiana 763,975 761,810 764,962 764,503 757,775 753,565+/- m/m N/A (2,165) 3,152 (459) (6,728) (4,210)% y/y N/A N/A N/A N/A N/A N/A
Kentucky 671,258 671,258 669,328 664,079 668,937+/- m/m N/A N/A (1,930) (5,249) 4,858 N/A% y/y N/A N/A N/A N/A N/A
Louisiana 892,637 893,451 879,348 883,325 881,960 882,278+/- m/m (3,682) 814 (14,103) 3,977 (1,365) 318% y/y 1.9% 1.6% -1.9% -1.3% -1.9% -1.8%
Maryland 810,891 814,178 816,158 819,578 823,116 827,879+/- m/m 4,399 3,287 1,980 3,420 3,538 4,763% y/y 3.9% 3.9% 3.7% 3.7% 3.7% 3.8%
Michigan 1,251,332 1,240,558 1,246,875 1,240,967 1,241,219 1,244,405+/- m/m 6,731 (10,774) 6,317 (5,908) 252 3,186% y/y 1.1% 1.3% 1.2% 0.7% 1.1% -0.1%
Missouri 412,353 410,757 408,087 406,118 405,066 402,007+/- m/m (3,284) (1,596) (2,670) (1,969) (1,052) (3,059)% y/y -1.9% -2.2% -2.8% -3.1% -4.0% -4.7%
New York 4,032,144 4,041,320 4,054,974 4,056,714 4,056,220 4,054,806+/- m/m 32,957 9,176 13,654 1,740 (494) (1,414)% y/y 8.6% 7.5% 7.1% 6.3% 5.7% 5.1%
Ohio 1,659,135 1,671,325 1,694,414 1,703,826 1,704,155 1,702,134+/- m/m 22,111 12,190 23,089 9,412 329 (2,021)% y/y 2.8% 3.9% 5.7% 1.5% 3.5% 3.7%
Pennsylvania 1,621,687 1,619,749 1,617,420 1,600,731 1,623,809+/- m/m 1,533 (1,938) (2,329) (16,689) 23,078 N/A% y/y 27.9% 27.9% 28.2% 23.7% 26.1%
Tennessee 1,193,414 1,195,637 1,198,341+/- m/m (1,180) 2,223 2,704 N/A N/A N/A% y/y -1.6% -1.6% -0.6%
Texas 3,507,643 3,518,019 3,491,621 3,522,021+/- m/m (42,388) 10,376 (26,398) 30,400 N/A N/A% y/y -0.1% 0.6% 0.5% 0.0%
Washington 8,462 8,521 8,606 8,746 9,480+/- m/m 75 59 85 140 734 N/A% y/y 20.4% 23.2% 25.5% 28.2% 36.1%
West Virginia 170,377 170,612 170,326 170,709 180,471 184,928+/- m/m (1,386) 235 (286) 383 9,762 4,457% y/y 2.3% 1.1% 2.2% 1.1% 5.4% 7.7%
Wisconsin 742,175 743,789 739,806 738,194 738,293 735,167+/- m/m (3,037) 1,614 (3,983) (1,612) 99 (3,126)% y/y 0.2% 2.2% 2.2% 2.5% 27.8% 25.0%
Page 3
January 22, 2014
Jul-13 Aug-13 Sep-13 Oct-13 Nov-13 Dec-13Arizona 1,117,935 1,115,501 1,123,848 1,114,395 1,115,484 1,100,449
+/- m/m 2,773 (2,434) 8,347 (9,453) 1,089 (15,035)% y/y -0.6% -1.3% -0.9% -1.2% 0.0% -1.1%
California 4,516,435 4,551,174 4,588,744 4,572,424 4,779,193 4,707,151+/- m/m 6,919 34,739 37,570 (16,320) 206,769 (72,042)% y/y 17.9% 19.1% 19.4% 19.0% 24.0% 22.0%
Florida 1,208,278 1,215,325 1,225,455 1,232,302 1,248,590 1,274,358+/- m/m (2,828) 7,047 10,130 6,847 16,288 25,768% y/y 0.4% 0.9% 1.5% 1.2% 2.3% 3.9%
Georgia 1,137,569+/- m/m (589) N/A N/A N/A N/A N/A% y/y 0.7%
Hawaii 288,406 289,534 289,426 289,969 297,475 303,472+/- m/m 130 1,128 (108) 543 7,506 5,997% y/y 2.7% 2.3% 1.9% 1.4% 4.0% 6.0%
Illinois 244,171 247,205 250,895 251,636 252,513 253,936+/- m/m 3,994 3,034 3,690 741 877 1,423% y/y 13.1% 12.9% 12.8% 11.6% 10.5% 9.4%
Indiana 763,975 761,810 764,962 764,503 757,775 753,565+/- m/m N/A (2,165) 3,152 (459) (6,728) (4,210)% y/y N/A N/A N/A N/A N/A N/A
Kentucky 671,258 671,258 669,328 664,079 668,937+/- m/m N/A N/A (1,930) (5,249) 4,858 N/A% y/y N/A N/A N/A N/A N/A
Louisiana 892,637 893,451 879,348 883,325 881,960 882,278+/- m/m (3,682) 814 (14,103) 3,977 (1,365) 318% y/y 1.9% 1.6% -1.9% -1.3% -1.9% -1.8%
Maryland 810,891 814,178 816,158 819,578 823,116 827,879+/- m/m 4,399 3,287 1,980 3,420 3,538 4,763% y/y 3.9% 3.9% 3.7% 3.7% 3.7% 3.8%
Michigan 1,251,332 1,240,558 1,246,875 1,240,967 1,241,219 1,244,405+/- m/m 6,731 (10,774) 6,317 (5,908) 252 3,186% y/y 1.1% 1.3% 1.2% 0.7% 1.1% -0.1%
Missouri 412,353 410,757 408,087 406,118 405,066 402,007+/- m/m (3,284) (1,596) (2,670) (1,969) (1,052) (3,059)% y/y -1.9% -2.2% -2.8% -3.1% -4.0% -4.7%
New York 4,032,144 4,041,320 4,054,974 4,056,714 4,056,220 4,054,806+/- m/m 32,957 9,176 13,654 1,740 (494) (1,414)% y/y 8.6% 7.5% 7.1% 6.3% 5.7% 5.1%
Ohio 1,659,135 1,671,325 1,694,414 1,703,826 1,704,155 1,702,134+/- m/m 22,111 12,190 23,089 9,412 329 (2,021)% y/y 2.8% 3.9% 5.7% 1.5% 3.5% 3.7%
Pennsylvania 1,621,687 1,619,749 1,617,420 1,600,731 1,623,809+/- m/m 1,533 (1,938) (2,329) (16,689) 23,078 N/A% y/y 27.9% 27.9% 28.2% 23.7% 26.1%
Tennessee 1,193,414 1,195,637 1,198,341+/- m/m (1,180) 2,223 2,704 N/A N/A N/A% y/y -1.6% -1.6% -0.6%
Texas 3,507,643 3,518,019 3,491,621 3,522,021+/- m/m (42,388) 10,376 (26,398) 30,400 N/A N/A% y/y -0.1% 0.6% 0.5% 0.0%
Washington 8,462 8,521 8,606 8,746 9,480+/- m/m 75 59 85 140 734 N/A% y/y 20.4% 23.2% 25.5% 28.2% 36.1%
West Virginia 170,377 170,612 170,326 170,709 180,471 184,928+/- m/m (1,386) 235 (286) 383 9,762 4,457% y/y 2.3% 1.1% 2.2% 1.1% 5.4% 7.7%
Wisconsin 742,175 743,789 739,806 738,194 738,293 735,167+/- m/m (3,037) 1,614 (3,983) (1,612) 99 (3,126)% y/y 0.2% 2.2% 2.2% 2.5% 27.8% 25.0%
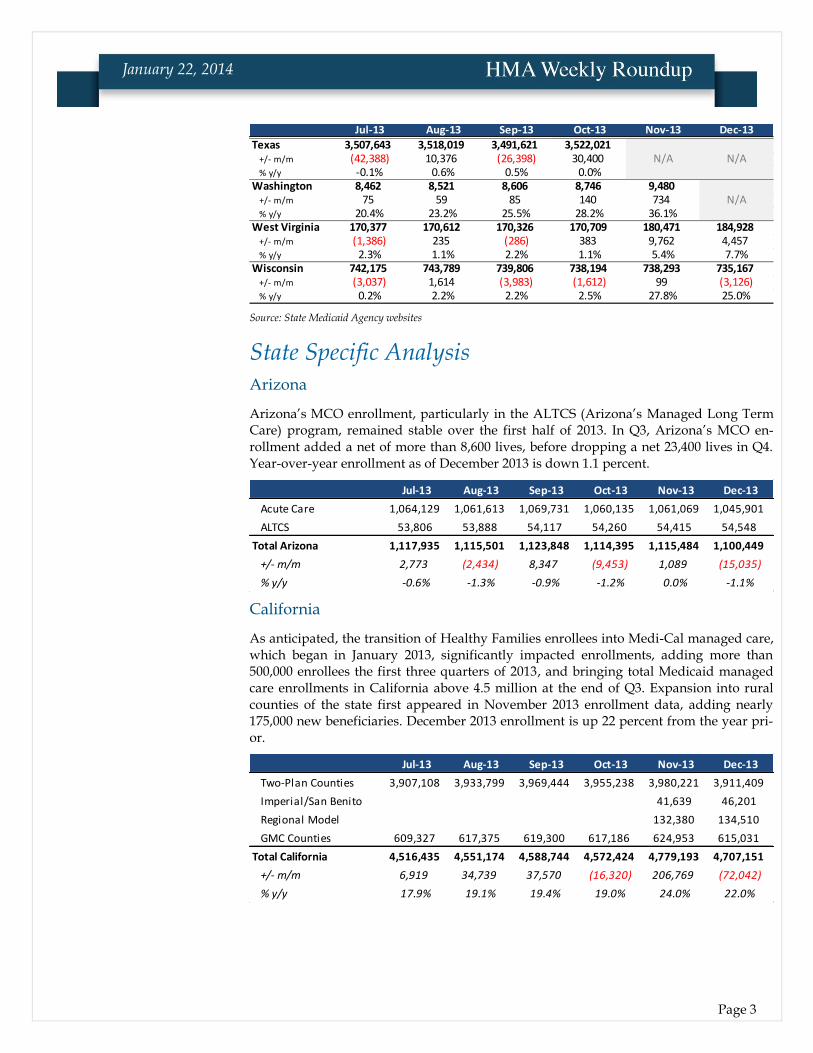
Source: State Medicaid Agency websites
State Specific Analysis Arizona
Arizona’s MCO enrollment, particularly in the ALTCS (Arizona’s Managed Long Term Care) program, remained stable over the first half of 2013. In Q3, Arizona’s MCO en-rollment added a net of more than 8,600 lives, before dropping a net 23,400 lives in Q4. Year-over-year enrollment as of December 2013 is down 1.1 percent.
Jul-13 Aug-13 Sep-13 Oct-13 Nov-13 Dec-13
Acute Care 1,064,129 1,061,613 1,069,731 1,060,135 1,061,069 1,045,901
ALTCS 53,806 53,888 54,117 54,260 54,415 54,548
Total Arizona 1,117,935 1,115,501 1,123,848 1,114,395 1,115,484 1,100,449
+/- m/m 2,773 (2,434) 8,347 (9,453) 1,089 (15,035)
% y/y -0.6% -1.3% -0.9% -1.2% 0.0% -1.1%
California
As anticipated, the transition of Healthy Families enrollees into Medi-Cal managed care, which began in January 2013, significantly impacted enrollments, adding more than 500,000 enrollees the first three quarters of 2013, and bringing total Medicaid managed care enrollments in California above 4.5 million at the end of Q3. Expansion into rural counties of the state first appeared in November 2013 enrollment data, adding nearly 175,000 new beneficiaries. December 2013 enrollment is up 22 percent from the year pri-or.
Jul-13 Aug-13 Sep-13 Oct-13 Nov-13 Dec-13
Two-Plan Counties 3,907,108 3,933,799 3,969,444 3,955,238 3,980,221 3,911,409
Imperial/San Benito 41,639 46,201
Regional Model 132,380 134,510
GMC Counties 609,327 617,375 619,300 617,186 624,953 615,031
Total California 4,516,435 4,551,174 4,588,744 4,572,424 4,779,193 4,707,151
+/- m/m 6,919 34,739 37,570 (16,320) 206,769 (72,042)
% y/y 17.9% 19.1% 19.4% 19.0% 24.0% 22.0%

Page 4
January 22, 2014
Florida
Florida managed care enrollments totaled more than 1.27 million in December 2013, up 3.9 percent on a year-over-year basis. Q3 and Q4 of 2013 saw the first enrollments into the state’s Medicaid Managed Long Term Care (SMMC LTC) program. This does not in-clude Florida Healthy Kids (CHIP) enrollments (see table below).
Jul-13 Aug-13 Sep-13 Oct-13 Nov-13 Dec-13
MMCP 1,043,744 1,043,906 1,041,453 1,047,436 1,052,505 1,058,409
Reform Pilot 164,534 162,654 163,463 164,326 166,252 168,168
SMMC LTC 8,765 20,539 20,540 29,833 47,781
Total Florida 1,208,278 1,215,325 1,225,455 1,232,302 1,248,590 1,274,358
+/- m/m (2,828) 7,047 10,130 6,847 16,288 25,768
% y/y 0.4% 0.9% 1.5% 1.2% 2.3% 3.9%
Below we have provided Q3 and Q4 enrollments by health plan for the Florida Healthy Kids program. We will integrate these enrollment figures into the table above once a full year of Florida Healthy Kids program data is available.
Jul-13 Aug-13 Sep-13 Oct-13 Nov-13 Dec-13
Total FL Healthy Kids 237,696 238,954 238,341 235,544 236,885 225,532
Georgia
Georgia has not reported Medicaid managed care enrollment numbers since July 2013, when total enrollment stood at 1.137 million, up less than 1 percent from the previous year.
Feb-13 Mar-13 Apr-13 May-13 Jun-13 Jul-13
Total Georgia 1,133,171 1,128,705 1,136,705 1,134,584 1,138,158 1,137,569
+/- m/m (2,743) (4,466) 8,000 (2,121) 3,574 (589)
% y/y 2.2% 1.1% 1.2% 1.1% 1.0% 0.7%
Hawaii
Hawaii’s managed care enrollment in both the QUEST managed Medicaid and QUEST Expanded Access (QExA) managed Medicaid aged, blind, and disabled (ABD) programs topped 303,000 as of December 2013, up 6 percent from the previous year.
Jul-13 Aug-13 Sep-13 Oct-13 Nov-13 Dec-13
Total QUEST 242,409 243,370 243,328 243,588 250,456 256,398
Total QExA 45,997 46,164 46,098 46,381 47,019 47,074
Total Hawaii 288,406 289,534 289,426 289,969 297,475 303,472
+/- m/m 130 1,128 (108) 543 7,506 5,997
% y/y 2.7% 2.3% 1.9% 1.4% 4.0% 6.0%
Page 5
January 22, 2014
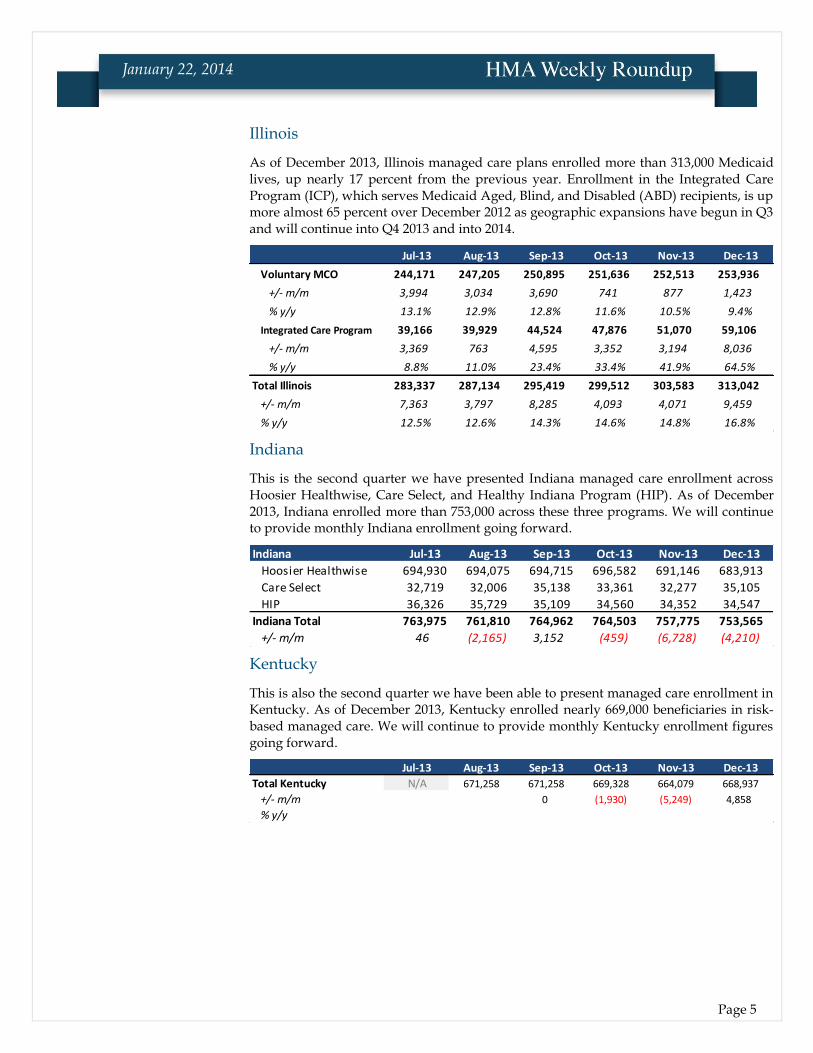
Illinois
As of December 2013, Illinois managed care plans enrolled more than 313,000 Medicaid lives, up nearly 17 percent from the previous year. Enrollment in the Integrated Care Program (ICP), which serves Medicaid Aged, Blind, and Disabled (ABD) recipients, is up more almost 65 percent over December 2012 as geographic expansions have begun in Q3 and will continue into Q4 2013 and into 2014.
Jul-13 Aug-13 Sep-13 Oct-13 Nov-13 Dec-13
Voluntary MCO 244,171 247,205 250,895 251,636 252,513 253,936
+/- m/m 3,994 3,034 3,690 741 877 1,423
% y/y 13.1% 12.9% 12.8% 11.6% 10.5% 9.4%
Integrated Care Program 39,166 39,929 44,524 47,876 51,070 59,106
+/- m/m 3,369 763 4,595 3,352 3,194 8,036
% y/y 8.8% 11.0% 23.4% 33.4% 41.9% 64.5%
Total Illinois 283,337 287,134 295,419 299,512 303,583 313,042
+/- m/m 7,363 3,797 8,285 4,093 4,071 9,459
% y/y 12.5% 12.6% 14.3% 14.6% 14.8% 16.8%
Indiana
This is the second quarter we have presented Indiana managed care enrollment across Hoosier Healthwise, Care Select, and Healthy Indiana Program (HIP). As of December 2013, Indiana enrolled more than 753,000 across these three programs. We will continue to provide monthly Indiana enrollment going forward.
Indiana Jul-13 Aug-13 Sep-13 Oct-13 Nov-13 Dec-13
Hoosier Healthwise 694,930 694,075 694,715 696,582 691,146 683,913
Care Select 32,719 32,006 35,138 33,361 32,277 35,105
HIP 36,326 35,729 35,109 34,560 34,352 34,547
Indiana Total 763,975 761,810 764,962 764,503 757,775 753,565
+/- m/m 46 (2,165) 3,152 (459) (6,728) (4,210)
Kentucky
This is also the second quarter we have been able to present managed care enrollment in Kentucky. As of December 2013, Kentucky enrolled nearly 669,000 beneficiaries in risk-based managed care. We will continue to provide monthly Kentucky enrollment figures going forward.
Jul-13 Aug-13 Sep-13 Oct-13 Nov-13 Dec-13
Total Kentucky N/A 671,258 671,258 669,328 664,079 668,937
+/- m/m 0 (1,930) (5,249) 4,858
% y/y
Page 6
January 22, 2014
Louisiana
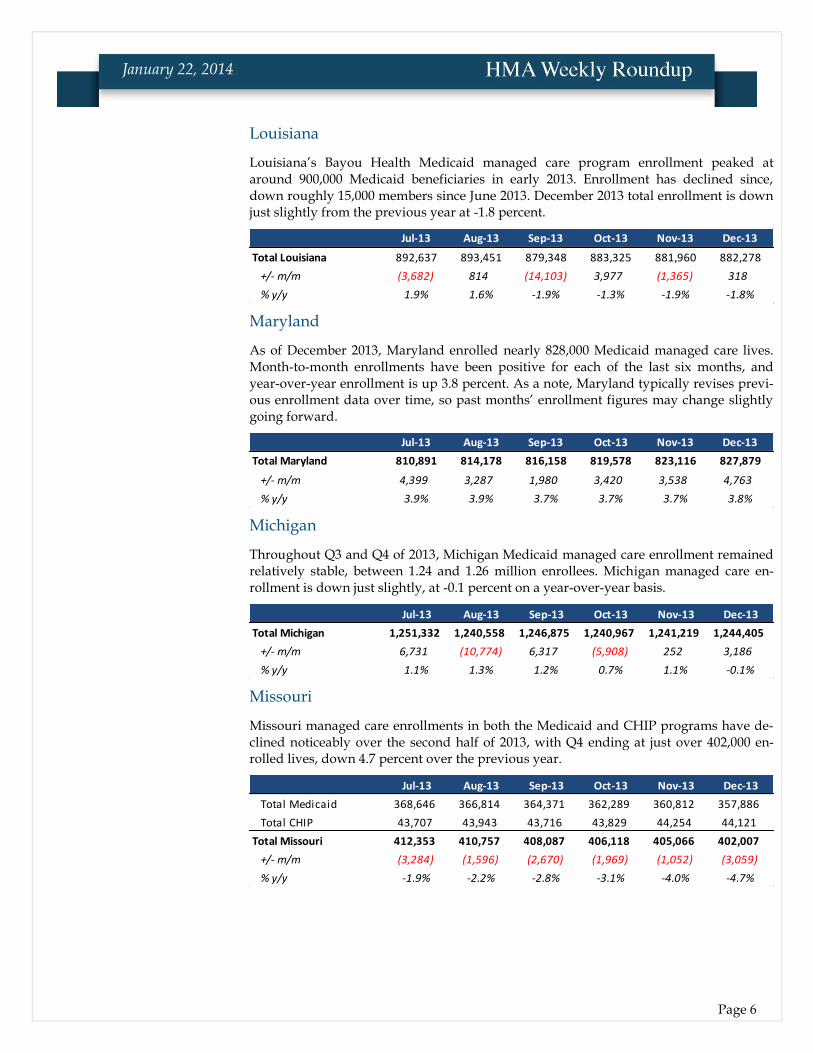
Louisiana’s Bayou Health Medicaid managed care program enrollment peaked at around 900,000 Medicaid beneficiaries in early 2013. Enrollment has declined since, down roughly 15,000 members since June 2013. December 2013 total enrollment is down just slightly from the previous year at -1.8 percent.
Jul-13 Aug-13 Sep-13 Oct-13 Nov-13 Dec-13
Total Louisiana 892,637 893,451 879,348 883,325 881,960 882,278
+/- m/m (3,682) 814 (14,103) 3,977 (1,365) 318
% y/y 1.9% 1.6% -1.9% -1.3% -1.9% -1.8%
Maryland
As of December 2013, Maryland enrolled nearly 828,000 Medicaid managed care lives. Month-to-month enrollments have been positive for each of the last six months, and year-over-year enrollment is up 3.8 percent. As a note, Maryland typically revises previ-ous enrollment data over time, so past months’ enrollment figures may change slightly going forward.
Jul-13 Aug-13 Sep-13 Oct-13 Nov-13 Dec-13
Total Maryland 810,891 814,178 816,158 819,578 823,116 827,879
+/- m/m 4,399 3,287 1,980 3,420 3,538 4,763
% y/y 3.9% 3.9% 3.7% 3.7% 3.7% 3.8%
Michigan
Throughout Q3 and Q4 of 2013, Michigan Medicaid managed care enrollment remained relatively stable, between 1.24 and 1.26 million enrollees. Michigan managed care en-rollment is down just slightly, at -0.1 percent on a year-over-year basis.
Jul-13 Aug-13 Sep-13 Oct-13 Nov-13 Dec-13
Total Michigan 1,251,332 1,240,558 1,246,875 1,240,967 1,241,219 1,244,405
+/- m/m 6,731 (10,774) 6,317 (5,908) 252 3,186
% y/y 1.1% 1.3% 1.2% 0.7% 1.1% -0.1%
Missouri
Missouri managed care enrollments in both the Medicaid and CHIP programs have de-clined noticeably over the second half of 2013, with Q4 ending at just over 402,000 en-rolled lives, down 4.7 percent over the previous year.
Jul-13 Aug-13 Sep-13 Oct-13 Nov-13 Dec-13
Total Medicaid 368,646 366,814 364,371 362,289 360,812 357,886
Total CHIP 43,707 43,943 43,716 43,829 44,254 44,121
Total Missouri 412,353 410,757 408,087 406,118 405,066 402,007
+/- m/m (3,284) (1,596) (2,670) (1,969) (1,052) (3,059)
% y/y -1.9% -2.2% -2.8% -3.1% -4.0% -4.7%
Page 7
January 22, 2014
New York
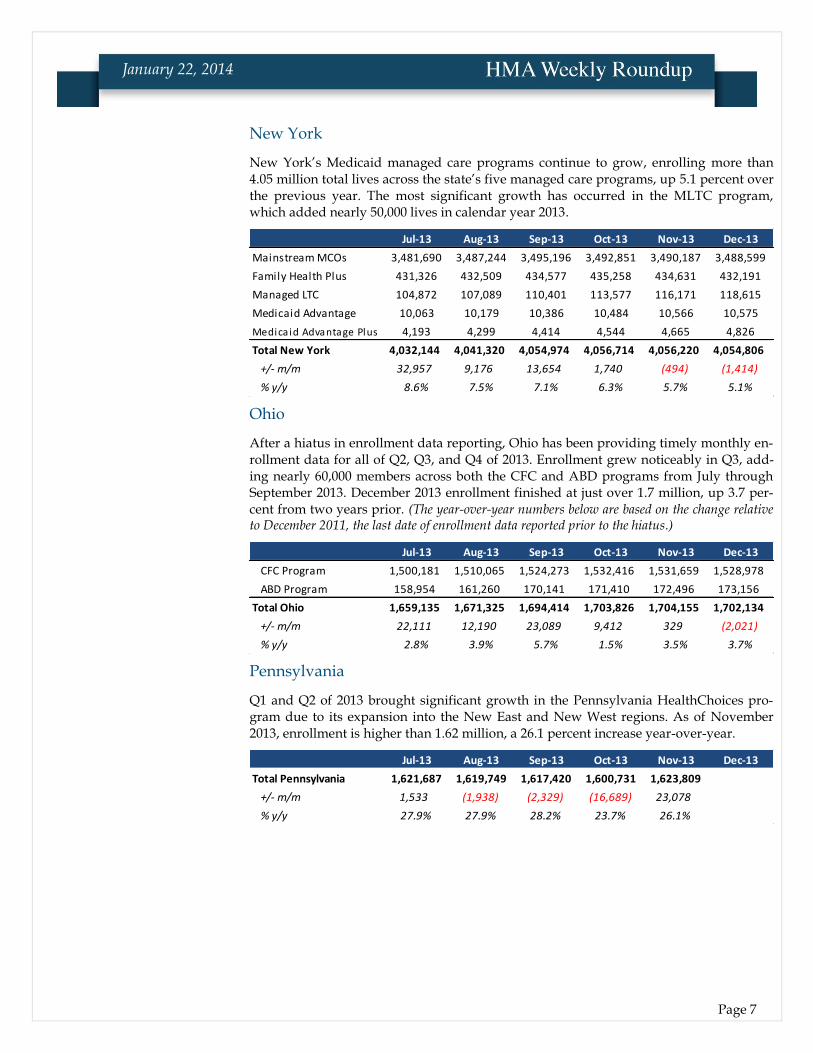
New York’s Medicaid managed care programs continue to grow, enrolling more than 4.05 million total lives across the state’s five managed care programs, up 5.1 percent over the previous year. The most significant growth has occurred in the MLTC program, which added nearly 50,000 lives in calendar year 2013.
Jul-13 Aug-13 Sep-13 Oct-13 Nov-13 Dec-13
Mainstream MCOs 3,481,690 3,487,244 3,495,196 3,492,851 3,490,187 3,488,599
Family Health Plus 431,326 432,509 434,577 435,258 434,631 432,191
Managed LTC 104,872 107,089 110,401 113,577 116,171 118,615
Medicaid Advantage 10,063 10,179 10,386 10,484 10,566 10,575
Medicaid Advantage Plus 4,193 4,299 4,414 4,544 4,665 4,826
Total New York 4,032,144 4,041,320 4,054,974 4,056,714 4,056,220 4,054,806
+/- m/m 32,957 9,176 13,654 1,740 (494) (1,414)
% y/y 8.6% 7.5% 7.1% 6.3% 5.7% 5.1%
Ohio
After a hiatus in enrollment data reporting, Ohio has been providing timely monthly en-rollment data for all of Q2, Q3, and Q4 of 2013. Enrollment grew noticeably in Q3, add-ing nearly 60,000 members across both the CFC and ABD programs from July through September 2013. December 2013 enrollment finished at just over 1.7 million, up 3.7 per-cent from two years prior. (The year-over-year numbers below are based on the change relative to December 2011, the last date of enrollment data reported prior to the hiatus.)
Jul-13 Aug-13 Sep-13 Oct-13 Nov-13 Dec-13
CFC Program 1,500,181 1,510,065 1,524,273 1,532,416 1,531,659 1,528,978
ABD Program 158,954 161,260 170,141 171,410 172,496 173,156
Total Ohio 1,659,135 1,671,325 1,694,414 1,703,826 1,704,155 1,702,134
+/- m/m 22,111 12,190 23,089 9,412 329 (2,021)
% y/y 2.8% 3.9% 5.7% 1.5% 3.5% 3.7%
Pennsylvania
Q1 and Q2 of 2013 brought significant growth in the Pennsylvania HealthChoices pro-gram due to its expansion into the New East and New West regions. As of November 2013, enrollment is higher than 1.62 million, a 26.1 percent increase year-over-year.
Jul-13 Aug-13 Sep-13 Oct-13 Nov-13 Dec-13
Total Pennsylvania 1,621,687 1,619,749 1,617,420 1,600,731 1,623,809
+/- m/m 1,533 (1,938) (2,329) (16,689) 23,078
% y/y 27.9% 27.9% 28.2% 23.7% 26.1%
Page 8
January 22, 2014
Tennessee
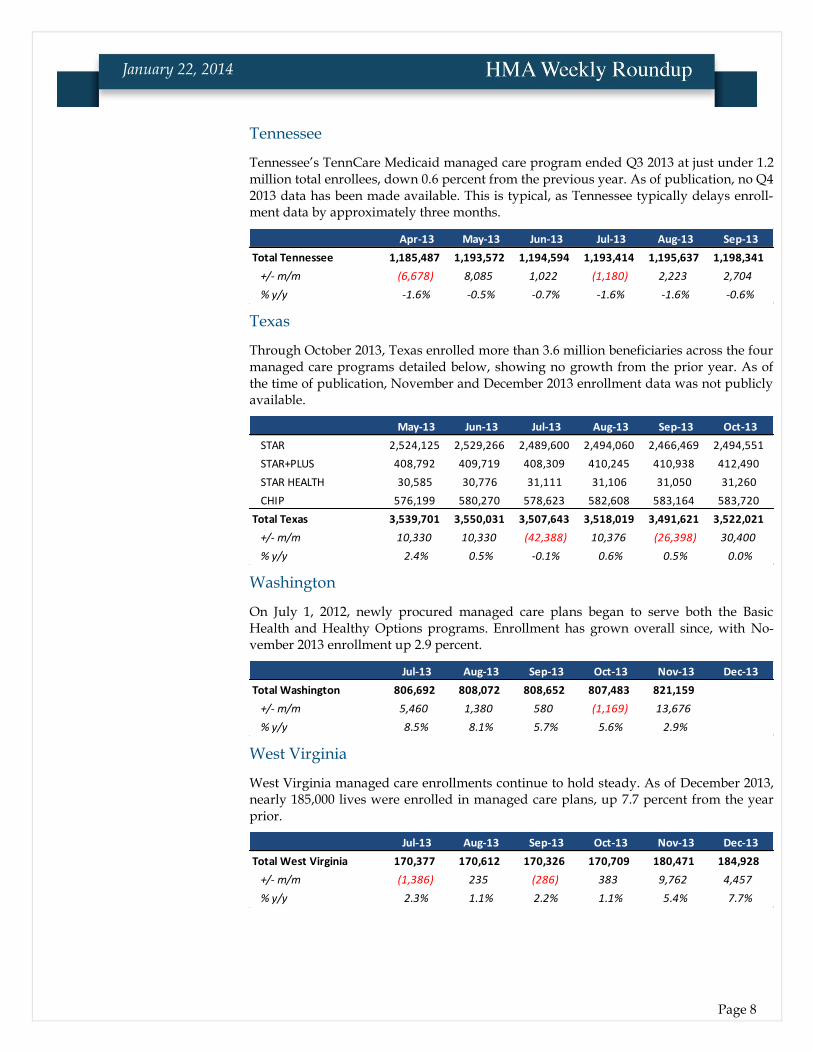
Tennessee’s TennCare Medicaid managed care program ended Q3 2013 at just under 1.2 million total enrollees, down 0.6 percent from the previous year. As of publication, no Q4 2013 data has been made available. This is typical, as Tennessee typically delays enroll-ment data by approximately three months.
Apr-13 May-13 Jun-13 Jul-13 Aug-13 Sep-13
Total Tennessee 1,185,487 1,193,572 1,194,594 1,193,414 1,195,637 1,198,341
+/- m/m (6,678) 8,085 1,022 (1,180) 2,223 2,704
% y/y -1.6% -0.5% -0.7% -1.6% -1.6% -0.6%
Texas
Through October 2013, Texas enrolled more than 3.6 million beneficiaries across the four managed care programs detailed below, showing no growth from the prior year. As of the time of publication, November and December 2013 enrollment data was not publicly available.
May-13 Jun-13 Jul-13 Aug-13 Sep-13 Oct-13
STAR 2,524,125 2,529,266 2,489,600 2,494,060 2,466,469 2,494,551
STAR+PLUS 408,792 409,719 408,309 410,245 410,938 412,490
STAR HEALTH 30,585 30,776 31,111 31,106 31,050 31,260
CHIP 576,199 580,270 578,623 582,608 583,164 583,720
Total Texas 3,539,701 3,550,031 3,507,643 3,518,019 3,491,621 3,522,021
+/- m/m 10,330 10,330 (42,388) 10,376 (26,398) 30,400
% y/y 2.4% 0.5% -0.1% 0.6% 0.5% 0.0%
Washington
On July 1, 2012, newly procured managed care plans began to serve both the Basic Health and Healthy Options programs. Enrollment has grown overall since, with No-vember 2013 enrollment up 2.9 percent.
Jul-13 Aug-13 Sep-13 Oct-13 Nov-13 Dec-13
Total Washington 806,692 808,072 808,652 807,483 821,159
+/- m/m 5,460 1,380 580 (1,169) 13,676
% y/y 8.5% 8.1% 5.7% 5.6% 2.9%
West Virginia
West Virginia managed care enrollments continue to hold steady. As of December 2013, nearly 185,000 lives were enrolled in managed care plans, up 7.7 percent from the year prior.
Jul-13 Aug-13 Sep-13 Oct-13 Nov-13 Dec-13
Total West Virginia 170,377 170,612 170,326 170,709 180,471 184,928
+/- m/m (1,386) 235 (286) 383 9,762 4,457
% y/y 2.3% 1.1% 2.2% 1.1% 5.4% 7.7%

Page 9
January 22, 2014
Wisconsin
Across the state’s three managed care programs, December 2013 enrollment totals more than 735,000, up 25 percent from the year before. It should be noted, however, that this year-over-year increase is distorted due to a sharp drop in managed care enrollment in November 2012, as UnitedHealthcare pulled out of the Southeast BadgerCare+ region.
Jul-13 Aug-13 Sep-13 Oct-13 Nov-13 Dec-13
BadgerCare+ 667,523 669,035 664,827 663,165 663,094 660,048
SSI 33,580 33,558 33,674 33,632 33,767 33,777
LTC 41,072 41,196 41,305 41,397 41,432 41,342
Total Wisconsin 742,175 743,789 739,806 738,194 738,293 735,167
+/- m/m (3,037) 1,614 (3,983) (1,612) 99 (3,126)
% y/y 0.2% 2.2% 2.2% 2.5% 27.8% 25.0%
Health Management Associates also collects monthly enrollment data for the health plans in these 20 states. For more information, contact Andrew Fairgrieve at: [email protected]
Page 10
January 22, 2014
Arizona Arizona Medicaid Repeal Legislation Introduced with Few Prospects. On January 16, 2014, Rep. Adam Kwasman introduced legislation to repeal Arizona’s Medicaid expansion. The legislature’s political party mix has not changed much since the divi-sive 2013 vote and a key Republican supporter of the expansion, Rep. Ethan Orr, sees little likelihood of the bill passing. Read more.
Arizona Residents Go for Gold and Platinum Plans. According to the HHS report from January 13, 2014, Arizona residents are opting for gold- and platinum-level health plans offered on its exchange at twice the rate of the national average. While those two tiers represent the choice of about 20 percent of enrollees nationwide, Ari-zona residents chose these top two tiers about 41 percent of the time. Enroll America representatives noted that the state has an active marketplace, with more than 100 plans to choose from, and feature some of the lowest premiums in the country. Read more.
Arkansas GOP State Senate Special Election Win Could Hurt “Private Option.” On January 14, 2014, a previously Democratic state Senate seat flipped Republican with John Cooper’s victory, denying a critical vote for continuing the “private option” Medi-caid expansion passed last year. The private option requires a three-quarters majori-ty vote in each chamber of the legislature and the election results complicate the ef-fort for the coming year. Read more.
No Backup Plan if Private Option Funding is Blocked. In a January 22, 2014 hear-ing, Department of Human Services (DHS) Director John Selig admitted that he had no contingency plan for the department’s budget should funding for the private op-tion Medicaid expansion not be renewed. With John Cooper’s victory in a special election and a prior year GOP private option supporter—Sen. Missy Irvin—having changed her mind about the plan, there is an increasing likelihood of a Senate vote falling short of the necessary three-quarters threshold. Read more.
California HMA Roundup—Alana Ketchel
California Enrolls Over a Half-Million in Exchange. On January 21, 2014, Covered California announced that 500,108 Californians enrolled and selected health plans under the Affordable Care Act through the end of 2013. Through January 15, 2014,

Page 11
January 22, 2014
enrollment grew to more than 625,000. The exchange also reported that 584,000 ap-plicants were determined likely eligible for Medi-Cal coverage, and the Department of Health Care Services transitioned 630,000 individuals into Medi-Cal from the state’s Low Income Health Program through the end of last year. Read more.
Confusion Surrounds Dual Eligibles’ Transition to Managed Care. On January 15, 2015, UCLA researchers released a study revealing that dual eligible adults are often confused or concerned about how the upcoming transition to managed care will af-fect their health care. Under California’s dual eligible demonstration program, Cal MediConnect, more than 450,000 adults who qualify for both Medicaid and Medi-care in eight California counties will shift from fee for service to managed care start-ing April 2014. The study recommended the use of tailored communication efforts, such as patient navigators, to reach the most vulnerable adults in the program and ensure they do not experience gaps in care. Read more.
Medi-Cal to Make Improvements in Drug Rehabilitation Program. According to a January 16, 2014 report by the Center for Investigative Reporting, Medi-Cal is poised to make changes to the administration of the Drug Medi-Cal (DMC) Treatment Pro-gram after an audit last year revealed issues with program integrity. The Director of the Medi-Cal agency submitted a report to the state legislature last week detailing new efforts to identify and fight fraud in the system. For example, the state plans are requesting a waiver to operate the DMC as an organized delivery system, allowing for more control over provider selection. The Governor’s proposed 2014 budget in-cludes $2.2 million to support the overhaul of the DMC program. Read more.
Some Insurers Push Back Deadline for Exchange Premium Payment. On January 14, two Covered California insurers announced they were moving the deadline for consumers to pay their first month’s premium. Anthem Blue Cross moved the date to January 31 while Kaiser Permanente set the deadline at January 22. The remaining plans kept the original deadline of January 15. Plans are experiencing processing de-lays and consumers are reporting difficulty contacting the plans to confirm pay-ment. Read more.
Cal MediConnect Ombudsman Program RFP Released. On January 13 the De-partment of Managed Health Care released a Request for Proposals seeking entities to provide services to enrollees in the dual eligible demonstration program, Cal MediConnect. The Ombudsman Service Providers (OSPs) would resolve issues with the managed care plans in which dual eligible consumers are enrolled, offering ad-vocacy and investigation into complaints. Community-based organizations are wel-come to submit a response to the RFP by January 28, 2014. Link to RFP.
Report Shows Poor Emergency Room Access in California. The American College of Emergency Physicians awarded California an “F” for its inadequate emergency room (ER) access in a January 16 report card. The report found the state has the low-est number of hospital emergency rooms per capita in the nation. The average wait time for patients that were admitted to the hospital after an ER visit was five and a half hours from the time they arrived in the ER to the time they left. The report also noted a shortage of inpatient and psychiatric beds in hospitals which contributed to ER overcrowding. Read more.

Page 12
January 22, 2014
Colorado HMA Roundup—Joan Henneberry
Health Exchange Enrolls 63,000 for Private Health Coverage. On January 17, 2014, Connect for Health Colorado and the Colorado Department of Health Care Policy and Financing reported that 63,407 Coloradans signed up or were approved for 2014 private health coverage through January 15, 2014. Over the same time frame, 101,730 Coloradans signed up for Medicaid coverage. Susan Birch, Executive Director of the Colorado Department of Health Care Policy and Financing noted that Colorado is among the few states offering real-time eligibility determinations for Medicaid, al-lowing for faster enrollments. Read more.
Connecticut Connecticut Health Exchange Exceeds 86,000 Enrollees. On January 16, 2014, Ac-cess Health CT CEO Kevin Counihan said that the state’s health exchange had en-rolled 86,000 residents into private plans (about 52 percent) and Medicaid (about 49 percent) since the start of October, on track to exceeding a goal of 100,000 total enrol-lees by March 31, 2014. Read more.
Connecticut Evaluating the Licensing of its Exchange Software to Other States. In a January 10, 2014 interview, Kevin Counihan, CEO of Connecticut’s Access Health CT told AIS Health that the state was evaluating the licensing of the state’s exchange software to other states. Access Health Exchange developed a “turnkey” software package, offering modules covering governance, operations, marketing and infor-mation technology. Read more.
Florida HMA Roundup – Gary Crayton and Elaine Peters
Certificate of Need Proposal Approved by House Committee. On January 15, 2014, Florida’s Health Innovation Subcommittee unanimously voted for House Bill 287, a bill that would repeal a 2001 moratorium on new nursing homes. The House spon-sor, Rep. Frank Artiles, hopes to keep the bill largely intact after stakeholder input before targeting a floor vote by March 2014. HB 287 and a companion Senate Bill, SB 268, would allow the Agency for Health Care Administration to authorize new con-struction or additional beds, which some tab at 5,000. The moratorium would oth-erwise be in place until either full statewide Medicaid managed care implementation or 2016, whichever comes first. Read more.
Florida Exchange December Enrollments are Second Highest in Nation. On Janu-ary 13, 2014, the US Department of Health and Human Services released a report noting that Florida had the second highest level of individuals who had selected a plan on its exchange through December 28, 2013, eclipsing even New York (158,030 vs. 156,902). California was the clear leader in the nation with 498,794 people who had selected a marketplace plan. Approximately 83 percent of Florida’s enrollees re-ceived financial assistance from the federal government, exceeding the national av-erage of 79 percent. Read more.
GOP Legislator Proposes Medicaid Expansion. Despite persistent GOP House op-position to Medicaid expansion, on January 21, 2014, State. Sen. Rene Garcia reintro-duced a proposal to tap enhanced Federal matching funds under Medicaid expan-
Page 13
January 22, 2014
sion. A similar bill won support last year in the Senate—when Gov. Rick Scott pub-licly supported the idea—but fell short in the House. Read more.
Georgia HMA Roundup – Mark Trail
Gov. Deal Introduces Amended FY14 and FY15 Budgets. On January 15, 2014, Gov. Nathan Deal introduced his Amended FY 2014 and FY 2015 budget recommenda-tions to the Legislature. The amended FY14 fiscal budget will be debated first by the House, then by the Senate, before the FY15 budget will be considered. Below, we summarize some of the key proposals from the Department of Community Health that relate to Medicaid and PeachCare for Kids (CHIP).
Amended Fiscal Year (AFY) 2014:
State funds are added to pay the DSH state share of for certain hospitals
Adjustments are made to reduce the overall projected need based on growth for the year
Reduction in funding to account for improved MMIS functioning related to physician injectable dosing
Increased funds to provide for inmates paroled to private nursing homes
Increased funds related to implementation of the ACA including payment of the health insurer fee
Transfer of funds from BHDD and DOJ to pay for movement of foster care children to CMOs
Increase funds for claims run-out on the foster children
Adjustments related to lose of tobacco funds
Account for increased revenue from the hospital provider fee
Fiscal Year (FY) 2015:
Increases funds based on the overall projected growth need for the year
Reduce state funds to account for increased FMAP (federal funds)
Reduction in funding to account for improved MMIS functioning related to physician injectable dosing
Reduce funds by using the PARIS system to match eligibility files with other systems
Increased funds to provide for inmates paroled to private nursing homes
Make adjustment to restore certain funds and capture the hospital provider fee, and hospital cost settlements
LTC: increase funds to pay for nursing home rate increases related to ‘fair rental value’ charges; increase rates for ALS and PSS in the CCSP and SOURCE program; and add 25 slots to the ICWP waiver
Increased funds related to implementation of the ACA including payment of the health insurer fee
Transfer of funds from BHDD and DOJ to pay for movement of foster care children to CMOs
Increase funds for claims run-out on the foster children
Replace lost tobacco settlement funds
The complete budget documents can be found here.
Georgia Hospitals Promote Medicaid Expansion to Prevent Rural Hospital Clos-ings. Although Georgia hospitals are pushing state officials to consider Medicaid
Page 14
January 22, 2014
expansion to prevent rural hospital closings, a key Republican legislator remains unconvinced. State Rep. Sharon Cooper, chair of the House Health and Human Ser-vices Committee, reiterated her opposition to expansion and pointedly asserted that “some of those rural hospitals…need to close.” The Hometown Health advocacy group, representing 50 rural hospitals across Georgia, warns that the closing of rural hospitals will lead to longer drive times, which will inevitably result in the deaths of patients. Read more.
Deal Considering State Options to Offset Loss of DSH Payments. Last week, Gov. Deal’s chief of staff, Chris Riley, indicated that the administration was evaluating state options, ranging from a one-time cash payment to a longer-term program that assists hospitals who serve a large number of uninsured patients to offset the reduc-tion in disproportionate share (DSH) payments from the federal government. Read more.
Medical Malpractice Reform Bill Unlikely to Pass in 2014. In a January 14, 2014 ar-ticle, Georgia Health News profiled State Sen. Brandon Beach’s two year effort to implement malpractice reform. The legislation would replace the current litigation system with an administrative one in which cases would be evaluated by a board of medical, legal, and business professionals rather than a jury. However, given the ab-breviated legislative session in 2014, observers do not expect SB 141 to get through committee for a floor vote. Read more.
Hawaii Hawaii Health Connector Enrollment Perks Up in December. The recently re-leased HHS report on exchange enrollment highlights that Hawaii is behind its orig-inal three-month target enrollment level (2,709 as of January 11 vs. the three month goal of 4,230). That said, the 2,709 enrollees was nearly quadruple the levels posted just a month prior, according to Hawaii Health Connector’s interim executive direc-tor, Tom Matsuda. In addition, total number of individuals applying for coverage in completed applications exceeded 17,000 during the first three months of open en-rollment, creating hope that the exchange could still meet its 10,000 individual en-rollment target by March 31, 2014. Read more.
Idaho Catastrophic Health Plan Costs to Rise 10.6 Percent in 2014. On January 16, 2014, Idaho lawmakers learned that the state could expect to pay nearly $38.5 million for its catastrophic medical care program, up 10.6 percent over 2013. Roger Christensen, chairman of the state Catastrophic Health Care Cost Program board, noted that the program does not pay for preventative care, only for catastrophic care, and does not draw down federal matching funds. Combined state and county costs of $52.7 mil-lion in 2013 fell slightly from the prior year with temporary federal subsidies, but the total still more than doubled from the 2002 figure of $25.3 million. This report brings into focus the governor’s opposition to Medicaid expansion, which could draw 100 percent federal funding for the newly eligible who might otherwise be covered under the catastrophic program. Read more. Crisis Centers Could Treat the Mentally Ill. On January 15, 2014, Idaho legislators considered a plan that would create three crisis centers to treat mentally ill people, whose behavior or conditions might otherwise result in ER visits or jail. Gov. C.L. “Butch” Otter highlighted the proposal as a more cost-effective means of addressing the needs of those with mental health or substance abuse issues. Otter has asked leg-islators to approve $5.1 million to fund the establishment and staffing of the facili-
Page 15
January 22, 2014
ties. Republicans are optimistic about the prospects for this proposal, although Democrats continue to support a more comprehensive Medicaid expansion as a pre-ferred alternative. Read more.
Illinois HMA Roundup – Andrew Fairgrieve
Cook County Hospital CEO Stepping Down. Cook County Health and Hospitals System (CCHHS) CEO Dr. Ramanathan Raju announced on January 21, 2014 that he would be stepping down from his position and accepting the position of President at the New York City Health and Hospitals Corp. CCHHS is expected to announce an interim CEO this week while conducting a search for a permanent replacement. Dr. Raju previously served as COO for the New York City Health and Hospitals Corp. until coming to CCHHS in 2011. Read more.
Illinois Releases Integrated Care Program “Scorecard” for Aetna, Centene. The Il-linois Department of Healthcare and Family Services (HFS) released its first HEDIS measures report for the state’s Integrated Care Program (ICP), which serves Medi-caid-only seniors and persons with disabilities (SPDs) in a capitated managed care model. The scorecard details both the pay-for-performance and non-pay-for-performance measures on which the plans were scored for calendar year 2012. Both Aetna BetterHealth and Centene’s IlliniCare showed improvement in most measures, but still failed to meet between 30 and 50 percent of their pay-for-performance measures. Link to Report.
Kansas KanCare Ready to Implement Medicaid Managed Care for I/DD Services on Feb-
ruary 1. Following an agreed-upon one-month delay in implementation and produc-tive dialogue with CMS, it appears that KanCare will take effect on February 1, 2014 to provide Medicaid managed care services to Kansans with intellectual or devel-opmental disabilities (I/DD). The final terms of the agreement are being completed, but the state plans a stakeholder listening session on January 22, 2014 that will dis-cuss the role of targeted case managers and the billing/administrative protections during the transition. Beneficiaries will receive written notification from the Kansas Department for Aging and Disability Services (KDADS). Read more.
Maine Maine Medicaid Expansion Prospects Pick Up. According to House Speaker Mark Eves, the outlook for a compromise bill to expand Medicaid in Maine is brighter in 2014. A number of provisions in L.D. 1578, a bill sponsored by Eves, were taken di-rectly from GOP amendments made in last year’s legislative session, including a sunset provision that would kick in when federal funding drops from 100 percent of the newly eligible population, a requirement for some enrollees to meet maximum allowable co-payments, and the creation of a “MaineCare Stabilization Fund” that would provide for Medicaid savings to fund future costs. The legislation is an effort to attract enough Republican support to override an expected veto from Gov. Paul LePage. Read more.

Page 16
January 22, 2014
Maryland Maryland Senate Approves Health Exchange Emergency Measures. On January 21, 2014, the Maryland Senate approved emergency measures that would offer health insurance to those residents who tried to enroll in a health plan on the state’s ex-change, but were thwarted by technological glitches. The House still needs to pass this legislation. The bill would enroll the affected parties in the state’s Health Insur-ance Program, a high risk pool for state residents. Read more.
Massachusetts HMA Roundup—Rob Buchanan
One Care Enrollment Update. On January 15, 2014, MassHealth issued a report on One Care enrollment activity effective January 1, 2014. MassHealth plans to publish enrollment reports on a monthly basis, around the middle of each month. Of the nearly 82,000 eligible individuals who received a One Care enrollment package in the fall, approximately 15,567 people (about 19 percent) chose to opt out, which pre-cludes future auto-assignments but does not prevent self-selection at any point. As of January 1, 2014, 9,506 enrollees consisted of 5,319 self-selection enrollments and 4,187 auto-assignments in Round 1 of the process. Total enrollment by plan is pre-sented in the table below:
One Care Health Plan Enrollment Commonwealth Care Alliance (CCA) 6,120
Fallon Total Care (FTC) 2,570
Network Health 816
Total Enrollment 9,506
Massachusetts Trails Other States in Enrolling Residents in Exchange Plans. De-spite a seven year headstart with the Massachusetts Health Connector, the state has faced withering criticism for a faulty transition to a state exchange under the Af-fordable Care Act. Some observers note a lack of urgency in fixing the exchange’s website, resulting in Massachusetts making the least progress of any state on its sign-up targets: just 5 percent of its 117,500 goal after three months. Massachusetts counters that enrollment targets had been overstated and enrollment figures do not reflect tens of thousands of people with temporary coverage under the Connector while it fixes the technology glitches. Read more.
Partners HealthCare Makes Case for South Shore Hospital Merger. Following a report from the Health Policy Commission that criticized the proposed Partners-South Shore Hospital merger last month for limiting competition, Partners HealthCare aggressively responded with an 89 page rebuttal that includes many let-ters of support from South Shore area leaders who support the deal. Partners chal-lenged the findings of increased costs, asserting that synergies and efficiencies in care would more than offset them. Partners further pushed back on allegations of market concentration and a failure to consider the joint efforts to expand behavioral health and primary care access in the community. The commission plans a final vote on the Partners/South Shore merger report at the next HPC meeting in February. Read more.
Page 17
January 22, 2014
Michigan HMA Roundup—Esther Reagan
Update on Medicaid Expansion in Michigan. In previous editions of the HMA Roundup, we have provided information about the Healthy Michigan Plan, an initi-ative to provide health care coverage to as many as 320,000 individuals in 2014. Af-ter much debate in the Michigan Legislature, the Plan – a Medicaid expansion initia-tive – was approved and signed into law in early September 2013 with implementa-tion targeted for April 1, 2014. The Plan will expand Medicaid coverage to 133 per-cent of the federal poverty level (FPL) and require income-based cost sharing from enrollees through premiums (which don’t apply if income is below 100 percent of FPL) and copayments. In addition to being income-based, the cost sharing may be reduced through compliance with healthy behaviors.
In early November 2013, the Michigan Department of Community Health (MDCH) submitted the first of two waiver applications required to implement the Healthy Michigan Plan to the Centers for Medicare & Medicaid Services (CMS). The waiver application was approved on December 30, 2013, paving the way for implementa-tion on April 1, 2014. MDCH expects to launch a media and statewide communica-tion plan in February or early March to raise public awareness of the Plan, educate and train staff tasked with the enrollment activity, and begin program enrollment by mid-March. Individuals currently enrolled in the state’s Adult Benefits Waiver (ABW) program – a total of 62,808 in January – will be transitioned into the Plan ef-fective April 1, 2014. These individuals are childless adults with monthly income well below 100 percent of the FPL.
Enrollment in the Healthy Michigan Plan will be processed in the same manner as for the current Medicaid population, using the state’s contracted enrollment broker “MICHIGAN ENROLLS”. There are currently 13 contracted managed care organiza-tions serving the Medicaid population with a combined enrollment of 1,254,490 members in January 2014. This is about two-thirds of the state’s current Medicaid population.
The Healthy Michigan Plan also provides that after 48 months of cumulative cover-age, enrollees will be given an option to purchase health insurance through the Marketplace/Exchange or remain in the Plan with higher cost sharing requirements. This aspect of the initiative will be submitted for federal approval in the second waiver application.
The waiver application and approval letter, as well as other pertinent information, are available on the MDCH website. Read more.
Mental Health and Wellness Commission Report Released. On February 20, 2013, Governor Rick Snyder issued Executive Order 2013-6 to create the Mental Health and Wellness Commission. The Commission was charged with addressing gaps in the delivery of mental health services and proposing new service models to strengthen the entire delivery spectrum of mental health services throughout the state. The six-member advisory board to the Michigan Department of Community Health (MDCH) was chaired by the Lieutenant Governor and required to issue a re-port of findings and recommendations by December 2013. Governor Snyder released the Commission’s report on January 21, 2014.
The report, Improving Quality of Life by Supporting Independence and Self-Determination, was the culmination of work group meetings and public hearings
Page 18
January 22, 2014
held over several months. It is important to note that the report addresses the issues facing persons with mental health issues, those with developmental disabilities, and those with substance use disorders. Five workgroups were created to address a wide variety of issues around these areas: 1) education, employment and veterans; 2) housing and independent living; 3) physical and mental health integration; 4) public safety and recipient rights; and 5) data collection and stigma reduction. The report includes 59 recommendations constructed around three overarching goals:
1. Advancing more opportunities for independence and self-determination for persons living with a mental illness, substance use disorder or developmen-tal disability.
2. Better access to high quality, coordinated and consistent service and care be-tween agencies, service providers and across geographical boundaries.
3. Measuring outcomes and establishing meaningful metrics to evaluate the ef-fectiveness of services provided and to assess the progress of goals set by the individual, state, local agencies and service providers.
The Commission hopes that the report would provide first steps in a long-term road map of actionable recommendations to policy makers and stakeholders designed to achieve the stated overarching goals. Read more.
State of the State Address Highlights Fiscal Improvement and Funding for In-
Home Services to Seniors. On January 9, 2014, Michigan Governor Rick Snyder de-livered his fourth State of the State address to a joint session of the Michigan Legisla-ture. The speech differed a bit from those in prior years with greater focus upon Michigan’s recent accomplishments and less discussion of proposals for the 2014 legislative session. Governor Snyder did address the following issues in his remarks:
State Tax Changes: In light of the positive 2014 revenue forecasts (nearly $1.0 billion in unanticipated revenue), the Governor noted his support for some sort of tax relief in the upcoming fiscal year for Michigan residents. There was no discussion of the structure of this proposal but that it should be targeted to low and moderate income residents.
In-Home Service to Senior Citizens: The Governor proposed increasing funding for in-home services to seniors (including home-delivered meals) to eliminate the current waiting list. Some seniors wait six months or longer before accessing these services.
Mental Health and Wellness Commission: The Governor noted the work of the State’s Mental Health and Wellness Commission and urged implemen-tation of the Commission’s recommendations once they are finalized and released. (The recommendations have now been released – see related arti-cle.)
Additional Proposals: The Governor detailed his support for additional funding to expanding early childhood education through the Great Start Readiness Program, the provision of funding to districts interested in estab-lishing full-year schools and once again noted the need for additional fund-ing to maintain the state’s transportation infrastructure.
Read more.
Page 19
January 22, 2014
Missouri Medicaid Overhaul Plan Filed. On January 16, 2014, Sen. Gary Romaine introduced legislation (S.B. 739) that would implement many of the recommendations of last year’s Medicaid study panel, which aims to reform the health program without ex-panding eligibility. MO HealthNet would be required to implement a statewide Medicaid managed care model starting in 2015. Medicaid plans would need to have incentives in place to reduce costs and reward healthier behavior. High deductible plans and health savings accounts are contemplated under the proposal. Seniors and the disabled would be excluded from the managed care mandate, covered instead by accountable care organizations (ACOs). Read more.
Nebraska
Nebraska Medicaid Expansion Bill Unveiled. On January 14, 2014, State Sen. Kathy Campbell introduced L.B. 887 in the unicameral state legislature to implement the “Wellness in Nebraska (WIN) Act”. Under the proposal, Nebraska would expand Medicaid coverage to more than 50,000 newly eligible residents, with premiums for beneficiaries making 50 to 100 percent of federal poverty level income of as much as 2 percent of their income. The legislation contemplates waiving the premiums for those that participated in wellness programs and health assessments. Gov. Dave Heineman has stated that Medicaid expansion is not fiscally prudent. Read more.
New Jersey HMA Roundup – Karen Brodsky
Federal Marketplace Activities Update. At the end of December 2013, 34,751 New Jersey residents made plan selections available through the federal marketplace (ex-change). This is a notable increase from one month earlier when just 3,259 residents had enrolled in a marketplace plan. An additional 71,142 people who applied under the marketplace were found to be eligible for the state’s Medicaid program. Of the 34,751, 79% received financial assistance and the remaining are paying full premi-um, which is similar to the national experience. Three health plans are available through the NJ marketplace: 1) AmeriHealth New Jersey, 2) Health Republic Insur-ance of New Jersey, and 3) Horizon Blue Cross Blue Shield. New Jersey projections for total marketplace enrollment as a result of the Affordable Care Act are 362,000.
Medicaid Eligibles to Receive Retroactive Coverage. New Jersey residents who applied for health care coverage through the federal exchange and learned that they were eligible for the state’s Medicaid program will receive coverage under Medicaid retroactive to January 1, 2014. The federal website sent incorrectly formatted data to New Jersey’s NJ FamilyCare program, which caused a delay in processing their en-rollments in time for the January 1st effective date. Federal and state officials worked quickly to resolve the system issue and process enrollments. This problem did not affect individuals who applied and were found eligible for Medicaid through the state.
New Jersey’s Camden Coalition Takes Hot-Spotting Across the State. The Camden Coalition of Healthcare Providers (CCHP) plans to work with other groups or hospi-tals in New Jersey to develop “hot-spotting” tools to improve patient care as part of a project sponsored by the Nicholson Foundation. The Coalition uses health care da-ta to track and study high utilizers of emergency rooms and inpatient care. Hot-spot maps help providers identify where there are larger concentrations of patients with

Page 20
January 22, 2014
certain chronic conditions. Through their work with CCHP, these providers will begin targeting neighborhoods for interventions. CCHP is accepting letters of intent until February 10, 2014 from interested communities, with MOUs signed by May 5, 2014. Letters of intent should include: 1) a list of the key internal stakeholders to be included in the project, and identification of a senior project manager responsible for obtaining the hospital claims data for their community hospitals; 2) an assessment of the participating community’s ability to obtain this data from hospitals and other providers; and 3) key external stakeholders such as other community groups, pro-viders, and others who can support the project. Additional information about this opportunity is available from the New Jersey Health Care Quality Institute’s Affili-ated Accountable Care Organizations group at (609) 303-0373. A webinar presented in a joint meeting of NJHCQI and CCHP on January 9, 2014 about this opportunity can be found on NJHCQI’s here.
New York HMA Roundup—Denise Soffel
FIDA Enrollment Delay Announced. On January 16, 2014, the New York State De-partment of Health announced that CMS and the State agreed to an adjustment in the enrollment timeline for FIDA. The voluntary enrollment period for both the community-based and nursing home populations will start 10/1/14, and the passive period for both populations will start 1/1/15. The state will release a new timeline by January 31, 2014 for all the deliverables and will host a webinar or conference call in early February to review the revised schedule. Read more.
Governor Cuomo’s Executive Budget Proposal. Governor Andrew Cuomo present-ed his $142.1 billion executive budget on January 21, 2014. This represents a 1.3 per-cent increase over the current budget, and includes tax reductions in property, busi-ness and estate taxes. Total Medicaid spending, including federal, state and local share, is projected at $58.2 billion. The global Medicaid spending cap, which affects about 28 percent of total Medicaid spending, will increase by 3.8 percent, reflecting the 10 year rolling average increase in the Medical CPI. The programmatic direction for the Medicaid program was established by the Medicaid Redesign Team, which began its work in January 2011. New initiatives that result from the MRT include the integration of behavioral health into Medicaid managed care and the establishment of a Medicaid managed care product designed for individuals with serious mental illness (Health and Recovery Plans); increased funding for affordable housing, in-cluding rent subsidies; expanding the health home program; and strengthening re-gional health planning and health technology initiatives across the state.
In his budget address Governor Cuomo reiterated the urgency of federal approval for the $10 billion Medicaid waiver the state initially requested in August 2012. He said that hospitals across the state, including three hospitals in Brooklyn, are at risk of closing without federal support. His budget identifies three areas of investment.
Expanding the availability of capital through a $1.2 billion in capital grants
for mergers, closures, restructuring and infrastructure improvements. The
budget also proposes a demonstration program that would allow health
care institutions access to private equity investments. Last year’s budget in-
cluded a 2-site demonstration, which was rejected by the legislature; this
year’s budget proposes up to five pilots be allowed.

Page 21
January 22, 2014
Establishing Regional Health Improvement Collaboratives (RHICs) to func-
tion as conveners of health care stakeholders to identify local challenges and
develop solutions.
Improving HIT through the State Health Information Network, developing
a statewide electronic medical record, and funding the All Payer Claims Da-
tabase.
Nursing Home Quality Pool Scores Released. Last week New York State released the results of its Nursing Home Quality Pool scores. The NHQP is a $50 million pool, financed through contributions of eligible nursing homes that is the redistrib-uted based on performance. The NHQP score is comprised of fourteen quality per-formance measures, three compliance measures, and one efficiency measure. The Department assessed each nursing home on their performance in all areas of the NHQP as compared to their peers. Determinations of fraud or abuse by the Attorney General’s office or specific deficiencies cited during the survey process were also in-corporated into the results. Nursing homes with scores in the top quintile receive 50 percent of the $50 million pool. Those with scores in the second or third quintile also receive awards, but at a smaller percentage. Facilities in the bottom two quintiles are not eligible for any award. Facilities that had deficiencies indicating actual harm that poses immediate jeopardy to resident health or safety are not eligible for awards, re-gardless of their score. Forty-one facilities were excluded from the pool due to defi-ciencies. Similarly, facilities that have had a determination of fraud or abuse by the Attorney General are not eligible for quality pool awards. Thirty-six facilities were excluded due to fraud or abuse. The NHQP was established in the 2011 budget; 2013 is the first year that facilities have been scored. The NHQP is pending CMS state plan amendment approval, and so distribution of the awards has not yet occurred and is dependent on federal approval. Read more.
Managed Long-Term Care Timeline Released. Last week the Department of Health released its proposed transition timeline for implementing mandatory managed long term care for Medicaid beneficiaries requiring more than 120 days of communi-ty-based long-term care. The proposed timeline would result in the mandatory pro-gram in every county by the end of 2014. The mandatory program began in Septem-ber 2012 in New York City, and has been expanded to an additional 10 counties; it now affects 85 percent of the Medicaid population statewide. CMS approval is re-quired for any additional expansion. CMS approval is contingent upon demonstrat-ing network adequacy in a given county. The proposed timeline is below.
Date Counties
April 1, 2014 Columbia, Putnam, Sullivan, Ulster
May 1, 2014 Rensselaer, Cayuga, Herkimer, Oneida
June 1, 2014 Greene, Schenectady, Washington, Saratoga
July 1, 2014 Dutchess, Montgomery, Broome, Fulton, Madison, Schoharie, Oswego
August 1, 2014 Warren, Delaware, Niagara, Otsego, Chenango
September 1, 2014 Essex, Clinton, Franklin, Hamilton
October 1, 2014 Jefferson, Lewis, St. Lawrence, Steuben, Chautauqua, Cattaraugus, Alleghany
November 1, 2014 Yates, Seneca, Schuyler, Tioga, Cortland, Chemung
December 1, 2014 Genesee, Ontario, Livingston, Orleans, Tompkins, Wayne, Wyo-ming
Page 22
January 22, 2014
Exchange Reports 12 Percent Enrollment Growth in a Week. On January 20, 2014, Donna Frescatore, executive director of NY State of Health, reported that health plan enrollment through the state's health marketplace continues to climb. NY State of Health, the state-run online insurance market, has seen enrollment increase to 328,796, a 12 percent increase from the previous week. The mix of enrollees from the exchange is approximately two-thirds in private plans (222,011) and one-third in Medicaid (106,785).
Key Health Appointments in NYC. Mayor DeBlasio announced two key appoint-ments this past week. Dr. Mary Bassett was named as Commissioner of the Depart-ment of Health and Mental Hygiene, and Dr. Ramanathan Raju was named Presi-dent of the New York City Health and Hospitals Corporation (HHC), the public benefit corporation that operates the city’s public hospital system.
Dr. Bassett had previously worked at the Department as Deputy Commissioner of Health Promotion and Disease Prevention, where she oversaw campaigns banning smoking and trans fats in restaurants, and requiring restaurants to post calorie counts. Most recently she served as Program Director for the African Health Initia-tive and the Child Abuse Prevention Program at the Doris Duke Charitable Founda-tion, focusing on strengthening health systems in projects in Ghana, Mozambique, Rwanda, Tanzania, and Zambia.
Dr. Raju is currently the C.E.O. of Chicago's Cook County Health and Hospital's sys-tem, the third-largest system in the nation. He previously served as the COO and Chief Medical Officer at Coney Island Hospital, and then as Chief Medical Officer, Corporate COO and Executive Vice President at HHC.
North Carolina NC Medical Community Argues Against Broad-Based Managed Care Overhaul.
In a public hearing on January 15, 2014, the North Carolina Medical Society and North Carolina Hospital Association forcefully argued against a comprehensive state-wide managed care overhaul proposal as previously outlined by Governor Pat McCrory. The Department of Health and Human Services will introduce its own plan in mid-March, with legislative reviews and hearings later in the spring. Read more.
Providers Sue Over MMIS Rollout. On January 17, 2014, the Charlotte Observer published an article highlighting the ongoing difficulties North Carolina providers are enduring with the implementation of the state’s Medicaid Management Infor-mation System, dubbed NC Tracks. On January 16, 2014, seven medical practices filed a lawsuit against the North Carolina DHHS, Computer Sciences Corporation, and other consulting entities over damages from delayed claims, rejected claims for vital medical interventions, and cash flow shortfalls resulting from technology de-fects. Read more.
Oregon Cover Oregon Evaluates Options to Fix Its Exchange Website. On January 15, 2014, Cover Oregon’s interim director Dr. Bruce Goldberg told state legislators that the exchange could potentially abandon its current systems vendor and seek the tech-nology and infrastructure from a state exchange that is functioning well or from the federal exchange. The Oregon Health Authority and Cover Oregon have split the $3.3 million in additional costs to hire 400 people to manually process health plan applications. Read more.
Page 23
January 22, 2014
Pennsylvania HMA Roundup –Matt Roan
County Commissioners Push for restoration of Human Services Funding. The Pennsylvania County Commissioners Association called upon Governor Corbett to restore a 10 percent cut to Human Services funding to counties in the upcoming state budget. Human Services funding which supports a wide array of programs in-cluding child welfare programs, mental health services and drug and alcohol treat-ment was reduced by $86M last year as the Corbett Administration implemented a new block grant program that provided additional flexibility to counties. Now, county commissioners are claiming that while the additional flexibility has led to some efficiency, the decreased funding levels threaten the sustainability of county programs. The Governor will be introducing his proposed budget for SFY 14-15 in an address to the State Legislature on February 4th. Read more.
Emergency Room Physicians Concerned over Psychiatric Bed Shortage. A nation-wide evaluation of the quality of emergency care conducted by the American Col-lege of Emergency Physicians ranked Pennsylvania sixth in the nation in terms of access and quality of emergency room care. Despite the strong rankings, the report highlighted problems transferring patients who need psychiatric care to appropriate psychiatric facilities. Pennsylvania emergency room doctors complain that it can take several hours or more to find an available bed for patients with psychiatric needs. The Office of Mental Health and Substance Abuse Services has said that there is no shortage of inpatient psychiatric beds. Physicians content that if there is indeed no shortage, a better system needs to be implemented to help hospital emergency departments identify available beds in psychiatric units. Read more.
Pittsburgh Area Out-performs Nation in Delivery of Hospice Care. A survey con-ducted by the University of Pittsburgh has found that 53 percent of Pittsburgh area residents who died between 2009 and 2010 received hospice care compared to na-tional hospice utilization rates in the same period of 42 percent. Family and caregiv-ers of patients receiving hospice care rate the quality of care higher than family and caregivers who die in hospital or nursing home settings. Hospice and palliative care are key components to improving the quality and high costs of end of life care. Read more.
Rhode Island Rhode Island’s $43 Million Medicaid Cuts Hits Providers. A January 16, 2014 arti-cle by the Providence Journal highlights the irony of Rhode Island, which eagerly supported Medicaid expansion, simultaneously implementing $43 million in Medi-caid cuts to providers in FY14-15. Linda Katz, co-founder and policy director of the Economic Progress Institute, wondered how equipped hospitals and nursing homes were to absorb rate cuts, following years of freezes and slow growth. The biggest source of savings, amounting to $10.8 million in state money, comes from limiting rate increases to Neighborhood Health Care of Rhode Island and UnitedHealthcare of New England to 2.9 percent. Read more.

Page 24
January 22, 2014
Tennessee BCBS of TN Garners 86 Percent Market Share on the Tennessee Exchange. Com-bining data from a January 13, 2014 HHS report and recent data from BlueCross BlueShield of Tennessee, it appears that the plan has enrolled nearly 86 percent of all Tennesseans who signed up for plans on the state’s federally facilitated exchange. Of the 36,250 enrollees through December 28, 2013, there were 31,316 Tennesseans who enrolled in BlueCross marketplace plans. About half of new BCBST enrollees from the exchange opted for the Network E plan, the low-cost option for consumers. Read more.
Virginia Virginia Mental Health Advocates Push for Reform. On January 20, 2014, the Washington Post published an article focused on the efforts of the mental health ad-vocacy community who gathered at the General Assembly building to push for mental health reforms that would improve the services for the seriously mentally ill, who may represent a danger to themselves or the community. Representative Robert B. Bell is supporting legislation that would mandate that state hospitals provide “a bed of last resort.” Read more.
Washington HMA Roundup – Doug Porter
Governor Inslee’s Mental Health Proposal Unveiled. On January 20, 2014, Gover-nor Jay Inslee introduced his mental health proposal to the Legislature to align men-tal health care with drug treatments. Inslee wants joint bidding for mental-health and drug treatment, with $2 million budgeted for that effort. Over time, Inslee hopes to align these services with primary medical care. However, the bill does not pro-vide for private insurers bidding against counties for these services, contrary to Inslee’s original response to CMS’ mandate that the state change the way it pays for mental health services. Read more.
Wisconsin Walker Signs Bill Delaying Changes in BadgerCare Eligibility. On January 16, 2014, Governor Scott Walker signed a bill that effectuates a three-month delay (to April 1, 2014) in changes to the BadgerCare program that would have pushed 77,000 people above 100 percent of federal poverty income levels onto the federally facili-tated health exchange. It also delays by three months the expansion of the Badger-Care program to 83,000 childless adults. Read more.
Wyoming Medicaid Expansion Push May Take Some Time in Wyoming. Wyoming Public Media published a January 14, 2014 article that acknowledged two bills that recom-mended Medicaid expansion for Wyoming residents. However, few expect the bills to get far in the current legislative session due to an overriding skepticism among Republicans that the Federal Government will live up to its funding commitments. Read more.

Page 25
January 22, 2014
UnitedHealthcare Announces 2013 Financial Results. UnitedHealthcare announced fourth quarter and year end results for 2013 on January 17, 2014. United reported $122.5 billion in 2013 revenue, up 11 percent from the prior year. In its Medicaid business, United reports it expanded its Medicaid services to 205,000 more people in 2013 and now serves more than 4 million beneficiaries nationwide. United high-lighted reprocurements in Tennessee and Hawaii, as well as approval to serve the Michigan duals market and an approve expansion in southeastern Wisconsin. Read more.
Cahill Group of Chicago Acquires Rosewood, St. Louis-Based Nursing Home
Group. The Cahill Group of Chicago announced on January 15, 2014 that is has ac-quired Rosewood and its 14 nursing homes in Illinois and Missouri for $250 million. The company has been rebranded as Cahill Rosewood. Read more.
Gateway Health names CEO. Pittsburgh-based Gateway Health announced Patricia J. Darnley as the health plans new President and CEO last week. Ms. Darnley previ-ously served as senior vice president of network development and operations for Centene. Gateway’s previous CEO, Michael Blackwood, retired in September 2013. Read more.
Page 26
January 22, 2014
Date State Event Beneficiaries
January, 2014 Delaware RFP Release 200,000
January 22, 2014 Texas NorthSTAR (Behavioral) RFP Release 406,000
February 1, 2014 Florida LTC (Regions 5,6) Implementation 19,538
February 27, 2014 Georgia ABD Proposals Due 320,000
March 1, 2014 Florida LTC (Regions 1,3,4) Implementation 18,971
April 1, 2014 California Duals Passive enrollment begins 456,000
April 1, 2014 Ohio Duals Passive enrollment begins 115,000
April 17, 2014 Texas NorthSTAR (Behavioral) Proposals due 406,000
May 1, 2014 Virginia Duals Passive enrollment begins 79,000
May 1, 2014 Florida acute care (Regions 2,3,4) Implementation 681,100
June 1, 2014 Illinois Duals Passive enrollment begins 136,000
June 1, 2014 Florida acute care (Regions 5,6,8) Implementation 811,370
June 30, 2014 Delaware Contract awards 200,000
July 1, 2014 Florida acute care (Regions 10,11) Implementation 828,490
July 1, 2014 South Carolina Duals Passive enrollment begins 68,000
July 1, 2014 Michigan Duals Implementation 70,000
July 7, 2014 Texas NorthSTAR (Behavioral) Contract Awards 406,000
August 1, 2014 Florida acute care (Regions 1,7,9) Implementation 750,200
September 1, 2014 New York Duals Passive enrollment begins 178,000
September 1, 2014 Washington Duals Passive enrollment begins 48,500
September 1, 2014 Texas Rural STAR+PLUS Implementation 110,000
November 3, 2014 Georgia ABD Implementation 320,000
January 1, 2015 Hawaii Implementation 292,000
January 1, 2015 Tennessee Implementation 1,200,000
September 1, 2015 Texas NorthSTAR (Behavioral) Implementation 406,000
RFP CALENDAR
Page 27
January 22, 2014
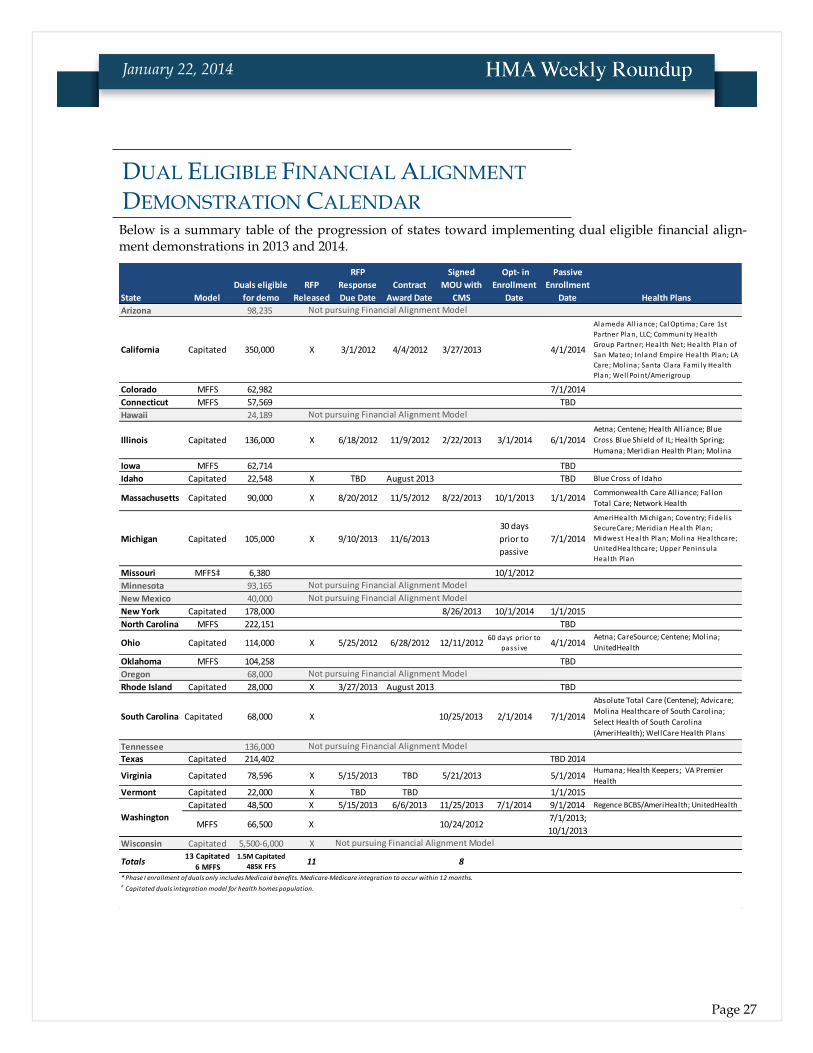
Below is a summary table of the progression of states toward implementing dual eligible financial align-ment demonstrations in 2013 and 2014.
State Model
Duals eligible
for demo
RFP
Released
RFP
Response
Due Date
Contract
Award Date
Signed
MOU with
CMS
Opt- in
Enrollment
Date
Passive
Enrollment
Date
Arizona 98,235
California Capitated 350,000 X 3/1/2012 4/4/2012 3/27/2013 4/1/2014
Colorado MFFS 62,982 7/1/2014
Connecticut MFFS 57,569 TBD
Hawaii 24,189
Illinois Capitated 136,000 X 6/18/2012 11/9/2012 2/22/2013 3/1/2014 6/1/2014
Iowa MFFS 62,714 TBD
Idaho Capitated 22,548 X TBD August 2013 TBD
Massachusetts Capitated 90,000 X 8/20/2012 11/5/2012 8/22/2013 10/1/2013 1/1/2014
Michigan Capitated 105,000 X 9/10/2013 11/6/2013
30 days
prior to
passive
7/1/2014
Missouri MFFS‡ 6,380 10/1/2012
Minnesota 93,165
New Mexico 40,000
New York Capitated 178,000 8/26/2013 10/1/2014 1/1/2015
North Carolina MFFS 222,151 TBD
Ohio Capitated 114,000 X 5/25/2012 6/28/2012 12/11/201260 days prior to
pass ive4/1/2014
Oklahoma MFFS 104,258 TBD
Oregon 68,000
Rhode Island Capitated 28,000 X 3/27/2013 August 2013 TBD
South Carolina Capitated 68,000 X 10/25/2013 2/1/2014 7/1/2014
Tennessee 136,000
Texas Capitated 214,402 TBD 2014
Virginia Capitated 78,596 X 5/15/2013 TBD 5/21/2013 5/1/2014
Vermont Capitated 22,000 X TBD TBD 1/1/2015
Capitated 48,500 X 5/15/2013 6/6/2013 11/25/2013 7/1/2014 9/1/2014
MFFS 66,500 X 10/24/20127/1/2013;
10/1/2013
Wisconsin Capitated 5,500-6,000 X
Totals13 Capitated
6 MFFS
1.5M Capitated
485K FFS11 8
* Phase I enrollment of duals only includes Medicaid benefits. Medicare-Medicare integration to occur within 12 months.‡ Capitated duals integration model for health homes population.
Not pursuing Financial Alignment Model
Not pursuing Financial Alignment Model
Not pursuing Financial Alignment Model
Not pursuing Financial Alignment Model
Not pursuing Financial Alignment Model
Not pursuing Financial Alignment Model
Not pursuing Financial Alignment Model
Washington
Humana; Health Keepers; VA Premier
Health
Regence BCBS/AmeriHealth; UnitedHealth
Health Plans
Alameda Al l iance; Ca lOptima; Care 1st
Partner Plan, LLC; Community Health
Group Partner; Health Net; Health Plan of
San Mateo; Inland Empire Health Plan; LA
Care; Mol ina; Santa Clara Fami ly Health
Plan; Wel lPoint/Amerigroup
Aetna; Centene; Health Alliance; Blue
Cross Blue Shield of IL; Health Spring;
Humana; Meridian Health Plan; Molina
Blue Cross of Idaho
Aetna; CareSource; Centene; Molina;
UnitedHealth
Commonwealth Care Alliance; Fallon
Total Care; Network Health
Absolute Total Care (Centene); Advicare;
Molina Healthcare of South Carolina;
Select Health of South Carolina
(AmeriHealth); WellCare Health Plans
AmeriHealth Michigan; Coventry; Fidel i s
SecureCare; Meridian Health Plan;
Midwest Health Plan; Mol ina Healthcare;
UnitedHealthcare; Upper Peninsula
Health Plan
DUAL ELIGIBLE FINANCIAL ALIGNMENT
DEMONSTRATION CALENDAR

Page 28
January 22, 2014
HMA Teams to Assist New ACO Awardees
In late December 2013, CMS announced approval for 123 new Accountable Care Organizations (ACOs) to participate in the Medicare Shared Savings Program, providing approximately 1.5 million more Medicare beneficiaries with access to high-quality coordinated care across the United States. (Link to Announcement).
In response to the CMS announcement, HMA has formed teams of professionals—including clinicians, former state and federal health care administrators, and ex-perts in managed care, provider models, finance, and Health Information Tech-nology—who have extensive experience working with Medicare ACOs and other provider organizations navigating changes from volume-based to value-based care. For more information on the services that HMA can provide, please visit HMA’s Accountable Care Institute at www.accountablecareinstitute.com.
For direct questions, please contact Meghan Kirkpatrick: [email protected]
Health Management Associates (HMA) is an independent health care research and consulting firm.
Among other services, HMA provides generalized information, analysis, and business consultation services to investment professionals; however, HMA is not a registered broker-dealer or investment adviser firm. HMA does not provide advice as to the value of securities or the advisability of invest-ing in, purchasing, or selling particular securities. Research and analysis prepared by HMA on be-half of any particular client is independent of and not influenced by the interests of other clients.
HMA NEWS