january june 2015 interim report - smarter cargo flow …€“june 2015 interim report 21 july 2015...
TRANSCRIPT

January–June 2015 interim report
21 July 2015
Mika Vehviläinen, President and CEO
Eeva Sipilä, Executive Vice President, CFO

Highlights of the second quarter
Orders declined 11% y-o-y to EUR 887 (993) million due to MacGregor market situation
Order book strengthened 6% from 2014 year-end to EUR 2,342 million
Sales grew 16% y-o-y to EUR 936 (804) million
Operating profit excluding restructuring costs was EUR 58.0 (4.7) million or 6.2 (0.6)% of sales
Operating profit was EUR 54.9 (-6.0) million
Cash flow from operations strong at EUR 101.3 (24.4) million
Profit improvement programmes in Kalmar and Hiab completed ahead of schedule
21 Jul 2015 3
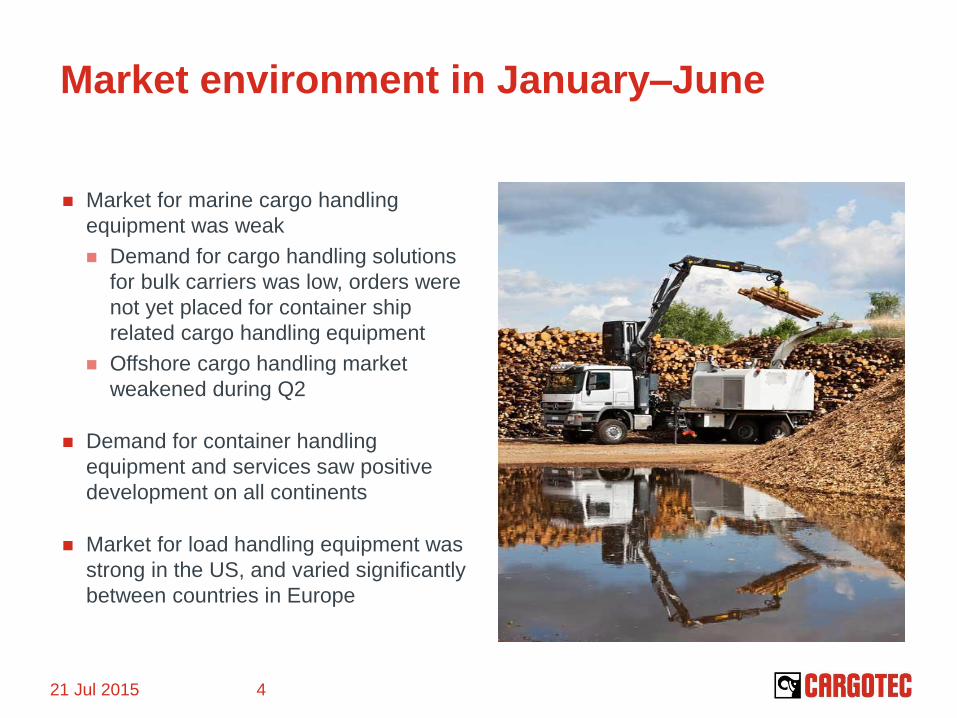
Market environment in January–June
Market for marine cargo handling
equipment was weak
Demand for cargo handling solutions
for bulk carriers was low, orders were
not yet placed for container ship
related cargo handling equipment
Offshore cargo handling market
weakened during Q2
Demand for container handling
equipment and services saw positive
development on all continents
Market for load handling equipment was
strong in the US, and varied significantly
between countries in Europe
21 Jul 2015 4

January–June key figures
21 Jul 2015 5
*excluding restructuring costs
4-6/15 4-6/14 Change 1-6/15 1-6/14 Change 2014
Orders received, MEUR 887 993 -11% 1,826 1,856 -2% 3,599
Order book, MEUR 2,342 2,285 2% 2,342 2,285 2% 2,200
Sales, MEUR 936 804 16% 1,825 1,555 17% 3,358
Operating profit, MEUR* 58.0 4.7 1138% 110.3 29.3 276% 149.3
Operating profit margin, %* 6.2 0.6 6.0 1.9 4.4
Cash flow from operations, MEUR 101.3 24.4 152.8 56.9 204.3
Interest-bearing net debt, MEUR 735 847 735 847 719
Earnings per share, EUR 0.43 -0.15 0.99 0.05 1.11

MacGregor Q2 – challenging market
situation
Order intake declined 35% y-o-y to EUR
220 (338) million
Order book decreased 2% from 2014 year-
end
Sales grew 18% y-o-y to EUR 308 (261)
million
Profitability excluding restructuring costs
was 4.1%
Restructuring costs EUR 2.9 million
Effectiveness and savings programmes
progressing as planned
New President will start in August
21 Jul 2015 6
338
220
261
308
5.7
4.1
0
2
4
6
8
10
0
100
200
300
400
Q2/14 Q3/14 Q4/14 Q1/15 Q2/15
Orders Sales Operating profit%*
MEUR %
*excluding restructuring costs

Kalmar Q2 – strong orders and sales
Order intake increased 14% y-o-y to
EUR 450 (394) million
Order book strengthened 18% from 2014
year-end
Sales grew 21% y-o-y to EUR 391 (323)
million
Profitability excluding restructuring costs
was 7.3%
Profit improvement programme
completed ahead of schedule
21 Jul 2015 7
394
450
323
391
-6.0
7.3
-8
-6
-4
-2
0
2
4
6
8
10
0
100
200
300
400
500
Q2/14 Q3/14 Q4/14 Q1/15 Q2/15
Orders Sales Operating profit%*
MEUR %
*excluding restructuring costs

Hiab Q2 – double digit operating profit
margin
Orders declined 15% y-o-y to EUR 221
(261) million
Comparison period included EUR 40
million demountable and load crane
order
Order book strengthened 12% from
2014 year-end
Sales grew 7% y-o-y to EUR 237 (221)
million
Profitability excluding restructuring
costs was 10.7%
Profit improvement programme
completed ahead schedule
21 Jul 2015 8
261
222 221
237
7.1
10.7
0
2
4
6
8
10
12
0
50
100
150
200
250
300
Q2/14 Q3/14 Q4/14 Q1/15 Q2/15
Orders Sales Operating profit%*
MEUR %
*excluding restructuring costs
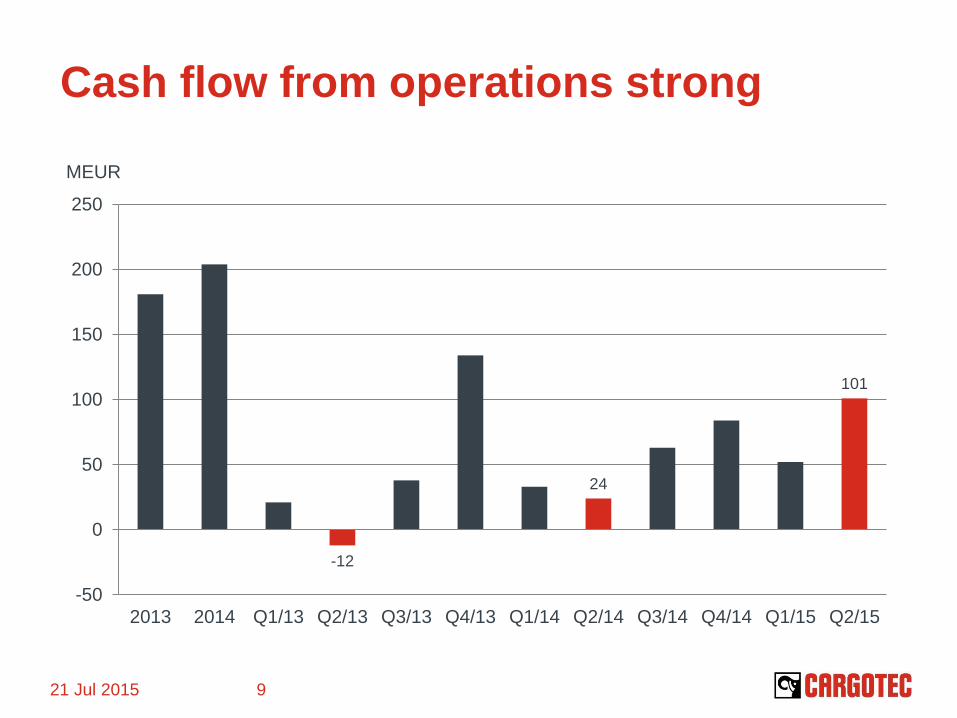
Cash flow from operations strong
21 Jul 2015 9
-12
24
101
-50
0
50
100
150
200
250
2013 2014 Q1/13 Q2/13 Q3/13 Q4/13 Q1/14 Q2/14 Q3/14 Q4/14 Q1/15 Q2/15
MEUR

More balanced geographical mix in sales
21 Jul 2015 10
25%
43%
32% 39%
32%
29%
MacGregor Kalmar Hiab Americas APAC EMEA
Equipment 80 (78)%
Services 20 (22)% Equipment 76 (77)%
Services 24 (23)%
Equipment 73 (70)%
Services 27 (30)%
Sales by reporting segment 1-6/2015, % Sales by geographical segment 1-6/2015, %
(46)
(29)
(25) (27)
(42)
(31)

Sales by geographical segment by
business area 1–6/2015
21 Jul 2015 11
MacGregor Kalmar Hiab
APAC 10% (11)
EMEA 29%
APAC 63 % (56)
Americas 8% (5)
APAC 21% (20)
EMEA 48%
Americas 42% (37) Americas 36% (32)
EMEA 43%
(39) (48) (52)
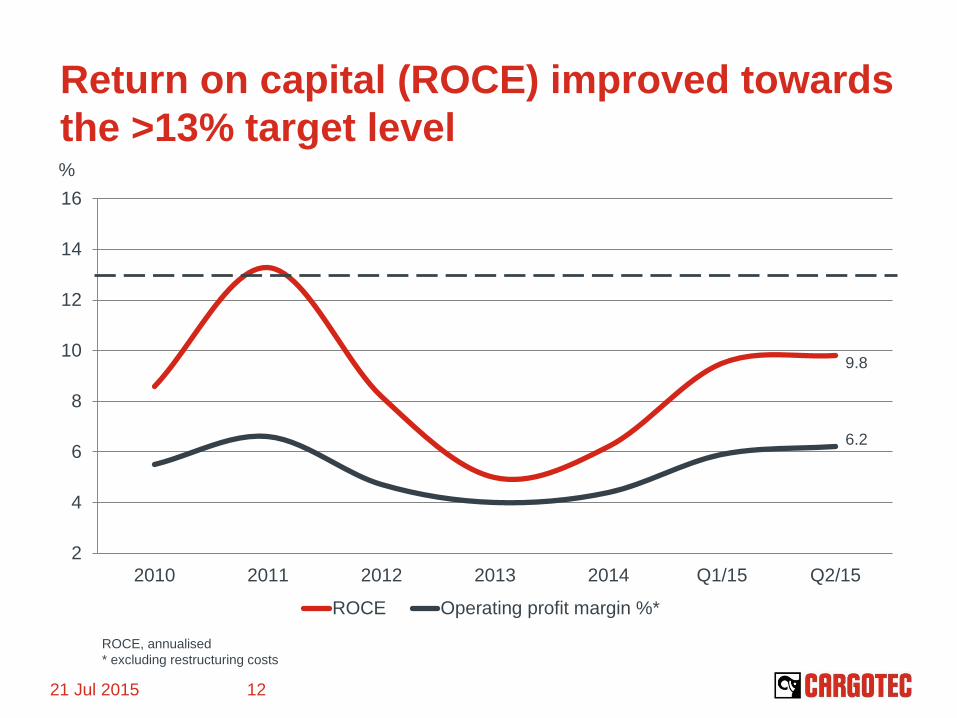
Return on capital (ROCE) improved towards
the >13% target level
9.8
6.2
2
4
6
8
10
12
14
16
2010 2011 2012 2013 2014 Q1/15 Q2/15
ROCE Operating profit margin %*
21 Jul 2015 12
%
ROCE, annualised
* excluding restructuring costs

Outlook unchanged
Cargotec’s 2015 sales are expected
to grow from 2014 (3,358 MEUR).
Operating profit excluding
restructuring costs for 2015 is
expected to improve from 2014 (149.3
MEUR).
21 Jul 2015 13
