january – september 2020
TRANSCRIPT

20
20
Interim ReportJ A NUA RY – SEP TEM B ER 2020

1 U PDATED I N FORMATION 6 I NTERIM M ANAGEMENT REPORT
26 BRAN DS AN D BUSI N ESS FI ELDS
29 I NTERIM CONSOLI DATED FI NANCIAL STATEMENTS (CON DENSED)
1 Key Facts
2 Key Events 6 Volkswagen Shares
7 Business Development 16 Results of Operations, Finan- cial Position and Net Assets 24 Outlook
29 Income Statement 30 Statement of Comprehensive Income 33 Balance Sheet 34 Statement of Changes in Equity 36 Cash Flow Statement 37 Notes to the Interim Consolidated Financial Statements 60 Review Report
This version of the Interim Report is a translation of the German original. The German takes precedence. All figures shown in the Report are rounded, so minor discrepancies may arise from addition of these amounts. The figures from the previous fiscal year are shown in parentheses directly after the figures for the current reporting period. Specified vehicle ranges correspond to results obtained through the Worldwide Harmonized Light vehicles Test Procedure (WLTP) on the chassis dynamometer. WLTP value ranges for series-produced vehicles may vary depending on the equipment. The actual range will deviate in practice depending on various other factors.
VO L K SWA G E N G R O U P
Q 3 Q 1 – 3
2020 2019 % 2020 2019 %
Volume Data1 in thousands
Deliveries to customers (units) 2,612 2,640 –1.1 6,505 8,005 –18.7
Vehicle sales (units) 2,575 2,645 –2.6 6,311 7,983 –21.0
Production (units) 2,445 2,553 –4.2 6,107 7,975 –23.4
Employees (on Sept. 30, 2020/Dec. 31, 2019) 664.2 671.2 –1.0
Financial Data (IFRSs), € million
Sales revenue 59,355 61,420 –3.4 155,486 186,617 –16.7
Operating result before special items 3,183 4,816 –33.9 2,380 14,795 –83.9
Operating return on sales before special items (%) 5.4 7.8 1.5 7.9
Special items – –275 x –687 –1,257 –45.4
Operating result 3,183 4,541 –29.9 1,693 13,539 –87.5
Operating return on sales (%) 5.4 7.4 1.1 7.3
Earnings before tax 3,606 5,080 –29.0 2,254 14,637 –84.6
Return on sales before tax (%) 6.1 8.3 1.4 7.8
Earnings after tax 2,751 3,986 –31.0 1,731 11,154 –84.5
Automotive Division2
Total research and development costs 3,496 3,665 –4.6 10,191 10,697 –4.7
R&D ratio (%) 7.2 7.2 8.1 6.8
Cash flows from operating activities 10,162 7,398 +37.4 13,171 20,921 –37.0
Cash flows from investing activities attributable to operating activities3 3,938 4,354 –9.6 11,754 12,309 –4.5
of which: capex 2,292 2,985 –23.2 6,422 8,186 –21.6
capex/sales revenue (%) 4.7 5.9 5.1 5.2
Net cash flow 6,224 3,044 x 1,418 8,612 –83.5
Net liquidity at Sept. 30 24,848 19,787 +25.6
1 Volume data including the unconsolidated Chinese joint ventures. These companies are accounted for using the equity method. Prior-year deliveries updated to reflect subsequent statistical trends.
2 Including allocation of consolidation adjustments between the Automotive and Financial Services divisions. 3 Excluding acquisition and disposal of equity investments: Q3 €3,754 (4,263) million, Q1–Q3 €10,657 (11,714) million.
Key Figures

Updated Information 1Key Facts
> Volkswagen Group’s business heavily impacted by Covid-19 pandemic in first nine months of 2020; countermeasures implemented worldwide take effect
> Deliveries to Volkswagen Group customers down 18.7% at 6.5 (8.0) million vehicles; declines in all regions, passenger car market share increased
> Group sales revenue decreases by 16.7% to €155.5 billion
> Operating profit before special items down €12.4 billion year-on-year at €2.4 billion; demand-related fall in volumes; negative effects of the fair value measurement of derivatives to which hedge accounting is not applied and of exchange-rate effects set against a non-cash gain from the contribution of AID to the autonomous driving joint venture with Ford
> Positive operating result of €1.7 (13.5) billion; negative special items of €–0.7 (–1.3) billion relating to diesel issue
> Profit before tax comes to €2.3 (14.6) billion
> Automotive Division’s net cash flow at €1.4 (8.6) billion; and reflects the normalization in working capital throughout the entire nine-month period; capex ratio of 5.1 (5.2) %
> Net liquidity in the Automotive Division at €24.8 billion; successful placement of hybrid notes strengthens capital base; dividend payment of €2.4 billion in October
> Exciting products:
- Volkswagen Passenger Cars celebrates the world premiere of the ID.4, the second model based on the Modular Electric Drive Toolkit (MEB); successor to Golf Estate and Golf Alltrack presented
- Audi shows off the upgraded Q2 and its Q4 Sportback e-tron concept car - ŠKODA debuts the Enyaq iV, the first production model based on the MEB - Porsche presents its extensively revamped Panamera - Bentley unveils the successor to the successful Bentayga - Lamborghini impresses with the open-top Sián Roadster - Volkswagen Commercial Vehicles expands its California family with the Caddy California
Key Facts

Key Events 2 Updated Information
G LO B A L S P R E A D O F CO R O N AV I R U S ( S A R S - COV - 2 )
At the end of December 2019, initial cases of a sometimes fatal respiratory disease became known in Wuhan, in the Chinese province of Hubei. This disease is attributable to a novel coronavirus. Infections also appeared outside China from mid-January 2020. In Europe, the number of people infected rose continuously in the course of February, and especially in March and April 2020. While many European countries recorded declining numbers of new infections as the second quarter of 2020 progressed, the rate of new infections continued to rise in North, Central and South America, Africa and parts of Asia. In the second quarter, many of the measures taken to contain the Covid-19 pan-demic were gradually relaxed, especially in Europe. This included partially lifting border controls and travel restric-tions, relaxing lockdowns as well as the reopening of businesses and public facilities. In addition, the European Commission and numerous European governments approved aid packages to support the economy. In other regions, too, governments introduced measures aimed at shoring up the economy to counteract the enormous disruption to everyday life and economic activity caused by the Covid-19 pandemic. During the third quarter, and particularly at the beginning of the fourth quarter of 2020, a partly very rapid increase in new infections was again recorded in many parts of the world, which led to a situation-based easing of restrictions being reversed in some places. N E W G R O U P M O D E L S P R E S E N T E D
Due to the spread of coronavirus and the efforts made to contain the pandemic, the Volkswagen Group brands con-tinued to present their new vehicles and technologies in the third quarter of 2020 primarily using online presentations.
In the third quarter of 2020, the Volkswagen Passenger Cars brand celebrated the world premiere of the ID.4, its first all-electric SUV. Powerful proportions, sleek lines and a sculptured rear are the hallmarks of the exterior and give the all-rounder outstanding aerodynamic qualities. The interior impresses with generous space, puristic design, dramatic lighting and sustainable upholstery materials. The operating concept is based on two displays – one of which measures up to 12 inches and features touchscreen functionality – and does not require physical buttons and switches thanks to “Hello ID.” natural voice control. An augmented reality head-up display is available as an option and can blend a host of visual indicators with the real world, for instance, navigation arrows prompt drivers to make a turn. The electric drive motor positioned at the rear axle of the ID.4 generates
150 kW (204 PS) and accelerates the vehicle from 0 to 100 km/h in 8.5 seconds, with a top speed of 160 km/h. The battery installed below the passenger compartment ensures a low center of gravity and stores up to 77 kWh of energy, thus providing a range of up to 520 km. Following the ID.3, the ID.4 is the second model from Volkswagen Passenger Cars based on the Modular Electric Drive Toolkit (MEB); it is to be built and sold in Europe and China in the future and later on in the United States as well. In addition, Volkswagen Passenger Cars celebrated the debut of the new Golf Estate. The compact station wagon features a vibrant design and is more spacious, dynamic and digital than its predecessor. The 66 mm increase in length rearranges the proportions and makes the Golf Estate appear more elongated and flatter. Standard features include the Lane Assist lane departure warning system, the area monitoring system Front Assist with City Emergency Braking System and Pedestrian Monitoring, the new oncom-ing vehicle braking when turning function, XDS electronic differential lock, the Car2X traffic hazard alert, the start system Keyless Start and automatic lighting control. The interior impresses with features such as the Digital Cockpit, the Composition online infotainment system with 8.25-inch touchscreen and We Connect and We Connect Plus online services and functions. The drive portfolio includes an ETSI engine with a mild hybrid drive system and innovative TDI engines with two SCR (Selective Catalytic Reduction) catalytic converters for lower emissions. The robust Golf Alltrack also enjoyed its debut at the same time. The standard model features the permanent all-wheel drive (4MOTION), increased ground clearance, an all-terrain look including specific bumpers and a custom interior. The all-wheel drive makes it suitable as a towing vehicle with a maximum trailer weight of up to 2,000 kg.
In addition to the Golf Estate and the Golf Alltrack, Volks-wagen Passenger Cars launched the revamped Tiguan in the third quarter of 2020. The redesigned front end of the success-ful SUV is characterized by a striking radiator grille and LED matrix headlights. The interior boasts new touch controls on the steering wheel and for climate control. Volkswagen is electrifying the Tiguan for the first time with a modern plug-in hybrid drive. Moreover, the SUV is available as a partic-ularly dynamic Tiguan R model.
Audi presented its upgraded Q2 in the third quarter of 2020. The sporty, elongated and yet powerful lines of the robust all-rounder give the compact SUV a confident appearance. The striking design is underlined by LED head lights, also with the option of innovative matrix LED tech-nology that enables an intelligently controlled high beam
Key Events

Updated Information 3Key Events
headlight. The spacious interior accommodates five passen-gers and echoes the taut design language of the exterior. The Audi virtual cockpit has a 12.3-inch display in addition to MMI navigation plus with an integrated LTE module featuring an 8.3-inch display. It is operated via a rotary pushbutton on the center tunnel console (MMI touch) or via a natural language voice control system. The Bang & Olufsen premium sound system, which features 14 loudspeakers and an output of 705 watts, stands out in the small SUV segment. The range of powerful drive systems offered consists of three TFSI and two TDI engines. Following on the heels of the Q4 e-tron concept, the compact electric SUV that debuted at the Geneva Motor Show in 2019, Audi has now presented the coupé version, the Q4 Sportback e-tron concept. The study is powered by two electric motors, which bring a system performance of 225 kW (306 PS) to the road with a quattro all-wheel drive. The Q4 Sportback e-tron concept sprints from zero to 100 km/h in just 6.3 seconds, with a top speed of 180 km/h. From a technical standpoint, the SUV coupé is based on the MEB platform. The battery stored in the underbody area provides a range of around 450 km.
By launching its Enyaq iV in the third quarter, ŠKODA is taking the next systematic step in the implementation of its e-Mobility strategy. It is the brand’s first production model based on the MEB. The completely battery-electric SUV boasts emotive and dynamic design language and its striking ŠKODA profile is also available with an illuminated radiator grille as an option. It combines rear or all-wheel drive with a range of up to 510 km that is suited for everyday usability. The cus-tomer can choose between two types of drive, three battery sizes and five performance levels ranging from 109 to 225 kW (148 to 306 PS). ŠKODA also continues its emotive design language in the interior: the innovative SUV features the brand’s typical spaciousness and a completely new Design Selections concept for the interior, replacing conventional trim lines. Each Design Selection represents a stylish, inviting interior with a feel-good factor and natural, sustainably produced and recycled materials.
Porsche presented its extensively revamped Panamera that combines the performance of a sports car with the comfort of an exclusive saloon and now covers an even wider range: with its top model, the 463 kW (630 PS) Panamera Turbo S, the sports car manufacturer is underscoring its high standard of best-in-class performance. By contrast, the Panamera 4S E-Hybrid is a consistent continuation of Porsche’s E-Perfor-mance strategy and constitutes a new addition to the range of plug-in hybrids, offering a completely new drive system with 412 kW (560 PS). Compared with the previous hybrid models, the all-electric range has been boosted by up to 30%. The chassis and control systems for all new Panamera models have been geared toward sportiness and comfort. Some sys-tems have even been applied completely from scratch. There is also a new equipment generation for the steering system and tires. The Sport Design front end with striking air intake grilles, large side cooling openings and a single-bar front light
module comes as standard. Porsche Communication Man-agement (PCM) includes additional digital functions and services such as the improved Voice Pilot online voice con-trol, Risk Radar for up-to-date hazard information, wireless Apple CarPlay and many other Connect services. The range of assistance systems now includes the following as standard: Lane Keeping Assist with road sign recognition, Porsche InnoDrive including adaptive cruise control, Night Vision Assist, Lane Change Assist and Park Assist including Sur-round View.
In the third quarter of 2020, Bentley introduced the suc-cessor to its successful Bentayga, with which the British brand opened up the luxury SUV segment nearly five years ago. Like its predecessor, the new Bentayga combines the abilities of a high-performance grand tourer with the charac-teristics of a luxury limousine, a spacious family car and an off-roader. The exterior design of the front and rear adopts the current Bentley design DNA, giving the vehicle a fasci-nating dynamic look and an air of elegance. The interior also received a makeover: the next-generation infotainment system that is seamlessly integrated into the handcrafted dashboard features a 10.9-inch infotainment screen with a rimless display. The optimized rear seats are available with ventilation. Rear passengers also benefit from significantly more generous legroom. The latest hardware and software provide enhanced navigation, including satellite maps, an online search function and other features. The Bentayga will initially be available with a 405 kW (550 PS) twin-turbo-charged 4.0 l V8 petrol engine. The range-topping model is planned for later on this year – the Bentayga Speed with a 467 kW (635 PS) 6.0 l W12 engine – along with an efficient plug-in hybrid.
Lamborghini unveiled its strictly limited edition Sián Roadster in the third quarter of 2020. The open-top version of the visionary super sports car impresses with its breathtaking design and innovative hybrid technology: the V12 engine is combined with a 48-volt electric motor built into its trans-mission, delivering 34 PS and offering a hybrid solution that provides immediate response and an even stronger perfor-mance. The innovative supercapacitor application also stores ten times the power of a lithium-ion battery. Located in the bulkhead between cockpit and motor, it ensures perfect weight distribution. The combination of thermal and electric power offers the Sián Roadster total power of 602 kW (819 PS), enabling the car to accelerate from 0 to 100 km/h in under 2.9 seconds, with a top speed of 350 km/h.
Volkswagen Commercial Vehicles celebrated the world premiere of the Caddy California. Based on the newly devel-oped fifth generation of the popular all-rounder, it also leverages all of the constructive advantages of the Modular Transverse Toolkit (MQB). The compact camper van will expand the California family, joining the California 6.1 and the Grand California. Many innovative and detailed solutions – such as a pull-out kitchenette, new ventilation openings with integrated insect screens and dimmable LED spotlights –

Key Events 4 Updated Information
make the Caddy California a multi-functional, comfortable companion for travel and everyday use. In addition, the latest technology used in the vehicle includes the Digital Cockpit, an online infotainment system with a 10.0-inch display, new driver assistance systems and sustainable TDI engines with double SCR catalytic converters. The Caddy California can be configured with an optional 1.4 m2 panoramic sunroof that floods the interior with light during the day and serves as a starlight ceiling at night.
AWA R D S
Several Volkswagen Group models were awarded the “Com-pany Car of the Year 2020” title by Firmenauto magazine in early July 2020. The up!, Polo, Golf, ID.3, Passat and T-Roc models from the Volkswagen Passenger Cars brand were selected as the winners in the categories City Car, Small Car, Compact Car, Compact Electric Car, Mid-sized Plug-in Hybrid, and Small SUV and Crossover. The SEAT brand was also a three-time winner, heading up the categories for small cars, small SUVs and crossovers, and maxi vans for import vehicles with its Ibiza, Arona and Alhambra. ŠKODA’s Superb not only took the top spot in the mid-size category for import vehicles, but the brand also won a second prize in the category for mid-sized plug-in hybrids. In addition, the Czech brand impressed with the Kodiaq and the Octavia in the category for mid-sized SUVs and crossovers for import vehicles, as well as in the category for compact cars. Audi was crowned the overall winner in the categories Premium and Luxury Electric Vehicle, Mid-size, and Mid-sized SUV and Mid-sized Crossover with the e-tron, the A4 and the Q5. Porsche’s Taycan rounded off the achievements by securing first place overall in the newcomer category. A 165-strong jury chose the overall winners and the winners among the import vehicles from 20 different vehicle categories.
At the end of July 2020, the “Best Commercial Vehicles 2020” readers’ choice award went to the Caddy, Transporter and Amarok models from Volkswagen Commercial Vehicles in the categories for delivery vehicles, vans up to 2.8 t, and pickups. A total of around 8,000 readers of transaktuell, Fern-fahrer and lastauto omnibus magazines chose the “Best Com-mercial Vehicles 2020” from 253 product lines in 19 cate-gories.
A N N I V E R S A R I E S
Bentley celebrated a production milestone in August 2020 when the 40,000th unit of the Flying Spur, the brand’s flag-ship model, rolled off the assembly line. The first generation of the luxury sports car was launched in 2005, and the Flying Spur is meanwhile available in its third generation. The vehi-cles are manufactured in Crewe, England, where a team of 250 people assemble each one by hand. PA RT N E R S H I P S
At the end of September 2020, Volkswagen and Blacklvy Ghana signed a non-binding Memorandum of Understand-
ing for a strategic collaboration. Blacklvy Ghana builds and grows commercial enterprises across Sub-Saharan Africa. The mutual goal of both parties is to create sustainable and green mobility and improve access to cars and housing in Ghana. In the long term, the collaboration is intended to help build a charging infrastructure for electric cars in Ghana, thus opening up the market for electric cars from the Volkswagen Group. C A R . S O F T WA R E O R G E X PA N D S I M A G E P R O C E S S I N G E X P E RT I S E
At the end of September 2020, the Volkswagen Group’s soft-ware company Car.Software Org agreed to acquire the front camera software business area of software specialist HELLA Aglaia Mobile Vision GmbH, a subsidiary of HELLA GmbH & Co. KGaA. The aim of this transaction is to expand the internal software expertise in the field of image processing and to forge ahead with developing driver assistance systems up to automated driving functions for all Volkswagen Group brands. The employees of HELLA Aglaia working in the front camera software business area are to provide support at Car.Software Org's Berlin site. The acquisition, which is still subject to approval by the antitrust authorities, is expected to be completed at the beginning of 2021. S Q U E E Z E - O U T U N D E R T H E G E R M A N STO C K C O R P O R AT I O N A C T
A G R E E D AT AU D I A G
As part of the planned squeeze-out at AUDI AG under the German Stock Corporation Act, Volkswagen AG announced on June 16, 2020 that the cash compensation for the transfer of shares held by minority shareholders had been set at €1,551.53 per share. On July 31, 2020, the Annual General Meeting of AUDI AG approved a squeeze-out under stock corporation law and the transfer of all outstanding Audi shares to Volkswagen AG. This resolution will take effect upon its entry in the commercial register. M E R G E R S Q U E E Z E - O U T AT M A N S E P O ST P O N E D
On September 17, 2020, TRATON SE announced that it was no longer seeking to carry out the merger squeeze-out of the minority shareholders of MAN SE in 2020, contrary to the statement made on February 28, 2020. The realignment of MAN SE and measures to deal with the Covid-19 pandemic will be prioritized first. The full corporate integration of MAN SE into TRATON SE is to be pursued further in 2021.
CO M P L E T I O N O F T H E S A L E O F I N T E R E ST I N R E N K A G
On October 6, 2020, the Volkswagen Group completed the sale of its 76% interest in Renk AG. The sale price was €0.5 billion. The corresponding assets and liabilities con-tinued to be classified as held for sale in the balance sheet as of September 30, 2020.

Updated Information 5Key Events
TA K E OV E R O F N AV I STA R
On October 16, 2020, TRATON SE announced that it had reached an agreement in principle with Navistar International Corporation (Navistar) to acquire all outstanding shares in Navistar not already owned by TRATON for a price of USD 44.50 per share. At the time of the agreement, TRATON held 16.7% of Navistar’s outstanding shares. This agreement in principle is subject to the completion of the due diligence process to TRATON’s satisfaction, the agreement on the conclusion of the merger agreement and the associated transaction documents, and the approval of the transaction by the boards of management and supervisory boards of TRATON and Volkswagen AG as well as by the Board of Directors and shareholders’ meeting of Navistar. After the conclusion of the contract the completion of the transaction is particularly subject to official approvals. J U D G M E N T S B Y F E D E R A L C O U RT O F J U ST I C E I N D I E S E L L I T I G AT I O N
On May 25, 2020, the Bundesgerichtshof (BGH – Federal Court of Justice) handed down its first decision ever in an individual product-related lawsuit in connection with the diesel issue. The BGH held that the buyer, who had purchased a vehicle with a type EA 189 engine prior to public disclosure of the diesel issue, had a claim for damages against Volkswagen AG. While the buyer can require reimbursement of the vehicle's purchase price, he must accept a deduction for the benefit derived from using the vehicle and must return it to Volkswagen AG. The judgment clarified the BGH's stance on the fundamental issues underlying a large number of individual diesel lawsuits then still pending.
In a series of fundamental judgments rendered in July 2020, the BGH decided further legal issues of major impor-tance for the litigation still pending with regard to vehicles with type EA 189 engines. The BGH held that plaintiffs who purchased their vehicle after the ad hoc announcement of September 22, 2015 have no claim for damages. The court furthermore ruled that purchasers of affected vehicles are not entitled to tort interest under § 849 Bürgerliches Gesetzbuch (German Civil Code). The court also made it clear that a plaintiff's potential damage claim may be completely offset by the benefit derived from using the vehicle. I N D E P E N D E N T C O M P L I A N C E M O N I TO R S H I P S U CC E S S F U L LY
CO M P L E T E D In September 2020, the Independent Compliance Monitor, Larry D. Thompson, certified that Volkswagen has fulfilled its obligations under its Plea Agreement with the U.S. Depart-ment of Justice (DOJ) to design and implement a compliance program that will prevent and detect violations of anti-fraud and environmental laws. Certification applies to Volks-wagen AG and its subsidiaries and affiliates with the excep-tion of Porsche AG and Porsche Cars North America, which
were not part of the Monitorship. Over the course of the Monitorship, which began in 2017 and is now concluded, Volkswagen enhanced and improved its structures, processes and systems in many divisions of the company including technical development, governance, risk management, com-pliance and legal functions. Thompson also served as Inde-pendent Compliance Auditor and issued his third and final audit report in June 2020. That report established that there had been no new violations of the relevant settlements with the Environment and Natural Resources Division of the DOJ, the California Attorney General, the Environmental Protec-tion Agency and the California Air Resources Board.
A N N UA L G E N E R A L M E E T I N G
Originally scheduled for May 7, 2020 and postponed due to the Covid-19 pandemic, Volkswagen AG’s 60th Annual General Meeting was held on September 30, 2020 as the Company’s first virtual Annual General Meeting. With around 94% of the voting share capital present, the shareholders approved the proposal of the Board of Management and Supervisory Board to pay a dividend of €4.80 per ordinary share and €4.86 per preferred share for fiscal year 2019, unchanged from the previous year. Furthermore, the Annual General Meeting approved the actions of the members of the Board of Management and Supervisory Board for fiscal year 2019, approved an amendment to the Articles of Association, and appointed Ernst & Young GmbH Wirtschaftsprüfungsgesellschaft as the auditor of the single-entity and consolidated financial state-ments for fiscal year 2020 and for the review of the con-densed consolidated interim financial statements and the interim management report for the period January 1 to September 30, 2020, as well as for the first quarter of fiscal year 2021. The term of office of Dr. Hussain Ali Al Abdulla on the Supervisory Board of Volkswagen AG duly ended at the close of the Annual General Meeting. The Annual General Meeting elected Dr. Al Abdulla to the Supervisory Board for another full term of office as a shareholder representative. F I R ST G R E E N B O N D S S U CC E S S F U L LY P L A C E D
In September 2020, the Volkswagen Group successfully placed its first green bonds on the market, with a volume of €2 billion and terms of 8 and 12 years. The bonds met with great interest, including from international and specialized green bond investors. The proceeds will be used for the Modular Electric Drive Toolkit (MEB) and the new ID.3 and ID.4 BEV models. The green bonds were the first issue based on the Green Finance Framework presented by Volkswagen in March for sustainability-oriented financial instruments. The Volkswagen Group plans to increase its use of green bonds in future in order to finance its comprehensive electric campaign.

Volkswagen Shares 6 Interim Management Report
60
70
80
90
100
110
D J F M A M J J A S O N D
Volkswagen ordinary share –13.9%Volkswagen preferred share –22.0%
DAX –3.7%EURO STOXX Automobiles & Parts –15.7%
60
70
80
90
100
110
P R I C E D E V E L O P M E N T F R O M D E C E M B E R 2 0 1 9 T O S E P T E M B E R 2 0 2 0Index based on month-end prices: December 31, 2019 = 100
Following the sharp fall in share prices in the first quarter of this year, which was triggered by the Covid-19 pandemic and its severe negative economic implications, international stock markets started to recover during the second quarter, with some even reporting a strong upward trend. The upward trend slowed in the third quarter.
The DAX finished the third quarter 4% lower than at the end of 2019. After an initially good start to the new financial year with a record high in February, share prices collapsed with the increasing spread of the SARS-CoV-2 virus. Starting from the low reached in March, the leading German stock index then again gained in value and recouped most of its losses in the third quarter. This development was fueled con-siderably by economic stimulus measures from central banks and governments throughout the world and the resulting hopes of a more rapid global economic recovery. Toward the end of the reporting period, growing fears of another wave of infection and the ensuing restrictions in public life weighed on share price performance.
Following the decline in the first quarter of 2020, the prices of Volkswagen AG’s preferred and ordinary shares also proceeded to recover in the months that followed; however, they were still 22% lower in the case of preferred shares and 14% lower in the case of ordinary shares than at the end of 2019. Uncertainties surrounding the development of the global demand for automobiles caused by the Covid-19 pan-demic placed share prices under pressure. In addition, nega-tive effects arose from the automotive industry’s current period of transition that requires large-scale investment. More-over, the impending US punitive tariffs on European vehicles,
the uncertain outcome of the negotiations on the United Kingdom’s exit from the EU Single Market including the form the future relationship takes, and the appreciation of the euro against the US dollar since May 2020 all had a negative impact. Positive momentum came from the incipient recovery of the Chinese automotive market and investors’ hopes of improved economic activity in the wake of relaxed restrictions worldwide and government assistance measures, as well as hopes that the Covid-19 pandemic would subside.
Information and explanations on earnings per share can be found in the notes to the interim consolidated financial statements. Additional Volkswagen share data, plus corporate news, reports and presentations can be downloaded from our website: www.volkswagenag.com/en/InvestorRelations.html. VO L K SWA G E N K E Y S H A R E F I G U R E S A N D M A R K E T I N D I C E S
F R O M J A N UA RY 1 TO S E P T E M B E R 3 0 , 2 0 2 0
Volkswagen Shares
High Low Closing
Ordinary share Price (€) 183.10 101.50 149.20
Date Jan. 10 Mar. 18 Sept. 30
Preferred share Price (€) 185.52 87.20 137.40
Date Jan. 10 Mar. 18. Sept. 30
DAX Price 13,789 8,442 12,761
Date Feb. 19 Mar. 18 Sept. 30
ESTX Auto & Parts Price 496 255 410
Date Jan. 10 Mar. 18 Sept. 30

Interim Management Report 7Business Development
G E N E R A L E CO N O M I C D E V E LO P M E N T
The global spread of the SARS-CoV-2 virus, the associated restrictions and the resulting downturn in demand and supply meant that growth in the world economy was nega-tive between January and September 2020. The average rate of expansion of gross domestic product (GDP) was far below the previous year’s level in both the advanced economies and the emerging markets. However, it was evident worldwide that growth rates declined less sharply in the third quarter of this year than in the second quarter. At country level, perfor-mance in the reporting period depended on the extent to which the negative impacts of the global Covid-19 pandemic were already materializing. The governments and central banks of numerous countries worldwide responded in some cases with substantial fiscal and monetary policy measures. This meant cuts in the already relatively low interest rates. There was a marked fall in prices for energy resources, while other commodity prices remained, on average, virtually unchanged year-on-year. Currencies in some emerging mar-kets depreciated distinctly in the first nine months of 2020. Global trade in goods declined in the reporting period.
As a whole, the economies of Western Europe recorded a sharp fall in growth from January to September 2020. This trend was seen in all countries in Northern and Southern Europe. The impact of national measures to contain the pan-demic, including border closures and spatial/physical dis-tancing, caused deep cuts. In some regions, the measures severely restricted everyday life and also had grave economic consequences. During the second quarter, the governments of many European countries started to partially lift restric-tions, thus giving rise to a gradual economic recovery. This trend did not continue in certain countries due to a renewed increase in the incidence of coronavirus in many countries and the associated tougher measures to contain the pan-demic,
Germany recorded a markedly negative growth rate over the reporting period. The labor market was in a favorable situation at the start of the year, but many companies intro-duced a furlough scheme (Kurzarbeit) during the first three quarters of the year. The easing of restrictions in everyday life and economic activity as well as government assistance packages enacted to support the economy led to improved confidence among consumers and companies, but only occa-sionally reached pre-crisis levels.
The economies in Central and Eastern Europe reported an overall marked decline in the real absolute GDP in the first nine months of 2020. This trend was also observed in Russia, the largest economy in Eastern Europe.
In Turkey, the recovery from the first quarter could not be sustained – the GDP growth rate was significantly negative overall. South Africa’s GDP growth declined sharply in the reporting period amid persistent structural deficits and political challenges.
Growth in the US economy receded significantly and was negative in the first three quarters of 2020 amid a dynamic increase in the rate of infection. To strengthen the economy in light of the disruption caused by the Covid-19 pandemic, the US government passed comprehensive stimulus packages. The US Federal Reserve cut interest rates twice, alongside other measures to support the economy. The weekly number of people filing new claims for unemployment benefits rose by several million before declining but still remaining at a relatively high level. This had a knock-on effect on the unem-ployment rate. In the neighboring countries, economic out-put also fell compared to the same period of 2019, the fall being significant in Canada and sharp in Mexico.
Brazil recorded a sharp decline from January to Sep-tember 2020, resulting from the ongoing dynamic rate of infection caused by the Covid-19 pandemic. The economic downturn in Argentina intensified amid high inflation and continued currency depreciation compared to the previous year.
Economic output in China, which had been exposed to the negative effects of the Covid-19 pandemic earlier than other economies, rose in the reporting period on the strength of positive growth rates in the second and third quarters. India registered a sharp fall in growth amid the recent spike in infections. Japan also recorded negative GDP growth com-pared to the same period of the previous year due to the adverse impact of the Covid-19 pandemic.
T R E N D S I N T H E M A R K E T S F O R PA S S E N G E R C A R S A N D L I G H T CO M M E R C I A L V E H I C L E S
Global demand for passenger cars fell significantly year-on-year from January to September 2020 as a result of the Covid-19 pandemic (–20.2%). The slump affected all regions, Above-average losses were recorded in the overall markets of Western
Business Development

Business Development 8 Interim Management Report
Europe, South America and Africa, while the decline was lower by comparison in Asia-Pacific and the Middle East.
Global demand for light commercial vehicles between January and September 2020 was substantially below the prior-year level.
In Western Europe, there was a sharp fall in demand for passenger cars during the reporting period compared to the prior year. The negative impact from the spread of the SARS-CoV-2 virus was noticeable as early as March. New registra-tions saw declines on a similar scale in all major individual markets, though the fall in demand slowed toward the end of the reporting period and some markets even recorded positive growth rates in individual months. The passenger car markets in the UK, France, Italy and Spain each lost around one third of their volume in the first nine months of 2020.
The volume of new registrations of light commercial vehicles in Western Europe fell substantially below the prior-year figure.
New passenger car registrations in Germany between January and September 2020 did not match the high level seen in the equivalent period of the previous year. Demand here decreased by one quarter, a trend amplified by the Covid-19 pandemic and the associated restrictions and prohibitions.
Demand for light commercial vehicles in Germany in the reporting period was significantly lower than in the same period of 2019.
In the Central and Eastern Europe region, sales of passenger cars in the reporting period were significantly below the previous year’s level. The development of demand in the year to date has differed from market to market. While the EU countries of Central Europe registered shrinking demand from the beginning of the year, the Russian passenger car market remained stable in the first quarter. This market con-tracted drastically in the second quarter, as the SARS-CoV-2 virus became increasingly widespread, but regained some ground during the third quarter.
Registration volumes for light commercial vehicles in Central and Eastern Europe fell appreciably compared with the same period of the previous year, with the number of vehicles sold in Russia between January and September 2020 also coming in substantially below the prior-year figure.
In the period from January to September 2020, the vol-ume of the passenger car market in Turkey was up by more than two thirds on the very low prior-year level. The increase in demand was bolstered in particular by the strong growth in the first and third quarters of this year, whereas demand dipped at times during the second quarter. In South Africa, the crisis meant that the number of passenger cars sold was much lower than in the previous year, which had already recorded poor figures.
In North America, too, sales of passenger cars and light com-mercial vehicles (up to 6.35 tonnes) declined significantly in the reporting period compared with the prior year, with the
D J F M A M J J A S O N D
90
95
100
105
110
90
95
100
105
110
EUR to GBPEUR to USDEUR to CNY
EUR to JPY
E X C H A N G E R A T E M O V E M E N T S F R O M D E C E M B E R 2 0 1 9 T O S E P T E M B E R 2 0 2 0Index based on month-end prices: as of December 31, 2019 = 100

Interim Management Report 9Business Development
effects of the Covid-19 pandemic worsening in the second quarter. By the end of the reporting period, the decline had tapered off. The market volume in the USA also remained sig-nificantly down on the prior-year level. The decline affected both the passenger car segment and light commercial vehi-cles such as SUVs and pickup models. In the Canadian auto-motive market, the Covid-19 pandemic substantially accel-erated the downward trend that began in 2018. The number of vehicles sold in Mexico fell sharply below the comparable prior-year figure. In the markets of the South America region, the volume of new registrations for passenger cars and light commercial vehicles was much lower in the first nine months of 2020. This region, even more than Western Europe, saw the most severe impact of the Covid-19 pandemic on the automotive markets in terms of percentage. In Brazil, the recovery in demand for cars stalled; the number of new registrations was very much lower than the prior-year period. In the Argen-tinian market, the deterioration in the macroeconomic situ-ation since mid-2018 and the spread of the SARS-CoV-2 virus negatively impacted the demand for passenger cars and light commercial vehicles. Sales figures also fell very sharply there between January and September 2020. In the Asia-Pacific region, too, the reporting period was adversely impacted by the spread of the SARS-CoV-2 virus. The number of new passenger cars registered between Janu-ary and September 2020 was down markedly on the prior-year level. This was also due to developments in the Chinese passenger car market, where the volume of demand fell significantly short of the previous year as a result of the Covid-19 pandemic. After the drastic losses in the first three months of the year, there were clear signs of a recovery in the overall market as the year went on. In the Indian passenger car market, sales in the period from January to September 2020 fell sharply compared with a year earlier. In Japan, vehi-cle demand in the first nine months of 2020 was down signif-icantly on the previous year due not only to the Covid-19 pan-demic, but also to the increase in VAT as of October 1, 2019.
There was an appreciable year-on-year decline in demand for light commercial vehicles in the Asia-Pacific region. Regis-tration volumes in China, the region’s dominant market and the largest market worldwide, fell by around a fifth compared with the previous year. The number of new vehicle registra-tions in India saw a drastic decrease year-on-year, while in Thailand the number was substantially below the prior-year level.
T R E N D S I N T H E M A R K E T S F O R C O M M E R C I A L V E H I C L E S
In the markets that are relevant for the Volkswagen Group, global demand for mid-sized and heavy trucks with a gross weight of more than six tonnes was much lower in the
reporting period than in the prior year due to the spread of the SARS-CoV-2 virus.
Demand in the 27 EU states excluding Malta, but including the United Kingdom, Norway and Switzerland (EU27+3), fell very sharply year-on-year in the first nine months of 2020. The previously anticipated downturn in the market for 2020 was amplified by the Covid-19 pandemic, especially in the second quarter of the year. The Russian market recorded a substantial downswing. Turkey saw new registrations increase by a factor of 1.3 compared, however, to a very low prior-year figure. By contrast, the South African market declined drasti-cally. In Brazil, the largest market in the South America region, demand for trucks was significantly below the level seen in the previous year as a result of the pandemic. The bus markets were also very strongly impacted by the Covid-19 pandemic. Demand for buses in the EU27+3 coun-tries in the first nine months of 2020 was much lower than in the prior-year period, and the market for coaches in particular all but ground to a halt. Demand in Brazil was very much lower and in Mexico drastically below the previous year. T R E N D S I N T H E M A R K E T S F O R P O W E R E N G I N E E R I N G
The markets for power engineering are subject to differing regional and economic factors. Consequently, their business growth trends are mostly independent of each other.
The global impact of the Covid-19 pandemic and associ-ated uncertainty meant that order activity in the marine market was significantly lower in the first three quarters of 2020 than in the same period of the previous year, and the period was marked by project postponements. In merchant shipping, the market developed only hesitantly despite the stabilization of freight rates. Orders for cruise ships ground to a halt. The passenger ferry segment – similarly affected by a loss of revenue – was also impacted by a decline in demand. The special market for government vessels, which is driven by state investment, continued on a stable trajectory. In the off-shore sector, the existing overcapacity and low oil prices virtually stifled investment in offshore oil production.
The market for power generation declined significantly in the first nine months of 2020 compared with the same period of the previous year. This trend was compounded by the spread of the SARS-CoV-2 virus and its impact on the global economic system, which led to renewed pressure on prices overall. Due to the collapse in oil prices, there was short-term demand for lower-priced stock engines run on HFO (heavy fuel oil), though the general trend away from oil-fired power plants toward dual-fuel and gas-fired power plants continued. Demand for new energy solutions such as hydrogen, battery and solar technologies was impacted by project postpone-ments, albeit with a continuing trend toward greater flexi-bility and decentralized availability.

Business Development 10 Interim Management Report
The market for turbomachinery deteriorated distinctly com-pared with the prior-year period in virtually all areas of application. Mainly as a consequence of the Covid-19 pan-demic, demand for turbo compressors in the raw materials, oil, gas and processing industry weakened noticeably over the course of the first nine months of 2020. Demand for steam turbines for power generation also collapsed in the renewable energy industry toward the end of the first half of the year, showing a sharp downward trend overall in the first three quarters of 2020 compared with the prior-year period. Demand for gas turbines for decentralized, industrial com-bined heat and power installations in the power classes of the new gas turbine range slumped in the first nine months of 2020. The Covid-19 pandemic has delayed many projects in nearly all regions, with the exception of China.
The after-sales business for diesel engines improved slightly in the first three quarters of 2020, particularly in the marine segment, and benefited from a continued increase in interest in retrofitting solutions. However, following a strong first quarter, demand in the second and third quarters of 2020 fell below the prior-year level as a result of the pan-demic.
The after-sales market for turbomachinery remained under strong pressure. In the first nine months of 2020, major investments in modifications, among other things, were postponed due to the Covid-19 pandemic, and more recently, individual projects have been canceled. Initial positive signs could be seen in field service, which recorded significant growth in the third quarter after business volume had been lower in the first half of the year.
T R E N D S I N T H E M A R K E T S F O R F I N A N C I A L S E R V I C E S
Demand for automotive financial services was buoyant par-ticularly in the first three months of 2020, due among other things to the persistently low key interest rates in the main currency areas. Nevertheless, the Covid-19 pandemic put pressure on the demand for financial services in almost all regions during the reporting period. The effects of the Covid-19 pandemic were noticeable worldwide, especially in the second quarter of 2020. Markets for automotive financial services staged a partial recovery in the third quarter.
In the European passenger car market, the second quarter of 2020 was especially affected by the Covid-19 pandemic, resulting in a sharp decline in demand there for new and used vehicles over the reporting period as a whole. The proportion of lease and financing contracts, after-sales products such as servicing, maintenance and spare parts agreements, and automotive-related insurance to vehicle sales increased, although the absolute number of contracts declined.
Germany saw a year-on-year drop in the number of loan-financed and leased new vehicles between January and Sep-tember 2020 due to the challenges of the Covid-19 pandemic. However, new contracts in the leasing business with indi-
vidual customers improved both in terms of new vehicles and particularly in terms of used vehicles.
In South Africa, demand for financing and insurance products stabilized from the second quarter of 2020 onwards as a result of campaigns, but was down year-on-year in the reporting period.
A drop in demand for Financial Services has been seen across the entire North America region as a consequence of the Covid-19 pandemic. However, the proportion of lease and financing contracts in the USA and also Canada in the first three quarters of 2020 was up on the prior-year level because the number of new lease and financing contracts signed fell at a lower rate than vehicle deliveries. A shift from lease to financing contracts was observed in the United States. In Mexico, the currently limited fleet business led to a slight decline in the proportion of lease and financing contracts.
In the markets of the South America region, the spread of the SARS-CoV-2 virus had a negative impact on the demand for vehicles and automotive-related financial services, partic-ularly in the second quarter and at the beginning of the third quarter of 2020. The number of contracts fell significantly in Brazil and Argentina in the reporting period; the manufac-turers’ penetration rates – the ratio of leased and financed vehicles to deliveries – decreased as well.
China’s passenger car market recovered from the Covid-19 pandemic in the second and third quarter of 2020. The relaxation of restrictions also led to increasing numbers of new contracts signed for automotive-related financial ser-vices, which in the period January to September fell slightly short of the prior-year level. In Japan, the adverse impact of the Covid-19 pandemic was noticeable in the reporting period – especially in the new vehicle business – despite attractive financial service offerings. In India, demand for financial services fell as a result of continued weakness in the banking market and the spread of the SARS-CoV-2 virus.
The Covid-19 pandemic also led to substantial declines in demand for new and used vehicles in the commercial vehi-cles business area in the first three quarters of this year. As a result, there was a fall in the number of lease and financing contracts in Europe and Brazil; however, this was accom-panied by a rise in the penetration rate of these financial products.
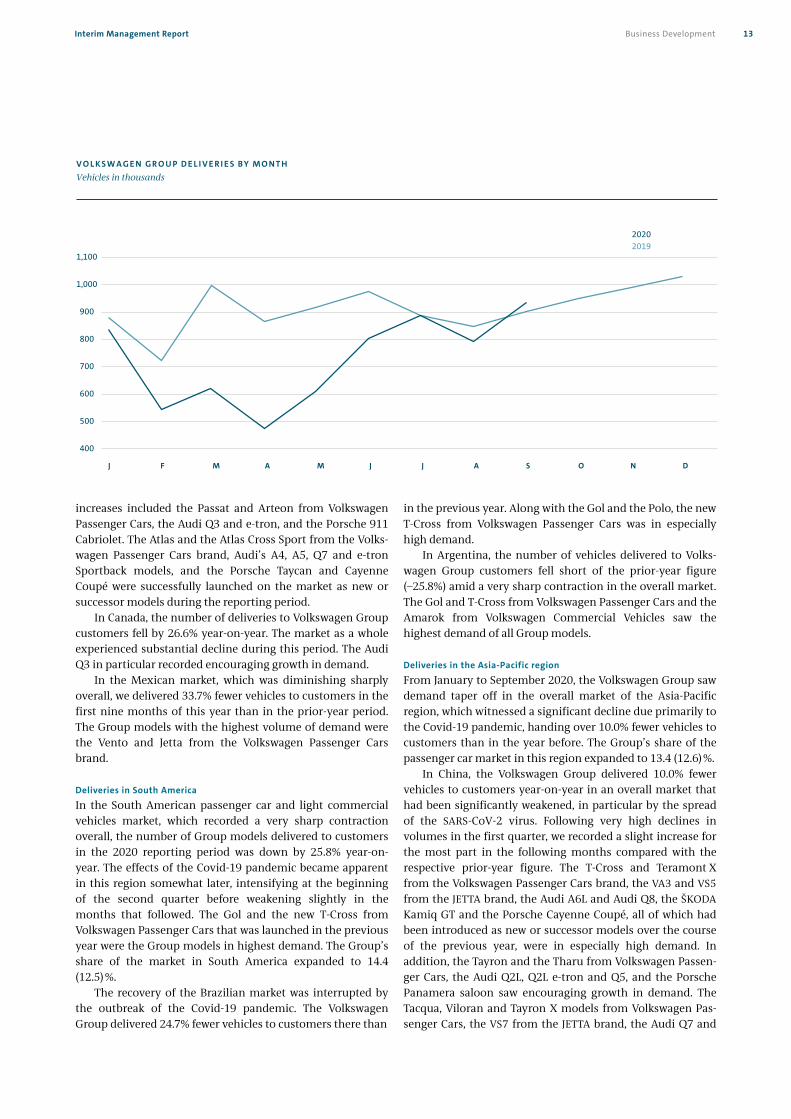
VO L K SWA G E N G R O U P D E L I V E R I E S
The Volkswagen Group delivered 6,504,747 vehicles to cus-tomers worldwide from January to September 2020. The decrease of 18.7% or 1,500,419 units year-on-year was due almost exclusively to the Covid-19 pandemic and the measures taken worldwide to contain its spread. Sales figures for both the Passenger Cars Business Area and the Commercial Vehicles Business Area declined as a result of the fall in demand. The chart on page 13 shows the trend in deliveries worldwide by month compared with the previous

Interim Management Report 11Business Development
year. In the following, we report separately on deliveries in the Passenger Cars Business Area and the Commercial Vehicles Business Area. VO L K SWA G E N G R O U P D E L I V E R I E S
F R O M J A N UA RY 1 TO S E P T E M B E R 3 0 1
2020 2019 %
Passenger Cars 6,377,083 7,826,075 –18.5
Commercial Vehicles 127,664 179,091 –28.7
Total 6,504,747 8,005,166 –18.7
1 Prior-year deliveries have been updated to reflect subsequent statistical trends. The figures include the Chinese joint ventures.
G LO B A L D E L I V E R I E S B Y T H E PA S S E N G E R C A R S B U S I N E S S A R E A
Global demand for the Volkswagen Group’s passenger cars and light commercial vehicles fell by 18.5% year-on-year to 6,377,083 units in the reporting period as a consequence of the debilitating market conditions arising from the uncer-tainty and the measures taken worldwide to tackle the Covid-19 pandemic. In connection with the pandemic, our deliveries to customers were affected by differing temporal and geographical effects. Bentley was the only Volks-wagen Group brand that did not fall short of its prior-year figures. We registered declining demand year-on-year in nearly all regions. The sole exception was the Middle East region, largely driven by the positive trend in sales figures in Turkey. During the second and third quarter, the month-on-month declines diminished again, and we saw growth in demand for Group models in some individual markets. Demand for Group models in September was up on the prior-year figure. In a significantly declining overall global market, we achieved a passenger car market share of 13.0 (12.6) %.
The table on the next page provides an overview of pas-senger car and light commercial vehicle deliveries to custom-ers by market in the reporting period. Sales trends in the individual markets are described in the following sections.
Deliveries in Europe/Other markets
In Western Europe, the Volkswagen Group delivered 2,023,822 vehicles to customers in the first nine months of this year in a sharply declining overall market. This was 26.8% fewer than in the same period of 2019. The increasing spread of the SARS-CoV-2 virus and the measures taken to contain it sent demand for the Group’s vehicles into a tailspin during the first quarter and at the beginning of the second quarter. All of the major individual markets demonstrated very similar declines in demand for Group vehicles. By the end of the first half of the year, the declines had tapered off. In the third
quarter, demand for Group vehicles in individual markets was once again up on a monthly basis compared with the relevant figure a year earlier. The Group models with the highest volume of demand were the Golf, Polo, Tiguan and T-Roc from the Volkswagen Passenger Cars brand. In addi-tion, the T-Cross and Passat models from Volkswagen Passenger Cars, the Q3 Sportback, Q7 and e-tron from Audi, the Scala and Kamiq from ŠKODA, the Mii electric and Tarraco from SEAT, and the Porsche Cayenne Coupé and Porsche Taycan, all of which had been introduced as new or successor models over the course of the previous year, were very popular with customers. Some of the models successfully launched on the market during the reporting period as new or successor models were the up!, T-Roc Cabriolet, Golf hatchback, Arteon Shooting Brake and the ID.3 from Volks-wagen Passenger Cars, the A3 saloon, A3 Sportback, A5 and e-tron Sportback from Audi, the Citigoe iV, Superb iV and Octavia from ŠKODA, and the Leon, Leon ST and Ateca from SEAT. The Volkswagen Group’s share of the passenger car market in Western Europe rose to 23.4 (22.6) %.
In Germany, demand for vehicles from the Volkswagen Group was down 25.8% year-on-year between January and September 2020 in an overall market that was suffering a substantial decline. As with the overall market in Western Europe, the decrease was attributable to the negative impact of the spread of coronavirus. The Group models with the highest volume of demand were the Golf and Tiguan from the Volkswagen Passenger Cars brand. The T-Cross and Passat models from Volkswagen Passenger Cars, the Audi Q3 Sportback, Q7 and e-tron, the ŠKODA Scala and Kamiq, the Mii electric and the Tarraco from SEAT, and the Porsche Cayenne Coupé and Porsche Taycan, all of which had been introduced as new or successor models over the course of the previous year, were also in high demand from customers. Eight Group models led the Kraftfahrt-Bundesamt (KBA – German Federal Motor Transport Authority) registration statistics in their respective segments: the Golf, T-Roc, Tiguan, Touran, Passat, Audi A6, Porsche 911 and Caddy. After the first nine months of 2020, the Golf was still the most popular passenger car in Germany in terms of registrations.
In the Central and Eastern Europe region, the number of vehicles delivered to customers in the reporting period fell by 17.4%, a decline less extreme than in Western Europe which was due primarily to the rise in deliveries in Russia in the first and third quarter. Demand developed encouragingly for the T-Cross from Volkswagen Passenger Cars, for the Audi Q3 Sportback, for ŠKODA’s Scala, Kamiq and Karoq models and for the Porsche Cayenne Coupé. The Volkswagen Group’s share of the passenger car market in the Central and Eastern Europe region amounted to 22.1 (21.3) %.
In Turkey, the Volkswagen Group continued to benefit from the catch-up effects in the overall market, increasing the number of vehicles handed over to customers between

Business Development 12 Interim Management Report
January and September of this year by 77.5% compared with the prior-year period. The Passat saloon was the most sought-after Group model. In the very sharply contracting South African market, the number of Group models sold fell by 31.9%. The Polo from Volkswagen Passenger Cars continued to be the most frequently sold Group model there. Deliveries in North America
In North America, demand for Volkswagen Group models fell by 21.8% year-on-year in the reporting period, largely mirroring the trend in the market as a whole. The effects of
the Covid-19 pandemic became apparent in this region some-what later, intensifying at the beginning of the second quarter. The decline tapered off slightly as the reporting period went on. The Group’s share of the market in this region amounted to 4.5 (4.6) %. The Tiguan Allspace and Jetta from Volkswagen Passenger Cars were the most sought-after Group models in North America.
In the significantly weaker US market, the Volkswagen Group delivered 17.7% fewer vehicles to customers between January and September 2020 than in the same period of the previous year. The Group models to record the greatest
PA S S E N G E R C A R D E L I V E R I E S TO C U STO M E R S B Y M A R K E T F R O M J A N UA RY 1 TO S E P T E M B E R 3 0 1
D E LI V E R I E S ( UN I T S) C H A N G E
2020 2019 (%) Europe/Other markets 2,684,767 3,561,032 –24.6Western Europe 2,023,822 2,765,282 –26.8
of which: Germany 745,834 1,004,791 –25.8France 149,822 221,909 –32.5United Kingdom 302,384 427,687 –29.3Italy 169,363 235,430 –28.1Spain 153,092 234,713 –34.8
Central and Eastern Europe 464,221 561,822 –17.4of which: Czech Republic 81,269 101,712 –20.1
Russia 154,476 158,992 –2.8Poland 87,721 122,433 –28.4
Other Markets 196,724 233,928 –15.9
of which: Turkey 82,468 46,466 +77.5South Africa 44,936 65,961 –31.9
North America 547,834 700,564 –21.8of which: USA 398,951 485,023 –17.7
Canada 61,958 84,453 –26.6Mexico 86,925 131,088 –33.7
South America 299,582 403,579 –25.8of which: Brazil 227,965 302,886 –24.7
Argentina 42,612 57,454 –25.8Asia-Pacific 2,844,900 3,160,900 –10.0
of which: China 2,657,153 2,951,843 –10.0India 17,184 36,636 –53.1Japan 50,064 60,556 –17.3
Worldwide 6,377,083 7,826,075 –18.5Volkswagen Passenger Cars 3,674,338 4,514,552 –18.6Audi 1,187,190 1,357,102 –12.5ŠKODA 721,884 913,723 –21.0SEAT 316,904 454,797 –30.3Bentley 7,496 7,155 +4.8Lamborghini 5,631 6,517 –13.6Porsche 191,547 202,318 –5.3Bugatti 58 62 –6.5Volkswagen Commercial Vehicles 272,035 369,849 –26.4
1 Prior-year deliveries have been updated to reflect subsequent statistical trends. The figures include the Chinese joint ventures.
Interim Management Report 13Business Development
increases included the Passat and Arteon from Volkswagen Passenger Cars, the Audi Q3 and e-tron, and the Porsche 911 Cabriolet. The Atlas and the Atlas Cross Sport from the Volks-wagen Passenger Cars brand, Audi’s A4, A5, Q7 and e-tron Sportback models, and the Porsche Taycan and Cayenne Coupé were successfully launched on the market as new or successor models during the reporting period.
In Canada, the number of deliveries to Volkswagen Group customers fell by 26.6% year-on-year. The market as a whole experienced substantial decline during this period. The Audi Q3 in particular recorded encouraging growth in demand.
In the Mexican market, which was diminishing sharply overall, we delivered 33.7% fewer vehicles to customers in the first nine months of this year than in the prior-year period. The Group models with the highest volume of demand were the Vento and Jetta from the Volkswagen Passenger Cars brand.
Deliveries in South America
In the South American passenger car and light commercial vehicles market, which recorded a very sharp contraction overall, the number of Group models delivered to customers in the 2020 reporting period was down by 25.8% year-on-year. The effects of the Covid-19 pandemic became apparent in this region somewhat later, intensifying at the beginning of the second quarter before weakening slightly in the months that followed. The Gol and the new T-Cross from Volkswagen Passenger Cars that was launched in the previous year were the Group models in highest demand. The Group’s share of the market in South America expanded to 14.4 (12.5) %.
The recovery of the Brazilian market was interrupted by the outbreak of the Covid-19 pandemic. The Volkswagen Group delivered 24.7% fewer vehicles to customers there than
in the previous year. Along with the Gol and the Polo, the new T-Cross from Volkswagen Passenger Cars was in especially high demand.
In Argentina, the number of vehicles delivered to Volks-wagen Group customers fell short of the prior-year figure (–25.8%) amid a very sharp contraction in the overall market. The Gol and T-Cross from Volkswagen Passenger Cars and the Amarok from Volkswagen Commercial Vehicles saw the highest demand of all Group models.
Deliveries in the Asia-Pacific region
From January to September 2020, the Volkswagen Group saw demand taper off in the overall market of the Asia-Pacific region, which witnessed a significant decline due primarily to the Covid-19 pandemic, handing over 10.0% fewer vehicles to customers than in the year before. The Group’s share of the passenger car market in this region expanded to 13.4 (12.6) %.
In China, the Volkswagen Group delivered 10.0% fewer vehicles to customers year-on-year in an overall market that had been significantly weakened, in particular by the spread of the SARS-CoV-2 virus. Following very high declines in volumes in the first quarter, we recorded a slight increase for the most part in the following months compared with the respective prior-year figure. The T-Cross and Teramont X from the Volkswagen Passenger Cars brand, the VA3 and VS5 from the JETTA brand, the Audi A6L and Audi Q8, the ŠKODA Kamiq GT and the Porsche Cayenne Coupé, all of which had been introduced as new or successor models over the course of the previous year, were in especially high demand. In addition, the Tayron and the Tharu from Volkswagen Passen-ger Cars, the Audi Q2L, Q2L e-tron and Q5, and the Porsche Panamera saloon saw encouraging growth in demand. The Tacqua, Viloran and Tayron X models from Volkswagen Pas-senger Cars, the VS7 from the JETTA brand, the Audi Q7 and
J F M A M J J A S O N D
400
500
600
700
800
900
1,000
1,100
400
500
600
700
800
900
1,000
1,100
2020201920202019
V O L K S W A G E N G R O U P D E L I V E R I E S B Y M O N T HVehicles in thousands

Business Development 14 Interim Management Report
Audi e-tron Sportback and the ŠKODA Rapid were successfully launched on the market as new or successor models in the reporting period.
In the strongly contracting Indian passenger car market, the Volkswagen Group saw 53.1% less demand in the first nine months of this year than in the prior-year period. The Polo from the Volkswagen brand and the Rapid from ŠKODA were the most sought-after Group models there.
In Japan, the number of Group models delivered to cus-tomers between January and September 2020 decreased by 17.3% year-on-year in a considerably weaker overall market. The Group model to record the highest demand was the Volkswagen T-Cross.
CO M M E R C I A L V E H I C L E D E L I V E R I E S
In the first nine months of 2020, the Volkswagen Group handed over 28.7% fewer commercial vehicles to customers worldwide than in the previous year. We delivered a total of 127,664 commercial vehicles to customers. Trucks accounted for 104,432 units (–31.8%) and buses for 11,840 units (–24.9%). A total of 11,392 (10,111) vehicles from the MAN TGE van series were delivered. The decline in the truck business was due to a slump in our core markets, which was exacerbated further in the first three quarters of 2020 by the ongoing uncertainty generated by the Covid-19 pandemic.
In the 27 EU states excluding Malta, but including the United Kingdom, Norway and Switzerland (EU27+3), sales were down by 36.1% on the same period of the previous year to a total of 68,545 units, of which 53,342 were trucks and 4,030 were buses. Here, the MAN brand delivered 11,173 light commercial vehicles.
In Russia, sales fell by 8.2% year-on-year to 5,368 units, including 5,182 trucks and 186 buses.
Between January and September 2020, deliveries in Turkey increased to 1,731 (417) vehicles. Trucks accounted for 1,536 units and buses for 99 units, while 96 vehicles from the MAN TGE van series were sold. In South Africa, deliveries of Volkswagen Group commercial vehicles decreased by 30.7% year-on-year to a total of 2,226 units; of this figure 1,985 were trucks and 241 were buses.
Sales in North America declined in the first three quarters of 2020 to 1,152 vehicles (– 50.0%), which were handed over exclusively to customers in Mexico; this included 859 trucks and 293 buses.
Deliveries in South America fell to a total of 35,077 vehi-cles (– 19.2%), of which 29,424 were trucks and 5,653 were buses. Sales in Brazil decreased by 23.4% in the first nine months of 2020. Of the units delivered, 25,257 were trucks and 4,001 were buses.
In the Asia-Pacific region, the Volkswagen Group sold 7,914 vehicles to customers in the reporting period; among these, 7,053 were trucks and 852 were buses. Overall, this was 15.2% less than in the previous year.
D E L I V E R I E S I N T H E P O W E R E N G I N E E R I N G S E G M E N T
Orders in the Power Engineering segment are usually part of major investment projects. Lead times range from just under one year to several years, and partial deliveries as construc-tion progresses are common. Accordingly, there is a time lag between incoming orders and sales revenue from the new construction business.
In the period from January to September 2020, sales revenue in the Power Engineering segment was largely driven by Engines & Marine Systems and Turbomachinery, which together generated more than two-thirds of overall sales revenue.
CO M M E R C I A L V E H I C L E D E L I V E R I E S TO C U STO M E R S B Y M A R K E T F R O M J A N UA RY 1 TO S E P T E M B E R 3 0 1
D E LI V E R I E S ( UN I T S) C H A N G E
2020 2019 (%)
Europe/Other markets 83,521 124,036 –32.7
of which: EU27+3 68,545 107,251 –36.1
of which: Germany 20,348 29,640 –31.3
Russia 5,368 5,850 –8.2
Turkey 1,731 417 x
South Africa 2,226 3,214 –30.7
North America 1,152 2,303 –50.0
of which: Mexico 1,152 2,302 –50.0
South America 35,077 43,421 –19.2
of which: Brazil 29,258 38,195 –23.4
Asia-Pacific 7,914 9,331 –15.2
Worldwide 127,664 179,091 –28.7
Scania 47,735 74,720 –36.1
MAN 79,929 104,371 –23.4
1 Prior-year deliveries have been updated to reflect subsequent statistical trends.

Interim Management Report 15Business Development
VO L K SWA G E N G R O U P F I N A N C I A L S E R V I C E S
The Financial Services Division includes the Volkswagen Group’s dealer and customer financing, leasing, banking and insurance activities, fleet management and mobility offer-ings. The division comprises Volkswagen Financial Services and the financial services activities of Scania and Porsche Holding Salzburg.
The Financial Services Division’s products and services were popular in the period from January to September 2020, though the Covid-19 pandemic weighed on demand. The number of new financing, leasing, service and insurance con-tracts signed worldwide decreased by 10.0% to 6.2 million. In the reporting period, the ratio of leased or financed vehicles to Group deliveries (penetration rate) in the Financial Ser-vices Division’s markets increased to 36.2 (34.9) % because the Group’s deliveries fell at a higher rate than the number of contracts signed. As of September 30, 2020, the total number of contracts was 23.8 (23.7) million, slightly higher than the year-end 2019 figure.
In Europe/Other Markets, the financial services business was impacted by the Covid-19 pandemic, particularly in the second quarter. Here, the number of new contracts signed in the reporting period fell short of the prior-year level at 4.6 (5.2) million. The total number of contracts at the end of September 2020 was 17.4 million. This was 0.5% fewer than on December 31, 2019. The customer financing/leasing area accounted for 7.6 million of these contracts (–1.5%).
In North America, 672 (716) thousand new contracts were signed in the first nine months of this year. At 3.1 million, the number of contracts as of the end of September 2020 was 1.7% higher than at the end of the previous year. The customer financing/leasing area recorded 1.9 (1.8) million contracts.
The South America region was impacted by the Covid-19 pandemic in the second and third quarter in particular. Here, the number of new contracts signed in the reporting period, at 207 (266) thousand, fell short of the figure for the prior-year period. At the end of September 2020, the total number of contracts was 704 (703) thousand, slightly higher than on December 31, 2019. The contracts mainly related to the customer financing/leasing area.
In Asia-Pacific, where the SARS-CoV-2 virus spread first, the number of new contracts signed between January and September 2020 rose by 4.1% to 724 thousand. The total num-ber of contracts as of September 30, 2020 was 2.5 million, 6.9% more than at the end of 2019. The customer finan-cing/leasing area accounted for 1.8 million contracts (+6.9%).
S A L E S TO T H E D E A L E R O R G A N I Z AT I O N
The Volkswagen Group’s unit sales to the dealer organization declined by 21.0% year-on-year in the first nine months of 2020 to 6,310,571 vehicles (including the Chinese joint ventures). The main reason for the decline was the negative impact of the Covid-19 pandemic. Ongoing uncertainty in connection with this and national measures introduced to contain the pandemic, such as mobility restrictions and closing stores, were accompanied by a fall in customer demand. Above-average decreases in demand were recorded especially in Europe and in North and South America. At 5,551,747 vehicles, unit sales outside Germany declined by 20.3% compared to the period from January to September 2019. In Germany, unit sales fell by 25.3% year-on-year. Vehicles sold in Germany as a proportion of overall sales decreased to 12.0 (12.7) %. P R O D U C T I O N
In the reporting period, the Volkswagen Group’s production declined by 23.4% year-on-year to a total of 6,107,235 vehicles due to the measures taken to stem the spread of the SARS-CoV-2 virus. The impact of national measures to contain the pandemic led to a disruption of supply chains and conse-quently to production stoppages within the Volkswagen Group. While the production figures for the locations in China saw a year-on-year recovery from the second quarter, the delayed impact of the Covid-19 pandemic at the other locations worldwide caused declines in production in all quarters. Production in Germany fell by 31.8% to 1,091,152 units. Production abroad decreased by 21.3% year-on-year to a total of 5,016,083 vehicles. The proportion of vehicles produced in Germany decreased to 17.9 (20.1) %. I N V E N TO R I E S
Global inventories at Group companies and in the dealer organization were lower on September 30, 2020 than at year-end 2019, and also below the corresponding prior-year figure. E M P L OY E E S
The Volkswagen Group had 635,265 active employees on September 30, 2020. A further 10,842 employees were in the passive phase of their partial retirement. In addition, there were 18,089 young people completing vocational trainee-ships. At the end of the third quarter of 2020, the Volkswagen Group had a total of 664,196 employees worldwide. Due to the market conditions and employees leaving the Group not being replaced, this was slightly below the year-end 2019 figure. At 294,883, the number of employees in Germany was also somewhat lower than the figure at the end of 2019.

Results of Operations, Financial Position and Net Assets 16 Interim Management Report
CO N T R I B U T I O N O F AU TO N O M O U S I N T E L L I G E N T D R I V I N G
On July 12, 2019, Volkswagen announced that, together with Ford Motor Company (Ford), it would be investing in Argo AI, a company that is working on the development of a system for autonomous driving. The investment involves the pro-vision of financial resources totaling USD 1.0 billion, spread over several years, and the contribution by Volkswagen of its consolidated subsidiary Autonomous Intelligent Driving (AID). Furthermore, Volkswagen acquired existing Argo AI shares from Ford for a purchase price of USD 500 million, payable in three equal annual installments. The transaction, including the contribution of AID, was executed as of June 1, 2020. After proportional profit elimination, the contribution of AID to Argo AI at fair value resulted in a non-cash gain of €0.8 billion, which was recognized in the other operating result. Argo AI will be accounted for as a joint venture and included in the consolidated financial statements using the equity method. S P E C I A L I T E M S
Special items consist of certain items in the financial state-ments whose separate disclosure the Board of Management believes can enable a better assessment of our economic performance.
In connection with the diesel issue, the operating result was affected by negative special items of €–0.7 (–1.3) billion in the Passenger Cars Business Area in the reporting period. These items resulted mainly from legal risks.
R E S U LT S O F O P E R AT I O N S O F T H E G R O U P
The Volkswagen Group generated sales revenue of €155.5 bil-lion in the first nine months of 2020, a decline of 16.7% compared with the previous year. Profit was weighed down especially by the decline in volumes resulting from the Covid-19 pandemic, while changes in exchange rates also had a negative effect. In contrast, mix effects and improved price positioning made a positive contribution. The Volkswagen Group generated 80.7 (80.4) % of its sales revenue abroad. Gross profit decreased to € 23.3 (36.4) billion; the gross margin stood at 15.0 (19.5) %.
In the period from January to September 2020, the Volks-wagen Group’s operating result before special items moved back into positive territory, at €2.4 (14.8) billion. The operating return on sales before special items declined to 1.5 (7.9) %. In particular, the negative impact of the spread of the Covid-19 pandemic was an adverse factor: in addition to
lower unit sales because of the fall in customer demand, turbulence in the commodity and capital markets meant that the fair value measurement of derivatives to which hedge accounting is not applied and the measurement of receiv-ables and liabilities denominated in foreign currencies had a negative effect. The contribution of AID to the joint venture Argo AI led to a gain of €0.8 billion. Special items in connec-tion with the diesel issue had a negative impact of €– 0.7 (– 1.3) billion on operating profit. A positive operating result of €1.7 (13.5) billion was achieved in the reporting period. The operating return on sales was at 1.1 (7.3) %.
Because of the spread of the SARS-CoV-2 virus, the finan-cial result was also lower than in the previous year, decreasing by €0.5 billion to €0.6 billion. The change in discount rates used to measure liabilities meant that interest expenses included in the financial result were down for measurement-related reasons. Changes in share prices weighed on net income from securities and funds. The share of the result of equity-accounted investments was lower than in the prior-year period; this was due primarily to the lower profit generated by the Chinese joint ventures, which were affected by Covid-19 mainly during the first quarter of 2020.
The Volkswagen Group’s profit before tax decreased by €12.4 billion to €2.3 billion in the reporting period. Profit after tax amounted to €1.7 (11.2) billion.
Results of operations in the Automotive Division
The Automotive Division generated sales revenue of €125.3 billion in the first nine months of 2020. The year-on-year decrease of 20.2% was mainly attributable to falling volumes as a result of the Covid-19 pandemic, as well as the negative effects of changes in exchange rates. Improvements in the mix and in price positioning had a beneficial impact. Sales revenue in the Passenger Cars and Commercial Vehicles business areas fell considerably short of the respective prior-year figures. In the Power Engineering Business Area, it was slightly down on the previous year; due to the nature of the business, there is sometimes a significant time lag between incoming orders and revenue recognition. Since our Chinese joint ventures are accounted for using the equity method, the Group’s business performance in the Chinese passenger car market is primarily reflected in the Group’s sales revenue only through deliveries of vehicles and vehicle parts.
The lower volumes resulted in a decrease in cost of sales, although its ratio to sales revenue went up year-on-year. Higher depreciation and amortization charges due to the
Results of Operations, Financial Position and Net Assets

Interim Management Report 17Results of Operations, Financial Position and Net Assets
R E S U LT S O F O P E R AT I O N S I N T H E PA S S E N G E R C A R S , CO M M E R C I A L
V E H I C L E S A N D P O W E R E N G I N E E R I N G B U S I N E S S A R E A S F R O M
J A N UA RY 1 TO S E P T E M B E R 3 0
€ million 2020 2019
Passenger Cars
Sales revenue 107,132 134,666
Operating result 185 10,103
Operating return on sales (%) 0.2 7.5
Commercial Vehicles
Sales revenue 15,419 19,491
Operating result –180 1,307
Operating return on sales (%) –1.2 6.7
Power Engineering
Sales revenue 2,749 2,873
Operating result –101 –98
Operating return on sales (%) –3.7 –3.4
large capex volume of previous years were set against lower research and development costs recognized in profit or loss. Total research and development costs as a percentage of the Automotive Division’s sales revenue (research and develop-ment ratio or R&D ratio) in the period from January to September 2020 increased to 8.1 (6.8) % compared to the prior-year period, due to the decline in sales revenue.
Distribution expenses were lower in the reporting period than a year earlier, but their ratio to sales revenue was up. There was a rise in both administrative expenses and their ratio to sales revenue. The other operating result stood at €–0.6 (–0.3) billion, reflecting mainly special items in connec-
tion with the diesel issue in an amount of €–0.6 (–1.3) billion. The item also includes the gain of €0.8 billion on the contribution of Autonomous Intelligent Driving (AID) to Argo AI, a company that is working on the development of a system for autonomous driving. Other adverse factors included above all the negative effects of the fair value measurement of derivatives to which hedge accounting is not applied and the measurement of receivables and liabilities denominated in foreign currencies, which had an impact of €–0.9 (0.3) billion.
The Automotive Division’s operating result amounted to €–0.1 billion in the first three quarters of 2020, €11.4 billion down on the previous year. The operating return on sales in the Automotive Division was –0.1 (7.2) % due to the negative effect of the Covid-19 pandemic, which impacted on unit sales, the fair value measurement of certain derivatives and the measurement of receivables and liabilities denominated in foreign currencies. Lower costs and the gain on the contribution of AID had a positive impact; negative special items were lower than in the previous year. The operating result before special items decreased to €0.6 (12.6) billion, while the operating return on sales before special items declined to 0.5 (8.0) %. Since the results of the Chinese joint ventures are accounted for in the financial result using the equity method, their business performance is primarily reflected in the operating result only through deliveries of vehicles and vehicle parts, and through license revenues. Results of operations in the Financial Services Division
Sales revenue in the Financial Services Division was €30.2 (29.6) billion in the reporting period, up slightly on the previous year’s figure. Because of the Financial Services Division’s business model, the negative effect of the Covid-19 pandemic on sales revenue is less severe here than in the Automotive Division.
20202019
Q1 Q2 Q3 Q4
20202019
–3,000
–1,500
0
1,500
3,000
4,500
6,000
O P E R A T I N G P R O F I T B E F O R E S P E C I A L I T E M S B Y Q U A R T E RVolkswagen Group in € million

Results of Operations, Financial Position and Net Assets 18 Interim Management Report
Cost of sales rose by €0.5 billion to €24.8 billion. When taken together, distribution expenses, administrative expenses and the other operating result were higher than in the previous year; their ratio to sales revenue also increased. The other operating result deteriorated mainly as a result of higher risk costs resulting from the pandemic. At €1.8 (2.2) billion, the Financial Services Division’s operating result fell short of the previous year’s level. The operating return on sales was 5.9 (7.5) %. F I N A N C I A L P O S I T I O N O F T H E G R O U P
In the reporting period, the Volkswagen Group’s gross cash flow was €21.1 billion, down €8.8 billion on the previous year due to earnings-related factors. The change in working capital amounted to €–2.8 (–17.1) billion. The Covid-19 pandemic led among other things to lower receivables in the financial services business, a decrease in inventories because of down-scaled production, a smaller increase in receivables, a decline in other provisions and a lower rise in liabilities. Cash outflows attributable to the diesel issue increased year-on-year. Cash flows from operating activities were up by €5.5 bil-lion to €18.3 billion.
Investing activities attributable to operating activities were down on the previous year at €11.8 (12.5) billion.
Mainly as a measure to boost gross liquidity, financing activities accounted for total cash inflows of €17.8 (0.7) bil-lion in the reporting period. Financing activities primarily include the issuance and redemption of bonds and changes in other financial liabilities. In June 2020, a dual-tranche hybrid bond of €3.0 billion was placed successfully. In September 2020, Volkswagen issued green bonds in an amount of €2 billion. Around two thirds of Volkswagen AG’s syndicated credit line of €10 billion had been drawn down as of the end of the reporting period. The previous year’s figure included the dividend paid to the shareholders of Volkswagen AG, the acquisition of MAN shares tendered as a result of the termi-nation of the control and profit and loss transfer agreement, and the cash inflow resulting from the IPO of TRATON.
The Volkswagen Group’s cash and cash equivalents reported in the cash flow statement stood at €45.1 (30.4) bil-lion at the end of the reporting period.
On September 30, 2020, the Volkswagen Group’s net liquidity was €–134.5 billion, compared with €–148.0 billion at the end of 2019.
Financial position of the Automotive Division
The Automotive Division’s gross cash flow decreased to €13.0 (22.3) billion in the first nine months of 2020 due primarily to the pandemic-related decline in profit. The dividend of the Chinese joint venture FAW-Volkswagen, which had not yet been resolved in the third quarter of 2019, had a positive influence compared with the previous year. The
change in working capital amounted to €0.2 (–1.4) billion. The Covid-19 pandemic led among other things to a decrease in inventories because of downscaled production, a smaller increase in receivables, a decline in other provisions and a lower rise in liabilities. Working capital, which underwent very different changes in the individual quarters due to the Covid-19 pandemic, normalized in the course of the nine-month period as a whole. Cash outflows resulting from the diesel issue were higher in the reporting period than in the previous year. At €13.2 billion, cash flows from operating activities were down €7.7 billion on the figure for 2019.
The Automotive Division’s investing activities attrib-utable to operating activities amounted to €11.8 billion in the first three quarters of 2020, €0.6 billion lower than the previous year. Investments in property, plant and equipment, investment property and intangible assets, excluding capitalized development costs (capex) declined by €1.8 bil-lion to €6.4 billion, reducing the ratio of capex to sales revenue to 5.1 (5.2) %. Capex was invested primarily in our production facilities and in models to be launched in 2020 and 2021, as well as in the ecological focus of our model range, the electrification and digitalization of our products and in our modular toolkits. The increase in capitalized development costs by €0.8 billion to €4.5 billion in the reporting period is primarily due to product impairment tests, which have had to be performed at brand level since the end of 2019. The “Acquisition and disposal of equity invest-ments” item went up by €0.5 billion to €1.1 billion as a result of strategic investments in a number of companies, in particular the joint venture Argo AI.
The Automotive Division’s net cash flow was €7.2 billion lower, at €1.4 billion.
Financing activities include the issuance and redemption of bonds and changes in other financial liabilities. In the period from January to September 2020, cash inflows totaled €14.2 billion. This helped boost gross liquidity and resulted in higher liabilities to banks. The figure includes, among other items, the green bonds of €2.0 billion issued in Septem-ber 2020. The dual-tranche hybrid bond with a principal amount of €3.0 billion, which was successfully issued via Volkswagen International Finance N.V. in June 2020, also led to a cash inflow. One tranche is a €1.5 billion bond that has a coupon of 3.5% and can first be called after five years, and the other is a €1.5 billion bond that has a coupon of 3.875% and can first be called after nine years. Both tranches have perpetual maturities and increase equity, net of transaction and other costs. An amount of €3.0 billion of the hybrid bond was eligible to be classified as a capital contribution and increased net liquidity. In the prior-year period, there had been a cash outflow of €7.0 billion due among other things to the dividend payment to the shareholders of Volkswagen AG, which this year was paid at the beginning of the fourth

Interim Management Report Results of Operations, Financial Position and Net Assets 19
F I N A N C I A L P O S I T I O N O F T H E PA S S E N G E R C A R S , CO M M E R C I A L
V E H I C L E S A N D P O W E R E N G I N E E R I N G B U S I N E S S A R E A S F R O M
J A N UA RY 1 TO S E P T E M B E R 3 0
€ million 2020 2019
Passenger Cars
Gross cash flow 11,607 19,566
Change in working capital 675 292
Cash flows from operating activities 12,282 19,858
Cash flows from investing activities attributable to operating activities –10,819 –13,303
Net cash flow 1,463 6,555
Commercial Vehicles
Gross cash flow 1,203 2,577
Change in working capital –535 –1,440
Cash flows from operating activities 669 1,137
Cash flows from investing activities attributable to operating activities –816 1,186
Net cash flow –148 2,323
Power Engineering
Gross cash flow 196 179
Change in working capital 24 –254
Cash flows from operating activities 221 –75
Cash flows from investing activities attributable to operating activities –119 –191
Net cash flow 102 –266
quarter, and the acquisition of MAN shares tendered as a result of the termination of the control and profit and loss transfer agreement with MAN SE; these outflows were set against a cash inflow resulting from the IPO of TRATON.
At the end of September 2020, the Automotive Division’s net liquidity stood at €24.8 billion compared to 21.3 billion on December 31, 2019.
Financial position of the Financial Services Division
In the period from January to September 2020, the Financial Services Division generated gross cash flow of €8.1 (7.6) bil-lion. As the level of funds tied up in working capital decreased due to the lower volume of business following the decline in demand related to the spread of coronavirus, , the change in working capital amounted to €–3.0 (–15.7) billion. Cash flows from operating activities rose to €5.1 (–8.2) billion.
At €0.0 (0.2) billion, investing activities attributable to operating activities were below the level of the previous year.
The Financial Services Division’s financing activities relate primarily to the issuance and redemption of bonds and other financial liabilities. There was a total cash inflow of
€3.7 billion in the first nine months of 2020, compared with €7.7 billion a year earlier.
At the end of September 2020, the Financial Services Divi-sion’s negative net liquidity, which is common in the indus-try, stood at €–159.3 billion, compared with €–169.3 billion at the end of 2019.
CO N S O L I DAT E D B A L A N C E S H E E T ST R U C T U R E
On September 30, 2020, the Volkswagen Group had total assets of €501.2 billion. The 2.7% rise compared with Decem-ber 31, 2019 is mostly attributable to the boost in gross liquidity and the successful issue of the hybrid bond in the second quarter of 2020. This was offset by exchange rate effects. The Group's equity amounted to €122.4 (123.7) bil-lion, giving it an equity ratio of 24.4 (25.3) %. Automotive Division balance sheet structure
At the end of the third quarter of 2020, the Automotive Division’s intangible assets were virtually on a level with those recorded on the 2019 balance sheet date. Exchange rate factors and depreciation in excess of additions led to a decrease in property, plant and equipment. Noncurrent as-sets declined by a total of 0.3% compared with the end of 2019.
Current assets increased by 14.9%. As a result of down-scaled production in response to the pandemic, the inven-tories included in this item were lower. Current other receivables and financial assets were higher than at the end of 2019. At €47.8 billion, total securities and cash and cash equi-valents in the Automotive Division exceeded the figure recorded at the end of 2019 by €14.6 billion.
Following the contribution of AID to the joint venture Argo AI, the “Assets held for sale” item consists of the carrying amount of the assets expected to be derecognized in connection with the sale of Renk, which occurred after the reporting date. The “Liabilities held for sale” item comprises the carrying amount of the corresponding liabilities expected to be derecognized.
At the end of the third quarter, the Automotive Division’s equity was slightly down on the figure as of December 31, 2019, at €91.4 (92.8) billion. The hybrid bond issued in June 2020, negative effects from the measurement of derivatives recognized directly in equity, and the profit generated led to an increase in equity. Currency translation, the dividend payment to the shareholders of Volkswagen AG resolved by the Annual General Meeting and higher actuarial losses from the measurement of pension plans reduced equity. Noncontrolling interests are primarily held by the noncontrolling interest shareholders of the TRATON GROUP.
Noncurrent liabilities declined by 1.0% compared with the end of December 2019 to €89.9 billion; the decrease in noncurrent financial liabilities included in this item was driven primarily by reclassifications from noncurrent to current liabilities to reflect shorter remaining maturities and by exchange rate effects. The green bonds issued in Sep-

Results of Operations, Financial Position and Net Assets 20 Interim Management Report
B A L A N C E S H E E T ST R U C T U R E O F T H E PA S S E N G E R C A R S ,
CO M M E R C I A L V E H I C L E S A N D P O W E R E N G I N E E R I N G B U S I N E S S
A R E A S
€ million Sept. 30, 2020 Dec. 31, 2019
Passenger Cars
Noncurrent assets 127,197 126,387
Current assets 91,399 75,459
Total assets 218,595 201,846
Equity 75,499 75,773
Noncurrent liabilities 78,911 78,679
Current liabilities 64,186 47,394
Commercial Vehicles
Noncurrent assets 24,057 25,143
Current assets 11,111 13,420
Total assets 35,168 38,563
Equity 13,090 14,115
Noncurrent liabilities 10,414 11,367
Current liabilities 11,665 13,081
Power Engineering
Noncurrent assets 2,024 2,206
Current assets 4,403 4,202
Total assets 6,427 6,408
Equity 2,765 2,885
Noncurrent liabilities 626 777
Current liabilities 3,037 2,746
tember led to a rise in this item. Pension provisions were up, mainly as a result of the actuarial remeasurement following a change in the discount rate.
At the end of the third quarter of 2020, current liabil- ities stood at €78.9 billion, €15.7 billion more than as of December 31, 2019. Current financial liabilities went up to €7.0 (–7.3) billion because of the reclassifications from noncurrent to current liabilities and the measures to boost gross liquidity. The figures for the Automotive Division also contain the elimination of intragroup transactions between the Automotive and Financial Services divisions. As the current financial liabilities for the primary Automotive Division were lower than the loans granted to the Financial Services Division at the end of 2019, a negative amount was disclosed. Current other liabilities were up compared with the end of 2019. This rise was mainly the result of the dividend distribution to the shareholders of Volkswagen AG, which was resolved by the Annual General Meeting as of the end of the
third quarter of 2020, and was not paid until the beginning of the fourth quarter of 2020.
The Automotive Division had total assets of €260.2 billion at the end of September 2020, 5.4% more than on Decem-ber 31, 2019.
Financial Services Division balance sheet structure
On September 30 of this year, the Financial Services Divi-sion’s total assets amounted to €241.0 (241.3) billion, and were thus on a level with December 31, 2019.
Noncurrent assets were down by a total of 3.5% compared with the end of 2019; the property, plant and equipment included in this item was virtually unchanged. While lease assets increased, noncurrent financial services receivables decreased because volumes and exchange rates were affected by the Covid-19 pandemic.
Current assets were higher than at the end of 2019. Conversely, current other receivables and financial assets as well as current financial services receivables were down because of the pandemic. Cash and cash equivalents in the Financial Services Division reached a level of €14.9 billion on September 30, 2020, an increase of €8.6 billion compared with December 31, 2019.
At the end of the reporting period, the Financial Services Division accounted for around 48.1 (49.4) % of the Volks-wagen Group’s assets.
The Financial Services Division’s equity, which amounted to €31.0 (30.9) billion, was virtually unchanged compared with December 31, 2019. Positive earnings were offset by negative exchange rate effects. The equity ratio was 12.9 (12.8) %.
An increase in other provisions and noncurrent financial liabilities led to an overall rise in noncurrent liabilities of 0.9%.
Current liabilities were lower than at the end of 2019, driven by a decline in current financial liabilities.
Deposits from the direct banking business decreased compared with the end of 2019, to €31.0 (32.5) billion. R E P O RT O N E X P E C T E D D E V E LO P M E N T S , R I S K S A N D
O P P O RT U N I T I E S
The global spread of the SARS-CoV-2 virus is bringing enor-mous disruption to all areas of everyday life and the economy. This is also combined with turbulence on the commodity and financial markets. The consequences, partic-ularly for the further development of individual economies and the world economy as a whole, cannot reliably be predicted at the current time. A second wave with growing numbers of new infections could also add to the strain and uncertainty. Despite this, we expect the economic recovery to continue for the remainder of 2020.
All areas of the Volkswagen Group are affected by the Covid-19 pandemic, especially sales due to a fall in customer

Interim Management Report Results of Operations, Financial Position and Net Assets 21
demand, as well as production and the supply chains. There are risks arising in particular from a sustained fall in demand and an increasing intensity of competition. These risks could be mitigated by government economic programs. We also envisage challenges, especially associated with production, specifically with regard to stable supply chains and protecting the health of our staff. We have put in place increased hygiene and protective measures to ensure plants can operate. The Volkswagen Group Board of Management expects a negative impact on business operations at all locations worldwide. As a result, we assume that we will not fulfill the initial expectations for some of the Group’s core performance indicators in fiscal year 2020.
We expect the Volkswagen Group’s deliveries to custom-ers, sales revenue and operating result to be below the previous year’s figures. In the Automotive Division, the R&D ratio will exceed the previous year’s level in 2020, despite counteracting measures, due to lower demand and therefore falling sales revenues, whereas we expect the ratio of capex to sales revenue to remain on a par with the previous year. In view of the lower customer demand, further payouts in relation to the diesel issue and cash outflows from mergers & acquisitions, we expect net cash flow for 2020 to be positive, yet significantly below the prior-year figure. Net liquidity in the Automotive Division will probably be around the prior-year level. We anticipate a positive return on investment (ROI) that will be below the prior-year figure due to earnings-related factors and below our defined minimum required rate of return on invested capital of 9%.
The outlook for fiscal year 2020 can be found on pages 24 and 25.
Diesel Issue
1. Criminal and administrative proceedings worldwide (excluding the USA/Canada) In May 2020, the criminal proceedings against the current Chairman of the Board of Management and a former member of its Board of Management (currently Chairman of the Supervisory Board) of Volkswagen AG regarding alleged market manipulation relating to capital market disclosure obligations in connection with the diesel issue were definitively terminated by the Braunschweig Regional Court against payment in each case of a court-imposed sum of €4.5 million, thereby also terminating to the same extent the proceedings against Volkswagen AG as collateral participant. In September 2020, the Braunschweig Regional Court permitted the charges still pending against a former Chairman of the Board of Management of Volkswagen AG and the related action against Volkswagen AG to go forward and opened the main trial proceedings.
In September 2020, the Braunschweig Regional Court also accepted the separate indictment of the same former Chairman of the Board of Management of Volkswagen AG and others on charges that include fraud in connection with the diesel issue involving type EA 189 engines and opened the main trial proceedings.
In June 2020, the Munich II Regional Court accepted the substantially unchanged indictment of the Munich II Office of the Public Prosecutor, which also names the former Chairman of the Board of Management of AUDI AG, and opened the main trial proceedings on charges of, among other things, fraud in connection with the diesel issue involving 3.0 l TDI engines. Trial proceedings commenced in September 2020.
In August 2020, the Munich II Office of the Public Prosecutor issued a further indictment charging three former Members of the Board of Management of AUDI AG and others with, among other things, fraud in connection with the diesel issue involving 3.0 l and 4.2 l TDI engines.
2. Product-related lawsuits worldwide (excluding the USA/ Canada) In April 2020, the court in Australia approved the class action settlement that the parties had agreed to.
On February 28, 2020, Volkswagen AG and Verbraucher-zentrale Bundesverband e.V. (Federation of Consumer Organi-zations) entered into an out of court settlement to terminate the consumer action for model declaratory judgment. The terms of the settlement require Volkswagen AG to offer individual settlements to consumers who registered claims under the action for model declaratory judgment and meet the settlement criteria. The volume of such settlements amounts to up to €830 million. Verbraucherzentrale Bundes-verband e.V. withdrew the action for model declaratory judgment on April 30, 2020. Volkswagen has entered into individual settlements with some 244 thousand customers in an aggregate amount of roughly €770 million.
In April 2020, the High Court in England and Wales ruled in the group litigation that the switch logic in the EA 189 engine constituted an unlawful defeat device; the court believed that it was also bound by the findings of the Kraftfahrtbundesamt (German Federal Motor Transport Authority) in this respect. In August 2020, the Court of Appeal rejected Volkswagen's appeal against the High Court's ruling on these preliminary questions; this decision is final. The question of liability on the part of Volkswagen was not a matter addressed by the High Court's ruling and will be dealt with at a later stage of the proceedings.
In April 2020, the Diesel Emissions Justice Foundation served an opt-out class action lawsuit on Volkswagen seeking monetary damages on behalf of Dutch consumers. A change in the law in the Netherlands that took effect on January 1, 2020 may permit consumers in the European Union to opt into the class action as well. How the new law might apply to this litigation is, however, unclear. The class action relates to vehicles with type EA 189 engines, among others.
In Germany, the Bundesgerichtshof (BGH – Federal Court of Justice) handed down in May 2020 its first decision ever in an individual product-related lawsuit in connection with the diesel issue. The BGH held that the buyer, who had purchased a vehicle with a type EA 189 engine prior to public disclosure of the diesel issue, had a claim for damages against Volks-

Results of Operations, Financial Position and Net Assets 22 Interim Management Report
wagen AG. While the buyer can require reimbursement of the vehicle's purchase price, he must accept a deduction for the benefit derived from using the vehicle and must return it to Volkswagen AG. The judgment clarified the BGH's stance on the fundamental issues underlying a large number of the some 65 thousand individual diesel lawsuits then still pending in Germany. On this basis, it has since been possible to conclude settlements and thus significantly reduce the number of individual lawsuits pending. In a series of funda-mental judgments rendered in July 2020, the BGH decided further legal issues of major importance for the litigation still pending with regard to vehicles with type EA 189 engines. The BGH held that plaintiffs who purchased their vehicle after the ad hoc announcement of September 22, 2015 have no claim for damages. The court furthermore ruled that purchasers of affected vehicles are not entitled to tort interest under § 849 of the German Civil Code. The court also made it clear that a plaintiff's potential damage claim may be com-pletely offset by the benefit derived from using the vehicle.
In September 2020, the French consumer organization Confédération de la Consommation, du Logement et du Cadre de Vie (CLCV) filed a class action against Volkswagen Group Automotive Retail France and Volkswagen AG for up to 950 thousand French owners and lessees of vehicles with type EA 189 engines. This is an opt-in proceeding in which the affected consumers are not required to opt into the class action until a legally final judgment is rendered.
3. Lawsuits filed by investors worldwide (excluding the USA/ Canada) In decisions handed down in March 2019, the Stuttgart Higher Regional Court refused to conduct additional investor actions for model declaratory judgment. These included an action for model declaratory judgment against Porsche SE and Volkswagen AG alleging violations of ad hoc disclosure obligations in connection with the diesel issue. The plaintiff side appealed the Stuttgart Higher Regional Court's rejection of this model case action to the Federal Court of Justice. In June 2020, the Federal Court of Justice remanded the matter to the Stuttgart Higher Regional Court for redecision on the determination of a model case plaintiff. In October 2020, the Stuttgart Higher Regional Court appointed the Wolver-hampton City Council, Administrating Authority for the West Midlands Metropolitan Authorities Pension Fund as model case plaintiff in these proceedings, in which Volkswagen AG is involved as a third party intervening in support of a party to the dispute.
4. Proceedings in the USA/Canada In February 2020, the Montana State Court dismissed certain of the environmental claims asserted by the Montana Attorney General, but allowed other claims to proceed. In August 2020, the Montana Supreme Court declined on procedural grounds to grant Volkswagen’s petition to review that decision. In March 2020, the Ohio Supreme Court, at Volkswagen’s request, agreed to hear an appeal of a lower court's decision concerning Ohio’s remaining claims. In June 2020, the US Court of Appeals for the Ninth Circuit partially reversed the trial court’s decision and held that Hillsborough County (Florida) and Salt Lake County (Utah) can proceed with a subset of their claims. In September 2020, the US Court of Appeals for the Ninth Circuit stayed proceedings in the litigation pending Volkswagen’s anticipated petition for review by the US Supreme Court.
In May 2020, the settlement program in the United States for Generation 2 3.0 l TDI vehicles ended.
In the environmental class action lawsuit seeking damages on behalf of the residents of the Province of Quebec, after authorizing the case to proceed as a class, a Quebec court ruled in June 2020 that a motion to dismiss by Volks-wagen is permissible at the present stage of the proceedings. Volkswagen noticed its motion in July 2020.
In the lawsuit brought by the SEC in March 2019 alleging claims under US federal securities law, the US District Court for the Northern District of California granted in part and denied in part Volkswagen’s motion to dismiss in August 2020. The claims dismissed by the court included all claims against VW Credit, Inc. related to asset-backed securities. In September 2020, the SEC filed an amended complaint that, among other things, removed the dismissed claims.
The term of the Independent Compliance Monitor retained pursuant to the Plea Agreement expired in Septem-ber 2020, whereas that of the Independent Compliance Auditor under the Third Partial Consent Decree and the Third California Partial Consent Decree ended earlier, in June 2020.
5. Additional proceedings In the proceedings regarding appointment of a special auditor for Volkswagen AG, the Celle Higher Regional Court issued a ruling in April 2020 appointing a special auditor other than the one originally named. The decision of the Higher Regional Court of Celle is formally unappealable. Volkswagen AG has filed a constitutional complaint with the Federal Constitutional Court contesting this decision as well on grounds of infringement of its constitutionally guaran-

Interim Management Report Results of Operations, Financial Position and Net Assets 23
teed rights and has suggested joinder of this matter with its initial constitutional complaint against the decision to appoint the special auditor. The constitutional complaint has no suspensory effect, however. Additional important legal cases
In the tax litigation between the Brazilian tax authorities and MAN Latin America, the amount at risk remains unchanged at BRL 3.1 billion. Due to exchange rate fluctuations, the risk in euros as contained in the notes under contingent liabilities has declined from €0.7 billion to €0.5 billion. In connection with the factual matters that in principle also underlie the antitrust proceedings instituted by the European Commission against Volkswagen AG, AUDI AG, and Dr. Ing. h.c. F. Porsche AG in April 2019, the South Korean competi-tion authority searched the premises of Audi Volkswagen South Korea and Porsche South Korea in May 2020 and issued requests for information to Volkswagen AG, AUDI AG, and Dr. Ing. h.c. F. Porsche AG. Furthermore, the Turkish competi-tion authority commenced proceedings in the same matter in July 2020. In March 2020, the US District Court for the Northern District of California dismissed two amended class action complaints brought by purchasers of German luxury vehicles alleging that several automobile manufacturers, including Volks-wagen AG and other Group companies, conspired to unlaw-fully increase the prices of German luxury vehicles in violation of US antitrust and consumer protection law. The court held that the plaintiffs have not stated a claim for relief because the allegations in the complaints do not plausibly support that the alleged agreements unreasonably restrained competition in violation of US law. The court granted plaintiffs leave to file amended complaints with respect to a limited subset of plaintiffs’ original claims. Plaintiffs filed a second set of amended complaints in June 2020, which defendants moved to dismiss in August 2020. In October 2020, the court granted defendants’ motion and dismissed
with prejudice the amended complaints in their entirety. Plaintiffs may appeal this ruling. In February 2020, the US District Court for the Northern District of California granted final approval of a class action settlement resolving civil claims relating to approximately 98 thousand Volkswagen, Audi, Porsche and Bentley vehicles with automatic transmissions. In October 2020, plaintiffs filed three complaints in the US District Court for the Northern District of California, seeking to represent a putative class of US purchasers and lessees of certain Porsche gasoline-powered vehicles. The defendants include Volkswagen AG, Dr. Ing. h.c. F. Porsche AG, AUDI AG, and Porsche Cars North America, Inc.; each defendant is not named in all the complaints. The complaints allege that the affected vehicles used certain software and/or hardware that resulted in increased emissions and/or overstated fuel economy estimates as compared to the results of certification testing. Beyond this, there were no significant changes in the reporting period compared with the disclosures on the Volks-wagen Group’s expected development in fiscal year 2020 contained in the combined management report in the 2019 Annual Report, specifically in the chapters “Report on Expected Developments” and “Report on Risks and Oppor-tunities,” including the section “Legal risks.” In particular, based on the information as it exists and has been established, there continue to be no conclusive findings or assessments available to the Board of Management of Volks-wagen AG regarding the described facts that would suggest that a different assessment of the associated risks should have been made.
In line with IAS 37.92, no further statements have been made concerning estimates of financial impact or about uncertainty regarding the amount or maturity of provisions and contingent liabilities in relation to the legal risks. This is so as to not compromise the results of the proceedings or the interests of the Company.
This report contains forward-looking statements on the business development of theVolkswagen Group. These statements are based on assumptions relating to thedevelopment of the economic and legal environment in individual countries and economicregions, and in particular for the automotive industry, which we have made on the basis ofthe information available to us and which we consider to be realistic at the time of goingto press. The estimates given entail a degree of risk, and actual developments may differfrom those forecast. Any changes in significant parameters relating to our key salesmarkets, or any significant shifts in exchange rates or raw materials relevant to the
Volkswagen Group, will have a corresponding effect on the development of our business.The same applies should the actual effects of the Covid-19 pandemic differ from thescenario assumed in this report. In addition, expected business development may vary ifthe assessments of the factors influencing sustainable value enhancement, as well as risksand opportunities presented in the 2019 Annual Report develop in a way other than weare currently expecting, or additional risks and opportunities or other factors emerge thataffect the development of our business.

Outlook 24 Interim Management Report
The Volkswagen Group Board of Management anticipates a negative growth rate in the world economy in 2020 as a result of the spread of the SARS-CoV-2 virus. We also continue to believe that risks will arise from protectionist tendencies, turbulence in the financial markets and structural deficits in individual countries. In addition, growth prospects will be negatively impacted by continuing geopolitical tensions and conflicts. We expect both the advanced economies and the emerging markets to experience a marked decline in eco-nomic performance. Despite this, we expect the economic recovery to continue for the remainder of 2020.
In response to the Covid-19 pandemic, we have developed scenarios for the development of the passenger car markets in individual regions in 2020 which, for example, also take account of the trends currently being experienced in China. The scenarios reflect the differing temporal spread of the Covid-19 pandemic in the various geographic regions. In all, we expect the volume of global demand for new vehicles in 2020 to be between 15 and 20% lower than it was the pre-vious year. In Western Europe, we anticipate a fall of around 25% in the volume of new passenger car registrations in 2020 compared to the prior year. After the drastic decline at the beginning of the second quarter, there was a recovery in the months that followed, and by the end of the reporting period, the prior-year figure was even equaled in individual months. We believe that the fourth quarter of 2020 will witness a sideways movement in the market, keeping volumes dis-tinctly below the previous year’s level. Following the slump in the second quarter and the recovery in the third quarter, we also project a sideways trend in the passenger car markets of Central and Eastern Europe for the last three months of the year, leading to a considerable drop compared with the prior-year figure. We expect that the number of vehicles sold there in 2020 will probably be down around 20% year-on-year. The volume of demand in the markets for passenger cars and light commercial vehicles (up to 6.35 tonnes) in North America in 2020 is likely to be 20 to 25% lower than in the prior year. We anticipate that following the drastic decline at the beginning of the second quarter and a steady recovery in subsequent
months, reaching the prior-year level in September, the market will weaken substantially in the last quarter of 2020. We expect to see new registrations of passenger cars and light commercial vehicles in the South American markets fall by up to 35% in 2020 compared with the previous year. Following the drastic decline in the second quarter and a strong upward trend in the third quarter, the fourth quarter will probably see the market move sideways at the level reached in the third quarter, whereby it will still not return to the prior-year figures. The passenger car markets in the Asia-Pacific region are likely to be between 10 and 15% below the prior-year level in 2020. After the very sharp decline in the first three months, the rapid rebound in the second quarter and a return to prior-year levels in the third quarter, we expect performance in the last quarter of 2020 to be down moderately on the previous year.
Trends in the markets for light commercial vehicles in the individual regions will also be mixed in 2020; on the whole, we anticipate a significant fall in demand due to Covid-19.
In the markets relevant for the Commercial Vehicles Business Area, we expect a sharp to very sharp year-on-year fall in 2020 in new registrations for both mid-sized and heavy trucks with a gross weight of more than six tonnes and for buses.
In our view, automotive financial services will again be very important for vehicle sales worldwide in 2020.
Our brand diversity, our presence in all major world markets, our broad and selectively expanded product range, and our technologies and services put us in a good com-petitive position worldwide. As part of the transformation of our core business, we are positioning our Group brands with an even stronger focus on their individual characteristics, and are optimizing the vehicle and drive portfolio. The focus is primarily on our vehicle fleet’s carbon footprint and on the most attractive and fastest-growing market segments. In addition, we are working to leverage the advantages of our multibrand Group even more effectively with the ongoing development of new technologies and the enhancement of our toolkits.
Outlook

Interim Management Report Outlook 25
We anticipate that deliveries to Volkswagen Group customers will be significantly down on the previous year in 2020 due to the impact of the Covid-19 pandemic.
Challenges will also arise particularly from the increasing intensity of competition, volatile commodity and foreign exchange markets and more stringent emissions-related requirements.
We expect the sales revenue of the Volkswagen Group and its business areas – with the exception of the Financial Services Division – to fall significantly below the previous year’s level in 2020 as a result of the Covid-19 pandemic. We anticipate a severe year-on-year decline in the operating result before and including special items for the Volkswagen
Group and its Passenger Cars Business Area as well as in the operating result for the Commercial Vehicles Business Area. In the Power Engineering Business Area and in the Financial Services Division, we expect the pandemic to have less of an impact on the operating result in 2020 due to their business models. For the Power Engineering Business Area, we anticipate a significantly higher operating loss than that of the previous year. For the Financial Services Division we forecast sales revenue on a level with the previous year and a significant drop in the operating result year-on-year. Overall, we expect the operating result for the Volkswagen Group for 2020 before and including special items to be in positive territory.

26 Brands and Business Fields
S A L E S R E V E N U E A N D O P E R AT I N G P R O F I T B Y B R A N D A N D B U S I N E S S F I E L D
Between January and September 2020, the Covid-19 pandemic had a strong impact on business at the Volkswagen Group and its brands; this led to lower figures in terms of unit sales, sales revenue and profit throughout the Group. The Group’s sales revenue declined to €155.5 (186.6) billion. Operating profit before special items fell to €2.4 (14.8) billion. The diesel issue gave rise to special items of €–0.7 (–1.3) billion in the first nine months of this year.
The Volkswagen Passenger Cars brand sold 1.9 (2.8) mil-lion vehicles in the reporting period; this represented a 31.1% decrease on the previous year. Sales of the T-Cross launched in the previous year increased, thus bucking the trend, and the new Atlas Cross Sport was also very popular. At €47.2 billion, sales revenue was 27.9% lower than in the previous year. The operating result before special items decreased to €–1.0 (3.2) billion. Lower fixed costs and better price positioning were unable to compensate for the impact of lower volumes due to the Covid-19 pandemic nor for negative exchange rate effects. The diesel issue gave rise to special items of €–0.6 (–0.7) billion in the reporting period.
Sales by the Audi brand declined to 682 (900) thousand vehicles worldwide in the first nine months of 2020. A further 475 (430) thousand Audi vehicles were sold through the Chinese joint venture FAW-Volkswagen. The Q3, A6 and e-tron models saw increasing demand. Sales revenue fell to €33.3 (41.3) billion. The decrease in volumes, the impact of the measurement of certain derivatives as well as negative exchange rate effects and larger sales incentives reduced operating profit (current-year figure before special items) to €0.2 (3.2) billion. Lower fixed and development costs and the
deconsolidation effect from the divestment of Autonomous Intelligent Driving GmbH (AID) had a positive effect. The diesel issue resulted in special items of €–0.1 billion in the reporting period. The financial key performance indicators for the Audi brand include the Lamborghini and Ducati brands. Ducati sold 34,160 (42,506) motorcycles in the first three quarters.
In the period from January to September 2020, the ŠKODA brand sold 596 thousand vehicles, a decrease of 25.9% com-pared to the prior-year period. The new Scala, Kamiq and Octavia Combi models were especially popular with custom-ers. Sales revenue came to €12.0 (14.8) billion, while operating profit declined to €469 (1,175) million. Lower volumes due to Covid-19, negative exchange rate effects and emissions-related expenses were offset by a reduction of fixed and development costs as well as product cost optimizations.
The SEAT brand sold 319 thousand vehicles in the reporting period, a decrease of 38.3% on the previous year. This figure includes the A1 manufactured for Audi. The Arona and Ateca SUV models and the Leon were in high demand. Sales revenue stood at €6.0 billion, a decline of 31.5% compared with the previous year. The operating result fell to €–290 (248) million, mainly due to lower volumes as a result of the pandemic. Emissions-related expenses were also an adverse factor.
At 7,610 (7,224) units, sales by the Bentley brand were higher in the first nine months of 2020 than in 2019. Sales revenue rose to €1,397 (1,306) million on the back of volume effects. The operating result decreased to € – 52 (65) million, mainly due to higher depreciation and amortization charges, one-off expenses for restructuring measures and exchange rate effects.
Brands and Business Fields

Brands and Business Fields 27
Porsche Automotive sold 181 thousand vehicles worldwide in the reporting period, thus falling 11.6% short of the prior-year figure. Sales revenue amounted to €17.5 (18.7) billion. Operating profit decreased to €1.9 (3.2) billion (prior-year figure before special items); however, a two-digit return on sales of 10.8% was achieved. The decrease in operating profit was attributable to lower vehicle sales as well as to cost increases, especially for digitalization and electrification. In addition, changes in exchange rates had a negative effect.
Unit sales by Volkswagen Commercial Vehicles fell to 250 (344) thousand vehicles worldwide between January and September 2020. Sales revenue amounted to €6.7 billion, a decrease of 23.8% year-on-year. The operating result declined to €–362 (497) million as a consequence of lower demand and the CO2 tax that entered into force this year. Moreover, higher upfront expenditures and write-downs for new products, increases in fixed costs as well as less favorable exchange rates had a negative effect on the operating result, while product cost optimizations and mix effects had a positive impact.
Scania Vehicles and Services sold 49 (76) thousand vehicles in the first nine months of 2020. Sales revenue amounted to €8.1 (10.4) billion. The operating profit of Scania Vehicles and Services decreased to €419 (1,209) million. Improvements in the mix and lower fixed and development costs were unable to make up for lower volumes and negative exchange rate effects.
MAN Commercial Vehicles sold 80 thousand units in the reporting period; this was 23.4% fewer than a year earlier. Sales revenue declined to €7.5 (9.2) billion. At €–461 (297) mil-lion, the operating result fell short of the prior-year figure, mainly due to the lower volume of new vehicles, a difficult used vehicle business and costs incurred in connection with the introduction of the new generation of trucks.
Power Engineering generated sales revenue of €2.7 (2.9) bil-lion in the first three quarters of 2020. Operating profit declined to €66 (91) million due to volume effects as well as changes in exchange rates. Cost reductions and mix effects had a positive impact.
K E Y F I G U R E S B Y B R A N D A N D B U S I N E S S F I E L D F R O M J A N UA RY 1 TO S E P T E M B E R 3 0
V E H I C LE SA LE S S A L E S R E V E N U E O P E R A T I N G R E S U LT
Thousand vehicles/€ million 2020 2019 2020 2019 2020 2019
Volkswagen Passenger Cars 1,896 2,754 47,184 65,447 –969 3,152
Audi 682 900 33,264 41,332 221 3,239
ŠKODA 596 805 12,038 14,811 469 1,175
SEAT 319 517 6,043 8,828 –290 248
Bentley 8 7 1,397 1,306 –52 65
Porsche Automotive1 181 205 17,482 18,666 1,884 3,200
Volkswagen Commercial Vehicles 250 344 6,674 8,756 –362 497
Scania Vehicles and Services2 49 76 8,094 10,427 419 1,209
MAN Commercial Vehicles 80 104 7,461 9,175 –461 297
Power Engineering – – 2,749 2,873 66 91
VW China3 2,462 2,815 – – – –
Other4 –211 –543 –15,494 –22,949 –176 –411
Volkswagen Financial Services – – 28,595 27,946 1,632 2,035
Volkswagen Group before special items – – – – 2,380 14,795
Special items – – – – –687 –1,257
Volkswagen Group 6,311 7,983 155,486 186,617 1,693 13,539
Automotive Division5 6,311 7,983 125,301 157,031 –95 11,313
of which: Passenger Cars Business Area 6,182 7,803 107,132 134,666 185 10,103
Commercial Vehicles Business Area 129 180 15,419 19,491 –180 1,307
Power Engineering Business Area – – 2,749 2,873 –101 –98
Financial Services Division – – 30,185 29,587 1,789 2,226
1 Porsche (including Financial Services): sales revenue €19,406 (20,490) million, operating profit before special items €2,011 (3,346) million. 2 Scania (including Financial Services): sales revenue €8,416 (10,762) million, operating profit €501 (1,314) million. 3 The sales revenues and operating profits of the joint venture companies in China are not included in the figures for the Group.
These Chinese companies are accounted for using the equity method and recorded a proportionate operating profit of €2,632 (3,187) million. 4 In operating profit, mainly intragroup items recognized in profit or loss, in particular from the elimination of intercompany profits; the figure includes depreciation and amortization of
identifiable assets as part of purchase price allocation, as well as companies not allocated to the brands. 5 Including allocation of consolidation adjustments between the Automotive and Financial Services divisions.

28 Brands and Business Fields
The number of new financing, leasing, service and insurance contracts with Volkswagen Financial Services signed between January and September 2020 was 5.7 (6.3) million (–9.1%). The penetration rate, expressed as the ratio of leased or financed vehicles to relevant Group delivery volumes, rose to 35.9 (34.5)% with credit eligibility criteria remaining unchanged. This was because the Group’s deliveries fell at a higher rate than the number of contracts signed. The total number of contracts as of September 30, 2020 was 21.6 million, up from 21.5 million at the end of 2019. The number of contracts in the customer financing/leasing area amounted 11.3 (11.2) mil-lion, while it was 10.4 (10.3) million in the service/insurance area. As of the end of the reporting period, Volkswagen Bank managed 1.4 (1.4) million deposit accounts. Operating profit decreased to €1.6 (2.0) billion in the first nine months of 2020 due to risk costs. U N I T S A L E S A N D S A L E S R E V E N U E B Y M A R K E T
In the reporting period, the Volkswagen Group sold 2.7 mil-lion vehicles in the Europe/Other markets region, 24.9% fewer than in the previous year. The impact of the Covid-19 pandemic acted as a drag on business, particularly from the end of the first quarter onwards. Sales revenue declined to €93.8 (113.9) billion due to the fall in demand. Moreover, exchange rate effects had a negative impact, while mix effects made a positive contribution.
In the North American markets, the negative effects caused by the spreading of the SARS-CoV-2 virus became apparent somewhat later, namely at the beginning of the second quar-ter. There, sales by the Volkswagen Group decreased by 31.5% between January and September 2020 to a total of 505 thou-sand units. Sales revenue declined to €25.8 (32.9) billion.
Unit sales in South America came to 322 (445) thousand vehicles in the first nine months of this year. The Covid-19 pandemic dampened demand in the second and third quarter in particular. Declining volumes and an unfavorable exchange rate trend reduced sales revenue to €5.9 (8.4) bil-lion.
In the Asia-Pacific region, the first to be affected by the Covid-19 pandemic at the beginning of the year, demand increased again as the year went on. Unit sales by the Volks-wagen Group – including the Chinese joint ventures – stood at 2.8 (3.2) million vehicles in the reporting period. Sales revenue fell to €30.4 (31.3) billion as a result of lower volumes and exchange rate effects. This figure does not include the sales revenue of our equity-accounted Chinese joint ventures.
In the first three quarters of 2020, hedging transactions relating to sales revenue in foreign currency had a negative impact of €–0.5 (+0.1) billion on sales revenue in the Volks-wagen Group.
K E Y F I G U R E S B Y M A R K E T F R O M J A N UA RY 1 TO S E P T E M B E R 3 0
V E H I C LE SA LE S S A L E S R E V E N U E
Thousand vehicles/€ million 2020 2019 2020 2019
Europe/Other markets 2,726 3,630 93,838 113,926
North America 505 737 25,845 32,878
South America 322 445 5,879 8,433
Asia-Pacific1 2,757 3,171 30,380 31,310
Hedges on sales revenue – – –456 71
Volkswagen Group1 6,311 7,983 155,486 186,617
1 The sales revenue of the joint venture companies in China is not included in the figures for the Group and the Asia-Pacific market.

Interim Consolidated Financial Statements (Condensed) 29Income Statement
Income Statement for the Period January 1 to September 30
V O L K S W A G E N G R OU P D I V I S I ON S
A U T OM O T I V E ¹ F I N A N C I A L SE R V I C E S
€ million 2020 2019 2020 2019 2020 2019
Sales revenue 155,486 186,617 125,301 157,031 30,185 29,587Cost of sales –132,156 –150,237 –107,356 –125,981 –24,800 –24,255Gross result 23,330 36,381 17,945 31,050 5,385 5,331Distribution expenses –12,860 –15,093 –11,961 –13,924 –899 –1,169Administrative expenses –7,214 –6,836 –5,505 –5,469 –1,709 –1,367Other operating income/expense –1,563 –913 –574 –343 –989 –570Operating result 1,693 13,539 –95 11,313 1,789 2,226Share of the result of equity-accounted investments 2,019 2,595 1,963 2,543 55 52Interest result and other financial result –1,458 –1,497 –1,427 –1,478 –31 –18Financial result 561 1,099 536 1,065 24 34Earnings before tax 2,254 14,637 441 12,378 1,813 2,259Income tax expense –523 –3,484 –46 –2,954 –477 –530Earnings after tax 1,731 11,154 396 9,424 1,336 1,730of which attributable to Noncontrolling interests –37 85 –81 33 45 52 Volkswagen AG hybrid capital investors 386 404 386 404 – – Volkswagen AG shareholders 1,382 10,664 91 8,986 1,291 1,678 Basic/diluted earnings per ordinary share in €² 2.73 21.25 Basic/diluted earnings per preferred share in €² 2.79 21.31
1 Including allocation of consolidation adjustments between the Automotive and Financial Services divisions. 2 Explanatory information on earnings per share is presented in the “Earnings per share” section.
Interim Consolidated Financial Statements (Condensed)

Statement of Comprehensive Income 30 Interim Consolidated Financial Statements (Condensed)
Statement of Comprehensive Income for the Period January 1 to September 30
€ million 2020 2019
Earnings after tax 1,731 11,154
Pension plan remeasurements recognized in other comprehensive income Pension plan remeasurements recognized in other comprehensive income, before tax –2,111 –9,798Deferred taxes relating to pension plan remeasurements recognized in other comprehensive income 666 2,890
Pension plan remeasurements recognized in other comprehensive income, net of tax –1,444 –6,908Fair value valuation of other participations and securities (equity instruments) that will not be reclassified to profit or loss, net of tax –15 –22Share of other comprehensive income of equity-accounted investments that will not be reclassified to profit or loss, net of tax 20 14Items that will not be reclassified to profit or loss –1,438 –6,915
Exchange differences on translating foreign operations Unrealized currency translation gains/losses –2,909 421Transferred to profit or loss 15 –Exchange differences on translating foreign operations, before tax –2,894 421Deferred taxes relating to exchange differences on translating foreign operations 4 11
Exchange differences on translating foreign operations, net of tax –2,890 432Hedging Fair value changes recognized in other comprehensive income (OCI I) 2,985 –1,592Transferred to profit or loss (OCI I) –858 –664Cash flow hedges (OCI I), before tax 2,127 –2,256Deferred taxes relating to cash flow hedges (OCI I) –644 651
Cash flow hedges (OCI I), net of tax 1,483 –1,605Fair value changes recognized in other comprehensive income (OCI II) –708 –1,183Transferred to profit or loss (OCI II) 966 759Cash flow hedges (OCI II), before tax 258 –424Deferred taxes relating to cash flow hedges (OCI II) –73 126
Cash flow hedges (OCI II), net of tax 185 –298Fair value valuation of receivables and securities (debt instruments) that may be reclassified to profit or loss Fair value changes recognized in other comprehensive income 34 69Transferred to profit or loss 1 0Fair value valuation of receivables and securities (debt instruments) that may be reclassified to profit or loss, before tax 35 69Deferred taxes relating to fair value valuation of receivables and securities (debt instruments) recognized in other comprehensive income –10 –21
Fair value valuation of receivables and securities (debt instruments) that may be reclassified to profit or loss, net of tax 25 48Share of other comprehensive income of equity-accounted investments that may be reclassified to profit or loss, net of tax –203 111Items that may be reclassified to profit or loss –1,400 –1,312
Other comprehensive income, before tax –2,781 –11,883Deferred taxes relating to other comprehensive income –57 3,656
Other comprehensive income, net of tax –2,838 –8,227Total comprehensive income –1,107 2,927of which attributable to
Noncontrolling interests –108 62Volkswagen AG hybrid capital investors 386 404Volkswagen AG shareholders –1,386 2,460

Interim Consolidated Financial Statements (Condensed) 31Income Statement
Income Statement for the Period July 1 to September 30
V O L K S W A G E N G R OU P D I V I S I ON S
A U T OM O T I V E ¹ F I N A N C I A L SE R V I C E S
€ million 2020 2019 2020 2019 2020 2019
Sales revenue 59,355 61,420 48,285 50,905 11,070 10,515Cost of sales –48,928 –49,782 –39,797 –41,098 –9,132 –8,685Gross result 10,427 11,638 8,489 9,807 1,939 1,830Distribution expenses –4,508 –5,096 –4,194 –4,701 –314 –395Administrative expenses –2,354 –2,313 –1,701 –1,870 –652 –443Other operating income/expense –382 313 49 489 –431 –176Operating result 3,183 4,541 2,642 3,724 541 817Share of the result of equity-accounted investments 855 996 822 974 33 23Interest result and other financial result –432 –458 –423 –418 –10 –40Financial result 423 539 399 556 24 –17Earnings before tax 3,606 5,080 3,041 4,280 565 800Income tax expense –856 –1,094 –739 –960 –117 –134Earnings after tax 2,751 3,986 2,302 3,320 448 666of which attributable to Noncontrolling interests 21 61 12 40 9 21 Volkswagen AG hybrid capital investors 147 136 147 136 – – Volkswagen AG shareholders 2,583 3,789 2,144 3,144 439 645 Basic/diluted earnings per ordinary share in €² 5.17 7.56 Basic/diluted earnings per preferred share in €² 5.12 7.56
1 Including allocation of consolidation adjustments between the Automotive and Financial Services divisions. 2 Explanatory information on earnings per share is presented in the “Earnings per share” section.

Statement of Comprehensive Income 32 Interim Consolidated Financial Statements (Condensed)
Statement of Comprehensive Income for the Period July 1 to September 30
€ million 2020 2019
Earnings after tax 2,751 3,986
Pension plan remeasurements recognized in other comprehensive income Pension plan remeasurements recognized in other comprehensive income, before tax –2,004 –3,304Deferred taxes relating to pension plan remeasurements recognized in other comprehensive income 607 977
Pension plan remeasurements recognized in other comprehensive income, net of tax –1,397 –2,327Fair value valuation of other participations and securities (equity instruments) that will not be reclassified to profit or loss, net of tax –1 –38Share of other comprehensive income of equity-accounted investments that will not be reclassified to profit or loss, net of tax 14 –4Items that will not be reclassified to profit or loss –1,384 –2,370
Exchange differences on translating foreign operations Unrealized currency translation gains/losses –1,046 314Transferred to profit or loss 0 –Exchange differences on translating foreign operations, before tax –1,046 314Deferred taxes relating to exchange differences on translating foreign operations 0 –1
Exchange differences on translating foreign operations, net of tax –1,046 313Hedging Fair value changes recognized in other comprehensive income (OCI I) 1,051 –1,335Transferred to profit or loss (OCI I) –370 –144Cash flow hedges (OCI I), before tax 682 –1,479Deferred taxes relating to cash flow hedges (OCI I) –194 421
Cash flow hedges (OCI I), net of tax 488 –1,059Fair value changes recognized in other comprehensive income (OCI II) –44 –293Transferred to profit or loss (OCI II) 307 263Cash flow hedges (OCI II), before tax 263 –31Deferred taxes relating to cash flow hedges (OCI II) –90 10
Cash flow hedges (OCI II), net of tax 173 –21Fair value valuation of receivables and securities (debt instruments) that may be reclassified to profit or loss Fair value changes recognized in other comprehensive income 12 17Transferred to profit or loss 0 0Fair value valuation of receivables and securities (debt instruments) that may be reclassified to profit or loss, before tax 13 17Deferred taxes relating to fair value valuation of receivables and securities (debt instruments) recognized in other comprehensive income –4 –5
Fair value valuation of receivables and securities (debt instruments) that may be reclassified to profit or loss, net of tax 9 12Share of other comprehensive income of equity-accounted investments that may be reclassified to profit or loss, net of tax –132 53Items that may be reclassified to profit or loss –508 –701
Other comprehensive income, before tax –2,211 –4,473Deferred taxes relating to other comprehensive income 320 1,402
Other comprehensive income, net of tax –1,892 –3,071Total comprehensive income 859 915of which attributable to
Noncontrolling interests –2 43Volkswagen AG hybrid capital investors 147 136Volkswagen AG shareholders 714 736

Interim Consolidated Financial Statements (Condensed) 33Balance Sheet
Balance Sheet as of September 30, 2020 and December 31, 2019
V O L K S W A G E N G R OU P D I V I S I ON S
A U T OM O T I V E ¹ F I N A N C I A L SE R V I C E S
€ million 2020 2019 2020 2019 2020 2019
Assets Noncurrent assets 295,035 300,608 153,277 153,736 141,758 146,873Intangible assets 66,560 66,214 66,388 66,010 171 204Property, plant and equipment 62,717 66,152 61,600 65,043 1,118 1,110Lease assets 49,412 48,938 1,557 2,084 47,855 46,853Financial services receivables 80,124 86,973 –390 –390 80,514 87,363Investments, equity-accounted investments and other equity investments, other receivables and financial assets 36,221 32,331 24,121 20,989 12,100 11,342Current assets 206,194 187,463 106,913 93,081 99,281 94,382Inventories 43,504 46,742 39,250 41,898 4,254 4,844Financial services receivables 56,121 58,615 –462 –640 56,584 59,255Other receivables and financial assets 39,536 38,620 19,485 17,803 20,051 20,817Marketable securities 20,672 16,769 17,138 13,546 3,533 3,223Cash, cash equivalents and time deposits 45,548 25,923 30,690 19,679 14,858 6,243Assets held for sale 812 795 812 795 – –Total assets 501,229 488,071 260,190 246,816 241,039 241,255 Equity and Liabilities Equity 122,402 123,651 91,353 92,774 31,048 30,877
Equity attributable to Volkswagen AG shareholders 105,157 109,117 74,752 78,872 30,405 30,246Equity attributable to Volkswagen AG hybrid capital investors 15,607 12,663 15,607 12,663 – –
Equity attributable to Volkswagen AG shareholders and hybrid capital investors 120,763 121,781 90,358 91,535 30,405 30,246Noncontrolling interests 1,638 1,870 995 1,239 644 631Noncurrent liabilities 196,623 196,497 89,950 90,822 106,674 105,675Financial liabilities 110,674 113,556 14,293 17,592 96,381 95,965Provisions for pensions 44,164 41,389 43,344 40,631 820 759Other liabilities 41,785 41,551 32,313 32,600 9,473 8,951Current liabilities 182,204 167,924 78,887 63,220 103,317 104,703Financial liabilities 100,121 87,912 7,011 –7,312 93,110 95,224Trade payables 23,724 22,745 20,253 19,603 3,471 3,142Other liabilities 58,039 56,896 51,303 50,559 6,736 6,337Liabilities associated with assets held for sale 320 370 320 370 – –Total equity and liabilities 501,229 488,071 260,190 246,816 241,039 241,255
1 Including allocation of consolidation adjustments between the Automotive and Financial Services divisions, primarily intragroup loans.

Statement of Changes in Equity 34 Interim Consolidated Financial Statements (Condensed)
Statement of Changes in Equity
O T H E R R E S E R V E S
€ million Subscribed capital Capital reserve Retained earningsCurrency
translation reserve
Balance at Jan. 1, 2019 1,283 14,551 91,105 –3,576Earnings after tax – – 10,664 –Other comprehensive income, net of tax – – –6,892 441Total comprehensive income – – 3,772 441Disposal of equity instruments – – –4 –Capital increases/Capital decreases – – – –Dividends payment – – –2,419 –Capital transactions involving a change in ownership interest – – 390 173Other changes – – 68 –Balance at Sept. 30, 2019 1,283 14,551 92,911 –2,962 Balance at Jan. 1, 2020 1,283 14,551 96,929 –2,824Earnings after tax – – 1,382 –Other comprehensive income, net of tax – – –1,440 –2,827Total comprehensive income – – –58 –2,827Disposal of equity instruments – – – –Capital increases/Capital decreases¹ – – – –Dividends payment – – –2,419 –Capital transactions involving a change in ownership interest² – – –166 –Other changes – – 10 0Balance at Sept. 30, 2020 1,283 14,551 94,297 –5,651
1 Volkswagen AG recorded an inflow of cash funds amounting to €3,000 million, less transaction costs of €16 million, from the hybrid capital issued in June 2020. Additionally, there were noncash effects from the deferral of taxes amounting to €5 million. The hybrid capital is required to be classified as equity instruments granted.
2 For the change in capital transactions involving a change in ownership interest see the “Key events” section.

Interim Consolidated Financial Statements (Condensed) 35Statement of Changes in Equity
H E D G I N G
Cash flowhedges
(OCI I)
Deferred costs of hedging
(OCI II)Equity and debt
instruments
Equity-accounted
investments
Equityattributable to
Volkswagen AGhybrid capital
investors
Equityattributable to
Volkswagen AGshareholders and
hybrid capitalinvestors
Equityattributable tononcontrolling
interests Total equity
1,790 –629 –230 228 12,596 117,117 225 117,342 – – – – 404 11,068 85 11,154 –1,604 –299 27 123 – –8,204 –23 –8,227 –1,604 –299 27 123 404 2,864 62 2,927 – – 4 – – – – – – – – – – – – – – – – – –432 –2,850 –8 –2,858 1 0 –1 –10 – 553 1,519 2,071 – – – 2 – 70 3 72 187 –928 –199 343 12,568 117,754 1,801 119,554 95 –977 –235 295 12,663 121,781 1,870 123,651 – – – – 386 1,768 –37 1,731 1,486 185 10 –181 – –2,767 –71 –2,838 1,486 185 10 –181 386 –1,000 –108 –1,107 – – – – – – – – – – – – 2,989 2,989 – 2,989 – – – – –432 –2,850 –58 –2,909 – – – – – –166 –71 –237 – – – –1 – 9 6 15 1,580 –792 –225 113 15,607 120,763 1,638 122,402

Cash flow statement 36 Interim Consolidated Financial Statements (Condensed)
Cash flow statement for the Period January 1 to September 30
VOLKSWAGEN GROUP DIVISIONS AUTOMOTIVE¹ F INANCIAL SERVICES
€ million 2020 2019 2020 2019 2020 2019
Cash and cash equivalents at beginning of period 24,329 28,113 18,098 23,354 6,231 4,759Earnings before tax 2,254 14,637 441 12,378 1,813 2,259Income taxes paid –1,862 –2,112 –1,408 –1,561 –454 –551Depreciation and amortization expense² 19,747 18,297 12,779 12,016 6,968 6,281Change in pension provisions 649 280 636 265 13 15Share of the result of equity-accounted investments 828 –249 872 –197 –43 –52Other noncash income/expense and reclassifications³ –505 –955 –313 –577 –193 –377Gross cash flow 21,111 29,898 13,007 22,323 8,104 7,575Change in working capital –2,812 –17,139 164 –1,402 –2,977 –15,737
Change in inventories 1,570 –3,725 1,134 –3,699 435 –27Change in receivables –2,032 –2,495 –1,784 –2,602 –248 108Change in liabilities 3,470 5,729 2,200 4,925 1,270 805Change in other provisions –1,300 –11 –1,409 51 109 –62Change in lease assets (excluding depreciation) –8,770 –9,552 187 –80 –8,957 –9,472Change in financial services receivables 4,249 –7,086 –164 4 4,414 –7,089
Cash flows from operating activities 18,298 12,759 13,171 20,921 5,127 –8,162Cash flows from investing activities attributable to operating activities –11,784 –12,532 –11,754 –12,309 –30 –223of which: Investments in intangible assets (excluding capitalized development costs), property, plant and equipment, and investment property –6,551 –8,344 –6,422 –8,186 –129 –158
capitalized development costs –4,481 –3,667 –4,481 –3,667 – – acquisition and disposal of equity investments –1,024 –677 –1,096 –595 72 –82
Net cash flow4 6,514 227 1,418 8,612 5,097 –8,385 Change in investments in securities, loans and time deposits –2,913 1,007 –2,890 –3,510 –22 4,516
Cash flows from investing activities –14,697 –11,525 –14,644 –15,818 –53 4,293Cash flows from financing activities 17,835 748 14,178 –6,985 3,657 7,733 of which: capital transactions with noncontrolling interests – 1,368 – 1,368 – – capital contributions/capital redemptions 2,984 – 2,975 –981 9 981 MAN noncontrolling interest shareholders: compensation payments and acquisition of shares tendered 2 –1,109 2 –1,109 – –Effect of exchange rate changes on cash and cash equivalents –658 302 –546 244 –112 59Change of loss allowance within cash & cash equivalents –2 0 –2 0 0 0Net change in cash and cash equivalents 20,777 2,284 12,158 –1,638 8,619 3,923 Cash and cash equivalents at Sept. 305 45,107 30,397 30,256 21,715 14,850 8,682Securities, loans and time deposits 31,217 27,375 15,901 12,319 15,316 15,056Gross liquidity 76,324 57,772 46,157 34,034 30,166 23,738Total third-party borrowings –210,801 –202,515 –21,310 –14,247 –189,491 –188,268Net liquidity at Sept. 306 –134,477 –144,743 24,848 19,787 –159,325 –164,530
For information purposes: at Jan. 1 –148,040 –134,735 21,276 19,368 –169,316 –154,103
1 Including allocation of consolidation adjustments between the Automotive and Financial Services divisions. 2 Net of impairment reversals. 3 These relate mainly to the fair value measurement of financial instruments and the reclassification of gains/losses on disposal of noncurrent assets and equity investments to
investing activities. 4 Net cash flow: cash flows from operating activities, net of cash flows from investing activities attributable to operating activities (investing activities excluding change in investments
in securities, loans and time deposits). 5 Cash and cash equivalents comprise cash at banks, checks, cash-in-hand and call deposits. 6 The total of cash, cash equivalents, securities, loans to affiliates and joint ventures as well as time deposits net of third-party borrowings (noncurrent and current financial liabilities).
Explanatory notes on the cash flow statement are presented in the section relating to the cash flow statement.

Interim Consolidated Financial Statements (Condensed) Notes to the Consolidated Financial Statements 37
Accounting in accordance with International Financial Reporting Standards (IFRSs)
In accordance with Regulation No. 1606/2002 of the European Parliament and of the Council, Volkswagen AG prepared its consolidated financial statements for 2019 in compliance with the International Financial Reporting Standards (IFRSs), as adopted by the European Union. These interim consolidated financial statements for the period ended September 30, 2020 were therefore also prepared in accordance with IAS 34 (Interim Financial Reporting) and are condensed in scope compared with the consolidated financial statements.
All figures shown are rounded, so minor discrepancies may arise from addition of these amounts. In addition to the reportable segments, the Automotive and Financial Services divisions are presented in the
condensed interim group financial report for explanatory purposes alongside the income statement, balance sheet and cash flow statement for the Volkswagen Group. This supplemental presentation is not required by IFRSs. Eliminations of intragroup transactions between the Automotive and Financial Services divisions are allocated to the Automotive Division.
The accompanying interim consolidated financial statements were reviewed by auditors in accordance with section 115 of the Wertpapierhandelsgesetz (WpHG – German Securities Trading Act).
Accounting policies
Volkswagen AG has applied all accounting pronouncements adopted by the EU and effective for periods beginning on or after January 1, 2020. OT H E R A C CO U N T I N G P O L I C I E S
A discount rate of 0.9% (December 31, 2019: 1.1%) was applied to German pension provisions in the accompanying interim consolidated financial statements.
The income tax expense for the interim consolidated financial statements was calculated on the basis of the average annual tax rate that is expected for the entire fiscal year, in accordance with IAS 34 (Interim Financial Reporting).
In other respects, the same accounting policies and consolidation methods that were used for the 2019 consolidated financial statements are generally applied to the preparation of the interim consolidated financial statements and the measurement of the prior-year comparatives. A detailed description of the policies and methods applied is published in the “Accounting policies” section of the notes to the 2019 consolidated financial statements.
In addition, details of the effects of new standards can be found in the “New and amended IFRSs not applied” section. The 2019 consolidated financial statements can also be accessed on the internet at www.volkswagenag.com/en/InvestorRelations.html.
Key events
On September 18, 2015, the US Environmental Protection Agency (EPA) publicly announced in a “Notice of Violation” that irregularities in relation to nitrogen oxide (NOX) emissions had been discovered in emissions tests on certain Volkswagen Group vehicles with type 2.0 l diesel engines in the USA. This was followed by further reports on the scope of the diesel issue. Detailed information can be found in the “Key events” section of the 2019 consolidated financial statements.
In the first nine months of fiscal year 2020, additional expenses of €0.7 billion had to be recognized in this context, primarily for legal risks.
Notes to the Consolidated Financial Statements

Notes to the Consolidated Financial Statements 38 Interim Consolidated Financial Statements (Condensed)
Furthermore, based on the information as it exists and has been established, there continue to be no conclusive findings or assessments available to the Board of Management of Volkswagen AG regarding the described facts that would suggest that a different assessment of the associated risks should have been made.
Further information on the litigation in connection with the diesel issue can be found in the “Litigation” section.
The Covid-19 pandemic, which caused a global decline in demand and, to some extent, continuing production stoppages, adversely affected the financial position and performance of the Volkswagen Group in the first nine months of fiscal year 2020.
In response to the Covid-19 pandemic, the carrying amounts of assets, in particular goodwill, brand names, capitalized development costs and property, plant and equipment, were reviewed as of September 30, 2020. Since Volkswagen currently assumes that the pandemic is a temporary event that will not have any lasting negative impact on the Group’s long-term business performance, the period from 2020 to 2024 covered by the previous year’s impairment tests has been adjusted to reflect current expectations with regard to overall market development and the estimated unit sales derived from them. Please refer to our comments in the interim management report for information on the developments expected in the global automotive markets. Furthermore, the weighted average cost of capital (WACC) has been adjusted to September 30, 2020 and individual parameters for financial assets have also been adjusted. Overall, the review has not led to any material additional impairment losses on assets.
The turbulence in the commodity and capital markets led to the recognition of expenses of €1.0 billion (previous year: income of €0.2 billion) in the other operating result, especially in connection with the treatment of derivatives to which hedge accounting is not applied and the measurement of receivables and liabilities denominated in foreign currencies. On July 12, 2019, Volkswagen announced that, together with Ford Motor Company (Ford), it would be investing in Argo AI, a company that is working on the development of a system for autonomous driving. The investment involves the provision of financial resources totaling USD 1.0 billion, spread over several years, and the contribution by Volkswagen of its consolidated subsidiary Autonomous Intelligent Driving (AID). Furthermore, Volkswagen acquired existing Argo AI shares from Ford for a purchase price of USD 500 million, payable in three equal annual installments. The transaction, including the contribution of AID, was executed as of June 1, 2020. After proportional profit elimination, the contribution of AID to Argo AI at fair value resulted in a non-cash gain of €0.8 billion, which was recognized in the other operating result. Argo AI will be accounted for as a joint venture and included in the consolidated financial statements using the equity method.
On February 28, 2020, Volkswagen AG announced that it was planning to increase its interest in AUDI AG from approximately 99.64% to 100%. On July 31, 2020, the Annual General Meeting of AUDI AG resolved to implement a squeeze-out under stock corporation law. Following the resolution, the present value of the put options granted, amounting to approximately €0.2 billion, had to be recognized as a current liability not affecting net income. The noncontrolling interests in the Volkswagen Group’s equity and the retained earnings attributable to the shareholders of Volkswagen AG declined accordingly. This resolution will take effect upon its entry in the commercial register.
Basis of consolidation
In addition to Volkswagen AG, which is domiciled in Wolfsburg and entered in the commercial register at the Braunschweig Local Court under No. HRB 100484, the consolidated financial statements comprise all significant German and non-German subsidiaries, including structured entities, that are controlled directly or indirectly by Volkswagen AG. This is the case if Volkswagen AG obtains power over the potential subsidiaries directly or indirectly from voting rights or similar rights, is exposed or has rights to, positive or negative variable returns from its involvement with the subsidiaries, and is able to influence those returns.

Interim Consolidated Financial Statements (Condensed) Notes to the Consolidated Financial Statements 39
Disclosures on the interim consolidated financial statements
1. Sales revenue
ST R U C T U R E O F G R O U P S A L E S R E V E N U E : Q 1 – Q 3 2 0 1 9
€ million
Passenger Cars and Light
Commercial Vehicles
CommercialVehicles
PowerEngineering
Financial Services Total Segments Reconciliation
VolkswagenGroup
Vehicles 114,380 12,786 – – 127,167 –10,532 116,634Genuine parts 9,930 2,586 – – 12,516 –88 12,428Used vehicles and third-party products 9,511 1,043 – – 10,554 –394 10,160Engines, powertrains and parts deliveries 8,261 465 – – 8,727 –15 8,712Power Engineering – – 2,873 – 2,873 –2 2,871Motorcycles 482 – – – 482 0 482Leasing business 756 1,285 0 22,703 24,745 –3,202 21,543Interest and similar income 170 4 – 5,980 6,154 –150 6,004Hedges sales revenue –4 –13 – – –16 87 71Other sales revenue 5,659 1,333 – 904 7,896 –184 7,712 149,146 19,491 2,873 29,587 201,098 –14,480 186,617
ST R U C T U R E O F G R O U P S A L E S R E V E N U E : Q 1 – Q 3 2 0 2 0
€ million
Passenger Cars and Light
Commercial Vehicles
CommercialVehicles
PowerEngineering
Financial Services Total Segments Reconciliation
VolkswagenGroup
Vehicles 88,586 9,014 – – 97,600 –9,543 88,057Genuine parts 8,572 2,397 – – 10,969 –82 10,887Used vehicles and third-party products 8,834 1,041 – – 9,876 –568 9,307Engines, powertrains and parts deliveries 8,959 454 – – 9,413 –24 9,389Power Engineering – – 2,749 – 2,749 –1 2,748Motorcycles 422 – – – 422 – 422Leasing business 570 1,269 0 23,364 25,203 –3,152 22,051Interest and similar income 138 6 – 5,743 5,887 –189 5,698Hedges sales revenue –457 –12 – 0 –469 12 –456Other sales revenue 5,332 1,251 – 1,079 7,661 –280 7,381 120,959 15,419 2,749 30,185 169,313 –13,827 155,486
Other sales revenue comprises revenue from workshop services and license revenue, among other things.

Notes to the Consolidated Financial Statements 40 Interim Consolidated Financial Statements (Condensed)
2. Cost of sales
Cost of sales includes interest expenses of €1,763 million (previous year: €2,032 million) attributable to the financial services business.
In addition to depreciation and amortization expenses, cost of sales also includes impairment losses on capitalized development costs, property, plant and equipment, and lease assets. The impairment losses identified on the basis of updated impairment tests amount to a total of €704 million (previous year: €858 million). The value in use is used as the basis for calculating impairment losses.
3. Research and development costs
Q 1 – 3
€ million 2020 2019 %
Total research and development costs 10,191 10,697 –4.7of which: capitalized development costs 4,481 3,667 22.2
Capitalization ratio in % 44.0 34.3 Amortization of capitalized development costs 3,363 2,807 19.8Research and development costs recognized in profit or loss 9,073 9,837 –7.8

Interim Consolidated Financial Statements (Condensed) Notes to the Consolidated Financial Statements 41
4. Earnings per share
Basic earnings per share are calculated by dividing earnings attributable to Volkswagen AG shareholders by the weighted average number of ordinary and preferred shares outstanding during the reporting period. Since there were no transactions in the reporting period that had a dilutive effect on the number of shares, diluted earnings per share are equivalent to basic earnings per share.
In accordance with Article 27(2) No. 1 of the Articles of Association of Volkswagen AG, preferred shares are entitled to a preferred dividend of €0.11 per share if a loss is made. This preferred dividend would have to be paid in subsequent periods, if no dividends were to be distributed for the current fiscal year, and must therefore be taken into account when calculating the loss per share for the year in which the loss was made. The distribution of further dividends is performed in accordance with Article 27(2) Nos. 2 and 3 of the Articles of Association of Volkswagen AG. If a profit after tax is attributable to the shareholders of Volkswagen AG, preferred shares are in general entitled to a dividend that is €0.06 higher per share than that for ordinary shares.
Q 3 Q 1 – Q 3
2020 2019 2020 2019
Weighted average number of:
Ordinary shares – basic/diluted Shares 295,089,818 295,089,818 295,089,818 295,089,818
Preferred shares – basic/diluted Shares 206,205,445 206,205,445 206,205,445 206,205,445
Earnings after tax € million 2,751 3,986 1,731 11,154
Noncontrolling interests € million 21 61 –37 85
Earnings attributable to Volkswagen AG hybrid capital investors € million 147 136 386 404
Earnings attributable to Volkswagen AG shareholders € million 2,583 3,789 1,382 10,664
of which: basic/diluted earnings attributable to ordinary shares € million 1,527 2,230 806 6,270
of which: basic/diluted earnings attributable to preferred shares € million 1,056 1,558 576 4,394
Earnings per ordinary share – basic/diluted € 5.17 7.56 2.73 21.25
Earnings per preferred share – basic/diluted € 5.12 7.56 2.79 21.31

Notes to the Consolidated Financial Statements 42 Interim Consolidated Financial Statements (Condensed)
5. Noncurrent assets
C H A N G E S I N S E L E C T E D N O N C U R R E N T A S S E T S B E T W E E N J A N UA RY 1 A N D S E P T E M B E R 3 0 , 2 0 2 0
€ million Carrying amount
at Jan. 1, 2020
Additions/Changes in
consolidatedGroup
Disposals/Other changes
Depreciationand amortization
Carrying amountat Sept. 30, 2020
Intangible assets 66,214 4,850 514 3,990 66,560Property, plant and equipment 66,152 7,118 1,892 8,661 62,717Lease assets 48,938 17,333 9,854 7,004 49,412
6. Inventories
€ million Sept. 30, 2020 Dec. 31, 2019
Raw materials, consumables and supplies 7,056 6,099Work in progress 4,805 4,110Finished goods and purchased merchandise 26,297 30,617Current lease assets 5,111 5,699Prepayments 240 222Hedges on inventories –5 –6 43,504 46,742
It was not necessary to recognize or reverse significant impairment losses on inventories in the reporting period.
7. Current other receivables and financial assets
€ million Sept. 30, 2020 Dec. 31, 2019
Trade receivables 17,972 17,941Miscellaneous other receivables and financial assets 21,565 20,678 39,536 38,620
In the period January 1 to September 30, 2020, impairment losses and reversals of impairment losses on financial assets reduced operating profit by €929 million (previous year: €592 million).

Interim Consolidated Financial Statements (Condensed) Notes to the Consolidated Financial Statements 43
8. Equity
In June 2020, Volkswagen AG placed unsecured subordinated hybrid notes with an aggregate principal amount of €3.0 billion via a subsidiary, Volkswagen International Finance N.V., Amsterdam, the Netherlands (issuer). The perpetual hybrid notes were issued in two tranches and can be called by the issuer. The first call date for the first tranche (€1.5 billion and a coupon of 3.500%) is after five years, and the first call date for the second tranche (€1.5 billion and a coupon of 3.875%) is after nine years. Under IAS 32, this hybrid note must be classified in its entirety as equity. The capital raised, less transaction costs and net of deferred taxes, was recognized in equity. The interest payments payable to the noteholders will be recognized directly in equity.
The subscribed capital is composed of 295,089,818 no-par value ordinary shares and 206,205,445 no-par value preferred shares, and amounts to €1,283 million (previous year: €1,283 million).
At the Annual General Meeting of Volkswagen AG on September 30, 2020, a dividend of €2,419 million (previous year: €2,419 million) was resolved. €1,416 million (previous year: €1,416 million) of this amount was attributable to ordinary shares and €1,002 million (previous year: €1,002 million) to preferred shares. The dividend was paid in October 2020.
Most of the noncontrolling interests in equity are attributable to the TRATON GROUP. On February 28, 2020, Volkswagen AG announced that it was planning to increase its interest in AUDI AG
from approximately 99.64% to 100%. On July 31, 2020, the Annual General Meeting of AUDI AG resolved to implement a squeeze-out under stock corporation law (see “Key events” section).
9. Noncurrent financial liabilities
€ million Sept. 30, 2020 Dec. 31, 2019
Bonds, commercial paper and notes 86,168 88,986Liabilities to banks 15,564 15,337Deposit business 2,277 2,395Lease liabilities 4,947 5,208Other financial liabilities 1,717 1,629 110,674 113,556
10. Current financial liabilities
€ million Sept. 30, 2020 Dec. 31, 2019
Bonds, commercial paper and notes 45,010 37,893Liabilities to banks 24,312 17,337Deposit business 28,943 30,252Lease liabilities 961 1,002Other financial liabilities 896 1,429 100,121 87,912
Notes to the Consolidated Financial Statements 44 Interim Consolidated Financial Statements (Condensed)
11. Fair value disclosures
Generally, the principles and techniques used for fair value measurement remained unchanged year-on-year. Detailed explanations of the measurement principles and techniques can be found in the “Accounting policies” section of the 2019 consolidated financial statements.
Fair value generally corresponds to the market or quoted market price. If no active market exists, fair value is determined using valuation techniques, such as by discounting the future cash flows at the market interest rate, or by using recognized option pricing models.
Financial assets and liabilities measured at fair value through profit or loss consist of derivative financial instruments to which hedge accounting is not applied. They include primarily commodity futures, currency forwards relating to commodity futures as well as, in certain cases, interest rate swaps, currency swaps and cross-currency interest rate swaps. Moreover, other equity investments (shares representing an ownership interest of less than 20% as a rule) in partnerships (debt instruments), customer financing receivables whose returns contain more than just interest and principal repayments, and financial assets held in special funds controlled by the Volkswagen Group are measured at fair value through profit or loss. Derivative financial instruments to which hedge accounting is applied are measured at fair value either directly in equity or through profit or loss, depending on the underlying hedged item.
Financial assets measured at fair value through other comprehensive income include equity investments (shares representing an ownership interest of less than 20% as a rule) in corporations (equity instruments) and shares for which the Volkswagen Group normally exercises the option of fair value measurement through other comprehensive income, as well as securities (debt instruments) whose cash flows comprise solely payments of interest and principal and that are held under a business model aimed at both collecting contractual cash flows and selling financial assets. For instruments measured through other comprehensive income, changes in fair value are recognized directly in equity, taking deferred taxes into account. Impairment losses on securities (debt instruments) are recognized through profit or loss.
Uniform valuation techniques and inputs are used to measure fair value. The fair value of Level 2 and Level 3 financial instruments is measured in the individual divisions on the basis of Group-wide specifications.
R E CO N C I L I AT I O N O F B A L A N C E S H E E T I T E M S TO C L A S S E S O F F I N A N C I A L I N ST R U M E N T S
The following table shows the reconciliation of the balance sheet items to the relevant classes of financial instruments, broken down by the carrying amount and fair value of the financial instruments.
The fair value of financial instruments measured at amortized cost, such as receivables and liabilities, is calculated by discounting the carrying amount using a market rate of interest for a similar risk and matching maturity. For reasons of materiality, the fair value of current balance sheet items is generally deemed to be their carrying amount.
The risk variables governing the fair value of the receivables are risk-adjusted interest rates.

Interim Consolidated Financial Statements (Condensed) Notes to the Consolidated Financial Statements 45
R E CO N C I L I AT I O N O F B A L A N C E S H E E T I T E M S TO C L A S S E S O F F I N A N C I A L I N ST R U M E N T S A S O F D E C E M B E R 3 1 , 2 0 1 9
M E A S UR E D A T F A I R V A L UE
M E A S UR E D A T A M O R T I Z E D
C O S T
DERIVATIVE FINANCIAL
INSTRUMENTS WITHIN HEDGE
ACCOUNTING
N O T A L L O C A T E D T O
A M E A S U R E M E N T
C A T E G OR Y
B A LA N C E S H E E T I T E M
A T D E C . 3 1 , 2 0 1 9
€ million Carrying amount Carrying amount Fair value Carrying amount Carrying amount
Noncurrent assets Equity-accounted investments – – – – 8,169 8,169Other equity investments 54 – – – 1,848 1,902Financial services receivables 288 51,404 52,581 – 35,281 86,973Other financial assets 1,012 3,625 3,628 916 – 5,553Tax receivables – – – – 341 341 Current assets Trade receivables 1 17,940 17,940 – – 17,941Financial services receivables 22 39,936 39,936 – 18,656 58,615Other financial assets 1,477 10,120 10,120 619 – 12,216Tax receivables – 9 9 – 1,181 1,190Marketable securities 16,681 88 88 – – 16,769Cash, cash equivalents and time deposits – 25,923 25,923 – – 25,923Assets held for Sale 3 158 158 – 634 795 Noncurrent liabilities Noncurrent financial liabilities – 108,348 110,679 – 5,208 113,556Other noncurrent financial liabilities 943 2,549 2,554 1,007 – 4,499 Current liabilities Current financial liabilities – 86,911 86,911 – 1,002 87,912Trade payables – 22,745 22,745 – – 22,745Other current financial liabilities 817 8,614 8,614 1,427 – 10,858Tax payables – 19 19 – 389 408Liabilities associated with assets held for sale – 44 44 – 326 370

Notes to the Consolidated Financial Statements 46 Interim Consolidated Financial Statements (Condensed)
R E CO N C I L I AT I O N O F B A L A N C E S H E E T I T E M S TO C L A S S E S O F F I N A N C I A L I N ST R U M E N T S A S O F S E P T E M B E R 3 0 , 2 0 2 0
M E A S UR E D A T F A I R V A L UE
M E A S UR E D A T A M O R T I Z E D
C O S T
D E R I V A T I V E F I N A N C I A L
I N S T R UM E N T S W I T H I N H E D G E
A C C O UN T I N G
N O T A L L O C A T E D T O
A M E A S U R E M E N T
C A T E G OR Y
B A LA N C E S H E E T I T E M A T S E P T . 3 0 ,
2 0 2 0
€ million Carrying amount Carrying amount Fair value Carrying amount Carrying amount
Noncurrent assets Equity-accounted investments – – – – 9,046 9,046Other equity investments 171 – – – 1,864 2,035Financial services receivables 264 46,570 48,711 – 33,291 80,124Other financial assets 1,227 4,045 4,084 2,136 – 7,408Tax receivables – – – – 375 375 Current assets Trade receivables 49 17,922 17,922 – – 17,972Financial services receivables 21 37,470 37,470 – 18,630 56,121Other financial assets 1,271 9,941 9,941 1,422 – 12,634Tax receivables – 0 0 – 1,313 1,313Marketable securities 20,657 15 15 – – 20,672Cash, cash equivalents and time deposits – 45,548 45,548 – – 45,548Assets held for Sale 3 238 238 – 571 812 Noncurrent liabilities Noncurrent financial liabilities – 105,727 109,248 – 4,947 110,674Other noncurrent financial liabilities 1,176 2,301 2,301 549 – 4,026 Current liabilities Current financial liabilities – 99,160 99,160 – 961 100,121Trade payables – 23,724 23,724 – – 23,724Other current financial liabilities 1,307 13,036 13,036 642 – 14,984Tax payables – 9 9 – 294 302Liabilities associated with assets held for sale – 34 34 – 286 320
The carrying amount of lease receivables was €51.9 billion (previous year: €53.9 billion) and their fair value was €52.9 billion (previous year: €55.0 billion).

Interim Consolidated Financial Statements (Condensed) Notes to the Consolidated Financial Statements 47
The following tables contain an overview of the financial assets and liabilities measured at fair value:
F I N A N C I A L A S S E T S A N D L I A B I L I T I E S M E A S U R E D AT F A I R VA L U E B Y L E V E L
€ million Dec. 31, 2019 Level 1 Level 2 Level 3
Noncurrent assets Other equity investments 54 43 0 11Financial services receivables 288 – – 288Other financial assets 1,012 – 595 417
Current assets Trade receivables 1 – – 1Financial services receivables 22 – – 22Other financial assets 1,477 – 1,304 173Marketable securities 16,681 16,681 – –
Assets held for Sale 3 – – 3Noncurrent liabilities
Other noncurrent financial liabilities 943 – 425 518Current liabilities
Other current financial liabilities 817 – 570 247
€ million Sept. 30, 2020 Level 1 Level 2 Level 3
Noncurrent assets Other equity investments 171 29 0 141Financial services receivables 264 – – 264Other financial assets 1,227 – 801 425
Current assets Trade receivables 49 – – 49Financial services receivables 21 – – 21Other financial assets 1,271 – 1,107 165Marketable securities 20,657 20,576 81 –Assets held for Sale 3 – – 3
Noncurrent liabilities Other noncurrent financial liabilities 1,176 – 533 643
Current liabilities Other current financial liabilities 1,307 – 1,027 280

Notes to the Consolidated Financial Statements 48 Interim Consolidated Financial Statements (Condensed)
D E R I VAT I V E F I N A N C I A L I N ST R U M E N T S W I T H I N H E D G E A CC O U N T I N G B Y L E V E L
€ million Dec. 31, 2019 Level 1 Level 2 Level 3
Noncurrent assets Other financial assets 916 – 916 –
Current assets Other financial assets 619 – 619 –
Noncurrent liabilities Other noncurrent financial liabilities 1,007 – 1,007 –
Current liabilities Other current financial liabilities 1,427 – 1,427 –
€ million Sept. 30, 2020 Level 1 Level 2 Level 3
Noncurrent assets Other financial assets 2,136 – 2,136 –
Current assets Other financial assets 1,422 – 1,422 –
Noncurrent liabilities Other noncurrent financial liabilities 549 – 549 –
Current liabilities Other current financial liabilities 642 – 642 –
The allocation of fair values to the three levels in the fair value hierarchy is based on the availability of observable market prices. Level 1 is used to report the fair value of financial instruments for which a price is directly available in an active market. Examples include marketable securities and other equity investments measured at fair value. Fair values in Level 2, for example of derivatives, are measured on the basis of market inputs using market-based valuation techniques. In particular, the inputs used include exchange rates, yield curves and commodity prices that are observable in the relevant markets and obtained through pricing services. Fair Values in Level 3 are calculated using valuation techniques that incorporate inputs that are not directly observable in active markets. In the Volkswagen Group, long-term commodity futures are allocated to Level 3 because the prices available on the market must be extrapolated for measurement purposes. This is done on the basis of observable inputs obtained for the different commodities through pricing services. Options on equity instruments, residual value protection models, customer financing receivables and receivables from vehicle financing programs are also reported in Level 3. Equity instruments are measured primarily using the relevant business plans and entity-specific discount rates. The significant inputs used to measure fair value for the residual value protection models include forecasts and estimates of used vehicle residual values for the appropriate models. The measurement of vehicle financing programs requires in particular the use of the corresponding vehicle price.
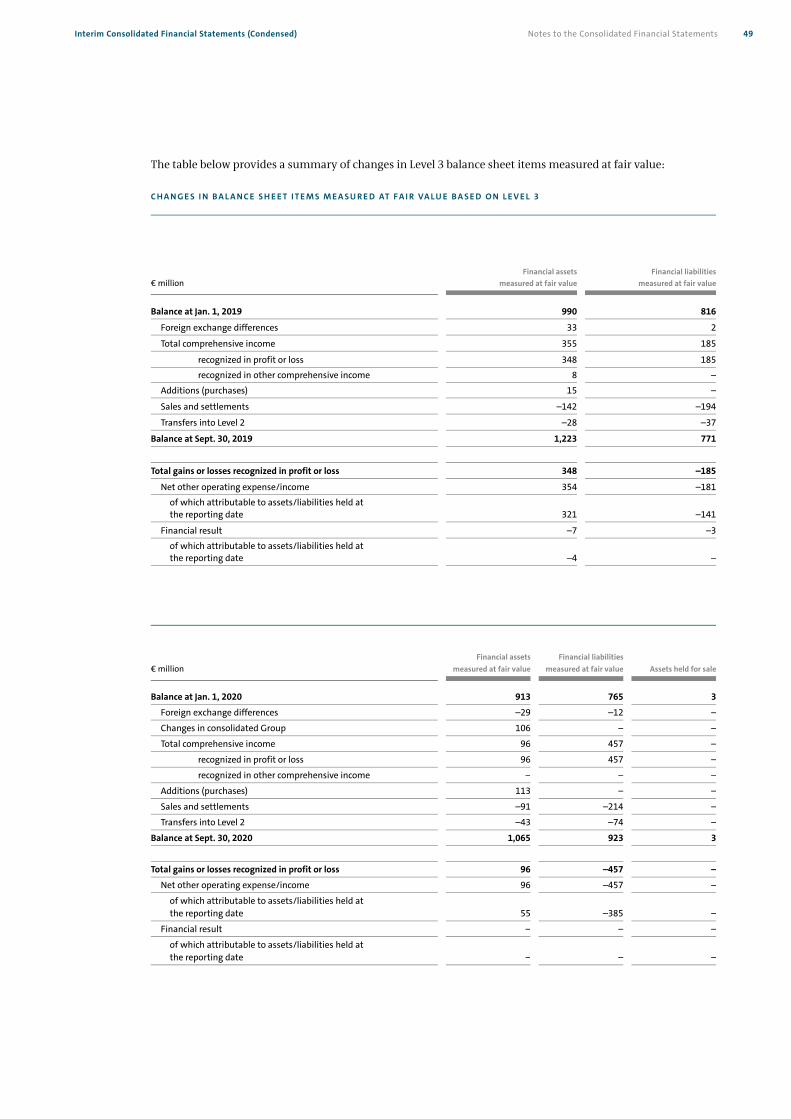
Interim Consolidated Financial Statements (Condensed) Notes to the Consolidated Financial Statements 49
The table below provides a summary of changes in Level 3 balance sheet items measured at fair value: C H A N G E S I N B A L A N C E S H E E T I T E M S M E A S U R E D AT F A I R VA L U E B A S E D O N L E V E L 3
€ million Financial assets
measured at fair valueFinancial liabilities
measured at fair value
Balance at Jan. 1, 2019 990 816
Foreign exchange differences 33 2
Total comprehensive income 355 185
recognized in profit or loss 348 185
recognized in other comprehensive income 8 –
Additions (purchases) 15 –
Sales and settlements –142 –194
Transfers into Level 2 –28 –37
Balance at Sept. 30, 2019 1,223 771
Total gains or losses recognized in profit or loss 348 –185
Net other operating expense/income 354 –181
of which attributable to assets/liabilities held at the reporting date 321 –141
Financial result –7 –3
of which attributable to assets/liabilities held at the reporting date –4 –
€ million Financial assets
measured at fair valueFinancial liabilities
measured at fair value Assets held for sale
Balance at Jan. 1, 2020 913 765 3
Foreign exchange differences –29 –12 –
Changes in consolidated Group 106 – –
Total comprehensive income 96 457 –
recognized in profit or loss 96 457 –
recognized in other comprehensive income – – –
Additions (purchases) 113 – –
Sales and settlements –91 –214 –
Transfers into Level 2 –43 –74 –
Balance at Sept. 30, 2020 1,065 923 3
Total gains or losses recognized in profit or loss 96 –457 –
Net other operating expense/income 96 –457 –
of which attributable to assets/liabilities held at the reporting date 55 –385 –
Financial result – – –
of which attributable to assets/liabilities held at the reporting date – – –

Notes to the Consolidated Financial Statements 50 Interim Consolidated Financial Statements (Condensed)
The transfers between the levels of the fair value hierarchy are reported at the respective reporting dates. The transfers out of Level 3 into Level 2 comprise commodity futures for which observable quoted prices are now available for measurement purposes due to the decline in their remaining maturities; consequently, no further extrapolation is required. There were no transfers between other levels of the fair value hierarchy.
Commodity prices are the key risk variable for the fair value of commodity futures. Sensitivity analyses are used to present the effect of changes in commodity prices on earnings after tax and equity.
If commodity prices for commodity futures classified as Level 3 had been 10% higher (lower) as of September 30, 2020, earnings after tax would have been €242 million (previous year: €170 million) higher (lower). The equity is not affected.
The key risk variable for measuring options on equity instruments held by the Company is the relevant enterprise value. Sensitivity analyses are used to present the effect of changes in risk variables on earnings after tax.
If the assumed enterprise values at September 30, 2020 had been 10% higher, earnings after tax would have been €3 million (previous year: €2 million) higher. If the assumed enterprise values at September 30, 2020 had been 10% lower, earnings after tax would have been €3 million (previous year: €2 million) lower.
Residual value risks result from hedging agreements with dealerships under which earnings effects caused by market-related fluctuations in residual values that arise from buy-back obligations under leases are borne in part by the Volkswagen Group.
The key risk variable influencing the fair value of the options relating to residual value risks is used car prices. Sensitivity analyses are used to quantify the effects of changes in used car prices on earnings after tax.
If the prices of the used cars covered by the residual value protection model had been 10% higher as of September 30, 2020, earnings after tax would have been €383 million (previous year: €320 million) higher. If the prices of the used cars covered by the residual value protection model had been 10% lower as of September 30, 2020, earnings after tax would have been €400 million (previous year: €332 million) lower.
If the risk-adjusted interest rates applied to receivables measured at fair value had been 100 basis points higher as of September 30, 2020, earnings after tax would have been €2 million (previous year: €3 million) lower. If the risk-adjusted interest rates as of September 30, 2020 had been 100 basis points lower, earnings after tax would have been €2 million (previous year: €3 million) higher.
If the corresponding vehicle price used in the vehicle financing programs had been 10% higher as of September 30, 2020, earnings after tax would have been €0.3 million (previous year: €5 million) higher. If the corresponding vehicle prices used in the vehicle financing programs had been 10% lower as of September 30, 2020, earnings after tax would have been €0.3 million (previous year: €5 million) lower.
If the result of operations of equity investments measured at fair value had been 10% better as of September 30, 2020, the equity would have been €4.2 million (previous year: €8 million) higher. If the result of operations of equity investments measured at fair value had been 10% worse, the equity would have been €4.2 million (previous year: €8 million) lower.

Interim Consolidated Financial Statements (Condensed) Notes to the Consolidated Financial Statements 51
12. Cash flow statement
The cash flow statement presents the cash inflows and outflows in the Volkswagen Group and in the Automotive and Financial Services divisions. Cash and cash equivalents comprise cash at banks, checks, cash-in-hand and call deposits.
€ million Sept. 30, 2020 Sept. 30, 2019
Cash, cash equivalents and time deposits as reported in the balance sheet 45,548 30,960Held for Sale 122 –Time deposits –564 –563Cash and cash equivalents as reported in the cash flow statement 45,107 30,397
Cash inflows and outflows from financing activities are presented in the following table:
Q 1 – 3
€ million 2020 2019
Capital contributions 2,984 –Dividends paid –490 –2,858Capital transactions with noncontrolling interest shareholders – 1,368Proceeds from issuance of bonds 18,584 20,457Repayments of bonds –12,560 –15,673Changes in other financial liabilities 10,135 –1,901Repayments of lease liabilities –819 –645 17,835 748
13. Segment reporting
Segments are identified on the basis of the Volkswagen Group’s internal management and reporting. In line with the Group’s multibrand strategy, each of its brands (operating segments) is managed by its own board of management. The Group targets and requirements laid down by the Board of Management of Volkswagen AG must be complied with. Segment reporting comprises four reportable segments: Passenger Cars and Light Commercial Vehicles, Commercial Vehicles, Power Engineering and Financial Services.
The activities of the Passenger Cars and Light Commercial Vehicles segment cover the development of vehicles and engines, the production and sale of passenger cars and light commercial vehicles, and the corresponding genuine parts business. In the Passenger Cars and Light Commercial Vehicles reporting segment, the individual brands are being combined into a single reportable segment, in particular as a response to the high degree of technological and economic interlinking in the production network. Furthermore, there is collaboration within key areas such as procurement, research and development or treasury.
The Commercial Vehicles segment primarily comprises the development, production and sale of trucks and buses, the corresponding genuine parts business and related services. As in the case of the passenger car brands, there is collaboration within the areas procurement, development and sales. The aim is to create closer cooperation within the business areas.
The activities of the Power Engineering segment consist of the development and production of large-bore diesel engines, turbo compressors, industrial turbines and chemical reactor systems, as well as the production of gear units, propulsion components and testing systems.
The activities of the Financial Services segment comprise dealership and customer financing, leasing, banking and insurance activities, fleet management and mobility services. In this segment, activities are combined for reporting purposes taking into particular account the comparability of the type of services and of the regulatory environment.
Purchase price allocation for companies acquired is allocated directly to the corresponding segments.

Notes to the Consolidated Financial Statements 52 Interim Consolidated Financial Statements (Condensed)
At Volkswagen, segment profit or loss is measured on the basis of the operating result. The reconciliation contains activities and other operations that by definition do not constitute segments. It
also includes the unallocated Group financing activities. Consolidation adjustments between the segments are also contained in the reconciliation.
As a matter of principle, business relationships between the companies within the segments of the Volkswagen Group are transacted at arm’s length prices. R E P O RT I N G S E G M E N T S : Q 1 – Q 3 2 0 1 9
€ million
Passenger Cars and Light
Commercial Vehicles
CommercialVehicles
Power Engineering
FinancialServices
Totalsegments
Reconciliation
VolkswagenGroup
Sales revenue from external customers 137,945 18,703 2,871 26,930 186,448 169 186,617Intersegment sales revenue 11,202 788 2 2,657 14,649 –14,649 –Total sales revenue 149,146 19,491 2,873 29,587 201,098 –14,480 186,617Segment result (operating result) 12,201 1,307 –98 2,226 15,637 –2,098 13,539
R E P O RT I N G S E G M E N T S : Q 1 – Q 3 2 0 2 0
€ million
Passenger Cars and Light
Commercial Vehicles
CommercialVehicles
Power Engineering
FinancialServices
Totalsegments
Reconciliation
VolkswagenGroup
Sales revenue from external customers 110,323 14,657 2,748 27,627 155,355 131 155,486Intersegment sales revenue 10,635 762 1 2,559 13,957 –13,957 –Total sales revenue 120,959 15,419 2,749 30,185 169,313 –13,827 155,486Segment result (operating result) 1,630 –180 –101 1,789 3,138 –1,445 1,693
R E CO N C I L I AT I O N
Q 1 – 3
€ million 2020 2019
Segment result (operating result) 3,138 15,637Unallocated activities –38 –47Group financing –7 –32Consolidation/Holding company function –1,400 –2,019
Operating result 1,693 13,539Financial result 561 1,099Consolidated earnings before tax 2,254 14,637

Interim Consolidated Financial Statements (Condensed) Notes to the Consolidated Financial Statements 53
14. Related party disclosures
Porsche SE holds the majority of the voting rights in Volkswagen AG. The creation of rights of appointment for the State of Lower Saxony was resolved at the Extraordinary General
Meeting of Volkswagen AG on December 3, 2009. This means that, even though it holds the majority of voting rights of Volkswagen AG, Porsche SE cannot appoint the majority of the members of Volkswagen AG’s Supervisory Board for as long as the State of Lower Saxony holds at least 15% of Volkswagen AG’s ordinary shares. However, Porsche SE is therefore classified as a related party as defined by IAS 24.
S U P P L I E S A N D SE R V IC E S
R E N D E R E D S U P P L I E S A N D SE R V IC E S
R E C E I V E D Q 1 – 3 Q 1 – 3
€ million 2020 2019 2020 2019
Porsche SE and its majority interests 3 2 0 1Supervisory Board members 3 3 1 1Unconsolidated subsidiaries 705 1,043 771 1,182Joint ventures and their majority interests 11,660 11,520 315 459Associates and their majority interests 138 129 764 764State of Lower Saxony, its majority interests and joint ventures 3 8 4 3
R E C E I V A B L E S F R O M
L I A BI L I T I E S ( I N C L UD I N G O B L I G A T I ON S )
T O
€ million Sept. 30, 2020 Dec. 31, 2019 Sept. 30, 2020 Dec. 31, 2019
Porsche SE and its majority interests 3 4 756 0Supervisory Board members 0 0 148 170Unconsolidated subsidiaries 1,306 1,497 1,282 1,667Joint ventures and their majority interests 11,973 12,953 2,376 2,683Associates and their majority interests 383 326 966 1,063State of Lower Saxony, its majority interests and joint ventures 1 1 286 0
The tables above do not contain the dividend payments (net of withholding tax) of €2,056 million (previous year: €1,201 million) received from joint ventures and associates.
Receivables from joint ventures are primarily attributable to loans granted in an amount of €7,373 million (December 31, 2019: €8,290 million) as well as trade receivables in an amount of €3,655 million (December 31, 2019: €4,375 million). Receivables from non-consolidated subsidiaries also result primarily from loans granted in an amount of €846 million (December 31, 2019: €938 million) as well as trade receivables in an amount of €187 million (December 31, 2019: €188 million).
Transactions with related parties are regularly conducted on an arm’s length basis. Some of these transactions also include reservation of title clauses.
Obligations to members of the Supervisory Board relate primarily to interest-bearing bank balances of Supervisory Board members that were invested at standard market terms and conditions at Volkswagen Group companies.
Liabilities to Porsche SE as of September 30, 2020, include the dividend of €756 million. Liabilities to the State of Lower Saxony as of September 30, 2020, include the dividend of €286 million.

Notes to the Consolidated Financial Statements 54 Interim Consolidated Financial Statements (Condensed)
In addition, the Volkswagen Group has furnished guarantees to external banks on behalf of related parties in the amount of €344 million (December 31, 2019: €322 million).
Impairment losses of €46 million (previous year: €53 million) were recognized on the outstanding related party receivables. This incurred expenses of €36 million (previous year: €15 million) in the first three quarters of 2020.
In the first nine months, the Volkswagen Group made capital contributions of €192 million (previous year: €214 million) at related parties.
15. Litigation
D I E S E L I S S U E
1. Criminal and administrative proceedings worldwide (excluding the USA/Canada) In May 2020, the criminal proceedings against the current Chairman of the Board of Management and a former member of its Board of Management (currently Chairman of the Supervisory Board) of Volkswagen AG regarding alleged market manipulation relating to capital market disclosure obligations in connection with the diesel issue were definitively terminated by the Braunschweig Regional Court against payment in each case of a court-imposed sum of €4.5 million, thereby also terminating to the same extent the proceedings against Volkswagen AG as collateral participant. In September 2020, the Braunschweig Regional Court permitted the charges still pending against a former Chairman of the Board of Management of Volkswagen AG and the related action against Volkswagen AG to go forward and opened the main trial proceedings.
In September 2020, the Braunschweig Regional Court also accepted the separate indictment of the same former Chairman of the Board of Management of Volkswagen AG and others on charges that include fraud in connection with the diesel issue involving type EA 189 engines and opened the main trial proceedings.
In June 2020, the Munich II Regional Court accepted the substantially unchanged indictment of the Munich II Office of the Public Prosecutor, which also names the former Chairman of the Board of Management of AUDI AG, and opened the main trial proceedings on charges of, among other things, fraud in connection with the diesel issue involving 3.0 l TDI engines. Trial proceedings commenced in September 2020.
In August 2020, the Munich II Office of the Public Prosecutor issued a further indictment charging three former Members of the Board of Management of AUDI AG and others with, among other things, fraud in connection with the diesel issue involving 3.0 l and 4.2 l TDI engines. 2. Product-related lawsuits worldwide (excluding the USA/Canada) In April 2020, the court in Australia approved the class action settlement that the parties had agreed to.
On February 28, 2020, Volkswagen AG and Verbraucherzentrale Bundesverband e.V. (Federation of Consumer Organizations) entered into an out of court settlement to terminate the consumer action for model declaratory judgment. The terms of the settlement require Volkswagen AG to offer individual settlements to consumers who registered claims under the action for model declaratory judgment and meet the settlement criteria. The volume of such settlements amounts to up to €830 million. Verbraucherzentrale Bundesverband e.V. withdrew the action for model declaratory judgment on April 30, 2020. Volkswagen has entered into individual settlements with some 244 thousand customers in an aggregate amount of roughly €770 million.

Interim Consolidated Financial Statements (Condensed) Notes to the Consolidated Financial Statements 55
In April 2020, the High Court in England and Wales ruled in the group litigation that the switch logic in the EA 189 engine constituted an unlawful defeat device; the court believed that it was also bound by the findings of the Kraftfahrtbundesamt (German Federal Motor Transport Authority) in this respect. In August 2020, the Court of Appeal rejected Volkswagen's appeal against the High Court's ruling on these preliminary questions; this decision is final. The question of liability on the part of Volkswagen was not a matter addressed by the High Court's ruling and will be dealt with at a later stage of the proceedings.
In April 2020, the Diesel Emissions Justice Foundation served an opt-out class action lawsuit on Volkswagen seeking monetary damages on behalf of Dutch consumers. A change in the law in the Netherlands that took effect on January 1, 2020 may permit consumers in the European Union to opt into the class action as well. How the new law might apply to this litigation is, however, unclear. The class action relates to vehicles with type EA 189 engines, among others.
In Germany, the Bundesgerichtshof (BGH – Federal Court of Justice) handed down in May 2020 its first decision ever in an individual product-related lawsuit in connection with the diesel issue. The BGH held that the buyer, who had purchased a vehicle with a type EA 189 engine prior to public disclosure of the diesel issue, had a claim for damages against Volkswagen AG. While the buyer can require reimbursement of the vehicle's purchase price, he must accept a deduction for the benefit derived from using the vehicle and must return it to Volkswagen AG. The judgment clarified the BGH's stance on the fundamental issues underlying a large number of the some 65 thousand individual diesel lawsuits then still pending in Germany. On this basis, it has since been possible to conclude settlements and thus significantly reduce the number of individual lawsuits pending. In a series of fundamental judgments rendered in July 2020, the BGH decided further legal issues of major importance for the litigation still pending with regard to vehicles with type EA 189 engines. The BGH held that plaintiffs who purchased their vehicle after the ad hoc announcement of September 22, 2015 have no claim for damages. The court furthermore ruled that purchasers of affected vehicles are not entitled to tort interest under § 849 of the German Civil Code. The court also made it clear that a plaintiff's potential damage claim may be completely offset by the benefit derived from using the vehicle.
In September 2020, the French consumer organization Confédération de la Consommation, du Logement et du Cadre de Vie (CLCV) filed a class action against Volkswagen Group Automotive Retail France and Volkswagen AG for up to 950 thousand French owners and lessees of vehicles with type EA 189 engines. This is an opt-in pro-ceeding in which the affected consumers are not required to opt into the class action until a legally final judgment is rendered.
3. Lawsuits filed by investors worldwide (excluding the USA/Canada) In decisions handed down in March 2019, the Stuttgart Higher Regional Court refused to conduct additional investor actions for model declaratory judgment. These included an action for model declaratory judgment against Porsche SE and Volkswagen AG alleging violations of ad hoc disclosure obligations in connection with the diesel issue. The plaintiff side appealed the Stuttgart Higher Regional Court's rejection of this model case action to the Federal Court of Justice. In June 2020, the Federal Court of Justice remanded the matter to the Stuttgart Higher Regional Court for redecision on the determination of a model case plaintiff. In October 2020, the Stuttgart Higher Regional Court appointed the Wolverhampton City Council, Administrating Authority for the West Midlands Metropolitan Authorities Pension Fund as model case plaintiff in these proceedings, in which Volkswagen AG is involved as a third party intervening in support of a party to the dispute.

Notes to the Consolidated Financial Statements 56 Interim Consolidated Financial Statements (Condensed)
4. Proceedings in the USA/Canada In February 2020, the Montana State Court dismissed certain of the environmental claims asserted by the Montana Attorney General, but allowed other claims to proceed. In August 2020, the Montana Supreme Court declined on procedural grounds to grant Volkswagen’s petition to review that decision. In March 2020, the Ohio Supreme Court, at Volkswagen’s request, agreed to hear an appeal of a lower court's decision concerning Ohio’s remaining claims. In June 2020, the US Court of Appeals for the Ninth Circuit partially reversed the trial court’s decision and held that Hillsborough County (Florida) and Salt Lake County (Utah) can proceed with a subset of their claims. In September 2020, the US Court of Appeals for the Ninth Circuit stayed proceedings in the litigation pending Volkswagen’s anticipated petition for review by the US Supreme Court.
In May 2020, the settlement program in the United States for Generation 2 3.0 l TDI vehicles ended. In the environmental class action lawsuit seeking damages on behalf of the residents of the Province of
Quebec, after authorizing the case to proceed as a class, a Quebec court ruled in June 2020 that a motion to dismiss by Volkswagen is permissible at the present stage of the proceedings. Volkswagen noticed its motion in July 2020.
In the lawsuit brought by the SEC in March 2019 alleging claims under US federal securities law, the US District Court for the Northern District of California granted in part and denied in part Volkswagen’s motion to dismiss in August 2020. The claims dismissed by the court included all claims against VW Credit, Inc. related to asset-backed securities. In September 2020, the SEC filed an amended complaint that, among other things, removed the dismissed claims.
The term of the Independent Compliance Monitor retained pursuant to the Plea Agreement expired in September 2020, whereas that of the Independent Compliance Auditor under the Third Partial Consent Decree and the Third California Partial Consent Decree ended earlier, in June 2020.

Interim Consolidated Financial Statements (Condensed) Notes to the Consolidated Financial Statements 57
5. Additional proceedings In the proceedings regarding appointment of a special auditor for Volkswagen AG, the Celle Higher Regional Court issued a ruling in April 2020 appointing a special auditor other than the one originally named. The decision of the Higher Regional Court of Celle is formally unappealable. Volkswagen AG has filed a constitutional complaint with the Federal Constitutional Court contesting this decision as well on grounds of infringement of its constitutionally guaranteed rights and has suggested joinder of this matter with its initial constitutional complaint against the decision to appoint the special auditor. The constitutional complaint has no suspensory effect, however. Additional important legal cases
In the tax litigation between the Brazilian tax authorities and MAN Latin America, the amount at risk remains unchanged at BRL 3.1 billion. Due to exchange rate fluctuations, the risk in euros as contained in the notes under contingent liabilities has declined from €0.7 billion to €0.5 billion.
In connection with the factual matters that in principle also underlie the antitrust proceedings instituted by the European Commission against Volkswagen AG, AUDI AG, and Dr. Ing. h.c. F. Porsche AG in April 2019, the South Korean competition authority searched the premises of Audi Volkswagen South Korea and Porsche South Korea in May 2020 and issued requests for information to Volkswagen AG, AUDI AG, and Dr. Ing. h.c. F. Porsche AG. Furthermore, the Turkish competition authority commenced proceedings in the same matter in July 2020.
In March 2020, the US District Court for the Northern District of California dismissed two amended class action complaints brought by purchasers of German luxury vehicles alleging that several automobile manufacturers, including Volkswagen AG and other Group companies, conspired to unlawfully increase the prices of German luxury vehicles in violation of US antitrust and consumer protection law. The court held that the plaintiffs have not stated a claim for relief because the allegations in the complaints do not plausibly support that the alleged agreements unreasonably restrained competition in violation of US law. The court granted plaintiffs leave to file amended complaints with respect to a limited subset of plaintiffs’ original claims. Plaintiffs filed a second set of amended complaints in June 2020, which defendants moved to dismiss in August 2020. In October 2020, the court granted defendants’ motion and dismissed with prejudice the amended complaints in their entirety. Plaintiffs may appeal this ruling.

Notes to the Consolidated Financial Statements 58 Interim Consolidated Financial Statements (Condensed)
In February 2020, the US District Court for the Northern District of California granted final approval of a class action settlement resolving civil claims relating to approximately 98 thousand Volkswagen, Audi, Porsche and Bentley vehicles with automatic transmissions.
In October 2020, plaintiffs filed three complaints in the US District Court for the Northern District of California, seeking to represent a putative class of US purchasers and lessees of certain Porsche gasoline-powered vehicles. The defendants include Volkswagen AG, Dr. Ing. h.c. F. Porsche AG, AUDI AG, and Porsche Cars North America, Inc.; each defendant is not named in all the complaints. The complaints allege that the affected vehicles used certain software and/or hardware that resulted in increased emissions and/or overstated fuel economy estimates as com-pared to the results of certification testing.
Beyond this, there were no significant changes in the reporting period compared with the disclosures on the Volkswagen Group’s expected development in fiscal year 2020 contained in the combined management report in the 2019 Annual Report, specifically in the chapters “Report on Expected Developments” and “Report on Risks and Opportunities,” including the section “Legal risks.” In particular, based on the information as it exists and has been established, there continue to be no conclusive findings or assessments available to the Board of Management of Volkswagen AG regarding the described facts that would suggest that a different assessment of the associated risks should have been made.
In line with IAS 37.92, no further statements have been made concerning estimates of financial impact or about uncertainty regarding the amount or maturity of provisions and contingent liabilities in relation to the legal risks. This is so as to not compromise the results of the proceedings or the interests of the Company.

Interim Consolidated Financial Statements (Condensed) Notes to the Consolidated Financial Statements 59
16. Contingent liabilities
Compared with the contingent liabilities described in the 2019 Annual Report, there were no significant changes as of September 30, 2020.
17. Other financial obligations
Other financial liabilities, which amounted to €22.1 billion, increased compared with the 2019 consolidated financial statements. The rise is mainly attributable to payment obligations relating to future acquisitions of equity investments.
Significant events after the balance sheet date
On October 6, 2020, the Volkswagen Group completed the sale of its 76% interest in Renk AG. The sale price was €0.5 billion. The corresponding assets and liabilities continued to be classified as held for sale in the balance sheet as of September 30, 2020. Wolfsburg, October 28, 2020 Volkswagen Aktiengesellschaft The Board of Management

Review Report 60 Interim Consolidated Financial Statements (Condensed)
To VOLKSWAGEN AKTIENGESELLSCHAFT We have reviewed the condensed interim consolidated financial statements of VOLKSWAGEN AKTIEN-GESELLSCHAFT, Wolfsburg, – comprising the condensed income statement, condensed statement of comprehensive income, condensed balance sheet, condensed statement of changes in equity, condensed cash flow statement as well as selected explanatory notes – and the interim group management report for the period from 1 January 2020 to 30 September 2020, which are part of the interim financial report pursuant to Sec. 115 (7) in conjunction with (2) Nos. 1 and 2 and (3) and (4) WpHG [“Wertpapierhandelsgesetz”: German Securities Trading Act]. The preparation of the condensed interim consolidated financial statements in accordance with IFRSs (International Financial Reporting Standards) on interim financial reporting as adopted by the EU and of the interim group management report in accordance with the requirements of the WpHG applicable to interim group management reports is the responsibility of the Company’s executive directors. Our responsibility is to issue a report on the condensed interim consolidated financial statements and the interim group management report based on our review.
We conducted our review of the interim condensed consolidated financial statements and of the interim group management report in compliance with German Generally Accepted Standards for the Review of Financial Statements promulgated by the Institut der Wirtschaftsprüfer [Institute of Public Auditors in Germany] (IDW). Those standards require that we plan and perform the review to obtain a certain level of assurance in our critical appraisal to preclude that the condensed interim consolidated financial statements are not prepared, in all material respects, in accordance with IFRSs on interim financial reporting as adopted by the EU and that the interim group management report is not prepared, in all material respects, in accordance with the provisions of the WpHG applicable to interim group management reports. A review is limited primarily to making inquiries of company personnel and applying analytical procedures and thus does not provide the assurance that we would obtain from an audit of financial statements. In accordance with our engagement, we have not performed an audit and thus cannot issue an auditor’s report.
Review Report

Interim Consolidated Financial Statements (Condensed) Review Report 61
Based on our review, nothing has come to our attention that causes us to believe that the condensed interim consolidated financial statements are not prepared, in all material respects, in accordance with IFRSs on interim financial reporting as adopted by the EU or that the interim group management report is not prepared, in all material respects, in accordance with the provisions of the WpHG applicable to interim group management reports.
Without qualifying this conclusion, we refer to the updated information provided and statements made in connection with the diesel issue by the Board of Management in the “Key events” section in the notes to the interim consolidated financial statements and in the “Report on expected developments, risks and opportunities“ section in the interim group management report, where the allegations made and claims asserted against the Volkswagen Group are explained and where the information provided and statements made in the consolidated financial statements as of 31 December 2019 as well as in the combined management report in the 2019 annual report are referred to. On the basis of the underlying results to date of the various measures introduced to investigate the issue presented there and these interim consolidated financial statements and interim group management report, there is in particular still no confirmation that members of the Company’s Board of Management were aware of the deliberate manipulation of the engine management software before the summer of 2015. The provisions for legal risks recognized in the interim consolidated financial statements as of 30 September 2020 are based on these results and the information presented. Due to the uncertainties necessarily associated with pending and expected litigation, it cannot be ruled out that the risk estimation presented there could change in the future.
Hanover, 28 October 2020 Ernst & Young GmbH Wirtschaftsprüfungsgesellschaft Meyer Matischiok Wirtschaftsprüfer Wirtschaftsprüfer [German Public Auditor] [German Public Auditor]

62
Selected terms at a glance
Hybrid notes
Hybrid notes issued by Volkswagen are
classified in their entirety as equity. The issuer
has call options at defined dates during their
perpetual maturities. They pay a fixed coupon
until the first possible call date, followed by a
variable rate depending on their terms and
conditions.
Modular Electric Drive Toolkit (MEB)
The modular system is being developed for
the manufacturing of electric vehicles. The
MEB establishes parameters for axles,
drive systems, high-voltage batteries,
wheelbases and weight ratios to ensure a
vehicle optimally fulfills the requirements
of e-mobility. The first vehicle based on the
MEB should go into series production in
2020.
Plug-in hybrid
Performance levels of hybrid vehicles.
Plug-in hybrid electric vehicles (PHEVs)
have a larger battery with a correspond-
ingly higher capacity that can be charged
via the combustion engine, the brake
system, or an electrical outlet. This
increases the range of the vehicle.
Test procedure
Levels of fuel consumption and exhaust gas
emissions for vehicles registered in Europe
were previously measured on a chassis
dynamometer with the help of the “New
European Driving Cycle (NEDC)”. Since fall 2017,
the existing test procedure for emissions and
fuel consumption used in the EU is being
gradually replaced by the Worldwide
Harmonized Light-Duty Vehicles Test Procedure
(WLTP). This has been in place for new vehicle
types since fall 2017 and will apply to all new
vehicles since fall 2018. The aim of this new
test cycle is to state CO2 emissions and fuel
consumption in a more practice-oriented
manner. A further important European
regulation is the Real Driving Emissions (RDE)
for passenger cars and light commercial
vehicles, which also monitors emissions using
portable emission measuring technology in real
road traffic.
Capitalization ratio
The capitalization ratio is defined as the ratio of
capitalized development costs to total research
and development costs in the Automotive
Division. It shows the proportion of primary
research and development costs subject to
capitalization.
Equity ratio
The equity ratio measures the percentage of
total assets attributable to shareholders’ equity
as of a reporting date. This ratio indicates the
stability and financial strength of the company
and shows the degree of financial indepen-
dence.
Gross margin
Gross margin is the percentage of sales revenue
attributable to gross profit in a period. Gross
margin provides information on profitability
net of cost of sales.
Net cash flow
Net cash flow in the Automotive Division
represents the excess funds from operating
activities available for dividend payments, for
example. It is calculated as cash flows from
operating activities less cash flows from
investing activities attributable to operating
activities.
Net liquidity
Net liquidity in the Automotive Division is the
total of cash, cash equivalents, securities, loans
and time deposits not financed by third-party
borrowings. To safeguard our business activ-
ities, we have formulated the strategic target
that net liquidity in the Automotive Division
should amount to approximately 10% of the
consolidated sales revenue.
Operating result
Sales revenue, which does not include the
figures for our equity-accounted Chinese joint
ventures, reflects our market success in finan-
cial terms. Following adjustment for our use of
resources, the operating result reflects the
Company’s actual business activity and docu-
ments the economic success of our core busi-
ness.
Operating return on sales
The operating return on sales is the ratio of the
operating result to sales revenue.
Ratio of capex to sales revenue
The ratio of capex (investments in property,
plant and equipment, investment property and
intangible assets, excluding capitalized develop-
ment costs) to sales revenue in the Automotive
Division reflects both our innovative power and
our future competitiveness. It shows our capital
expenditure – largely for modernizing and
expanding our product range and for environ-
mentally friendly drivetrains, as well as for
adjusting the production capacity and improving
production processes – in relation to the Auto-
motive Division’s sales revenue.
Research and development ratio
The research and development ratio (R&D ratio)
in the Automotive Division shows total research
and development costs in relation to sales
revenue. Research and development costs
comprise a range of expenses, from futurology
through to the development of marketable
products. Particular emphasis is placed on the
environmentally friendly orientation of our
product portfolio. The R&D ratio underscores
the efforts made to ensure the Company’s
future viability: the goal of competitive profit-
ability geared to sustainable growth.
Return on sales before tax
The return on sales is the ratio of profit before
tax to sales revenue in a period, expressed as a
percentage. It shows the level of profit gener-
ated for each unit of sales revenue. The return
on sales provides information on the profit-
ability of all business activities before
deducting income tax expense.
Glossary

P U B L I S H E D B Y
Volkswagen AG Group Financial Publications Letterbox 1848 2 38436 Wolfsburg Germany Phone +49 (0) 5361 9 0 Fax +49 (0) 5361 9 28282 I N V E STO R R E L AT I O N S
Volkswagen AG Investor Relations Letterbox 1849 38436 Wolfsburg Germany Phone +49 (0) 5361 9 0 Fax +49 (0) 5361 9 30411 E-Mail [email protected] Internet www.volkswagenag.com/en/InvestorRelations.html F I N A N C I A L C A L E N DA R March 16, 2021 Volkswagen AG Annual Media Conference and Investor Conference May 6, 2021 Interim Report January – March 2021 July 29, 2021 Interim Report January – July 2021 October 28, 2021 Interim Report January – September 2021
This Interim Report is also available on the Internet, in German and English, at: www.volkswagenag.com/en/InvestorRelations.html 058.809.598.20
Contact Information

www.volkswagenag.com
20
20