janus henderson vit enterprise portfolio
TRANSCRIPT

SEMIANNUAL REPORT June 30, 2020
Janus Henderson VIT Enterprise Portfolio
Janus Aspen Series
Beginning on January 1, 2021, as permitted by regulations adopted by the Securities and Exchange Commission, the insurance company that offers your variable life insurance contract or variable annuity contract, may determine that it will no longer send you paper copies of the Portfolio’s shareholder reports, unless you specifically request paper copies of the reports. Beginning on January 1, 2021, for shareholders who are not insurance contract holders, paper copies of the Portfolio’s shareholder reports will no longer be sent by mail unless you specifically request paper copies of the reports. Instead, the reports will be made available on a website, and your insurance company or plan sponsor, broker-dealer, or financial intermediary will notify you by mail each time a report is posted and provide you with a website link to access the report. Instructions for requesting paper copies will be provided by your insurance company or plan sponsor, broker-dealer, or financial intermediary. If you already elected to receive shareholder reports electronically, you will not be affected by this change and you need not take any action. You may elect to receive shareholder reports and other communications from the Portfolio electronically by contacting your insurance company or plan sponsor, broker-dealer, or other financial intermediary. You may elect to receive all future reports in paper free of charge by contacting your insurance company or plan sponsor, broker dealer or other financial intermediary. Your election to receive reports in paper will apply to all funds held in your account with your insurance company or plan sponsor, broker dealer or other financial intermediary.
HIGHLIGHTS
• Portfolio management perspective • Investment strategy behind your portfolio • Portfolio performance, characteristics
and holdings

Table of Contents
Janus Henderson VIT Enterprise Portfolio Management Commentary and Schedule of Investments ............................1 Notes to Schedule of Investments and Other Information........................ 14 Statement of Assets and Liabilities ............................................................................. 16 Statement of Operations ...................................................................................................... 17 Statements of Changes in Net Assets...................................................................... 18 Financial Highlights .................................................................................................................. 19 Notes to Financial Statements ........................................................................................ 20 Additional Information............................................................................................................. 32 Useful Information About Your Portfolio Report ............................................... 39

Janus Henderson VIT Enterprise Portfolio (unaudited)(closed to certain new investors)
Janus Aspen Series 1
PORTFOLIO SNAPSHOT We believe that investing in companies with sustainable growth and high return on invested capital can drive consistent returns and allow us to outperform our benchmark and peers over time, with moderate risk. We seek to identify mid-cap companies with high-quality management teams that wisely allocate capital to fund and drive growth over time.
Philip Cody Wheaton co-portfolio manager
Brian Demain co-portfolio manager
PERFORMANCE OVERVIEW During the six months ended June 30, 2019, Janus Henderson VIT Enterprise Portfolio’s Institutional Shares and Service Shares returned -6.92% and -7.02, respectively. Meanwhile, the Portfolio’s benchmark, the Russell Midcap® Growth Index, returned 4.16%.
INVESTMENT ENVIRONMENT Mid-cap stocks experienced heightened volatility in the first half of 2020 as the COVID 19 outbreak that began in China spread worldwide, disrupting travel and supply chains. The pandemic halted economic activity and triggered a first quarter equity sell-off of historic proportions. Stocks recovered ground in the second quarter as declining COVID-19 infection rates led many states to reopen their economies in May and June. As a result, investors looked past weak economic data to focus on prospects for recovery later this year. The Federal Reserve (Fed) provided support for the U.S. economy with near-zero interest rates and expanded asset buying.
PERFORMANCE DISCUSSION In our view, one of the most stunning developments of this unprecedented period has been the extreme outperformance of the most expensive index stocks – both through the market decline in the first quarter and the rebound of the second quarter. Segmenting the Index into deciles based on a price-to-sales basis, the most expensive decile had a total return of 50.2% for the first half of 2020, compared to a 4.2% total return for the Index. Additionally, the second most-expensive decile’s total return was 22.6% in the first half of 2020. The remaining 80% of the benchmark’s contribution to return was -5.1%.
An unusual combination of factors has contributed to this imbalance, including a winner-take-all economy that allows companies to quickly scale and dominate markets. Fed stimulus has also fueled higher valuations for growth stocks. Many of these companies may take years to reach
profitability, and falling interest rates have reduced the market’s discounting mechanism. This combination of inexpensive capital and the Fed’s willingness to backstop debt markets has likely encouraged investors to take on greater risk. Additionally, heightened uncertainty around COVID-19 has led investors to pay high prices for any stocks they view as either insulated or benefiting from disruptions to the physical economy. This confluence of forces has pushed valuations higher even when companies have not substantially raised their revenue or earnings outlooks. Instead, these valuation increases have been driven by multiple expansion, a dynamic we find worrisome and unsustainable. In our view, these expensive stocks, in many cases, will fail to produce the future growth rates needed to justify current valuations.
While our more cautious approach to these overvalued stocks hurt relative performance, we recognize a wider disconnect with the capitalization-weighted Index itself. The Russell Midcap Growth Index has become increasingly narrow, shrinking from 500 names in 2016 to just 330 today. (It shrunk 18% with the recent June reconstitution.) As the Index has shrunk, more moderate growth stocks have fallen away, while a few high-value names are having an outsized effect. Worrisome to us, as the Index has become more concentrated, is it has also become more expensive. The Index forward price-to-earnings ratio reached 41.7 as of June 30, compared with a multiple of 31 before the June reconstitution, and an average of 20 to 25 over the last seven years. In other words, the recent reconstitution has made the Index 26% more expensive just by reweighting the highest multiple stocks.
While the Index may have changed, our investment approach has not. We remain disciplined growth investors with a focus on risk-adjusted returns. This requires not just finding great companies with the potential for superior long-term growth but also managing risk exposure by not overpaying for them. This balanced, selective approach has worked for us long term, and it has

Janus Henderson VIT Enterprise Portfolio (unaudited)(closed to certain new investors)
2 JUNE 30, 2020
helped us identify a cohort of reasonably valued, dynamic growth companies we believe are ideal for the Portfolio. As a result, while our more cautious approach to high value stocks dampened performance relative to the Russell Midcap Growth Index, our stock picking helped us outperform the broader mid-cap market, as reflected by the Russell Midcap® Index.
DERIVATIVES USE Please see the Derivative Instruments section in the “Notes to Financial Statements” for a discussion of derivatives used by the Portfolio.
OUTLOOK Looking ahead, we recognize that heighted uncertainty around COVID-19 may persist in the near term, contributing to some unusual market dynamics. At the same time, we believe a rally fueled by multiple expansion is not sustainable long term. Rather than trying to predict the timing of market shifts, we remain committed to our long-term investment approach that focuses on a three- to five-year time horizon. We would also note that while we will not pay any price for growth, we recognize the pitfalls of value investing in a period of tremendous business disruption. We have no interest in buying stocks that appear undervalued but face considerable structural headwinds. Instead, we have tried to find a middle way, focusing on well-managed, fundamentally strong growth companies with durable competitive advantages and strong earnings trajectories that we believe fully support their valuations. This philosophy has worked to our advantage over the long term, and we believe it is the best way to manage near-term uncertainty and ultimately deliver strong risk-adjusted returns.
Thank you for your investment in Janus Henderson VIT Enterprise Portfolio.

Janus Henderson VIT Enterprise Portfolio (unaudited)(closed to certain new investors) Portfolio At A Glance June 30, 2020
Janus Aspen Series 3
5 Top Contributors - Holdings 5 Top Detractors - Holdings
Average Weight
Relative Contribution
Average Weight
Relative Contribution
Wayfair Inc 0.69% 0.66% Sensata Technologies Holding PLC 1.60% -0.65% Nice Ltd (ADR) 2.71% 0.42% Magellan Midstream Partners LP 1.60% -0.58% Catalent Inc 1.28% 0.28% Norwegian Cruise Line Holdings Ltd 0.29% -0.56% Crown Castle International Corp 2.16% 0.28% Boston Scientific Corp 1.94% -0.56% Royalty Pharma PLC - Class A 0.06% 0.26% Cimpress PLC 0.90% -0.52%
5 Top Contributors - Sectors*
Relative Portfolio Russell Midcap Growth Index
Contribution Average Weight Average Weight Communication Services 0.11% 0.50% 4.50% Materials 0.07% 0.99% 2.63% Other** 0.00% 5.81% 0.00% Consumer Staples -0.04% 0.00% 3.35% Energy -0.10% 1.60% 0.92%
5 Top Detractors - Sectors*
Relative Portfolio Russell Midcap Growth Index
Contribution Average Weight Average Weight Information Technology -4.19% 33.87% 35.21% Health Care -3.40% 17.96% 16.34% Financials -1.78% 11.81% 4.31% Industrials -1.17% 16.59% 16.11% Consumer Discretionary -0.46% 6.85% 13.83%
Relative contribution reflects how the portolio's holdings impacted return relative to the benchmark. Cash and securities not held in the portfolio are not shown. For equity portfolios, relative contribution compares the performance of a security in the portfolio to the benchmark's total return, factoring in the difference in weight of that security in the benchmark. Returns are calculated using daily returns and previous day ending weights rolled up by ticker, excluding fixed income securities, gross of advisory fees, may exclude certain derivatives and will differ from actual performance. Performance attribution reflects returns gross of advisory fees and may differ from actual returns as they are based on end of day holdings. Attribution is calculated by geometrically linking daily returns for the portfolio and index.
* Based on sector classification according to the Global Industry Classification Standard (“GICS”) codes, which are the exclusive property and a service mark of MSCI Inc. and Standard & Poor’s.
** Not a GICS classified sector.

Janus Henderson VIT Enterprise Portfolio (unaudited)(closed to certain new investors) Portfolio At A Glance June 30, 2020
4 JUNE 30, 2020
5 Largest Equity Holdings - (% of Net Assets) Constellation Software Inc/Canada
Software 2.9% Nice Ltd (ADR)
Software 2.6% Microchip Technology Inc
Semiconductor & Semiconductor Equipment 2.5% SS&C Technologies Holdings Inc
Software 2.4% Aon PLC
Insurance 2.2% 12.6%
Asset Allocation - (% of Net Assets) Common Stocks 94.5% Investment Companies 5.0% Investments Purchased with Cash
Collateral from Securities Lending
1.0% Limited Partnership Interests 0.4% Other (0.9)% 100.0%
Top Country Allocations - Long Positions - (% of Investment Securities) As of June 30, 2020
6.1%
2.6%
1.5%
0.8%
88.2%
0% 20% 40% 60% 80% 100%
United States
Canada
Israel
Australia
France
As of December 31, 2019
5.8%
2.4%
0.9%
0.8%
89.4%
0% 20% 40% 60% 80% 100%
United States
Canada
Israel
Australia
France

Janus Henderson VIT Enterprise Portfolio (unaudited)(closed to certain new investors) Performance
Janus Aspen Series 5
Average Annual Total Return - for the periods ended June 30, 2020 Expense Ratios
Fiscal
Year-to-Date One Year
Five Year
Ten Year
Since Inception*
Total Annual Fund Operating Expenses‡
Institutional Shares(1) -6.92% -0.35% 12.01% 15.49% 10.93% 0.72%
Service Shares(1) -7.02% -0.59% 11.73% 15.20% 10.65% 0.97%
Russell Midcap Growth Index 4.16% 11.91% 11.60% 15.09% 10.09% Morningstar Quartile - Institutional Shares - 4th 1st 1st 2nd Morningstar Ranking - based on total returns for Mid-Cap Growth Funds - 553/608 163/564 96/509 47/150
Returns quoted are past performance and do not guarantee future results; current performance may be lower or higher. Investment returns and principal value will vary; there may be a gain or loss when shares are sold. For the most recent month-end performance call 800.668.0434 or visit janushenderson.com/VITperformance.
Performance may be affected by risks that include those associated with non-diversification, portfolio turnover, short sales, potential conflicts of interest, foreign and emerging markets, initial public offerings (IPOs), high-yield and high-risk securities, undervalued, overlooked and smaller capitalization companies, real estate related securities including Real Estate Investment Trusts (REITs), derivatives, and commodity-linked investments. Each product has different risks. Please see the prospectus for more information about risks, holdings and other details.
Returns do not reflect the deduction of fees, charges or expenses of any insurance product or qualified plan. If applied, returns would have been lower.
Returns include reinvestment of all dividends and distributions and do not reflect the deduction of taxes that a shareholder would pay on Portfolio distributions or redemptions of Portfolio shares. The returns do not include adjustments in accordance with generally accepted accounting principles required at the period end for financial reporting purposes.
Performance for Service Shares prior to December 31, 1999 reflects the performance of Institutional Shares, adjusted to reflect the expenses of Service Shares.
Ranking is for the share class shown only; other classes may have different performance characteristics.
© 2020 Morningstar, Inc. All Rights Reserved. There is no assurance that the investment process will consistently lead to successful investing.
See Notes to Schedule of Investments and Other Information for index definitions.
Index performance does not reflect the expenses of managing a portfolio as an index is unmanaged and not available for direct investment.
See “Useful Information About Your Portfolio Report.”
See important disclosures on the next page.

Janus Henderson VIT Enterprise Portfolio (unaudited)(closed to certain new investors) Performance
6 JUNE 30, 2020
*The Portfolio’s inception date – September 13, 1993
‡ As stated in the prospectus. See Financial Highlights for actual expense ratios during the reporting period.
(1) Closed to certain new investors.

Janus Henderson VIT Enterprise Portfolio (unaudited)(closed to certain new investors) Expense Examples
Janus Aspen Series 7
As a shareholder of the Portfolio, you incur two types of costs: (1) transaction costs and (2) ongoing costs, including management fees; 12b-1 distribution and shareholder servicing fees (applicable to Service Shares only); transfer agent fees and expenses payable pursuant to the Transfer Agency Agreement; and other Portfolio expenses. This example is intended to help you understand your ongoing costs (in dollars) of investing in the Portfolio and to compare these costs with the ongoing costs of investing in other mutual funds. To do so, compare this 5% hypothetical example with the 5% hypothetical examples that appear in the shareholder reports of the other funds. The example is based upon an investment of $1,000 invested at the beginning of the period and held for the six-months indicated, unless noted otherwise in the table and footnotes below.
Actual Expenses The information in the table under the heading “Actual” provides information about actual account values and actual expenses. You may use the information in these columns, together with the amount you invested, to estimate the expenses that you paid over the period. Simply divide your account value by $1,000 (for example, an $8,600 account value divided by $1,000 = 8.6), then multiply the result by the number in the appropriate column for your share class under the heading entitled “Expenses Paid During Period” to estimate the expenses you paid on your account during the period.
Hypothetical Example for Comparison Purposes The information in the table under the heading “Hypothetical (5% return before expenses)” provides information about hypothetical account values and hypothetical expenses based upon the Portfolio’s actual expense ratio and an assumed rate of return of 5% per year before expenses, which is not the Portfolio’s actual return. The hypothetical account values and expenses may not be used to estimate the actual ending account balance or expenses you paid for the period. You may use this information to compare the ongoing costs of investing in the Portfolio and other funds. To do so, compare this 5% hypothetical example with the 5% hypothetical examples that appear in the shareholder reports of the other funds. Additionally, for an analysis of the fees associated with an investment in either share class or other similar funds, please visit www.finra.org/fundanalyzer. Please note that the expenses shown in the table are meant to highlight your ongoing costs only and do not reflect any transaction costs, such as any charges at the separate account level or contract level. These fees are fully described in the Portfolio’s prospectuses. Therefore, the hypothetical examples are useful in comparing ongoing costs only, and will not help you determine the relative total costs of owning different funds. In addition, if these transaction costs were included, your costs would have been higher.
Actual Hypothetical
(5% return before expenses)
Beginning Account
Value (1/1/20)
Ending Account
Value (6/30/20)
Expenses Paid During
Period (1/1/20 - 6/30/20)†
BeginningAccount
Value (1/1/20)
Ending Account
Value (6/30/20)
Expenses Paid During
Period (1/1/20 - 6/30/20)†
Net AnnualizedExpense Ratio
(1/1/20 - 6/30/20)
Institutional Shares $1,000.00 $930.80 $3.41 $1,000.00 $1,021.33 $3.57 0.71%
Service Shares $1,000.00 $929.80 $4.61 $1,000.00 $1,020.09 $4.82 0.96% † Expenses Paid During Period are equal to the Net Annualized Expense Ratio multiplied by the average account value over the period, multiplied by
182/366 (to reflect the one-half year period). Expenses in the examples include the effect of applicable fee waivers and/or expense reimbursements, if any. Had such waivers and/or reimbursements not been in effect, your expenses would have been higher. Please refer to the Notes to Financial Statements or the Portfolio’s prospectuses for more information regarding waivers and/or reimbursements.

Janus Henderson VIT Enterprise Portfolio Schedule of Investments (unaudited) June 30, 2020
See Notes to Schedule of Investments and Other Information and Notes to Financial Statements.
8 JUNE 30, 2020
Shares orPrincipal Amounts
Value
Common Stocks – 94.5% Aerospace & Defense – 2.9% HEICO Corp 66,397 $5,394,092 L3Harris Technologies Inc 105,294 17,865,233 Teledyne Technologies Inc* 58,119 18,072,103 41,331,428Airlines – 0.6% Ryanair Holdings PLC (ADR)* 135,999 9,022,174Auto Components – 0.4% Visteon Corp* 80,376 5,505,756Banks – 0.6% SVB Financial Group* 37,050 7,985,387Biotechnology – 1.4% Ascendis Pharma A/S (ADR)* 24,707 3,654,165 Neurocrine Biosciences Inc* 66,089 8,062,858 Sarepta Therapeutics Inc* 53,767 8,621,001 20,338,024Capital Markets – 3.5% Cboe Global Markets Inc 105,467 9,837,962 LPL Financial Holdings Inc 319,066 25,014,774 MSCI Inc 23,957 7,997,326 TD Ameritrade Holding Corp 208,925 7,600,692 50,450,754Commercial Services & Supplies – 2.7% Cimpress PLC* 150,495 11,488,788 Edenred 251,829 11,000,699 Ritchie Bros Auctioneers Inc 377,759 15,431,455 37,920,942Containers & Packaging – 1.0% Sealed Air Corp 451,026 14,816,204Diversified Consumer Services – 1.5% frontdoor Inc* 181,704 8,054,938 ServiceMaster Global Holdings Inc* 382,086 13,636,649 21,691,587Electric Utilities – 0.7% Alliant Energy Corp 196,004 9,376,831Electrical Equipment – 1.5% Sensata Technologies Holding PLC* 581,594 21,652,745Electronic Equipment, Instruments & Components – 5.0% Dolby Laboratories Inc 240,399 15,835,082 Flex Ltd* 1,352,370 13,861,793 National Instruments Corp 424,583 16,435,608 TE Connectivity Ltd 313,876 25,596,588 71,729,071Entertainment – 0.4% Liberty Media Corp-Liberty Formula One* 188,106 5,964,841Equity Real Estate Investment Trusts (REITs) – 3.4% Crown Castle International Corp 163,409 27,346,496 Lamar Advertising Co 314,915 21,023,725 48,370,221Health Care Equipment & Supplies – 8.3% Boston Scientific Corp* 733,376 25,748,831 Cooper Cos Inc 88,909 25,218,149 Dentsply Sirona Inc 240,712 10,605,771 ICU Medical Inc* 55,143 10,163,406 STERIS PLC 156,627 24,032,847 Teleflex Inc 39,161 14,253,821 Varian Medical Systems Inc* 72,022 8,824,135 118,846,960

Janus Henderson VIT Enterprise Portfolio Schedule of Investments (unaudited) June 30, 2020
See Notes to Schedule of Investments and Other Information and Notes to Financial Statements.
Janus Aspen Series 9
Shares orPrincipal Amounts
Value
Common Stocks – (continued) Hotels, Restaurants & Leisure – 1.7% Aramark 333,527 $7,527,704 Dunkin' Brands Group Inc 253,335 16,525,042 24,052,746Industrial Conglomerates – 0.5% Carlisle Cos Inc 60,476 7,237,163Information Technology Services – 11.5% Amdocs Ltd 369,156 22,474,217 Broadridge Financial Solutions Inc 230,043 29,029,126 Euronet Worldwide Inc* 55,068 5,276,616 Fidelity National Information Services Inc 188,370 25,258,533 Global Payments Inc 181,579 30,799,430 GoDaddy Inc* 382,310 28,034,792 WEX Inc* 138,445 22,844,809 163,717,523Insurance – 6.5% Aon PLC 163,736 31,535,554 Intact Financial Corp 252,478 24,033,212 Willis Towers Watson PLC 85,231 16,786,245 WR Berkley Corp 368,251 21,097,100 93,452,111Internet & Direct Marketing Retail – 1.4% Wayfair Inc*,# 98,436 19,451,938Life Sciences Tools & Services – 5.2% IQVIA Holdings Inc* 142,379 20,200,733 PerkinElmer Inc 304,273 29,846,139 PRA Health Sciences Inc* 103,949 10,113,198 Waters Corp* 79,450 14,332,780 74,492,850Machinery – 3.0% Ingersoll Rand Inc* 354,303 9,963,000 Middleby Corp* 86,192 6,803,997 Rexnord Corp 451,039 13,147,787 Wabtec Corp 230,728 13,283,011 43,197,795Oil, Gas & Consumable Fuels – 1.5% Magellan Midstream Partners LP 506,502 21,865,691Pharmaceuticals – 3.5% Bristol-Myers Squibb Co 157,065 9,235,422 Catalent Inc* 289,724 21,236,769 Elanco Animal Health Inc* 427,846 9,177,297 Royalty Pharma PLC - Class A* 203,963 9,902,404 49,551,892Professional Services – 4.0% CoStar Group Inc* 26,849 19,080,779 IHS Markit Ltd 164,698 12,434,699 Verisk Analytics Inc 149,139 25,383,458 56,898,936Semiconductor & Semiconductor Equipment – 8.6% KLA Corp 152,971 29,749,800 Lam Research Corp 71,717 23,197,581 Microchip Technology Inc 341,587 35,972,527 ON Semiconductor Corp* 993,366 19,688,514 Xilinx Inc 143,235 14,092,892 122,701,314Software – 10.5% Atlassian Corp PLC* 118,781 21,412,651 Ceridian HCM Holding Inc* 138,634 10,989,517 Constellation Software Inc/Canada 36,314 41,008,816

Janus Henderson VIT Enterprise Portfolio Schedule of Investments (unaudited) June 30, 2020
See Notes to Schedule of Investments and Other Information and Notes to Financial Statements.
10 JUNE 30, 2020
Shares orPrincipal Amounts
Value
Common Stocks – (continued) Software – (continued) Dynatrace Inc* 148,136 $6,014,322 Nice Ltd (ADR)* 197,967 37,463,275 SS&C Technologies Holdings Inc 596,849 33,710,032 150,598,613Specialty Retail – 1.5% CarMax Inc* 232,130 20,787,242Textiles, Apparel & Luxury Goods – 0.5% Gildan Activewear Inc 503,751 7,803,103Trading Companies & Distributors – 0.7% Ferguson PLC 124,438 10,177,968Total Common Stocks (cost $825,920,389) 1,350,989,810Limited Partnership Interests – 0.4% Biotechnology – 0.4% RPI International Holdings LP§ (cost $2,783,572) 135,120 5,904,068Investment Companies – 5.0% Money Markets – 5.0% Janus Henderson Cash Liquidity Fund LLC, 0.1535%ºº,£ (cost $70,874,908) 70,873,303 70,880,390Investments Purchased with Cash Collateral from Securities Lending – 1.0% Investment Companies – 0.8% Janus Henderson Cash Collateral Fund LLC, 0.0368%ºº,£ 11,899,932 11,899,932Time Deposits – 0.2% Royal Bank of Canada, 0.0900%, 7/1/20 $2,974,983 2,974,983Total Investments Purchased with Cash Collateral from Securities Lending (cost $14,874,915) 14,874,915Total Investments (total cost $914,453,784) – 100.9% 1,442,649,183Liabilities, net of Cash, Receivables and Other Assets – (0.9)% (13,211,527)Net Assets – 100% $1,429,437,656 Summary of Investments by Country - (Long Positions) (unaudited) % of Investment Country Value Securities United States $1,271,819,633 88.2 % Canada 88,276,586 6.1 Israel 37,463,275 2.6 Australia 21,412,651 1.5 France 11,000,699 0.8 Ireland 9,022,174 0.6 Denmark 3,654,165 0.2
Total $1,442,649,183 100.0 %

Janus Henderson VIT Enterprise Portfolio Schedule of Investments (unaudited) June 30, 2020
See Notes to Schedule of Investments and Other Information and Notes to Financial Statements.
Janus Aspen Series 11
Schedules of Affiliated Investments – (% of Net Assets)
DividendIncome
RealizedGain/(Loss)
Change in Unrealized
Appreciation/ Depreciation
Valueat 6/30/20
Investment Companies - 5.0% Money Markets - 5.0% Janus Henderson Cash Liquidity Fund
LLC, 0.1535%ºº $ 406,580 $ 5,632 $ 7,044 $ 70,880,390
Investments Purchased with Cash Collateral from Securities Lending - 0.8% Investment Companies - 0.8% Janus Henderson Cash Collateral Fund
LLC, 0.0368%ºº 8,655Δ - - 11,899,932Total Affiliated Investments - 5.8% $ 415,235 $ 5,632 $ 7,044 $ 82,780,322
Value at 12/31/19 Purchases Sales Proceeds
Valueat 6/30/20
Investment Companies - 5.0% Money Markets - 5.0% Janus Henderson Cash Liquidity Fund
LLC, 0.1535%ºº 106,440,118 88,005,359 (123,577,763) 70,880,390
Investments Purchased with Cash Collateral from Securities Lending - 0.8% Investment Companies - 0.8% Janus Henderson Cash Collateral Fund
LLC, 0.0368%ºº 3,921,920 103,041,817 (95,063,805) 11,899,932

Janus Henderson VIT Enterprise Portfolio Schedule of Investments (unaudited) June 30, 2020
See Notes to Schedule of Investments and Other Information and Notes to Financial Statements.
12 JUNE 30, 2020
Schedule of Forward Foreign Currency Exchange Contracts, Open
Counterparty/ Foreign Currency
Settlement Date
Foreign Currency Amount (Sold)/
Purchased
USD Currency Amount (Sold)/
Purchased
Market Value and Unrealized
Appreciation/ (Depreciation)
Barclays Capital, Inc.:
Canadian Dollar 7/16/20 (2,572,000) $ 1,832,868 (62,018) Citibank, National Association:
Canadian Dollar 9/24/20 (5,865,000) 4,300,500 (21,100)
Euro 9/24/20 (4,748,000) 5,340,112 (3,354) (24,454) Credit Suisse International:
Canadian Dollar 9/10/20 (11,974,000) 8,872,522 49,772 HSBC Securities (USA), Inc.:
Canadian Dollar 9/24/20 (10,802,000) 7,910,007 (49,402)
Euro 9/24/20 (3,692,800) 4,149,551 (6,377) (55,779) JPMorgan Chase Bank, National Association:
Euro 7/16/20 (8,843,000) 9,556,354 (381,275) Total $ (473,754)
The following table, grouped by derivative type, provides information about the fair value and location of derivatives within the Statement of Assets and Liabilities as of June 30, 2020.
Fair Value of Derivative Instruments (not accounted for as hedging instruments) as of June 30, 2020
Currency
Contracts
Asset Derivatives: Forward foreign currency exchange contracts $ 49,772
Liability Derivatives: Forward foreign currency exchange contracts $523,526

Janus Henderson VIT Enterprise Portfolio Schedule of Investments (unaudited) June 30, 2020
See Notes to Schedule of Investments and Other Information and Notes to Financial Statements.
Janus Aspen Series 13
The following tables provide information about the effect of derivatives and hedging activities on the Portfolio’s Statement of Operations for the period ended June 30, 2020.
The effect of Derivative Instruments (not accounted for as hedging instruments) on the Statement of Operations for the period ended June 30, 2020
Amount of Realized Gain/(Loss) Recognized on Derivatives
Derivative Currency
ContractsForward foreign currency exchange contracts $1,396,271
Amount of Change in Unrealized Appreciation/Depreciation Recognized on Derivatives
Derivative Currency
ContractsForward foreign currency exchange contracts $ 55,089
Please see the "Net Realized Gain/(Loss) on Investments" and "Change in Unrealized Net Appreciation/Depreciation" sections of the Portfolio’s Statement of Operations.
Average Ending Monthly Market Value of Derivative Instruments During the Period Ended June 30, 2020 Market Value(a)
Forward foreign currency exchange contracts, sold $ 44,409,861
(a) Forward foreign currency exchange contracts are reported as the average ending monthly currency amount sold.

Janus Henderson VIT Enterprise Portfolio Notes to Schedule of Investments and Other Information (unaudited)
14 JUNE 30, 2020
Russell Midcap® Growth Index Russell Midcap® Growth Index reflects the performance of U.S. mid-cap equities with higher price-to-book
ratios and higher forecasted growth values.
ADR American Depositary Receipt
LLC Limited Liability Company
LP Limited Partnership
PLC Public Limited Company
* Non-income producing security.
ºº Rate shown is the 7-day yield as of June 30, 2020.
# Loaned security; a portion of the security is on loan at June 30, 2020.
£ The Portfolio may invest in certain securities that are considered affiliated companies. As defined by the Investment Company Act of 1940, as amended, an affiliated company is one in which the Portfolio owns 5% or more of the outstanding voting securities, or a company which is under common ownership or control.
Δ Net of income paid to the securities lending agent and rebates paid to the borrowing counterparties.
§ Schedule of Restricted Securities (as of June 30, 2020) Value as a Acquisition % of Net
Date Cost Value AssetsRPI International Holdings LP 2/4/20 $ 2,783,572 $ 5,904,068 0.4%
The Portfolio has registration rights for certain restricted securities held as of June 30, 2020. The issuer incurs all registration costs.

Janus Henderson VIT Enterprise Portfolio Notes to Schedule of Investments and Other Information (unaudited)
Janus Aspen Series 15
The following is a summary of the inputs that were used to value the Portfolio’s investments in securities and other financial instruments as of June 30, 2020. See Notes to Financial Statements for more information.
Valuation Inputs Summary Level 2 - Level 3 - Level 1 - Other Significant Significant Quoted Prices Observable Inputs Unobservable Inputs
Assets
Investments In Securities:
Common Stocks Commercial Services & Supplies $ 26,920,243 $ 11,000,699 $ -Trading Companies & Distributors - 10,177,968 -All Other 1,302,890,900 - -Limited Partnership Interests - 5,904,068 -Investment Companies - 70,880,390 -Investments Purchased with Cash Collateral from Securities Lending - 14,874,915 -Total Investments in Securities $ 1,329,811,143 $ 112,838,040 $ -
Other Financial Instruments(a): Forward Foreign Currency Exchange Contracts - 49,772 -Total Assets $ 1,329,811,143 $ 112,887,812 $ -
Liabilities
Other Financial Instruments(a): Forward Foreign Currency Exchange Contracts $ - $ 523,526 $ -
(a) Other financial instruments include forward foreign currency exchange, futures, written options, written swaptions, and swap contracts. Forward foreign currency exchange contracts are reported at their unrealized appreciation/(depreciation) at measurement date, which represents the change in the contract's value from trade date. Futures, certain written options on futures, and centrally cleared swap contracts are reported at their variation margin at measurement date, which represents the amount due to/from the Portfolio at that date. Written options, written swaptions, and other swap contracts are reported at their market value at measurement date.

Janus Henderson VIT Enterprise Portfolio Statement of Assets and Liabilities (unaudited) June 30, 2020
See Notes to Financial Statements.
16 JUNE 30, 2020
Assets: Unaffiliated investments, at value(1)(2) $ 1,359,868,861 Affiliated investments, at value(3) 82,780,322 Forward foreign currency exchange contracts 49,772 Closed foreign currency contracts 22,233 Non-interested Trustees' deferred compensation 29,375 Receivables: Investments sold 3,763,658 Portfolio shares sold 705,382 Dividends 431,314 Dividends from affiliates 11,686 Other assets 6,832 Total Assets 1,447,669,435 Liabilities: Due to custodian 541 Foreign cash due to custodian 51 Collateral for securities loaned (Note 3) 14,874,915 Forward foreign currency exchange contracts 523,526 Closed foreign currency contracts 740,028 Payables: — Advisory fees 754,291 Portfolio shares repurchased 683,218 Investments purchased 288,434 12b-1 Distribution and shareholder servicing fees 153,394 Transfer agent fees and expenses 63,103 Non-interested Trustees' deferred compensation fees 29,375 Professional fees 18,489 Non-interested Trustees' fees and expenses 7,487 Custodian fees 3,348 Affiliated portfolio administration fees payable 2,946 Accrued expenses and other payables 88,633 Total Liabilities 18,231,779 Net Assets $ 1,429,437,656 Net Assets Consist of: Capital (par value and paid-in surplus) $ 873,665,691 Total distributable earnings (loss) 555,771,965 Total Net Assets $ 1,429,437,656 Net Assets - Institutional Shares $ 684,352,728 Shares Outstanding, $0.01 Par Value (unlimited shares authorized) 9,323,593 Net Asset Value Per Share $ 73.40 Net Assets - Service Shares $ 745,084,928 Shares Outstanding, $0.01 Par Value (unlimited shares authorized) 10,920,425 Net Asset Value Per Share $ 68.23
(1) Includes cost of $831,678,944. (2) Includes $14,582,150 of securities on loan. See Note 3 in Notes to Financial Statements. (3) Includes cost of $82,774,840.

Janus Henderson VIT Enterprise Portfolio Statement of Operations (unaudited) For the period ended June 30, 2020
See Notes to Financial Statements.
Janus Aspen Series 17
Investment Income: Dividends $ 7,220,594 Dividends from affiliates 406,580 Affiliated securities lending income, net 8,655 Unaffiliated securities lending income, net 862 Other income 13 Foreign tax withheld (123,372) Total Investment Income 7,513,332 Expenses: Advisory fees 4,506,406 12b-1 Distribution and shareholder servicing fees: Service Shares 900,975 Transfer agent administrative fees and expenses: Institutional Shares 171,868 Service Shares 180,195 Other transfer agent fees and expenses: Institutional Shares 18,773 Service Shares 10,074 Shareholder reports expense 32,464 Professional fees 21,977 Affiliated portfolio administration fees 17,603 Non-interested Trustees’ fees and expenses 13,147 Registration fees 12,431 Custodian fees 8,627 Other expenses 61,436 Total Expenses 5,955,976 Net Investment Income/(Loss) 1,557,356 Net Realized Gain/(Loss) on Investments: Investments and foreign currency transactions 22,695,331 Investments in affiliates 5,632 Forward foreign currency exchange contracts 1,396,271 Total Net Realized Gain/(Loss) on Investments 24,097,234 Change in Unrealized Net Appreciation/Depreciation: Investments, foreign currency translations and non-interested Trustees’ deferred compensation (137,312,752) Investments in affiliates 7,044 Forward foreign currency exchange contracts 55,089 Total Change in Unrealized Net Appreciation/Depreciation (137,250,619) Net Increase/(Decrease) in Net Assets Resulting from Operations $ (111,596,029)

Janus Henderson VIT Enterprise Portfolio Statements of Changes in Net Assets
See Notes to Financial Statements.
18 JUNE 30, 2020
Period ended June 30, 2020
(unaudited) Year ended
December 31, 2019
Operations: Net investment income/(loss) $ 1,557,356 $ 3,462,396 Net realized gain/(loss) on investments 24,097,234 111,811,975 Change in unrealized net appreciation/depreciation (137,250,619) 298,949,675 Net Increase/(Decrease) in Net Assets Resulting from Operations (111,596,029) 414,224,046 Dividends and Distributions to Shareholders: Institutional Shares (51,851,531) (41,927,038) Service Shares (59,611,141) (45,398,321) Net Decrease from Dividends and Distributions to Shareholders (111,462,672) (87,325,359) Capital Share Transactions: Institutional Shares 1,653,833 50,633,453 Service Shares 38,390,896 68,470,182 Net Increase/(Decrease) from Capital Share Transactions 40,044,729 119,103,635 Net Increase/(Decrease) in Net Assets (183,013,972) 446,002,322 Net Assets: Beginning of period 1,612,451,628 1,166,449,306 End of period $ 1,429,437,656 $ 1,612,451,628
Janus Henderson VIT Enterprise Portfolio Financial Highlights
See Notes to Financial Statements.
Janus Aspen Series 19
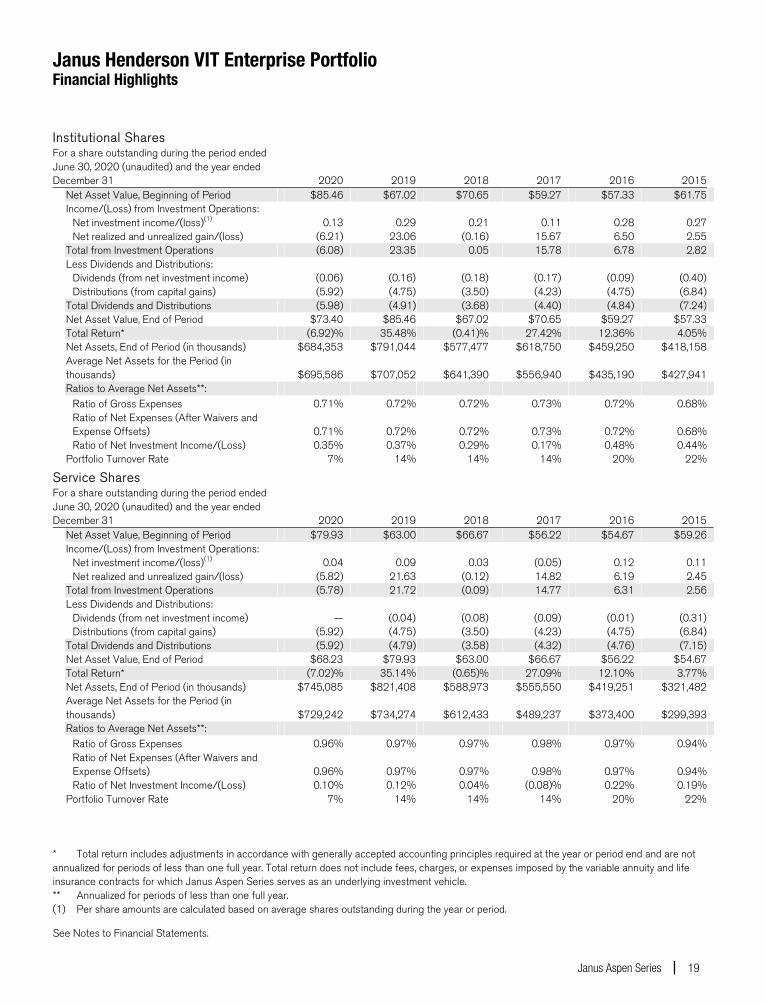
Institutional Shares For a share outstanding during the period ended June 30, 2020 (unaudited) and the year ended December 31 2020 2019 2018 2017 2016 2015 Net Asset Value, Beginning of Period $85.46 $67.02 $70.65 $59.27 $57.33 $61.75 Income/(Loss) from Investment Operations: Net investment income/(loss)(1) 0.13 0.29 0.21 0.11 0.28 0.27 Net realized and unrealized gain/(loss) (6.21) 23.06 (0.16) 15.67 6.50 2.55 Total from Investment Operations (6.08) 23.35 0.05 15.78 6.78 2.82 Less Dividends and Distributions: Dividends (from net investment income) (0.06) (0.16) (0.18) (0.17) (0.09) (0.40) Distributions (from capital gains) (5.92) (4.75) (3.50) (4.23) (4.75) (6.84) Total Dividends and Distributions (5.98) (4.91) (3.68) (4.40) (4.84) (7.24) Net Asset Value, End of Period $73.40 $85.46 $67.02 $70.65 $59.27 $57.33 Total Return* (6.92)% 35.48% (0.41)% 27.42% 12.36% 4.05% Net Assets, End of Period (in thousands) $684,353 $791,044 $577,477 $618,750 $459,250 $418,158
Average Net Assets for the Period (in thousands) $695,586 $707,052 $641,390 $556,940 $435,190 $427,941
Ratios to Average Net Assets**: Ratio of Gross Expenses 0.71% 0.72% 0.72% 0.73% 0.72% 0.68%
Ratio of Net Expenses (After Waivers and Expense Offsets) 0.71% 0.72% 0.72% 0.73% 0.72% 0.68%
Ratio of Net Investment Income/(Loss) 0.35% 0.37% 0.29% 0.17% 0.48% 0.44% Portfolio Turnover Rate 7% 14% 14% 14% 20% 22%
Service Shares For a share outstanding during the period ended June 30, 2020 (unaudited) and the year ended December 31 2020 2019 2018 2017 2016 2015 Net Asset Value, Beginning of Period $79.93 $63.00 $66.67 $56.22 $54.67 $59.26 Income/(Loss) from Investment Operations: Net investment income/(loss)(1) 0.04 0.09 0.03 (0.05) 0.12 0.11 Net realized and unrealized gain/(loss) (5.82) 21.63 (0.12) 14.82 6.19 2.45 Total from Investment Operations (5.78) 21.72 (0.09) 14.77 6.31 2.56 Less Dividends and Distributions: Dividends (from net investment income) — (0.04) (0.08) (0.09) (0.01) (0.31) Distributions (from capital gains) (5.92) (4.75) (3.50) (4.23) (4.75) (6.84) Total Dividends and Distributions (5.92) (4.79) (3.58) (4.32) (4.76) (7.15) Net Asset Value, End of Period $68.23 $79.93 $63.00 $66.67 $56.22 $54.67 Total Return* (7.02)% 35.14% (0.65)% 27.09% 12.10% 3.77% Net Assets, End of Period (in thousands) $745,085 $821,408 $588,973 $555,550 $419,251 $321,482
Average Net Assets for the Period (in thousands) $729,242 $734,274 $612,433 $489,237 $373,400 $299,393
Ratios to Average Net Assets**: Ratio of Gross Expenses 0.96% 0.97% 0.97% 0.98% 0.97% 0.94%
Ratio of Net Expenses (After Waivers and Expense Offsets) 0.96% 0.97% 0.97% 0.98% 0.97% 0.94%
Ratio of Net Investment Income/(Loss) 0.10% 0.12% 0.04% (0.08)% 0.22% 0.19% Portfolio Turnover Rate 7% 14% 14% 14% 20% 22%
* Total return includes adjustments in accordance with generally accepted accounting principles required at the year or period end and are not annualized for periods of less than one full year. Total return does not include fees, charges, or expenses imposed by the variable annuity and life insurance contracts for which Janus Aspen Series serves as an underlying investment vehicle. ** Annualized for periods of less than one full year. (1) Per share amounts are calculated based on average shares outstanding during the year or period.

Janus Henderson VIT Enterprise Portfolio Notes to Financial Statements (unaudited)
20 JUNE 30, 2020
1. Organization and Significant Accounting Policies Janus Henderson VIT Enterprise Portfolio (the “Portfolio”) is a series of Janus Aspen Series (the “Trust”), which is organized as a Delaware statutory trust and is registered under the Investment Company Act of 1940, as amended (the “1940 Act”), as an open-end management investment company, and therefore has applied the specialized accounting and reporting guidance in Financial Accounting Standards Board (“FASB”) Accounting Standards Codification (“ASC”) Topic 946. The Trust offers 11 portfolios, each of which offers multiple share classes, with differing investment objectives and policies. The Portfolio seeks long-term growth of capital. The Portfolio is classified as diversified, as defined in the 1940 Act.
The Portfolio currently offers two classes of shares: Institutional Shares and Service Shares. Each class represents an interest in the same portfolio of investments. Institutional Shares are offered only in connection with investment in and payments under variable insurance contracts as well as certain qualified retirement plans. Service Shares are offered only in connection with investment in and payments under variable insurance contracts as well as certain qualified retirement plans that require a fee from Portfolio assets to procure distribution and administrative services to contract owners and plan participants.
Shareholders, including other portfolios, participating insurance companies, as well as accounts, may from time to time own (beneficially or of record) a significant percentage of the Portfolio’s Shares and can be considered to “control” the Portfolio when that ownership exceeds 25% of the Portfolio’s assets (and which may differ from control as determined in accordance with United States of America generally accepted accounting priciples ("US GAAP")).
The following accounting policies have been followed by the Portfolio and are in conformity with US GAAP.
Investment Valuation Securities held by the Portfolio are valued in accordance with policies and procedures established by and under the supervision of the Trustees (the “Valuation Procedures”). Equity securities traded on a domestic securities exchange are generally valued at the closing prices on the primary market or exchange on which they trade. If such price is lacking for the trading period immediately preceding the time of determination, such securities are valued at their current bid price. Equity securities that are traded on a foreign exchange are generally valued at the closing prices on such markets. In the event that there is no current trading volume on a particular security in such foreign exchange, the bid price from the primary exchange is generally used to value the security. Securities that are traded on the over-the-counter (“OTC”) markets are generally valued at their closing or latest bid prices as available. Foreign securities and currencies are converted to U.S. dollars using the applicable exchange rate in effect at the close of the New York Stock Exchange (“NYSE”). The Portfolio will determine the market value of individual securities held by it by using prices provided by one or more approved professional pricing services or, as needed, by obtaining market quotations from independent broker-dealers. Most debt securities are valued in accordance with the evaluated bid price supplied by the pricing service that is intended to reflect market value. The evaluated bid price supplied by the pricing service is an evaluation that may consider factors such as security prices, yields, maturities and ratings. Certain short-term securities maturing within 60 days or less may be evaluated and valued on an amortized cost basis provided that the amortized cost determined approximates market value. Securities for which market quotations or evaluated prices are not readily available or deemed unreliable are valued at fair value determined in good faith under the Valuation Procedures. Circumstances in which fair value pricing may be utilized include, but are not limited to: (i) a significant event that may affect the securities of a single issuer, such as a merger, bankruptcy, or significant issuer-specific development; (ii) an event that may affect an entire market, such as a natural disaster or significant governmental action; (iii) a nonsignificant event such as a market closing early or not opening, or a security trading halt; and (iv) pricing of a nonvalued security and a restricted or nonpublic security. Special valuation considerations may apply with respect to “odd-lot” fixed-income transactions which, due to their small size, may receive evaluated prices by pricing services which reflect a large block trade and not what actually could be obtained for the odd-lot position. The Portfolio uses systematic fair valuation models provided by independent third parties to value international equity securities in order to adjust for stale pricing, which may occur between the close of certain foreign exchanges and the close of the NYSE.
Valuation Inputs Summary FASB ASC 820, Fair Value Measurements and Disclosures (“ASC 820”), defines fair value, establishes a framework for measuring fair value, and expands disclosure requirements regarding fair value measurements. This standard emphasizes that fair value is a market-based measurement that should be determined based on the assumptions that

Janus Henderson VIT Enterprise Portfolio Notes to Financial Statements (unaudited)
Janus Aspen Series 21
market participants would use in pricing an asset or liability and establishes a hierarchy that prioritizes inputs to valuation techniques used to measure fair value. These inputs are summarized into three broad levels:
Level 1 – Unadjusted quoted prices in active markets the Portfolio has the ability to access for identical assets or liabilities.
Level 2 – Observable inputs other than unadjusted quoted prices included in Level 1 that are observable for the asset or liability either directly or indirectly. These inputs may include quoted prices for the identical instrument on an inactive market, prices for similar instruments, interest rates, prepayment speeds, credit risk, yield curves, default rates and similar data.
Assets or liabilities categorized as Level 2 in the hierarchy generally include: debt securities fair valued in accordance with the evaluated bid or ask prices supplied by a pricing service; securities traded on OTC markets and listed securities for which no sales are reported that are fair valued at the latest bid price (or yield equivalent thereof) obtained from one or more dealers transacting in a market for such securities or by a pricing service approved by the Portfolio’s Trustees; certain short-term debt securities with maturities of 60 days or less that are fair valued at amortized cost; and equity securities of foreign issuers whose fair value is determined by using systematic fair valuation models provided by independent third parties in order to adjust for stale pricing which may occur between the close of certain foreign exchanges and the close of the NYSE. Other securities that may be categorized as Level 2 in the hierarchy include, but are not limited to, preferred stocks, bank loans, swaps, investments in unregistered investment companies, options, and forward contracts.
Level 3 – Unobservable inputs for the asset or liability to the extent that relevant observable inputs are not available, representing the Portfolio’s own assumptions about the assumptions that a market participant would use in valuing the asset or liability, and that would be based on the best information available.
There have been no significant changes in valuation techniques used in valuing any such positions held by the Portfolio since the beginning of the fiscal year.
The inputs or methodology used for fair valuing securities are not necessarily an indication of the risk associated with investing in those securities. The summary of inputs used as of June 30, 2020 to fair value the Portfolio’s investments in securities and other financial instruments is included in the “Valuation Inputs Summary” in the Notes to Schedule of Investments and Other Information.
Investment Transactions and Investment Income Investment transactions are accounted for as of the date purchased or sold (trade date). Dividend income is recorded on the ex-dividend date. Certain dividends from foreign securities will be recorded as soon as the Portfolio is informed of the dividend, if such information is obtained subsequent to the ex-dividend date. Dividends from foreign securities may be subject to withholding taxes in foreign jurisdictions. Interest income is recorded daily on the accrual basis and includes amortization of premiums and accretion of discounts. The Portfolio classifies gains and losses on prepayments received as an adjustment to interest income. Debt securities may be placed in non-accrual status and related interest income may be reduced by stopping current accruals and writing off interest receivables when collection of all or a portion of interest has become doubtful. Gains and losses are determined on the identified cost basis, which is the same basis used for federal income tax purposes. Income, as well as gains and losses, both realized and unrealized, are allocated daily to each class of shares based upon the ratio of net assets represented by each class as a percentage of total net assets.
Expenses The Portfolio bears expenses incurred specifically on its behalf. Each class of shares bears a portion of general expenses, which are allocated daily to each class of shares based upon the ratio of net assets represented by each class as a percentage of total net assets. Expenses directly attributable to a specific class of shares are charged against the operations of such class.
Estimates The preparation of financial statements in conformity with US GAAP requires management to make estimates and assumptions that affect the reported amount of assets and liabilities and disclosure of contingent assets and liabilities at the date of the financial statements, and the reported amounts of income and expenses during the reporting period. Actual results could differ from those estimates.

Janus Henderson VIT Enterprise Portfolio Notes to Financial Statements (unaudited)
22 JUNE 30, 2020
Indemnifications In the normal course of business, the Portfolio may enter into contracts that contain provisions for indemnification of other parties against certain potential liabilities. The Portfolio’s maximum exposure under these arrangements is unknown, and would involve future claims that may be made against the Portfolio that have not yet occurred. Currently, the risk of material loss from such claims is considered remote.
Foreign Currency Translations The Portfolio does not isolate that portion of the results of operations resulting from the effect of changes in foreign exchange rates on investments from the fluctuations arising from changes in market prices of securities held at the date of the financial statements. Net unrealized appreciation or depreciation of investments and foreign currency translations arise from changes in the value of assets and liabilities, including investments in securities held at the date of the financial statements, resulting from changes in the exchange rates and changes in market prices of securities held.
Currency gains and losses are also calculated on payables and receivables that are denominated in foreign currencies. The payables and receivables are generally related to foreign security transactions and income translations.
Foreign currency-denominated assets and forward currency contracts may involve more risks than domestic transactions, including currency risk, counterparty risk, political and economic risk, regulatory risk and equity risk. Risks may arise from unanticipated movements in the value of foreign currencies relative to the U.S. dollar.
Dividends and Distributions The Portfolio may make semiannual distributions of substantially all of its investment income and an annual distribution of its net realized capital gains (if any).
The Portfolio may make certain investments in real estate investment trusts (“REITs”) which pay dividends to their shareholders based upon funds available from operations. It is quite common for these dividends to exceed the REITs’ taxable earnings and profits, resulting in the excess portion of such dividends being designated as a return of capital. If the Portfolio distributes such amounts, such distributions could constitute a return of capital to shareholders for federal income tax purposes.
Federal Income Taxes The Portfolio intends to continue to qualify as a regulated investment company and distribute all of its taxable income in accordance with the requirements of Subchapter M of the Internal Revenue Code. Management has analyzed the Portfolio’s tax positions taken for all open federal income tax years, generally a three-year period, and has concluded that no provision for federal income tax is required in the Portfolio’s financial statements. The Portfolio is not aware of any tax positions for which it is reasonably possible that the total amounts of unrecognized tax benefits will significantly change in the next twelve months.
2. Derivative Instruments The Portfolio may invest in various types of derivatives, which may at times result in significant derivative exposure. A derivative is a financial instrument whose performance is derived from the performance of another asset. The Portfolio may invest in derivative instruments including, but not limited to: futures contracts, put options, call options, options on futures contracts, options on foreign currencies, options on recovery locks, options on security and commodity indices, swaps, forward contracts, structured investments, and other equity-linked derivatives. Each derivative instrument that was held by the Portfolio during the period ended June 30, 2020 is discussed in further detail below. A summary of derivative activity by the Portfolio is reflected in the tables at the end of the Schedule of Investments.
The Portfolio may use derivative instruments for hedging purposes (to offset risks associated with an investment, currency exposure, or market conditions), to adjust currency exposure relative to a benchmark index, or for speculative purposes (to earn income and seek to enhance returns). When the Portfolio invests in a derivative for speculative purposes, the Portfolio will be fully exposed to the risks of loss of that derivative, which may sometimes be greater than the derivative’s cost. The Portfolio may not use any derivative to gain exposure to an asset or class of assets that it would be prohibited by its investment restrictions from purchasing directly. The Portfolio’s ability to use derivative instruments may also be limited by tax considerations.
Investments in derivatives in general are subject to market risks that may cause their prices to fluctuate over time. Investments in derivatives may not directly correlate with the price movements of the underlying instrument. As a result,
Janus Henderson VIT Enterprise Portfolio Notes to Financial Statements (unaudited)
Janus Aspen Series 23
the use of derivatives may expose the Portfolio to additional risks that it would not be subject to if it invested directly in the securities underlying those derivatives. The use of derivatives may result in larger losses or smaller gains than otherwise would be the case. Derivatives can be volatile and may involve significant risks.
In pursuit of its investment objective, the Portfolio may seek to use derivatives to increase or decrease exposure to the following market risk factors:
• Commodity Risk – the risk related to the change in value of commodities or commodity-linked investments due to changes in the overall market movements, volatility of the underlying benchmark, changes in interest rates, or other factors affecting a particular industry or commodity such as drought, floods, weather, livestock disease, embargoes, tariffs, and international economic, political, and regulatory developments.
• Counterparty Risk – the risk that the counterparty (the party on the other side of the transaction) on a derivative transaction will be unable to honor its financial obligation to the Portfolio.
• Credit Risk – the risk an issuer will be unable to make principal and interest payments when due, or will default on its obligations.
• Currency Risk – the risk that changes in the exchange rate between currencies will adversely affect the value (in U.S. dollar terms) of an investment.
• Equity Risk – the risk related to the change in value of equity securities as they relate to increases or decreases in the general market.
• Index Risk – if the derivative is linked to the performance of an index, it will be subject to the risks associated with changes in that index. If the index changes, the Portfolio could receive lower interest payments or experience a reduction in the value of the derivative to below what the Portfolio paid. Certain indexed securities, including inverse securities (which move in an opposite direction to the index), may create leverage, to the extent that they increase or decrease in value at a rate that is a multiple of the changes in the applicable index.
• Interest Rate Risk – the risk that the value of fixed-income securities will generally decline as prevailing interest rates rise, which may cause the Portfolio’s NAV to likewise decrease.
• Leverage Risk – the risk associated with certain types of leveraged investments or trading strategies pursuant to which relatively small market movements may result in large changes in the value of an investment. The Portfolio creates leverage by investing in instruments, including derivatives, where the investment loss can exceed the original amount invested. Certain investments or trading strategies, such as short sales, that involve leverage can result in losses that greatly exceed the amount originally invested.
• Liquidity Risk – the risk that certain securities may be difficult or impossible to sell at the time that the seller would like or at the price that the seller believes the security is currently worth.
Derivatives may generally be traded OTC or on an exchange. Derivatives traded OTC are agreements that are individually negotiated between parties and can be tailored to meet a purchaser’s needs. OTC derivatives are not guaranteed by a clearing agency and may be subject to increased credit risk.
In an effort to mitigate credit risk associated with derivatives traded OTC, the Portfolio may enter into collateral agreements with certain counterparties whereby, subject to certain minimum exposure requirements, the Portfolio may require the counterparty to post collateral if the Portfolio has a net aggregate unrealized gain on all OTC derivative contracts with a particular counterparty. Additionally, the Portfolio may deposit cash and/or treasuries as collateral with the counterparty and/or custodian daily (based on the daily valuation of the financial asset) if the Portfolio has a net aggregate unrealized loss on OTC derivative contracts with a particular counterparty. All liquid securities and restricted cash are considered to cover in an amount at all times equal to or greater than the Portfolio’s commitment with respect to certain exchange-traded derivatives, centrally cleared derivatives, forward foreign currency exchange contracts, short sales, and/or securities with extended settlement dates. There is no guarantee that counterparty exposure is reduced and these arrangements are dependent on Janus Capital Management LLC's ("Janus Capital") ability to establish and maintain appropriate systems and trading.

Janus Henderson VIT Enterprise Portfolio Notes to Financial Statements (unaudited)
24 JUNE 30, 2020
Forward Foreign Currency Exchange Contracts A forward foreign currency exchange contract (“forward currency contract”) is an obligation to buy or sell a specified currency at a future date at a negotiated rate (which may be U.S. dollars or a foreign currency). The Portfolio may enter into forward currency contracts for hedging purposes, including, but not limited to, reducing exposure to changes in foreign currency exchange rates on foreign portfolio holdings and locking in the U.S. dollar cost of firm purchase and sale commitments for securities denominated in or exposed to foreign currencies. The Portfolio may also invest in forward currency contracts for non-hedging purposes such as seeking to enhance returns. The Portfolio is subject to currency risk and counterparty risk in the normal course of pursuing its investment objective through its investments in forward currency contracts.
Forward currency contracts are valued by converting the foreign value to U.S. dollars by using the current spot U.S. dollar exchange rate and/or forward rate for that currency. Exchange and forward rates as of the close of the NYSE shall be used to value the forward currency contracts. The unrealized appreciation/(depreciation) for forward currency contracts is reported in the Statement of Assets and Liabilities as a receivable or payable and in the Statement of Operations for the change in unrealized net appreciation/depreciation (if applicable). The gain or loss arising from the difference between the U.S. dollar cost of the original contract and the value of the foreign currency in U.S. dollars upon closing a forward currency contract is reported on the Statement of Operations (if applicable).
During the period, the Portfolio entered into forward currency contracts with the obligation to sell foreign currencies in the future at an agreed upon rate in order to decrease exposure to currency risk associated with foreign currency denominated securities held by the Portfolio.
3. Other Investments and Strategies
Additional Investment Risk In the aftermath of the 2007-2008 financial crisis, the financial sector experienced reduced liquidity in credit and other fixed-income markets, and an unusually high degree of volatility, both domestically and internationally. In response to the crisis, the United States and certain foreign governments, along with the U.S. Federal Reserve and certain foreign central banks, took a number of unprecedented steps designed to support the financial markets. For example, the enactment of the Dodd-Frank Act in 2010 provided for widespread regulation of financial institutions, consumer financial products and services, broker-dealers, over-the-counter derivatives, investment advisers, credit rating agencies, and mortgage lending, which expanded federal oversight in the financial sector, including the investment management industry. More recently, in response to the COVID-19 pandemic, the U.S. government and the Federal Reserve, as well as certain foreign governments and central banks, have taken extraordinary actions to support local and global economies and the financial markets, including reducing interest rates to record low levels. The withdrawal of this support, a failure of measures put in place in response to such economic uncertainty, or investor perception that such efforts were not sufficient could each negatively affect financial markets generally, and the value and liquidity of specific securities. In addition, policy and legislative changes in the United States and in other countries continue to impact many aspects of financial regulation.
Widespread disease, including pandemics and epidemics, and natural or environmental disasters, such as earthquakes, fires, floods, hurricanes, tsunamis and weather-related phenomena generally, have been and can be highly disruptive to economies and markets, adversely impacting individual companies, sectors, industries, markets, currencies, interest and inflation rates, credit ratings, investor sentiment, and other factors affecting the value of a Fund’s investments. Economies and financial markets throughout the world have become increasingly interconnected, which increases the likelihood that events or conditions in one region or country will adversely affect markets or issuers in other regions or countries, including the United States. These disruptions could prevent a Fund from executing advantageous investment decisions in a timely manner and negatively impact a Fund’s ability to achieve its investment objective(s). Any such event(s) could have a significant adverse impact on the value of a Fund. In addition, these disruptions could also impair the information technology and other operational systems upon which the Fund’s service providers, including Janus Capital or the subadviser (as applicable), rely, and could otherwise disrupt the ability of employees of the Fund’s service providers to perform essential tasks on behalf of the Fund.
A number of countries in the European Union (“EU”) have experienced, and may continue to experience, severe economic and financial difficulties. In particular, many EU nations are susceptible to economic risks associated with high levels of debt. Many non-governmental issuers, and even certain governments, have defaulted on, or been forced to restructure, their debts. Many other issuers have faced difficulties obtaining credit or refinancing existing obligations.

Janus Henderson VIT Enterprise Portfolio Notes to Financial Statements (unaudited)
Janus Aspen Series 25
Financial institutions have in many cases required government or central bank support, have needed to raise capital, and/or have been impaired in their ability to extend credit. As a result, financial markets in the EU have experienced extreme volatility and declines in asset values and liquidity. Responses to these financial problems by European governments, central banks, and others, including austerity measures and reforms, may not work, may result in social unrest, and may limit future growth and economic recovery or have other unintended consequences. The risk of investing in securities in the European markets may also be heightened due to the referendum in which the United Kingdom voted to exit the EU (commonly known as “Brexit”). The United Kingdom formally left the EU on January 31, 2020 and entered into an eleven-month transition period, during which the United Kingdom will remain subject to EU laws and regulations. There is considerable uncertainty relating to the potential consequences of the United Kingdom’s exit and how negotiations for new trade agreements will be conducted or concluded.
Certain areas of the world have historically been prone to and economically sensitive to environmental events such as, but not limited to, hurricanes, earthquakes, typhoons, flooding, tidal waves, tsunamis, erupting volcanoes, wildfires or droughts, tornadoes, mudslides, or other weather-related phenomena. Such disasters, and the resulting physical or economic damage, could have a severe and negative impact on the Portfolio’s investment portfolio and, in the longer term, could impair the ability of issuers in which the Portfolio invests to conduct their businesses as they would under normal conditions. Adverse weather conditions may also have a particularly significant negative effect on issuers in the agricultural sector and on insurance and reinsurance companies that insure or reinsure against the impact of natural disasters.
Counterparties Portfolio transactions involving a counterparty are subject to the risk that the counterparty or a third party will not fulfill its obligation to the Portfolio (“counterparty risk”). Counterparty risk may arise because of the counterparty’s financial condition (i.e., financial difficulties, bankruptcy, or insolvency), market activities and developments, or other reasons, whether foreseen or not. A counterparty’s inability to fulfill its obligation may result in significant financial loss to the Portfolio. The Portfolio may be unable to recover its investment from the counterparty or may obtain a limited recovery, and/or recovery may be delayed. The extent of the Portfolio’s exposure to counterparty risk with respect to financial assets and liabilities approximates its carrying value. See the "Offsetting Assets and Liabilities" section of this Note for further details.
The Portfolio may be exposed to counterparty risk through participation in various programs, including, but not limited to, lending its securities to third parties, cash sweep arrangements whereby the Portfolio’s cash balance is invested in one or more types of cash management vehicles, as well as investments in, but not limited to, repurchase agreements, debt securities, and derivatives, including various types of swaps, futures and options. The Portfolio intends to enter into financial transactions with counterparties that Janus Capital believes to be creditworthy at the time of the transaction. There is always the risk that Janus Capital’s analysis of a counterparty’s creditworthiness is incorrect or may change due to market conditions. To the extent that the Portfolio focuses its transactions with a limited number of counterparties, it will have greater exposure to the risks associated with one or more counterparties.
Offsetting Assets and Liabilities The Portfolio presents gross and net information about transactions that are either offset in the financial statements or subject to an enforceable master netting arrangement or similar agreement with a designated counterparty, regardless of whether the transactions are actually offset in the Statement of Assets and Liabilities.
In order to better define its contractual rights and to secure rights that will help the Portfolio mitigate its counterparty risk, the Portfolio has entered into an International Swaps and Derivatives Association, Inc. Master Agreement (“ISDA Master Agreement”) or similar agreement with its derivative contract counterparties. An ISDA Master Agreement is a bilateral agreement between the Portfolio and a counterparty that governs OTC derivatives and forward foreign currency exchange contracts and typically contains, among other things, collateral posting terms and netting provisions in the event of a default and/or termination event. Under an ISDA Master Agreement, in the event of a default and/or termination event, the Portfolio may offset with each counterparty certain derivative financial instruments’ payables and/or receivables with collateral held and/or posted and create one single net payment.
The following tables present gross amounts of recognized assets and/or liabilities and the net amounts after deducting collateral that has been pledged by counterparties or has been pledged to counterparties (if applicable). For corresponding information grouped by type of instrument, see the “Fair Value of Derivative Instruments (not accounted for as hedging instruments) as of June 30, 2020” table located in the Portfolio’s Schedule of Investments.

Janus Henderson VIT Enterprise Portfolio Notes to Financial Statements (unaudited)
26 JUNE 30, 2020
Offsetting of Financial Assets and Derivative Assets Gross Amounts of Recognized Offsetting Asset Collateral
Counterparty
Assets or Liability(a) Pledged(b) Net Amount
Credit Suisse International $ 49,772 $ — $ — $ 49,772
JPMorgan Chase Bank, National Association 14,582,150 (381,275) (14,200,875) —Total $ 14,631,922 $ (381,275) $ (14,200,875) $ 49,772
Offsetting of Financial Liabilities and Derivative Liabilities Gross Amounts of Recognized Offsetting Asset Collateral
Counterparty
Liabilities or Liability(a) Pledged(b) Net Amount
Barclays Capital, Inc. $ 62,018 $ — $ — $ 62,018
Citibank, National Association 24,454 — — 24,454
HSBC Securities (USA), Inc. 55,779 — — 55,779JPMorgan Chase Bank, National Association 381,275 (381,275) — —
Total $ 523,526 $ (381,275) $ — $ 142,251(a) Represents the amount of assets or liabilities that could be offset with the same counterparty under master netting or similar agreements that
management elects not to offset on the Statement of Assets and Liabilities.
(b) Collateral pledged is limited to the net outstanding amount due to/from an individual counterparty. The actual collateral amounts pledged may exceed these amounts and may fluctuate in value.
JPMorgan Chase Bank, National Association acts as securities lending agent and a limited purpose custodian or subcustodian to receive and disburse cash balances and cash collateral, hold short-term investments, hold collateral, and perform other custodial functions in accordance with the Non-Custodial Securities Lending Agreement. For financial reporting purposes, the Portfolio does not offset financial instruments' payables and receivables and related collateral on the Statement of Assets and Liabilities. Securities on loan will be continuously secured by collateral which may consist of cash, U.S. Government securities, domestic and foreign short-term debt instruments, letters of credit, time deposits, repurchase agreements, money market mutual funds or other money market accounts, or such other collateral as permitted by the Securities and Exchange Commission (the “SEC”). See “Securities Lending” in the “Notes to Financial Statements” for additional information.
The Portfolio generally does not exchange collateral on its forward foreign currency contracts with its counterparties; however, all liquid securities and restricted cash are considered to cover in an amount at all times equal to or greater than the Portfolio’s commitment with respect to these contracts. Certain securities may be segregated at the Portfolio’s custodian. These segregated securities are denoted on the accompanying Schedule of Investments and are evaluated daily to ensure their cover and/or market value equals or exceeds the Portfolio’s corresponding forward foreign currency exchange contract's obligation value.
The Portfolio may require the counterparty to pledge securities as collateral daily (based on the daily valuation of the financial asset) if the Portfolio has a net aggregate unrealized gain on OTC derivative contracts with a particular counterparty. The Portfolio may deposit cash as collateral with the counterparty and/or custodian daily (based on the daily valuation of the financial asset) if the Portfolio has a net aggregate unrealized loss on OTC derivative contracts with a particular counterparty. The collateral amounts are subject to minimum exposure requirements and initial margin

Janus Henderson VIT Enterprise Portfolio Notes to Financial Statements (unaudited)
Janus Aspen Series 27
requirements. Collateral amounts are monitored and subsequently adjusted up or down as valuations fluctuate by at least the minimum exposure requirement. Collateral may reduce the risk of loss.
Real Estate Investing The Portfolio may invest in equity and debt securities of real estate-related companies. Such companies may include those in the real estate industry or real estate-related industries. These securities may include common stocks, corporate bonds, preferred stocks, and other equity securities, including, but not limited to, mortgage-backed securities, real estate-backed securities, securities of REITs and similar REIT-like entities. A REIT is a trust that invests in real estate-related projects, such as properties, mortgage loans, and construction loans. REITs are generally categorized as equity, mortgage, or hybrid REITs. A REIT may be listed on an exchange or traded OTC.
Restricted Security Transactions Restricted securities held by the Portfolio may not be sold except in exempt transactions or in a public offering registered under the Securities Act of 1933, as amended. The risk of investing in such securities is generally greater than the risk of investing in the securities of widely held, publicly traded companies. Lack of a secondary market and resale restrictions may result in the inability of the Portfolio to sell a security at a fair price and may substantially delay the sale of the security. In addition, these securities may exhibit greater price volatility than securities for which secondary markets exist.
Securities Lending Under procedures adopted by the Trustees, the Portfolio may seek to earn additional income by lending securities to certain qualified broker-dealers and institutions. Effective December 16, 2019, JPMorgan Chase Bank, National Association replaced Deutsche Bank AG as securities lending agent for the Portfolio. JPMorgan Chase Bank, National Association acts as securities lending agent and a limited purpose custodian or subcustodian to receive and disburse cash balances and cash collateral, hold short-term investments, hold collateral, and perform other custodial functions in accordance with the Non-Custodial Securities Lending Agreement. The Portfolio may lend portfolio securities in an amount equal to up to 1/3 of its total assets as determined at the time of the loan origination. There is the risk of delay in recovering a loaned security or the risk of loss in collateral rights if the borrower fails financially. In addition, Janus Capital makes efforts to balance the benefits and risks from granting such loans. All loans will be continuously secured by collateral which may consist of cash, U.S. Government securities, domestic and foreign short-term debt instruments, letters of credit, time deposits, repurchase agreements, money market mutual funds or other money market accounts, or such other collateral as permitted by the SEC. If the Portfolio is unable to recover a security on loan, the Portfolio may use the collateral to purchase replacement securities in the market. There is a risk that the value of the collateral could decrease below the cost of the replacement security by the time the replacement investment is made, resulting in a loss to the Portfolio. In certain circumstances individual loan transactions could yield negative returns.
Upon receipt of cash collateral, Janus Capital may invest it in affiliated or non-affiliated cash management vehicles, whether registered or unregistered entities, as permitted by the 1940 Act and rules promulgated thereunder. Janus Capital currently intends to primarily invest the cash collateral in a cash management vehicle for which Janus Capital serves as investment adviser, Janus Henderson Cash Collateral Fund LLC. An investment in Janus Henderson Cash Collateral Fund LLC is generally subject to the same risks that shareholders experience when investing in similarly structured vehicles, such as the potential for significant fluctuations in assets as a result of the purchase and redemption activity of the securities lending program, a decline in the value of the collateral, and possible liquidity issues. Such risks may delay the return of the cash collateral and cause the Portfolio to violate its agreement to return the cash collateral to a borrower in a timely manner. As adviser to the Portfolio and Janus Henderson Cash Collateral Fund LLC, Janus Capital has an inherent conflict of interest as a result of its fiduciary duties to both the Portfolio and Janus Henderson Cash Collateral Fund LLC. Additionally, Janus Capital receives an investment advisory fee of 0.05% for managing Janus Henderson Cash Collateral Fund LLC, but it may not receive a fee for managing certain other affiliated cash management vehicles in which the Portfolio may invest, and therefore may have an incentive to allocate preferred investment opportunities to investment vehicles for which it is receiving a fee.
The value of the collateral must be at least 102% of the market value of the loaned securities that are denominated in U.S. dollars and 105% of the market value of the loaned securities that are not denominated in U.S. dollars. Loaned securities and related collateral are marked-to-market each business day based upon the market value of the loaned securities at the close of business, employing the most recent available pricing information. Collateral levels are then adjusted based on this mark-to-market evaluation.

Janus Henderson VIT Enterprise Portfolio Notes to Financial Statements (unaudited)
28 JUNE 30, 2020
The cash collateral invested by Janus Capital is disclosed in the Schedule of Investments (if applicable). Income earned from the investment of the cash collateral, net of rebates paid to, or fees paid by, borrowers and less the fees paid to the lending agent are included as “Affiliated securities lending income, net” on the Statement of Operations. As of June 30, 2020, securities lending transactions accounted for as secured borrowings with an overnight and continuous contractual maturity are $14,582,150. Gross amounts of recognized liabilities for securities lending (collateral received) as of June 30, 2020 is $14,874,915, resulting in the net amount due to the counterparty of $292,765.
Income earned from the investment of the cash collateral, net of rebates paid to, or fees paid by, borrowers and less the fees paid to the lending agent are included as “Affiliated securities lending income, net” on the Statement of Operations.
4. Investment Advisory Agreements and Other Transactions with Affiliates The Portfolio pays Janus Capital an investment advisory fee which is calculated daily and paid monthly. The Portfolio’s contractual investment advisory fee rate (expressed as an annual rate) is 0.64% of its average daily net assets.
Janus Services LLC (“Janus Services”), a wholly-owned subsidiary of Janus Capital, is the Portfolio’s transfer agent. Janus Services receives an administrative services fee at an annual rate of 0.05% of the average daily net assets of the Portfolio for arranging for the provision by participating insurance companies and qualified plan service providers of administrative services, including recordkeeping, subaccounting, order processing, or other shareholder services provided on behalf of contract holders or plan participants investing in the Portfolio. Other shareholder services may include the provision of order confirmations, periodic account statements, forwarding prospectuses, shareholder reports, and other materials to existing investors, and answering inquiries regarding accounts. Janus Services expects to use this entire fee to compensate insurance companies and qualified plan service providers for providing these services to their customers who invest in the Portfolio. Any unused portion will be reimbursed to the applicable share class at least annually.
In addition, Janus Services provides or arranges for the provision of certain other internal administrative, recordkeeping, and shareholder relations services for the Portfolio. Janus Services is not compensated for these internal services related to the shares, except for out-of-pocket costs. These amounts are disclosed as “Other transfer agent fees and expenses” on the Statement of Operations.
Under a distribution and shareholder servicing plan (the “Plan”) adopted in accordance with Rule 12b-1 under the 1940 Act, the Service Shares may pay the Trust’s distributor, Janus Distributors LLC (“Janus Distributors”), a wholly-owned subsidiary of Janus Capital, a fee for the sale and distribution and/or shareholder servicing of the Service Shares at an annual rate of up to 0.25% of the average daily net assets of the Service Shares. Under the terms of the Plan, the Trust is authorized to make payments to Janus Distributors for remittance to insurance companies and qualified plan service providers as compensation for distribution and/or shareholder services performed by such entities. These amounts are disclosed as “12b-1 Distribution and shareholder servicing fees” on the Statement of Operations. Payments under the Plan are not tied exclusively to actual 12b-1 distribution and servicing fees, and the payments may exceed 12b-1 distribution and servicing fees actually incurred. If any of the Portfolio’s actual 12b-1 distribution and servicing fees incurred during a calendar year are less than the payments made during a calendar year, the Portfolio will be refunded the difference. Refunds, if any, are included in “12b-1 Distribution and shareholder servicing fees” in the Statement of Operations.
Janus Capital serves as administrator to the Portfolio pursuant to an administration agreement between Janus Capital and the Trust. Under the administration agreement, Janus Capital is obligated to provide or arrange for the provision of certain administration, compliance, and accounting services to the Portfolio, including providing office space for the Portfolio, and is reimbursed by the Portfolio for certain of its costs in providing these services (to the extent Janus Capital seeks reimbursement and such costs are not otherwise waived). In addition, employees of Janus Capital and/or its affiliates may serve as officers of the Trust. The Portfolio pays for some or all of the salaries, fees, and expenses of Janus Capital employees and Portfolio officers, with respect to certain specified administration functions they perform on behalf of the Portfolio. The Portfolio pays these costs based on out-of-pocket expenses incurred by Janus Capital, and these costs are separate and apart from advisory fees and other expenses paid in connection with the investment advisory services Janus Capital (or any subadvisor, as applicable) provides to the Portfolio. These amounts are disclosed as “Affiliated portfolio administration fees” on the Statement of Operations. In addition, some expenses related to compensation payable to the Portfolio’s Chief Compliance Officer and certain compliance staff, all of whom are employees of Janus Capital and/or its affiliates, are shared with the Portfolio. Total compensation of $20,422 was paid

Janus Henderson VIT Enterprise Portfolio Notes to Financial Statements (unaudited)
Janus Aspen Series 29
to the Chief Compliance Officer and certain compliance staff by the Trust during the period ended June 30, 2020. The Portfolio's portion is reported as part of “Other expenses” on the Statement of Operations.
The Board of Trustees has adopted a deferred compensation plan (the “Deferred Plan”) for independent Trustees to elect to defer receipt of all or a portion of the annual compensation they are entitled to receive from the Portfolio. All deferred fees are credited to an account established in the name of the Trustees. The amounts credited to the account then increase or decrease, as the case may be, in accordance with the performance of one or more of the Janus Henderson funds that are selected by the Trustees. The account balance continues to fluctuate in accordance with the performance of the selected fund or funds until final payment of all amounts are credited to the account. The fluctuation of the account balance is recorded by the Portfolio as unrealized appreciation/(depreciation) and is included as of June 30, 2020 on the Statement of Assets and Liabilities in the asset, “Non-interested Trustees’ deferred compensation,” and liability, “Non-interested Trustees’ deferred compensation fees.” Additionally, the recorded unrealized appreciation/(depreciation) is included in “Total distributable earnings (loss)” on the Statement of Assets and Liabilities. Deferred compensation expenses for the period ended June 30, 2020 are included in “Non-interested Trustees’ fees and expenses” on the Statement of Operations. Trustees are allowed to change their designation of mutual funds from time to time. Amounts will be deferred until distributed in accordance with the Deferred Plan. Deferred fees of $220,425 were paid by the Trust to the Trustees under the Deferred Plan during the period ended June 30, 2020.
Pursuant to the provisions of the 1940 Act and related rules, the Portfolio may participate in an affiliated or non-affiliated cash sweep program. In the cash sweep program, uninvested cash balances of the Portfolio may be used to purchase shares of affiliated or non-affiliated money market funds or cash management pooled investment vehicles that operate as money market funds. The Portfolio is eligible to participate in the cash sweep program (the “Investing Funds”). As adviser, Janus Capital has an inherent conflict of interest because of its fiduciary duties to the affiliated money market funds or cash management pooled investment vehicles and the Investing Funds. Janus Henderson Cash Liquidity Fund LLC (the “Sweep Vehicle”) is an affiliated unregistered cash management pooled investment vehicle that invests primarily in highly-rated short-term fixed-income securities. The Sweep Vehicle operates pursuant to the provisions of the 1940 Act that govern the operation of money market funds and prices its shares at NAV reflecting market-based values of its portfolio securities (i.e., a “floating” NAV) rounded to the fourth decimal place (e.g., $1.0000). The Sweep Vehicle is permitted to impose a liquidity fee (of up to 2%) on redemptions from the Sweep Vehicle or a redemption gate that temporarily suspends redemptions from the Sweep Vehicle for up to 10 business days during a 90 day period. There are no restrictions on the Portfolio's ability to withdraw investments from the Sweep Vehicle at will, and there are no unfunded capital commitments due from the Portfolio to the Sweep Vehicle. The Sweep Vehicle does not charge any management fee, sales charge or service fee.
Any purchases and sales, realized gains/losses and recorded dividends from affiliated investments during the period ended June 30, 2020 can be found in the “Schedules of Affiliated Investments” located in the Schedule of Investments.
The Portfolio is permitted to purchase or sell securities (“cross-trade”) between itself and other funds or accounts managed by Janus Capital in accordance with Rule 17a-7 under the Investment Company Act of 1940 (“Rule 17a-7”), when the transaction is consistent with the investment objectives and policies of the Portfolio and in accordance with the Internal Cross Trade Procedures adopted by the Trust’s Board of Trustees. These procedures have been designed to ensure that any cross-trade of securities by the Portfolio from or to another fund or account that is or could be considered an affiliate of the Portfolio under certain limited circumstances by virtue of having a common investment adviser, common Officer, or common Trustee complies with Rule 17a-7. Under these procedures, each cross-trade is effected at the current market price to save costs where allowed. During the period ended June 30, 2020, the Portfolio engaged in cross trades amounting to $37,688 in purchases.
5. Federal Income Tax Income and capital gains distributions are determined in accordance with income tax regulations that may differ from US GAAP. These differences are due to differing treatments for items such as net short-term gains, deferral of wash sale losses, foreign currency transactions, net investment losses, and capital loss carryovers.
The Portfolio has elected to treat gains and losses on forward foreign currency contracts as capital gains and losses, if applicable. Other foreign currency gains and losses on debt instruments are treated as ordinary income for federal income tax purposes pursuant to Section 988 of the Internal Revenue Code.

Janus Henderson VIT Enterprise Portfolio Notes to Financial Statements (unaudited)
30 JUNE 30, 2020
The aggregate cost of investments and the composition of unrealized appreciation and depreciation of investment securities for federal income tax purposes as of June 30, 2020 are noted below. The primary differences between book and tax appreciation or depreciation of investments are wash sale loss deferrals and investments in partnerships.
Federal Tax Cost Unrealized
AppreciationUnrealized
(Depreciation)Net Tax Appreciation/
(Depreciation) $ 912,670,749 $564,322,255 $(34,343,821) $ 529,978,434
Information on the tax components of derivatives as of June 30, 2020 is as follows:
Federal Tax Cost Unrealized
AppreciationUnrealized
(Depreciation)Net Tax Appreciation/
(Depreciation) $ - $ 49,772 $ (523,526) $ (473,754)
Tax cost of investments and unrealized appreciation/(depreciation) may also include timing differences that do not constitute adjustments to tax basis.
6. Capital Share Transactions Period ended June 30, 2020 Year ended December 31, 2019 Shares Amount Shares Amount
Institutional Shares: Shares sold 664,034 $ 49,470,004 1,542,514 $123,201,744 Reinvested dividends and distributions 726,925 51,851,531 533,515 41,927,038 Shares repurchased (1,324,069) (99,667,702) (1,435,966) (114,495,329)Net Increase/(Decrease) 66,890 $ 1,653,833 640,063 $ 50,633,453 Service Shares: Shares sold 1,494,703 $102,582,505 2,323,035 $172,829,765 Reinvested dividends and distributions 898,977 59,611,141 617,488 45,398,321 Shares repurchased (1,749,587) (123,802,750) (2,013,680) (149,757,904)Net Increase/(Decrease) 644,093 $ 38,390,896 926,843 $ 68,470,182
7. Purchases and Sales of Investment Securities For the period ended June 30, 2020, the aggregate cost of purchases and proceeds from sales of investment securities (excluding any short-term securities, short-term options contracts, TBAs, and in-kind transactions, as applicable) was as follows:
Purchases of Securities
Proceeds from Salesof Securities
Purchases of Long-Term U.S. Government
Obligations
Proceeds from Sales of Long-Term U.S.
Government Obligations $97,448,172 $ 134,473,562 $ - $ -
8. Recent Accounting Pronouncements The FASB issued Accounting Standards Update 2018-13, Fair Value Measurement (Topic 820), in August 2018. The new guidance removes, modifies and enhances the disclosures to Topic 820. For public entities, the amendments are effective for financial statements issued for fiscal years beginning after December 15, 2019, and interim periods within those fiscal years. An entity is permitted, and Management has decided, to early adopt the removed and modified disclosures in these financial statements. Management is also evaluating the implications related to the new disclosure requirements and has not yet determined the impact to the financial statements.

Janus Henderson VIT Enterprise Portfolio Notes to Financial Statements (unaudited)
Janus Aspen Series 31
9. Other Matters An outbreak of infectious respiratory illness caused by a novel coronavirus known as COVID-19 was first detected in China in December 2019 and has now been declared a pandemic by the World Health Organization. The impact of COVID-19 has been, and may continue to be, highly disruptive to economies and markets, adversely impacting individual companies, sectors, industries, markets, currencies, interest and inflation rates, credit ratings, investor sentiment, and other factors affecting the value of a Portfolio's investments. This may impact liquidity in the marketplace, which in turn may affect the Portfolio's ability to meet redemption requests. Public health crises caused by the COVID-19 pandemic may exacerbate other pre-existing political, social, and economic risks in certain countries or globally. The duration of the COVID-19 pandemic and its effects cannot be determined with certainty, and could prevent a Portfolio from executing advantageous investment decisions in a timely manner and negatively impact a Portfolio's ability to achieve its investment objective.
10. Subsequent Event Management has evaluated whether any events or transactions occurred subsequent to June 30, 2020 and through the date of issuance of the Portfolio’s financial statements and determined that there were no material events or transactions that would require recognition or disclosure in the Portfolio’s financial statements.

Janus Henderson VIT Enterprise Portfolio Additional Information (unaudited)
32 JUNE 30, 2020
Proxy Voting Policies and Voting Record A description of the policies and procedures that the Portfolio uses to determine how to vote proxies relating to its portfolio securities is available without charge: (i) upon request, by calling 1-800-525-1093; (ii) on the Portfolio’s website at janushenderson.com/proxyvoting; and (iii) on the SEC’s website at http://www.sec.gov. Additionally, information regarding the Portfolio’s proxy voting record for the most recent twelve-month period ended June 30 is also available, free of charge, through janushenderson.com/proxyvoting and from the SEC’s website at http://www.sec.gov.
Full Holdings The Portfolio is required to disclose its complete holdings as an exhibit to Form N-PORT within 60 days of the end of the first and third fiscal quarters, and in the annual report and semiannual report to Portfolio shareholders. Historically, the Portfolio filed its complete portfolio holdings (schedule of investments) with the SEC for the first and third quarters each fiscal year on Form N-Q. The Portfolio’s Form N-PORT and Form N-Q filings: (i) are available on the SEC’s website at http://www.sec.gov; (ii) may be reviewed and copied at the SEC’s Public Reference Room in Washington, D.C. (information on the Public Reference Room may be obtained by calling 1-800-SEC-0330); and (iii) are available without charge, upon request, by calling a Janus Henderson representative at 1-877-335-2687 (toll free) . Portfolio holdings consisting of at least the names of the holdings are generally available on a monthly basis with a 30-day lag. Holdings are generally posted approximately two business days thereafter under Full Holdings for the Portfolio at janushenderson.com/vit.
APPROVAL OF ADVISORY AGREEMENTS DURING THE PERIOD The Trustees of Janus Aspen Series, each of whom serves as an “independent” Trustee (the “Trustees”), oversee the management of each Portfolio of Janus Aspen Series (each, a “VIT Portfolio,” and collectively, the “VIT Portfolios”), as well as each Fund of Janus Investment Fund (together with the VIT Portfolios, the “Janus Henderson Funds,” and each, a “Janus Henderson Fund”). As required by law, the Trustees determine annually whether to continue the investment advisory agreement for each Janus Henderson Fund and the subadvisory agreements for the Janus Henderson Funds that utilize subadvisers.
In connection with their most recent consideration of those agreements for each Janus Henderson Fund, the Trustees received and reviewed information provided by Janus Capital and the respective subadvisers in response to requests of the Trustees and their independent legal counsel. They also received and reviewed information and analysis provided by, and in response to requests of, their independent fee consultant. Throughout their consideration of the agreements, the Trustees were advised by their independent legal counsel. The Trustees met with management to consider the agreements, and also met separately in executive session with their independent legal counsel and their independent fee consultant.
At a meeting held on December 5, 2019, based on the Trustees’ evaluation of the information provided by Janus Capital, the subadvisers, and the independent fee consultant, as well as other information, the Trustees determined that the overall arrangements between each Janus Henderson Fund and Janus Capital and each subadviser, as applicable, were fair and reasonable in light of the nature, extent and quality of the services provided by Janus Capital, its affiliates and the subadvisers, the fees charged for those services, and other matters that the Trustees considered relevant in the exercise of their business judgment. At that meeting, the Trustees unanimously approved the continuation of the investment advisory agreement for each Janus Henderson Fund, and the subadvisory agreement for each subadvised Janus Henderson Fund, for the period from February 1, 2020 through February 1, 2021, subject to earlier termination as provided for in each agreement.
In considering the continuation of those agreements, the Trustees reviewed and analyzed various factors that they determined were relevant, including the factors described below, none of which by itself was considered dispositive. However, the material factors and conclusions that formed the basis for the Trustees’ determination to approve the continuation of the agreements are discussed separately below. Also included is a summary of the independent fee consultant’s conclusions and opinions that arose during, and were included as part of, the Trustees’ consideration of the agreements. “Management fees,” as used herein, reflect actual annual advisory fees and, for the purpose of peer comparisons, any administration fees (excluding out of pocket costs), net of any waivers, paid by a fund as a percentage of average net assets.

Janus Henderson VIT Enterprise Portfolio Additional Information (unaudited)
Janus Aspen Series 33
Nature, Extent and Quality of Services The Trustees reviewed the nature, extent and quality of the services provided by Janus Capital and the subadvisers to the Janus Henderson Funds, taking into account the investment objective, strategies and policies of each Janus Henderson Fund, and the knowledge the Trustees gained from their regular meetings with management on at least a quarterly basis and their ongoing review of information related to the Janus Henderson Funds. In addition, the Trustees reviewed the resources and key personnel of Janus Capital and each subadviser, particularly noting those employees who provide investment and risk management services to the Janus Henderson Funds. The Trustees also considered other services provided to the Janus Henderson Funds by Janus Capital or the subadvisers, such as managing the execution of portfolio transactions and the selection of broker-dealers for those transactions. The Trustees considered Janus Capital’s role as administrator to the Janus Henderson Funds, noting that Janus Capital generally does not receive a fee for its services but is reimbursed for its out-of-pocket costs. The Trustees considered the role of Janus Capital in monitoring adherence to the Janus Henderson Funds’ investment restrictions, providing support services for the Trustees and Trustee committees, and overseeing communications with shareholders and the activities of other service providers, including monitoring compliance with various policies and procedures of the Janus Henderson Funds and with applicable securities laws and regulations.
In this regard, the independent fee consultant noted that Janus Capital provides a number of different services for the Janus Henderson Funds and fund shareholders, ranging from investment management services to various other servicing functions, and that, in its view, Janus Capital is a capable provider of those services. The independent fee consultant also provided its belief that Janus Capital has developed a number of institutional competitive advantages that should enable it to provide superior investment and service performance over the long term.
The Trustees concluded that the nature, extent and quality of the services provided by Janus Capital or the subadviser to each Janus Henderson Fund were appropriate and consistent with the terms of the respective advisory and subadvisory agreements, and that, taking into account steps taken to address those Janus Henderson Funds whose performance lagged that of their peers for certain periods, the Janus Henderson Funds were likely to benefit from the continued provision of those services. They also concluded that Janus Capital and each subadviser had sufficient personnel, with the appropriate education and experience, to serve the Janus Henderson Funds effectively and had demonstrated its ability to attract well-qualified personnel.
Performance of the Funds The Trustees considered the performance results of each Janus Henderson Fund over various time periods. They noted that they considered Janus Henderson Fund performance data throughout the year, including periodic meetings with each Janus Henderson Fund’s portfolio manager(s), and also reviewed information comparing each Janus Henderson Fund’s performance with the performance of comparable funds and peer groups identified by Broadridge Financial Solutions, Inc. (“Broadridge”), an independent data provider, and with the Janus Henderson Fund’s benchmark index. In this regard, the independent fee consultant found that the overall Janus Henderson Funds’ performance has been reasonable: for the 36 months ended September 30, 2019, approximately 69% of the Janus Henderson Funds were in the top two quartiles of performance, as reported by Morningstar, and for the 12 months ended September 30, 2019, approximately 71% of the Janus Henderson Funds were in the top two quartiles of performance, as reported by Morningstar.
The Trustees considered the performance of each Janus Henderson Fund, noting that performance may vary by share class, and noted the following with respect to the VIT Portfolios:
• For Janus Henderson Balanced Portfolio, the Trustees noted that the Fund’s performance was in the first Broadridge quartile for the 36 months ended May 31, 2019 and the first Broadridge quartile for the 12 months ended May 31, 2019.
• For Janus Henderson Enterprise Portfolio, the Trustees noted that the Fund’s performance was in the second Broadridge quartile for the 36 months ended May 31, 2019 and the first Broadridge quartile for the 12 months ended May 31, 2019.
• For Janus Henderson Flexible Bond Portfolio, the Trustees noted that the Fund’s performance was in the bottom Broadridge quartile for the 36 months ended May 31, 2019 and the bottom Broadridge quartile for the 12 months ended May 31, 2019. The Trustees noted the reasons for the Fund’s underperformance and the steps Janus Capital had taken or was taking to improve performance.

Janus Henderson VIT Enterprise Portfolio Additional Information (unaudited)
34 JUNE 30, 2020
• For Janus Henderson Forty Portfolio, the Trustees noted that the Fund’s performance was in the second Broadridge quartile for the 36 months ended May 31, 2019 and the first Broadridge quartile for the 12 months ended May 31, 2019.
• For Janus Henderson Global Research Portfolio, the Trustees noted that the Fund’s performance was in the bottom Broadridge quartile for the 36 months ended May 31, 2019 and the second Broadridge quartile for the 12 months ended May 31, 2019. The Trustees noted the reasons for the Fund’s underperformance, while also noting that the Fund has a performance fee structure that results in lower management fees during periods of underperformance, and the steps Janus Capital had taken or was taking to improve performance, and that the performance trend was improving
• For Janus Henderson Global Technology Portfolio, the Trustees noted that the Fund’s performance was in the first Broadridge quartile for the 36 months ended May 31, 2019 and the first Broadridge quartile for the 12 months ended May 31, 2019.
• For Janus Henderson Mid Cap Value Portfolio, the Trustees noted that the Fund’s performance was in the second Broadridge quartile for the 36 months ended May 31, 2019 and the third Broadridge quartile for the 12 months ended May 31, 2019.
• For Janus Henderson Overseas Portfolio, the Trustees noted that the Fund’s performance was in the second Broadridge quartile for the 36 months ended May 31, 2019 and the bottom Broadridge quartile for the 12 months ended May 31, 2019.
• For Janus Henderson Research Portfolio, the Trustees noted that the Fund’s performance was in the third Broadridge quartile for the 36 months ended May 31, 2019 and the second Broadridge quartile for the 12 months ended May 31, 2019. The Trustees noted the reasons for the Fund’s underperformance, while also noting that the Fund has a performance fee structure that results in lower management fees during periods of underperformance, and the steps Janus Capital had taken or was taking to improve performance, and that the performance trend was improving
• For Janus Henderson U.S. Low Volatility Portfolio, the Trustees noted that the Fund’s performance was in the third Broadridge quartile for the 36 months ended May 31, 2019 and the first Broadridge quartile for the 12 months ended May 31, 2019. The Trustees noted the reasons for the Fund’s underperformance and the steps Janus Capital and Intech had taken or were taking to improve performance, and the performance trend was improving.
In consideration of each Janus Henderson Fund’s performance, the Trustees concluded that, taking into account the factors relevant to performance, as well as other considerations, including steps taken to improve performance, the Janus Henderson Fund’s performance warranted continuation of such Janus Henderson Fund’s investment advisory and subadvisory agreement(s).
Costs of Services Provided The Trustees examined information regarding the fees and expenses of each Janus Henderson Fund in comparison to similar information for other comparable funds as provided by Broadridge, an independent data provider. They also reviewed an analysis of that information provided by their independent fee consultant and noted that the rate of management fees (investment advisory and any administration, but excluding out-of-pocket costs) for many of the Janus Henderson Funds, after applicable waivers, was below the average management fee rate of the respective peer group of funds selected by an independent data provider. The Trustees also examined information regarding the subadvisory fees charged for subadvisory services, as applicable, noting that all such fees were paid by Janus Capital out of its management fees collected from such Janus Henderson Fund.
The independent fee consultant provided its belief that the management fees charged by Janus Capital to each of the Janus Henderson Funds under the current investment advisory and administration agreements are reasonable in relation to the services provided by Janus Capital. The independent fee consultant found: (1) the total expenses and management fees of the Janus Henderson Funds to be reasonable relative to other mutual funds; (2) the total expenses, on average, were 10% under the average total expenses of their respective Broadridge Expense Group peers; and (3) and the management fees for the Janus Henderson Funds, on average, were 7% under the average management fees for their Expense Groups. The Trustees also considered the total expenses for each share class of

Janus Henderson VIT Enterprise Portfolio Additional Information (unaudited)
Janus Aspen Series 35
each Janus Henderson Fund compared to the average total expenses for its Broadridge Expense Group peers and to average total expenses for its Broadridge Expense Universe.
For certain Janus Henderson Funds, the independent fee consultant also performed a systematic “focus list” analysis of expenses which assessed fund fees in the context of fund performance being delivered. Based on this analysis, the independent fee consultant found that the combination of service quality/performance and expenses on these individual Janus Henderson Funds was reasonable in light of performance trends, performance histories, and existence of performance fees, breakpoints, and/or expense waivers on such Janus Henderson Funds.
The Trustees considered the methodology used by Janus Capital and each subadviser in determining compensation payable to portfolio managers, the competitive environment for investment management talent, and the competitive market for mutual funds in different distribution channels.
The Trustees also reviewed management fees charged by Janus Capital and each subadviser to comparable separate account clients and to comparable non-affiliated funds subadvised by Janus Capital or by a subadviser (for which Janus Capital or the subadviser provides only or primarily portfolio management services). Although in most instances subadvisory and separate account fee rates for various investment strategies were lower than management fee rates for Janus Henderson Funds having a similar strategy, the Trustees considered that Janus Capital noted that, under the terms of the management agreements with the Janus Henderson Funds, Janus Capital performs significant additional services for the Janus Henderson Funds that it does not provide to those other clients, including administration services, oversight of the Janus Henderson Funds’ other service providers, trustee support, regulatory compliance and numerous other services, and that, in serving the Janus Henderson Funds, Janus Capital assumes many legal risks and other costs that it does not assume in servicing its other clients. Moreover, they noted that the independent fee consultant found that: (1) the management fees Janus Capital charges to the Janus Henderson Funds are reasonable in relation to the management fees Janus Capital charges to funds subadvised by Janus Capital and to the fees Janus Capital charges to its institutional separate account clients; (2) these subadvised and institutional separate accounts have different service and infrastructure needs; and (3) Janus Henderson mutual fund investors enjoy reasonable fees relative to the fees charged to Janus Henderson subadvised fund and separate account investors; (4) 11 of 12 Janus Henderson Funds have lower management fees than similar funds subadvised by Janus Capital; and (5) six of nine Janus Henderson Funds have lower management fees than similar separate accounts managed by Janus Capital.
The Trustees considered the fees for each Janus Henderson Fund for its fiscal year ended in 2018, including the VIT Portfolios, and noted the following with regard to each VIT Portfolio’s total expenses, net of applicable fee waivers (the VIT Portfolio’s “total expenses”):
• For Janus Henderson Balanced Portfolio, the Trustees noted that, although the Fund’s total expenses exceeded the peer group average for one share class, overall the Fund’s total expenses were reasonable.
• For Janus Henderson Enterprise Portfolio, the Trustees noted that, although the Fund’s total expenses exceeded the peer group average for one share class, overall the Fund’s total expenses were reasonable.
• For Janus Henderson Flexible Bond Portfolio, the Trustees noted that, although the Fund’s total expenses exceeded the peer group average for one share class, overall the Fund’s total expenses were reasonable. The Trustees also noted that Janus Capital has contractually agreed to limit the Fund’s expenses, although this limit did not apply because the Fund’s total expenses were already below the applicable fee limit.
• For Janus Henderson Forty Portfolio, the Trustees noted that, although the Fund’s total expenses exceeded the peer group average for one share class, overall the Fund’s total expenses were reasonable.
• For Janus Henderson Global Research Portfolio, the Trustees noted that the Fund’s total expenses were below the peer group average for both share classes.
• For Janus Henderson Global Technology Portfolio, the Trustees noted that the Fund’s total expenses were below the peer group average for both share classes.
• For Janus Henderson Mid Cap Value Portfolio, the Trustees noted that, although the Fund’s total expenses exceeded the peer group average for one share class, overall the Fund’s total expenses were reasonable. The Trustees also noted that Janus Capital has contractually agreed to limit the Fund’s expenses, although this limit did not apply because the Fund’s total expenses were already below the applicable fee limit.

Janus Henderson VIT Enterprise Portfolio Additional Information (unaudited)
36 JUNE 30, 2020
• For Janus Henderson Overseas Portfolio, the Trustees noted that the Fund’s total expenses were below the peer group average for both share classes.
• For Janus Henderson Research Portfolio, the Trustees noted that the Fund’s total expenses were below the peer group average for both share classes.
• For Janus Henderson U.S. Low Volatility Portfolio, the Trustees noted that the Fund’s total expenses were below the peer group average for its sole share class.
The Trustees reviewed information on the overall profitability to Janus Capital and its affiliates of their relationship with the Janus Henderson Funds, and considered profitability data of other publicly traded mutual fund advisers. The Trustees recognized that profitability comparisons among fund managers are difficult because of the variation in the type of comparative information that is publicly available, and the profitability of any fund manager is affected by numerous factors, including the organizational structure of the particular fund manager, differences in complex size, difference in product mix, difference in types of business (mutual fund, institutional and other), differences in the types of funds and other accounts it manages, possible other lines of business, the methodology for allocating expenses, and the fund manager’s capital structure and cost of capital.
Additionally, the Trustees considered the estimated profitability to Janus Capital from the investment management services it provided to each Janus Henderson Fund. In their review, the Trustees considered whether Janus Capital and each subadviser receive adequate incentives and resources to manage the Janus Henderson Funds effectively. In reviewing profitability, the Trustees noted that the estimated profitability for an individual Janus Henderson Fund is necessarily a product of the allocation methodology utilized by Janus Capital to allocate its expenses as part of the estimated profitability calculation. In this regard, the Trustees noted that the independent fee consultant found that (1) the expense allocation methodology and rationales utilized by Janus Capital were reasonable and (2) no clear correlation between expense allocations and operating margins. The Trustees also considered that the estimated profitability for an individual Janus Henderson Fund was influenced by a number of factors, including not only the allocation methodology selected, but also the presence of fee waivers and expense caps, and whether the Janus Henderson Fund’s investment management agreement contained breakpoints or a performance fee component. The Trustees determined, after taking into account these factors, among others, that Janus Capital’s estimated profitability with respect to each Janus Henderson Fund was not unreasonable in relation to the services provided, and that the variation in the range of such estimated profitability among the Janus Henderson Funds was not a material factor in the Board’s approval of the reasonableness of any Janus Henderson Fund’s investment management fees.
The Trustees concluded that the management fees payable by each Janus Henderson Fund to Janus Capital and its affiliates, as well as the fees paid by Janus Capital to the subadvisers of subadvised Janus Henderson Funds, were reasonable in relation to the nature, extent, and quality of the services provided, taking into account the fees charged by other advisers for managing comparable mutual funds with similar strategies, the fees Janus Capital and the subadvisers charge to other clients, and, as applicable, the impact of fund performance on management fees payable by the Janus Henderson Funds. The Trustees also concluded that each Janus Henderson Fund’s total expenses were reasonable, taking into account the size of the Janus Henderson Fund, the quality of services provided by Janus Capital and any subadviser, the investment performance of the Janus Henderson Fund, and any expense limitations agreed to or provided by Janus Capital.
Economies of Scale The Trustees considered information about the potential for Janus Capital to realize economies of scale as the assets of the Janus Henderson Funds increase. They noted that their independent fee consultant published a report to the Trustees in November 2019 which provided its research and analysis into economies of scale. They also noted that, although many Janus Henderson Funds pay advisory fees at a base fixed rate as a percentage of net assets, without any breakpoints or performance fees, their independent fee consultant concluded that 64% of these Janus Henderson Funds’ share classes have contractual management fees (gross of waivers) below their Broadridge expense group averages. They also noted the following: (1) that for those Janus Henderson Funds whose expenses are being reduced by the contractual expense limitations of Janus Capital, Janus Capital is subsidizing certain of these Janus Henderson Funds because they have not reached adequate scale; (2) as the assets of some of the Janus Henderson Funds have declined in the past few years, certain Janus Henderson Funds have benefited from having advisory fee rates that have remained constant rather than increasing as assets declined; (3) performance fee structures have been implemented for various Janus Henderson Funds that have caused the effective rate of advisory fees payable by such a

Janus Henderson VIT Enterprise Portfolio Additional Information (unaudited)
Janus Aspen Series 37
Janus Henderson Fund to vary depending on the investment performance of the Janus Henderson Fund relative to its benchmark index over the measurement period; and (4) a few Janus Henderson Funds have fee schedules with breakpoints and reduced fee rates above certain asset levels. The Trustees also noted that the Janus Henderson Funds share directly in economies of scale through the lower charges of third-party service providers that are based in part on the combined scale of all of the Janus Henderson Funds.
The Trustees also considered the independent fee consultant’s conclusion that, given the limitations of various analytical approaches to economies of scale and their conflicting results, it is difficult to analytically confirm or deny the existence of economies of scale in the Janus Henderson complex. In this regard, the independent consultant concluded that (1) to the extent there were economies of scale at Janus Capital, Janus Capital’s general strategy of setting fixed management fees below peers appeared to share any such economies with investors even on smaller Janus Henderson Funds which have not yet achieved those economies and (2) by setting lower fixed fees from the start on these Janus Henderson Funds, Janus Capital appeared to be investing to increase the likelihood that these Janus Henderson Funds will grow to a level to achieve any scale economies that may exist. Further, the independent fee consultant provided its belief that Janus Henderson Fund investors are well-served by the fee levels and performance fee structures in place on the Janus Henderson Funds in light of any economies of scale that may be present at Janus Capital.
Based on all of the information reviewed, including the recent and past research and analysis conducted by the Trustees’ independent fee consultant, the Trustees concluded that the current fee structure of each Janus Henderson Fund was reasonable and that the current rates of fees do reflect a sharing between Janus Capital and the Janus Henderson Fund of any economies of scale that may be present at the current asset level of the Janus Henderson Fund.
Other Benefits to Janus Capital The Trustees also considered benefits that accrue to Janus Capital and its affiliates and subadvisers to the Janus Henderson Funds from their relationships with the Janus Henderson Funds. They recognized that two affiliates of Janus Capital separately serve the Janus Henderson Funds as transfer agent and distributor, respectively, and the transfer agent receives compensation directly from the non-money market funds for services provided, and that such compensation contributes to the overall profitability of Janus Capital and its affiliates that results from their relationship with the Janus Henderson Funds. The Trustees also considered Janus Capital’s past and proposed use of commissions paid by the Janus Henderson Funds on portfolio brokerage transactions to obtain proprietary and third-party research products and services benefiting the Janus Henderson Fund and/or other clients of Janus Capital and/or Janus Capital, and/or a subadviser to a Janus Henderson Fund. The Trustees concluded that Janus Capital’s and the subadvisers’ use of these types of client commission arrangements to obtain proprietary and third-party research products and services was consistent with regulatory requirements and guidelines and was likely to benefit each Janus Henderson Fund. The Trustees also concluded that, other than the services provided by Janus Capital and its affiliates and subadvisers pursuant to the agreements and the fees to be paid by each Janus Henderson Fund therefor, the Janus Henderson Funds and Janus Capital and the subadvisers may potentially benefit from their relationship with each other in other ways. They concluded that Janus Capital and its affiliates share directly in economies of scale through the lower charges of third-party service providers that are based in part on the combined scale of the Janus Henderson Funds and other clients serviced by Janus Capital and its affiliates. They also concluded that Janus Capital and/or the subadvisers benefit from the receipt of research products and services acquired through commissions paid on portfolio transactions of the Janus Henderson Funds and that the Janus Henderson Funds benefit from Janus Capital’s and/or the subadvisers’ receipt of those products and services as well as research products and services acquired through commissions paid by other clients of Janus Capital and/or other clients of the subadvisers. They further concluded that the success of any Janus Henderson Fund could attract other business to Janus Capital, the subadvisers or other Janus Henderson funds, and that the success of Janus Capital and the subadvisers could enhance Janus Capital’s and the subadvisers’ ability to serve the Janus Henderson Funds.
LIQUIDITY RISK MANAGEMENT PROGRAM Janus Henderson Funds (other than the money market funds) have adopted and implemented a written liquidity risk management program (the “LRMP”) as required by Rule 22e-4 under the Investment Company Act of 1940, as amended (the “Liquidity Rule”). Rule 22e-4, requires open-end funds to adopt and implement a written liquidity risk management program that is reasonably designed to assess and manage liquidity risk, which is the risk that a fund could not meet redemption requests without significant dilution of remaining investors’ interest in the fund. The LRMP

Janus Henderson VIT Enterprise Portfolio Additional Information (unaudited)
38 JUNE 30, 2020
incorporates the following elements: (i) assessment, management, and periodic review of liquidity risk; (ii) classification of portfolio investments; (iii) the establishment and monitoring of a highly liquid investment minimum, as applicable; (iv) a 15% limitation on a Portfolio’s illiquid investments; (v) redemptions in-kind; and (vi) board oversight.
The Trustees have designated Janus Capital Management LLC, the Portfolio’s investment adviser (“Janus Capital”), as the Program Administrator for the LRMP responsible for administering the LRMP and carrying out the specific responsibilities of the LRMP. A working group comprised of various groups within Janus Capital’s business is responsible for administering the LRMP and carrying out the specific responsibilities of different aspects of the LRMP.
The Liquidity Rule requires the Trustees to review at least annually a written report provided by the Program Administrator that addresses the operation of the LRMP and assesses its adequacy and the effectiveness of its implementation, including, if applicable, the operation of the highly liquid investment minimum, and any material changes to the LRMP (the “Program Administrator Report”). During the semi-annual period ended June 30, 2020, the Program Administrator provided the Program Administrator Report to the Trustees which covered the operation of the LRMP from December 1, 2018 through December 31, 2019 (the “Reporting Period”). No significant liquidity events impacting the Portfolio were noted in the Program Administrator Report, and the Portfolio was able to process redemptions during the normal course of business during the Reporting Period. In addition, the Program Administrator expressed its belief in the Program Administrator Report that:
• the LRMP is reasonably designed and adequate to assess and manage the Portfolio’s liquidity risk, taking into account the Portfolio’s particular risks and circumstances, and includes policies and procedures reasonably designed to implement each required component of the Liquidity Rule; and
• the LRMP, including the Highly Liquid Investment Minimum where applicable, was implemented and operated effectively to achieve the goal of assessing and managing the Portfolio’s liquidity risk.
There can be no assurance that the LRMP will achieve its objectives in the future. Please refer to your Fund’s prospectus for more information regarding the risks to which an investment in the Fund may be subject.

Janus Henderson VIT Enterprise Portfolio Useful Information About Your Portfolio Report (unaudited)
Janus Aspen Series 39
Management Commentary The Management Commentary in this report includes valuable insight as well as statistical information to help you understand how your Portfolio’s performance and characteristics stack up against those of comparable indices.
If the Portfolio invests in foreign securities, this report may include information about country exposure. Country exposure is based primarily on the country of risk. A company may be allocated to a country based on other factors such as location of the company’s principal office, the location of the principal trading market for the company’s securities, or the country where a majority of the company’s revenues are derived.
Please keep in mind that the opinions expressed in the Management Commentary are just that: opinions. They are a reflection based on best judgment at the time this report was compiled, which was June 30, 2020. As the investing environment changes, so could opinions. These views are unique and are not necessarily shared by fellow employees or by Janus Henderson in general.
Performance Overviews Performance overview graphs compare the performance of a hypothetical $10,000 investment in the Portfolio with one or more widely used market indices. When comparing the performance of the Portfolio with an index, keep in mind that market indices are not available for investment and do not reflect deduction of expenses.
Average annual total returns are quoted for a Portfolio with more than one year of performance history. Average annual total return is calculated by taking the growth or decline in value of an investment over a period of time, including reinvestment of dividends and distributions, then calculating the annual compounded percentage rate that would have produced the same result had the rate of growth been constant throughout the period. Average annual total return does not reflect the deduction of taxes that a shareholder would pay on Portfolio distributions or redemptions of Portfolio shares.
Cumulative total returns are quoted for a Portfolio with less than one year of performance history. Cumulative total return is the growth or decline in value of an investment over time, independent of the period of time involved. Cumulative total return does not reflect the deduction of taxes that a shareholder would pay on Portfolio distributions or redemptions of Portfolio shares.
Pursuant to federal securities rules, expense ratios shown in the performance chart reflect subsidized (if applicable) and unsubsidized ratios. The total annual fund operating expenses ratio is gross of any fee waivers, reflecting the Portfolio’s unsubsidized expense ratio. The net annual fund operating expenses ratio (if applicable) includes contractual waivers of Janus Capital and reflects the Portfolio’s subsidized expense ratio. Ratios may be higher or lower than those shown in the “Financial Highlights” in this report.
Schedule of Investments Following the performance overview section is the Portfolio’s Schedule of Investments. This schedule reports the types of securities held in the Portfolio on the last day of the reporting period. Securities are usually listed by type (common stock, corporate bonds, U.S. Government obligations, etc.) and by industry classification (banking, communications, insurance, etc.). Holdings are subject to change without notice.
The value of each security is quoted as of the last day of the reporting period. The value of securities denominated in foreign currencies is converted into U.S. dollars.
If the Portfolio invests in foreign securities, it will also provide a summary of investments by country. This summary reports the Portfolio exposure to different countries by providing the percentage of securities invested in each country. The country of each security represents the country of risk. The Portfolio’s Schedule of Investments relies upon the industry group and country classifications published by Barclays and/or MSCI Inc.
Tables listing details of individual forward currency contracts, futures, written options, swaptions, and swaps follow the Portfolio’s Schedule of Investments (if applicable).
Statement of Assets and Liabilities This statement is often referred to as the “balance sheet.” It lists the assets and liabilities of the Portfolio on the last day of the reporting period.

Janus Henderson VIT Enterprise Portfolio Useful Information About Your Portfolio Report (unaudited)
40 JUNE 30, 2020
The Portfolio’s assets are calculated by adding the value of the securities owned, the receivable for securities sold but not yet settled, the receivable for dividends declared but not yet received on securities owned, and the receivable for Portfolio shares sold to investors but not yet settled. The Portfolio’s liabilities include payables for securities purchased but not yet settled, Portfolio shares redeemed but not yet paid, and expenses owed but not yet paid. Additionally, there may be other assets and liabilities such as unrealized gain or loss on forward currency contracts.
The section entitled “Net Assets Consist of” breaks down the components of the Portfolio’s net assets. Because the Portfolio must distribute substantially all earnings, you will notice that a significant portion of net assets is shareholder capital.
The last section of this statement reports the net asset value (“NAV”) per share on the last day of the reporting period. The NAV is calculated by dividing the Portfolio’s net assets for each share class (assets minus liabilities) by the number of shares outstanding.
Statement of Operations This statement details the Portfolio’s income, expenses, realized gains and losses on securities and currency transactions, and changes in unrealized appreciation or depreciation of Portfolio holdings.
The first section in this statement, entitled “Investment Income,” reports the dividends earned from securities and interest earned from interest-bearing securities in the Portfolio.
The next section reports the expenses incurred by the Portfolio, including the advisory fee paid to the investment adviser, transfer agent fees and expenses, and printing and postage for mailing statements, financial reports and prospectuses. Expense offsets and expense reimbursements, if any, are also shown.
The last section lists the amounts of realized gains or losses from investment and foreign currency transactions, and changes in unrealized appreciation or depreciation of investments and foreign currency-denominated assets and liabilities. The Portfolio will realize a gain (or loss) when it sells its position in a particular security. A change in unrealized gain (or loss) refers to the change in net appreciation or depreciation of the Portfolio during the reporting period. “Net Realized and Unrealized Gain/(Loss) on Investments” is affected both by changes in the market value of Portfolio holdings and by gains (or losses) realized during the reporting period.
Statements of Changes in Net Assets These statements report the increase or decrease in the Portfolio’s net assets during the reporting period. Changes in the Portfolio’s net assets are attributable to investment operations, dividends and distributions to investors, and capital share transactions. This is important to investors because it shows exactly what caused the Portfolio’s net asset size to change during the period.
The first section summarizes the information from the Statement of Operations regarding changes in net assets due to the Portfolio’s investment operations. The Portfolio’s net assets may also change as a result of dividend and capital gains distributions to investors. If investors receive their dividends and/or distributions in cash, money is taken out of the Portfolio to pay the dividend and/or distribution. If investors reinvest their dividends and/or distributions, the Portfolio’s net assets will not be affected. If you compare the Portfolio’s “Net Decrease from Dividends and Distributions” to “Reinvested Dividends and Distributions,” you will notice that dividends and distributions have little effect on the Portfolio’s net assets. This is because the majority of the Portfolio’s investors reinvest their dividends and/or distributions.
The reinvestment of dividends and distributions is included under “Capital Share Transactions.” “Capital Shares” refers to the money investors contribute to the Portfolio through purchases or withdrawals via redemptions. The Portfolio’s net assets will increase and decrease in value as investors purchase and redeem shares from the Portfolio.
Financial Highlights This schedule provides a per-share breakdown of the components that affect the Portfolio’s NAV for current and past reporting periods as well as total return, asset size, ratios, and portfolio turnover rate.
The first line in the table reflects the NAV per share at the beginning of the reporting period. The next line reports the net investment income/(loss) per share. Following is the per share total of net gains/(losses), realized and unrealized. Per share dividends and distributions to investors are then subtracted to arrive at the NAV per share at the end of the period. The next line reflects the total return for the period. The total return may include adjustments in accordance with

Janus Henderson VIT Enterprise Portfolio Useful Information About Your Portfolio Report (unaudited)
Janus Aspen Series 41
generally accepted accounting principles required at the period end for financial reporting purposes. As a result, the total return may differ from the total return reflected for individual shareholder transactions. Also included are ratios of expenses and net investment income to average net assets.
The Portfolio’s expenses may be reduced through expense offsets and expense reimbursements. The ratios shown reflect expenses before and after any such offsets and reimbursements.
The ratio of net investment income/(loss) summarizes the income earned less expenses, divided by the average net assets of the Portfolio during the reporting period. Do not confuse this ratio with the Portfolio’s yield. The net investment income ratio is not a true measure of the Portfolio’s yield because it does not take into account the dividends distributed to the Portfolio’s investors.
The next figure is the portfolio turnover rate, which measures the buying and selling activity in the Portfolio. Portfolio turnover is affected by market conditions, changes in the asset size of the Portfolio, fluctuating volume of shareholder purchase and redemption orders, the nature of the Portfolio’s investments, and the investment style and/or outlook of the portfolio manager(s) and/or investment personnel. A 100% rate implies that an amount equal to the value of the entire portfolio was replaced once during the fiscal year; a 50% rate means that an amount equal to the value of half the portfolio is traded in a year; and a 200% rate means that an amount equal to the value of the entire portfolio is traded every six months.

Knowledge Shared At Janus Henderson, we believe in the sharing of expert insight for better investment and business decisions. We call this ethos Knowledge Shared. Learn more by visiting janushenderson.com.
This report is submitted for the general information of shareholders of the Portfolio. It is not an offer or solicitation for the Portfolio and is not authorized for distribution to prospective investors unless preceded or accompanied by an effective prospectus. Janus Henderson, Janus, Henderson, Perkins, Intech and Knowledge Shared are trademarks of Janus Henderson Group plc or one of its subsidiaries. © Janus Henderson Group plc Janus Henderson Distributors
109-24-81116 08-20