japanese ocean flux data sets with use of remote sensing
TRANSCRIPT

Japanese Ocean Flux Data Sets with Use of Remote Sensing Observations version 3 (J-OFURO3)
Hiroyuki Tomita1
Masahisa Kubota2
Kunio Kutsuwada2
Tsutomu Hihara2
Shin’ichiro Kako3 Suguru Kameda2
1: Nagoya University, 2: Tokai University, 3: Kagoshima University
SOOS Air-Sea Flux workshopESRIN, 21-23 September 2015

Contents
Validation using in situ data
Introduction of J-OFURO3
Differences between J-OFURO2 and 3
Inter-comparison with other global data

• Daily and monthly mean• 1988-2008 • Global (60s-60n), • Standard: 1 x 1 deg. grid• High-resolution: 0.25 x 0.25 deg. (for 2002-2008)• COARE 3.0• Use of Multi-satellite observation
J-OFURO2
Tomita et al. 2010, JGR-Oceans
J-OFURO2 LHF (latent heat flux, W/m2)
Basic features:
http://dtsv.scc.u-tokai.ac.jp/j-ofuro/
For wind speedSSMIs, ERS-1/2, QuikSCAT, AMSR-E, TMI
For SSTMGDSST (AVHRR, AMSR-E)

AVISO SSHA J-OFURO2 HR LHF
J-OFURO2 HR SST J-OFURO2 HR WND
Meso-scale air-sea heat fluxExample of J-OFURO2 High-Resolution: January 2005

Meso-scale air-sea heat fluxExample of J-OFURO2 High-Resolution: July 2008
J-OFURO2 LHF in the Southern Ocean, W/m2

J-OFURO2 J-OFURO3
Period 1988-2008 1988-2013
Temporal grid daily mean daily mean
Spatial grid 1.0 deg.0.25 deg. (after 2002)
0.25 deg.
Sea Surface Temperature:
SST
MGDSST(AVHRR+AMSR-E)
Ensemble Median(8 satellite products)
Surface specific humidity:
Qa
Schlussel et al. 1995with SSMIs
New algorithms with SSMIs, SSMISs, AMSR-E, TMI,
and AMSR2
Sea Surface Wind:SSW
SSMIs, ERS-1/2, QuikSCAT, AMSR-E, TMI
SSMIs, SSMISs, ERS-1/2, QuikSCAT, AMSR-E, TMI,
WindSAT, and AMSR2

Other new feature of J-OFURO3
Freshwater fluxCollaboration with JAXA GPM project
Precipitation: GsMAP, GPCPEvaporation: J-OFURO3 Latent heat flux
Example of precipitation map from GsMAP
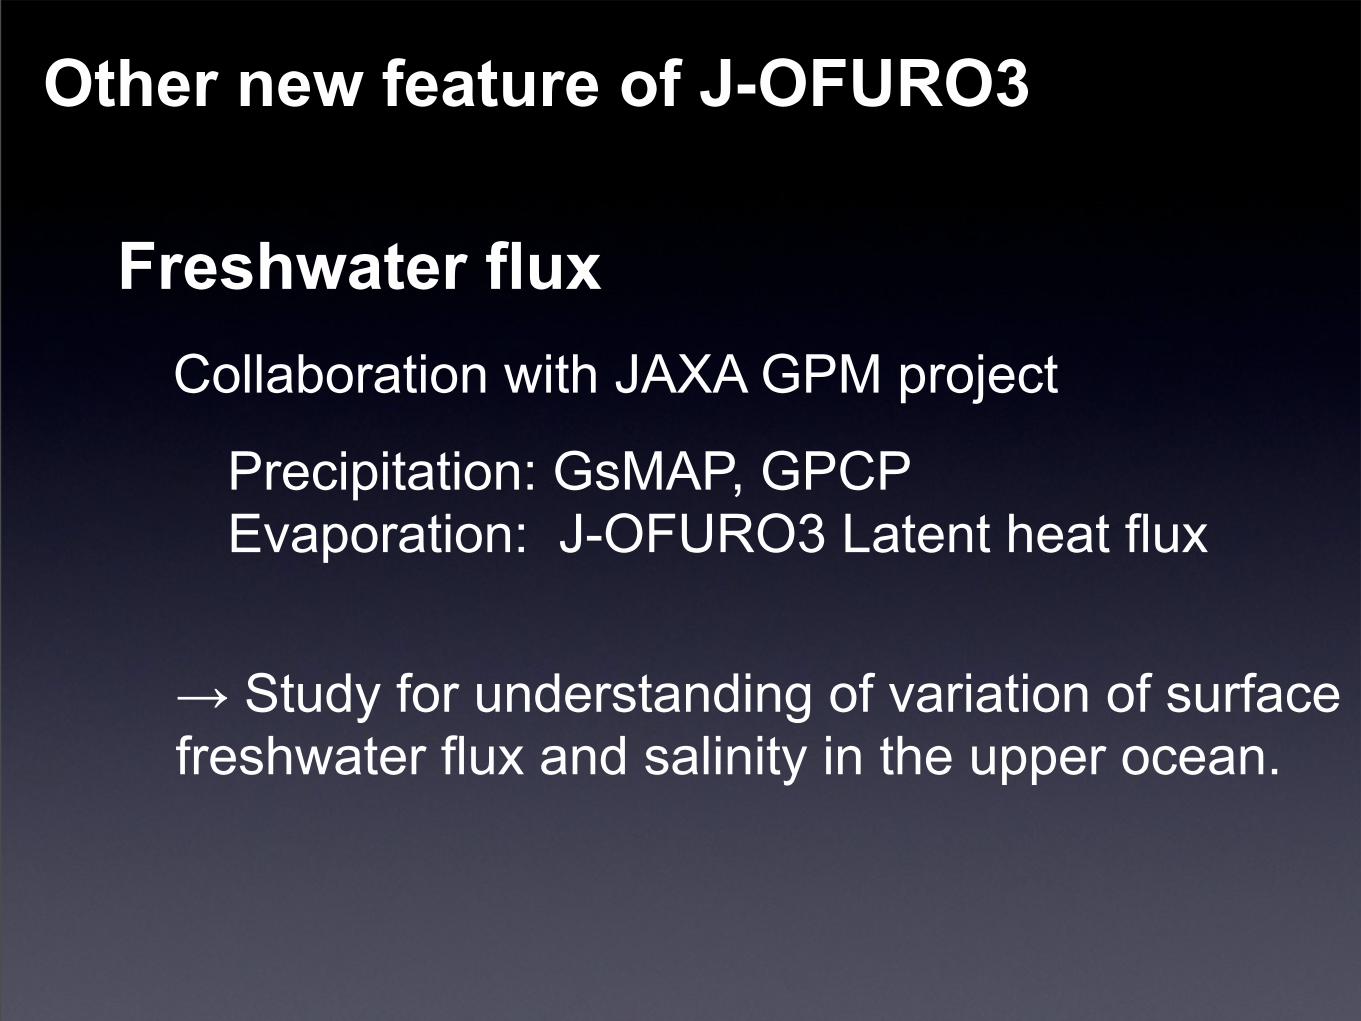
Other new feature of J-OFURO3
Freshwater flux
Precipitation: GsMAP, GPCPEvaporation: J-OFURO3 Latent heat flux
→ Study for understanding of variation of surface freshwater flux and salinity in the upper ocean.
Collaboration with JAXA GPM project

Average: 12.38 g/kgStandard deviation: 4.40 g/kg
Surface Air Specific Humidity: Qa
Data using
1) Development of new algorithms2) Combining each satellite Qa
J-OFURO3 preliminary
Uses information of vertical profile based on analysis of in-situ radiosonde observations.
New algorithmSchlussel et al 1995 --->
DMSP/SSMI F13, F14,
Aqua/AMSR-E
! and TRMM/TMI

J-OFURO2 J-OFURO3 preliminary
New algorithm for humidityBuoy (X-axis) and Satellite(Y-axis)
Surface specific humidity [g/kg], KEO buoy: 32N,145.6E
SSMIs F13 and F14TMIAMSR-E
SSMIs F13 and F14

Latent Heat Flux: LHF in J-OFURO3
Preliminary productin 2008
J-OFURO3 preliminary
Averages for December, January, and February in 2008Units: W/m2
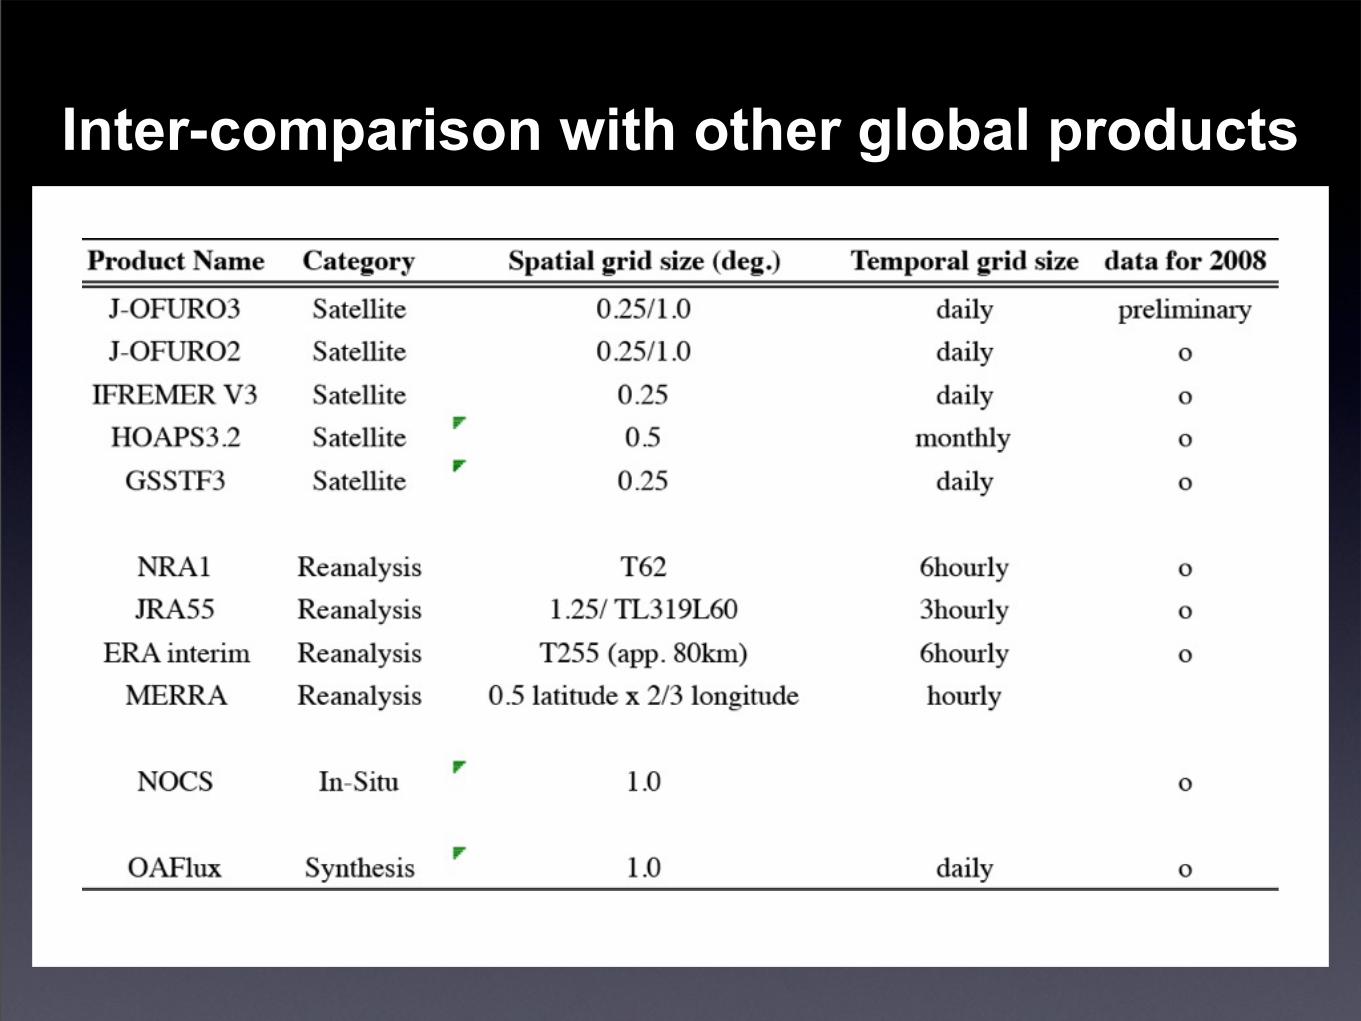
Inter-comparison with other global products

Zonal and annual meanLatent Heat Flux [W/m2]
J-OFURO3 PreJ-OFURO2HOAPS3.2
IFREMER V3GSSTF3OAFlux
x NRA1x ERA Interim
x JRA55x MERRAx NOCS
EQ40S60S 60N40N

J-OFURO2
J-OFURO3
Unit: W/m2
Bias of LHF, 2008

Bias of LHF, 2008
Unit: W/m2
180E
J-OFURO2
J-OFURO3
Validation using in situ observation
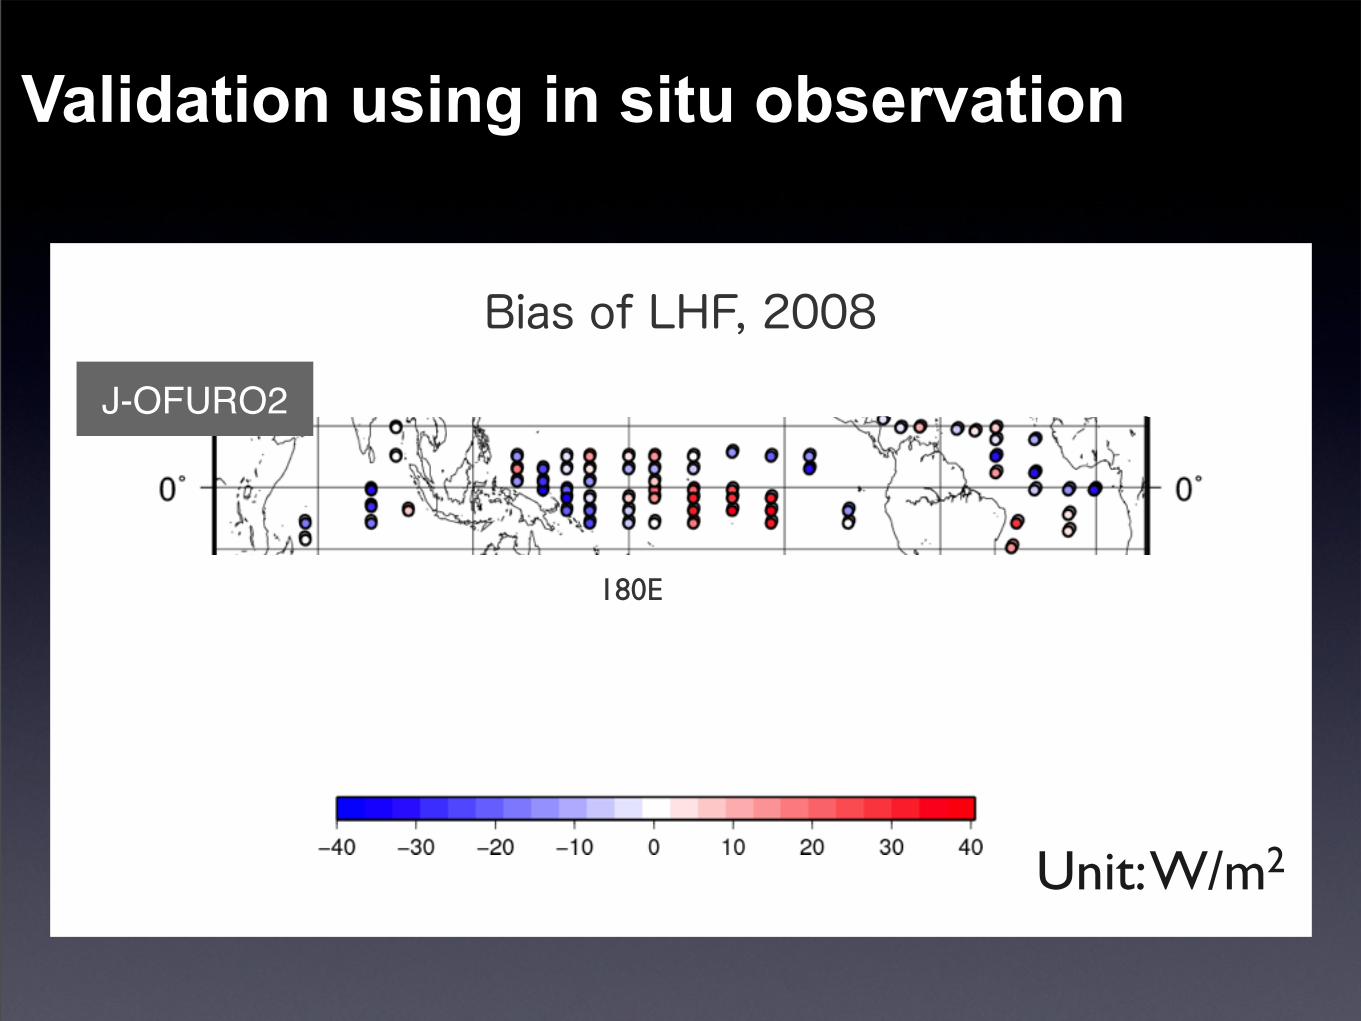
Bias of LHF, 2008
Unit: W/m2
180E
J-OFURO2
Validation using in situ observation

Bias of LHF, 2008
Unit: W/m2
J-OFURO3
Validation using in situ observation
180E

Standard deviation
25
50
75
100
0
25
0
50
0
75
0
100
0
1250.1 0.2
0.30.4
0.5
0.6
0.7
0.8
0.9
0.95
0.99
C o rrelation
Coefficient
RM
SD
BUOY
AB
CD
E
F
A: J-OFURO3 (0.0.4)B: GSSTF3C: OAFluxD: J-OFURO2E: IFREMER V3F: NRA1
Taylor Diagram @ TAO 5S125W
Evaluation of daily variability

A: J-OFURO3 (0.0.4)B: GSSTF3C: OAFluxD: J-OFURO2E: IFREMER V3F: NRA1
Taylor Diagram @ KEO 32N, 145.5E
Evaluation of daily variability

A: J-OFURO3 (0.0.4)B: GSSTF3C: OAFluxD: J-OFURO2E: IFREMER V3F: NRA1
Taylor Diagram @ KEO 32N, 145.5E
Evaluation of daily variability
LHF@KEO
number of data : 209Buoy average : 152.550
Satellite average : 160.343Bias : 7.793
RMS error : 39.272
J-OFU
RO3
Buoy

Zonal and annual meanLatent Heat Flux [W/m2]
J-OFURO3 PreJ-OFURO2HOAPS3.2
IFREMER V3GSSTF3OAFlux
x NRA1x ERA Interim
x JRA55x MERRAx NOCS

EM from 11 products
EM (Ensemble Median)
AVEMAXMIN
EQ40S80S 80N40N
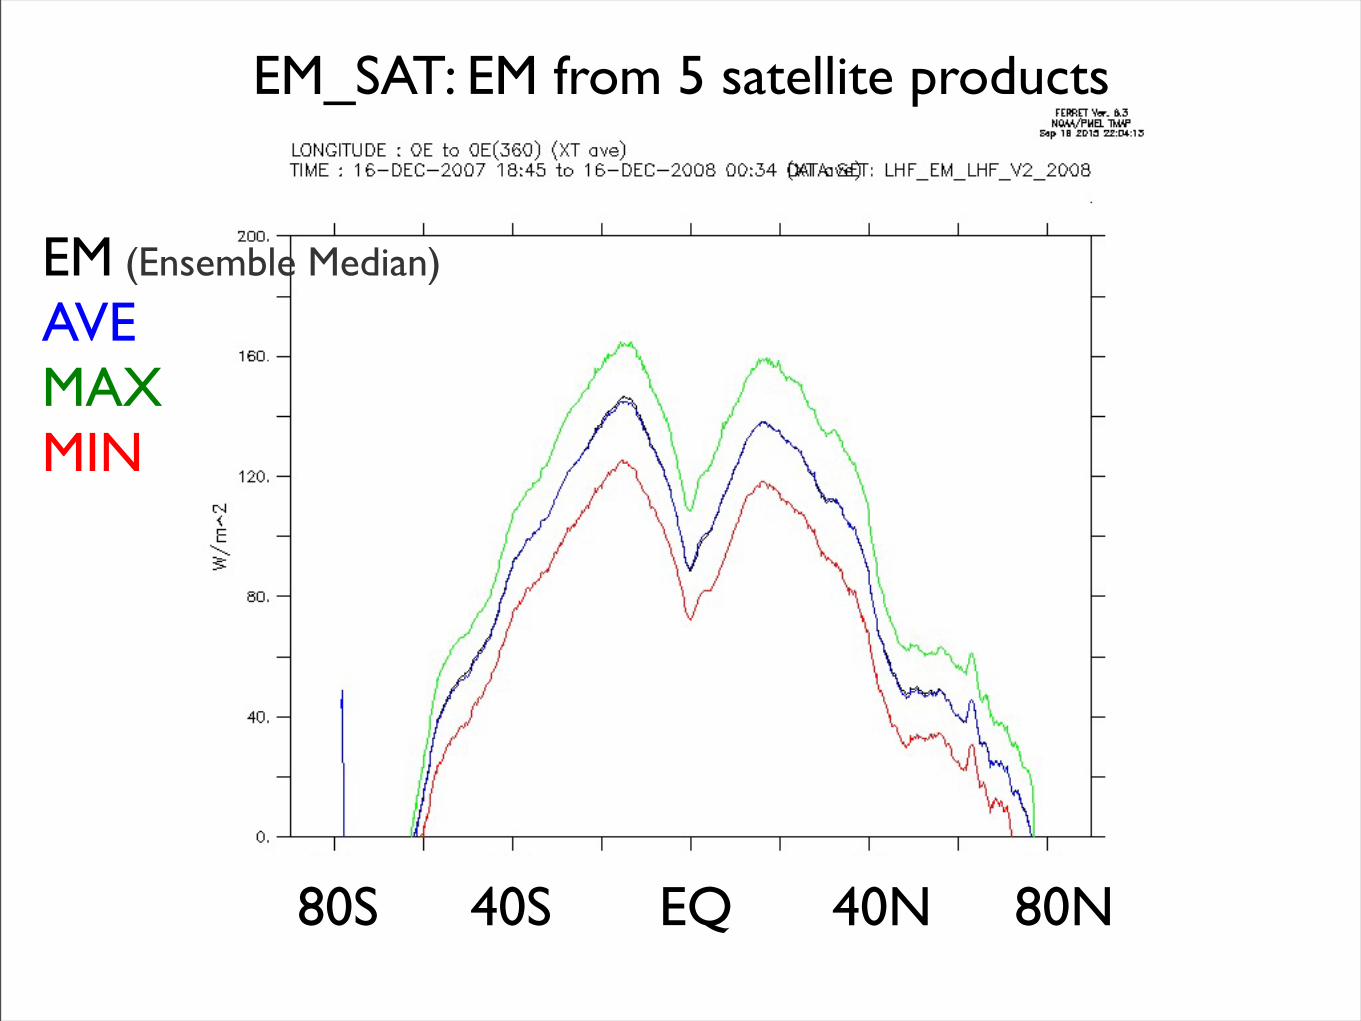
EM_SAT: EM from 5 satellite products
EM (Ensemble Median)
AVEMAXMIN
EQ40S80S 80N40N

EM_NWP: EM from 3 NWP and OAFlux
EM (Ensemble Median)
AVEMAXMIN
EQ40S80S 80N40N

EM minus EM_NWPEM minus EM_SAT
Large differences inSouthern Ocean
EQ20S60S 60N20N

Summary
We have developed the new version of J-OFURO.
J-OFURO3 flux and state variables were updated with many improvements.
New flux and state variables were validated with in situ data and compared with other global flux data.
J-OFURO3 will be open in this year for public use.http://dtsv.scc.u-tokai.ac.jp/j-ofuro/
New algorithm of Qa (specific humidity)for SSMIs, AMSR-E, and TMI
e.g.,