javier arellano yanguas 24 th october 2008 london javier arellano yanguas 24 th october 2008 london...
Post on 20-Dec-2015
217 views
TRANSCRIPT
Javier Arellano Yanguas24th October 2008London
Fiscal transfers and challenges to local public management in mineral economies: canon minero transfers and conflicts in Peru
Hosted by Funded by
1. Relevance of sub-national level analysis
2. The Peruvian case
3. Social conflicts and mining in Peru
4. Selection of regions for the research
5. Analysis of conflicts in Peruvian mining regions
Outline
Academic debate about “resource curse” theories to date has predominantly focused on the national level: curses are understood as malfunctions in national economies and polities.
The past 15 years have seen changes in polities, three of which are particularly important:
a) Decentralisation of authority from national to sub-national levels of government
b) Wider scope for citizens’ participation
c) More cooperation between state agencies and commercial organisations
These measures constitute a widely accepted and promoted “good governance” agenda.
Relevance of sub-national level analysis I
Simultaneously, international institutions and the mining industry have adopted decentralisation, popular participation and public-private partnership, complemented by the Extractive Industries Transparency Initiative (EITI), as a new natural resources policy agenda (NNRPA).
Analysis of political dynamics at the sub-national level is crucial to the understanding of how this agenda works.
The Peruvian case is a paradigmatic example of the implementation of this agenda:
a) Incipient political decentralisation in combination with canon minero;
b) Participatory budgeting and other participatory schemes;
c) Growing involvement of companies at the local level;
Relevance of sub-national level analysis II
In the context of a weak Peruvian central state and weaker local governments, the implementation of the NNRPA has relocated the resource curse to sub-national level. Thus, local governments, mining companies and a variety of local actors are locked into complex relationships.
Relevance of sub-national level analysis III
In 2007, more than 67 % of the total canon transfer was concentrated in just 6 out of 25 regions (Ancash, Cajamarca, Cusco, Moquegua, Pasco and Tacna), accounting for a mere 16 % of the country’s population.
Due to massive increases in the canon minero’s monetary value, these six regions, along with their local governments, received more than 52 % of the total revenue transferred by the central government to the local level for investment.
While the country on average allocated approximately nuevos soles 426 ($USD 152) per capita for decentralised public investment, mining regions received this figure several times over.
The Peruvian case: some figures
Do mining regions take advantage of these transfers? Are they in a comparatively better position? Apparently not:
a) They suffer from more frequent social conflicts.
b) Public investment is inefficient and not designed to promote development.
I will focus mainly on the conflict side.
Social conflicts and mining
I selected three regions out of the six receiving the greatest amount of canon minero transfers (it guarantees the importance of current mining activities).
Regions with the most municipalities exhibiting two concurrent features:
a) In receipt of more than nuevos soles 1,800 per capita of fiscal transfers
b) Their population is over 3000
This selection allows research of both the nature of conflicts and the dynamics around public investment at local level.
According to these criteria, I selected Ancash (eight municipalities); Moquegua (five municipalities) and Pasco (nine municipalities).
I undertook field research from the 1st of April to 29th of September (2008)
Selection of regions for the research I
Selection of regions for the research II
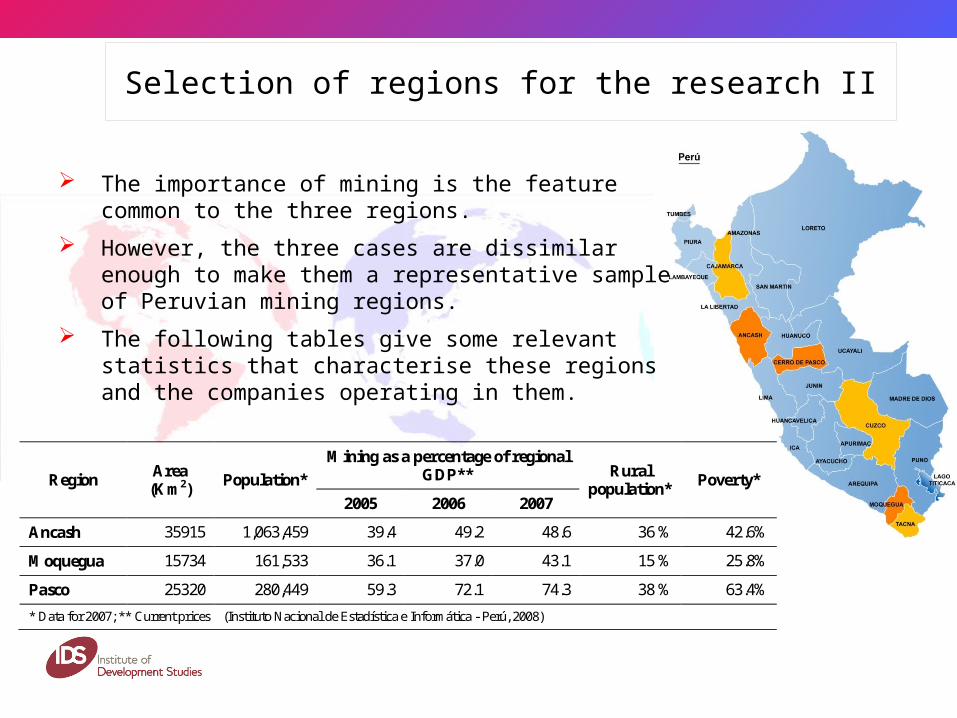
The importance of mining is the feature common to the three regions.
However, the three cases are dissimilar enough to make them a representative sample of Peruvian mining regions.
The following tables give some relevant statistics that characterise these regions and the companies operating in them.
Region Area (Km2)
Population*
Mining as a percentage of regional GDP** Rural
population* Poverty*
2005 2006 2007
Ancash 35915 1,063,459 39.4 49.2 48.6 36 % 42.6%
Moquegua 15734 161,533 36.1 37.0 43.1 15 % 25.8%
Pasco 25320 280,449 59.3 72.1 74.3 38 % 63.4%
* Data for 2007; ** Current prices (Instituto Nacional de Estadística e Informática - Perú, 2008)

Companies operating in the three regionsREGION / Mine Owners
Commencement year* Type Minerals Size
Expected lifespan**
Employment***
Direct Services
ANCASH
Antamina
BHP Billiton 33.7%
Xstrata 33.7%
Teckcominco 22.5%
Mitsubishi 10%
2001 Open pit Cu , Zn Very large
Over 25 years
1,700 2,500
Pierina Barrick 1998 Open pit Au Medium Closing 440 450
MOQUEGUA
Southern CC Grupo Mexico 1976 Open pit Cu Large Over 20 years 1,500 500
Quellaveco Anglo American Awaiting social
license Open pit Cu , Mb Large Over 30 years 1,500
PASCO
Cerro de Pasco Volcan 1903 Underground
Open pit (1956) Zn, Pb, Ag Large Long term**** 1,230 1990
Brocal El Brocal 1956 Open pit (1993) Zn, Pb, Ag Medium Long term 275 600
Huarón Pan American Silver 1912 Underground Ag, Zn Medium 15 years 812 570
Atacocha Atacocha 1937 Underground Zn, Ag,, Pb, Cu Medium 8-10 years 390 ---
Milpo Milpo 1949 Underground Zn, Pb, Cu Medium 8-10 years 300 600
In some locations, mining activities started before the involvement of the present company; ** According to direct company information or estimated through reserves and production; *** According to company information; **** Dependent on current negotiation with population and authorities.
Sources: Company annual reports and personal interviews with employees.
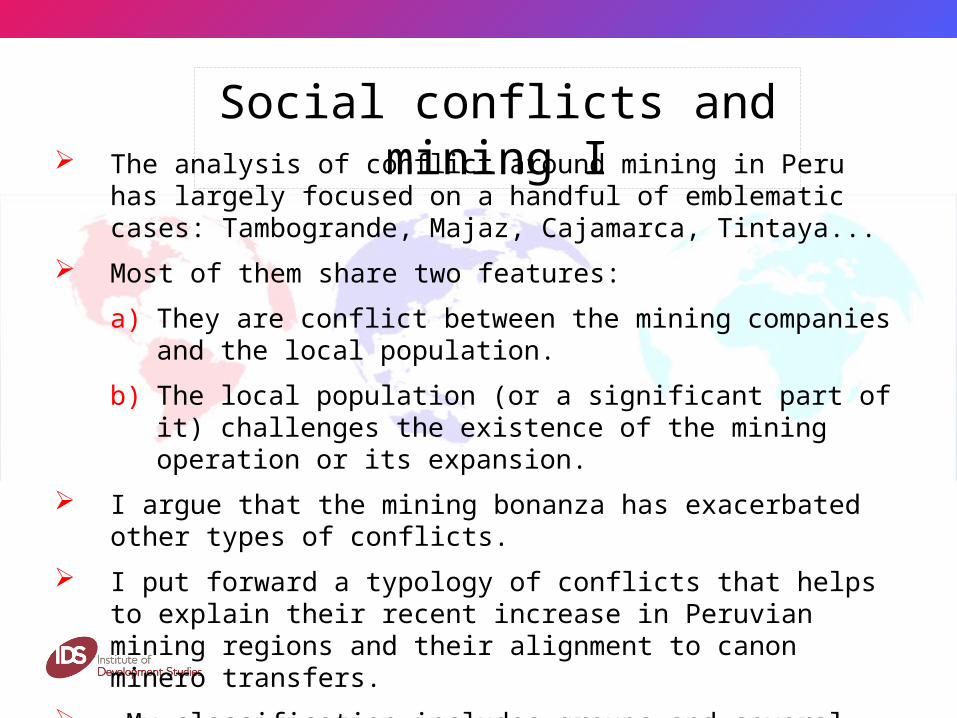
Social conflicts and mining I The analysis of conflict around mining in Peru has largely focused on a
handful of emblematic cases: Tambogrande, Majaz, Cajamarca, Tintaya...
Most of them share two features:
a) They are conflict between the mining companies and the local population.
b) The local population (or a significant part of it) challenges the existence of the mining operation or its expansion.
I argue that the mining bonanza has exacerbated other types of conflicts.
I put forward a typology of conflicts that helps to explain their recent increase in Peruvian mining regions and their alignment to canon minero transfers.
My classification includes groups and several subgroups:
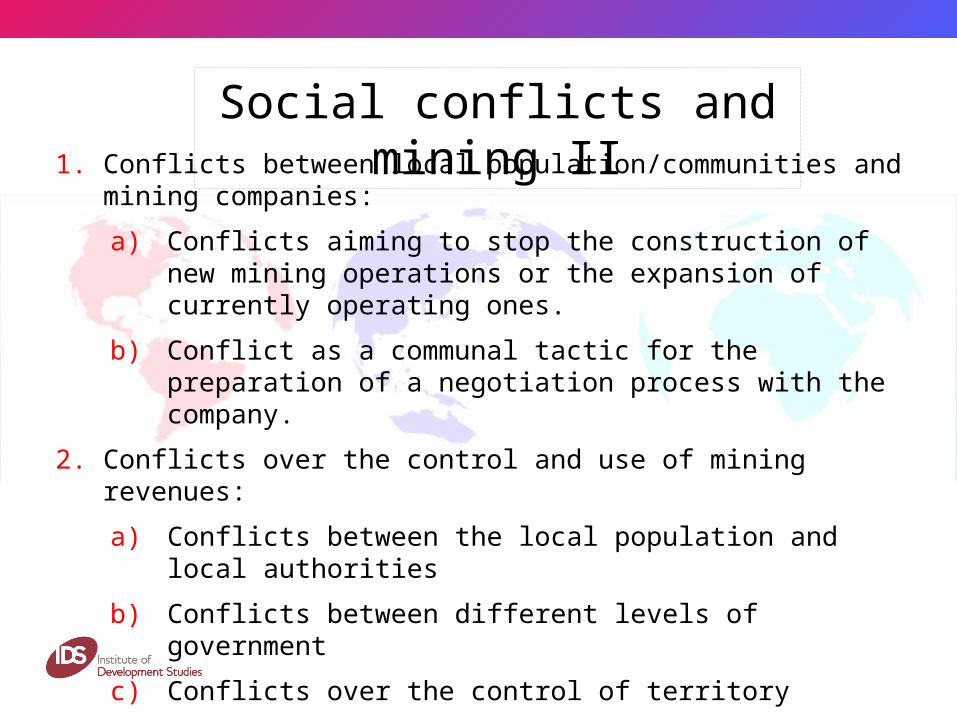
1. Conflicts between local population/communities and mining companies:
a) Conflicts aiming to stop the construction of new mining operations or the expansion of currently operating ones.
b) Conflict as a communal tactic for the preparation of a negotiation process with the company.
2. Conflicts over the control and use of mining revenues:
a) Conflicts between the local population and local authorities
b) Conflicts between different levels of government
c) Conflicts over the control of territory
d) Labour conflicts
Social conflicts and mining II
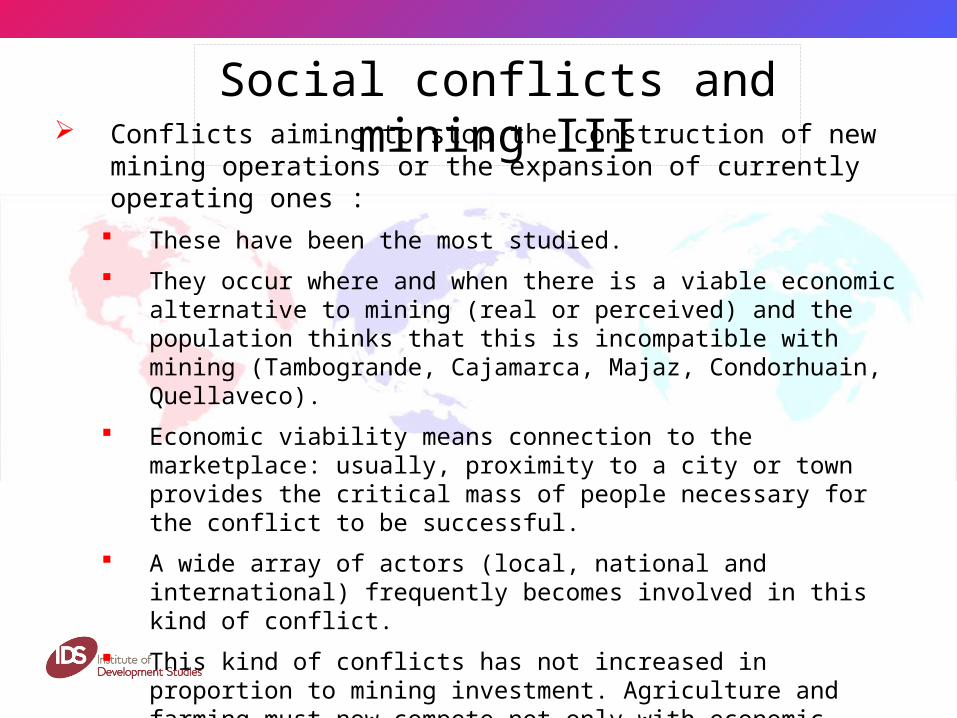
Conflicts aiming to stop the construction of new mining operations or the expansion of currently operating ones :
These have been the most studied.
They occur where and when there is a viable economic alternative to mining (real or perceived) and the population thinks that this is incompatible with mining (Tambogrande, Cajamarca, Majaz, Condorhuain, Quellaveco).
Economic viability means connection to the marketplace: usually, proximity to a city or town provides the critical mass of people necessary for the conflict to be successful.
A wide array of actors (local, national and international) frequently becomes involved in this kind of conflict.
This kind of conflicts has not increased in proportion to mining investment. Agriculture and farming must now compete not only with economic opportunities around the mine (reduced ones), but also with the popular expectations of getting a job in the public works financed by canon minero transfers.
Social conflicts and mining III
Conflict as a communal tactic for the preparation of a negotiation process with companies These form the majority of the conflicts involving local communities and small
towns around mines. Different motives trigger these conflicts:
1. In the context of a mining bonanza companies use profits to expand their operations. They need to negotiate with local communities to obtain land and water. Local communities employ the conflict to reinforce their position in the negotiation process (Rancas, Cerro de Pasco, Huallay, Juprog).
2. The non-fulfilment of company promises and previous agreements: (peasants’ communities around Pierina, Ayash, Carhuayoc, Ilo). Company profits provide an incentive for the population’s claims.
3. Communities’ sense of grievance regarding previous agreements on land transfers. Although the price was freely agreed, the population believes that the current companies’ profits signal unfair deals (Antamina)
4. The local population demands its share in the unprecedented profits (Yarusyakan, Ticlacayan, Huallay).
Social conflicts and mining IV
People feel that conflict is the only way to allow them negotiation on an equal footing with the companies.
The local population justifies its claims using different discourses: ecology, ethnicity or social justice. People have a complex and ambiguous relationship with these discourses:
a) Such considerations are deeply rooted in the local culture and genuinely constitute people’s identity.
b) However, negotiations conclude in agreements on employment, economic compensation, promotion of small businesses, implementation of social projects, etc.
Local communities try to negotiate directly with the companies. They do not want other actors to get involved.
Conflicts in this subgroup have increased in the last few years because mining companies’ profits prompt them. As canon minero transfers depend on companies’ profits, this partly explains the alignment between conflicts and transfers.
Social conflicts and mining V
Conflicts over the control and use of mining revenues This type of conflict has increased dramatically in the last two years. These conflicts are directly related to canon minero transfers.
a) Conflicts between local population and local authorities • Local authorities’ failure to invest canon minero transfers efficiently
(Pasco and Ancash).
b) Conflicts between different levels of government.
• Between municipalities and the regional government (openly in Ancash and Pasco).
• Between regional governments and the national government: o Modification of the Fondoempleo scheme;
o Rules for the distribution of canon minero (Ancash, Moquegua).
Social conflicts and mining VI
c) Conflicts over the control of territory
• Regions and municipalities fight to include under their jurisdiction territories with mining potential and water resources (a key asset for mining development)
• Moquegua has different quarrels with Puno, Arequipa and Tacna.
• Within Moquegua, some districts are fighting amongst themselves (Carumas/San Cristobal; Samegua/Torata).
d) Labour conflicts
• In Ancash (Conchucos) and Moquegua the majority of the population works as unskilled labour for the municipalities (thanks to canon minero transfers). These workers earn more than teachers, health workers, police officers, the armed forces, etc. This consequently generates malcontent and mobilisations.
Social conflicts and mining VII
Thanks!
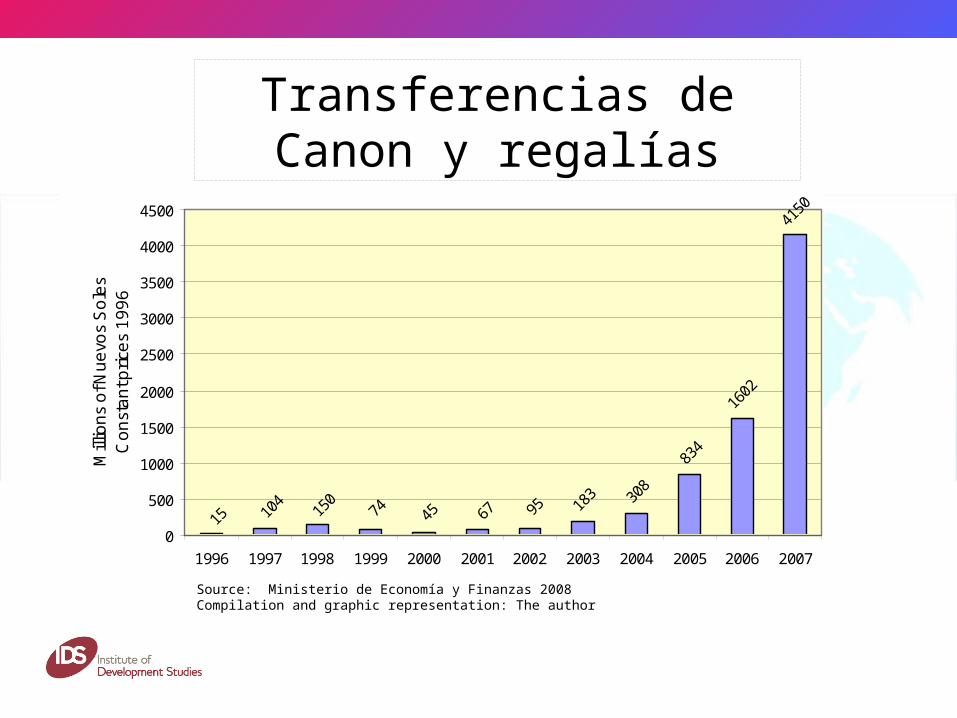
Transferencias de Canon y regalías
0
500
1000
1500
2000
2500
3000
3500
4000
4500
1996 1997 1998 1999 2000 2001 2002 2003 2004 2005 2006 2007
Mill
ion
s o
f Nu
evo
s S
ole
s
Co
nst
an
t pri
ces
19
96
Source: Ministerio de Economía y Finanzas 2008Compilation and graphic representation: The author
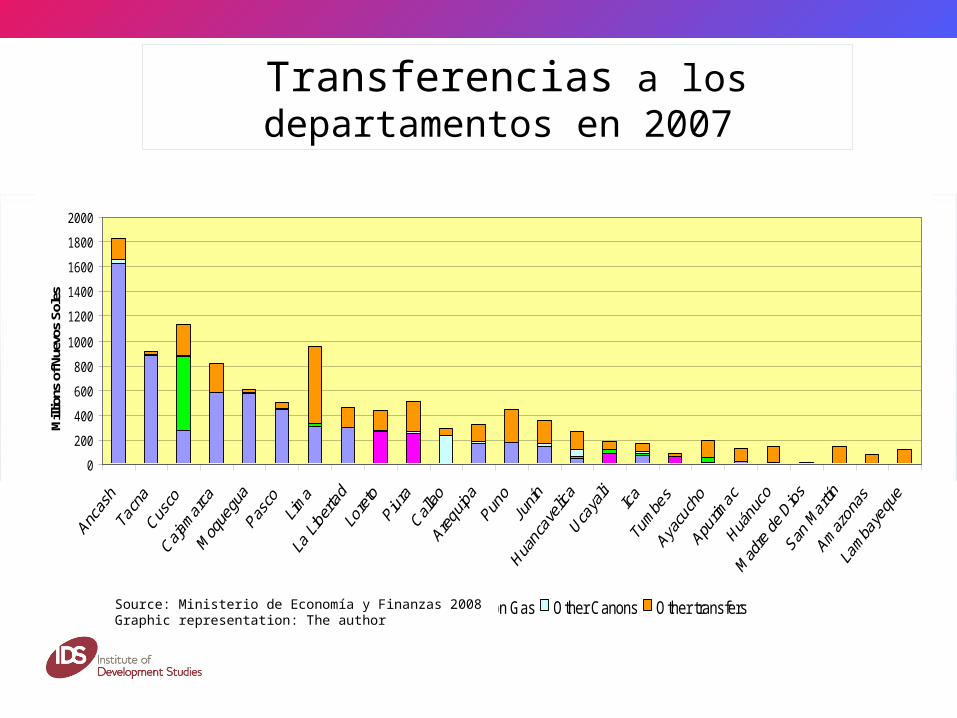
Transferencias a los departamentos en 2007
0
200
400
600
800
1000
1200
1400
1600
1800
2000
Mill
ions
of N
uevo
s So
les
Canon minero Canon oil Canon Gas Other Canons Other transfersSource: Ministerio de Economía y Finanzas 2008Graphic representation: The author
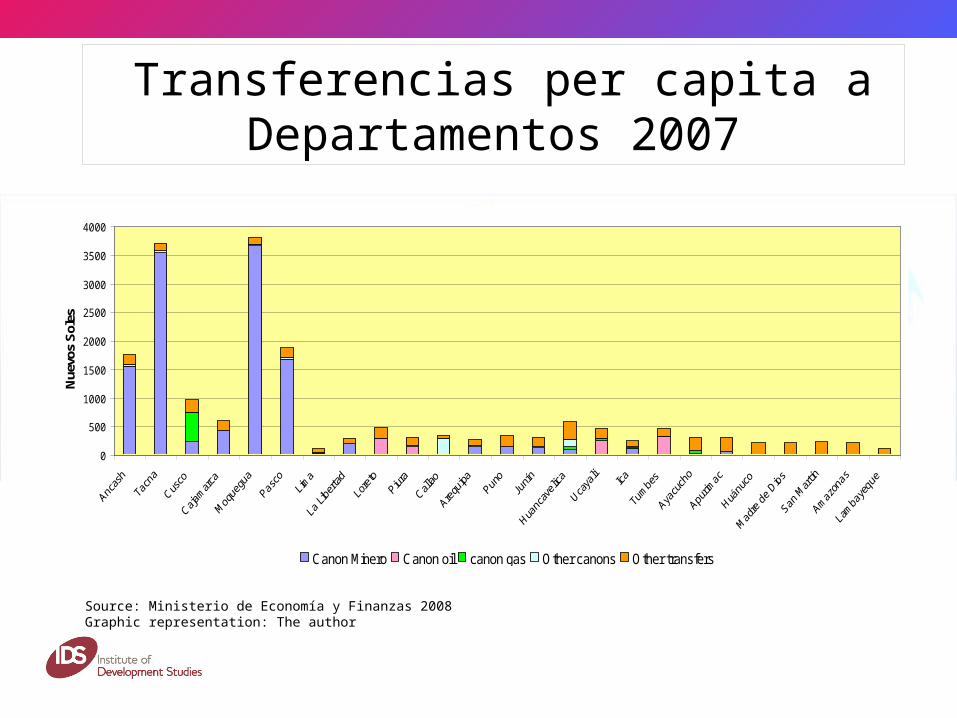
Transferencias per capita a Departamentos 2007
0
500
1000
1500
2000
2500
3000
3500
4000
Nue
vos
Sol
es
Canon Minero Canon oil canon gas Other canons Other transfers
Source: Ministerio de Economía y Finanzas 2008Graphic representation: The author
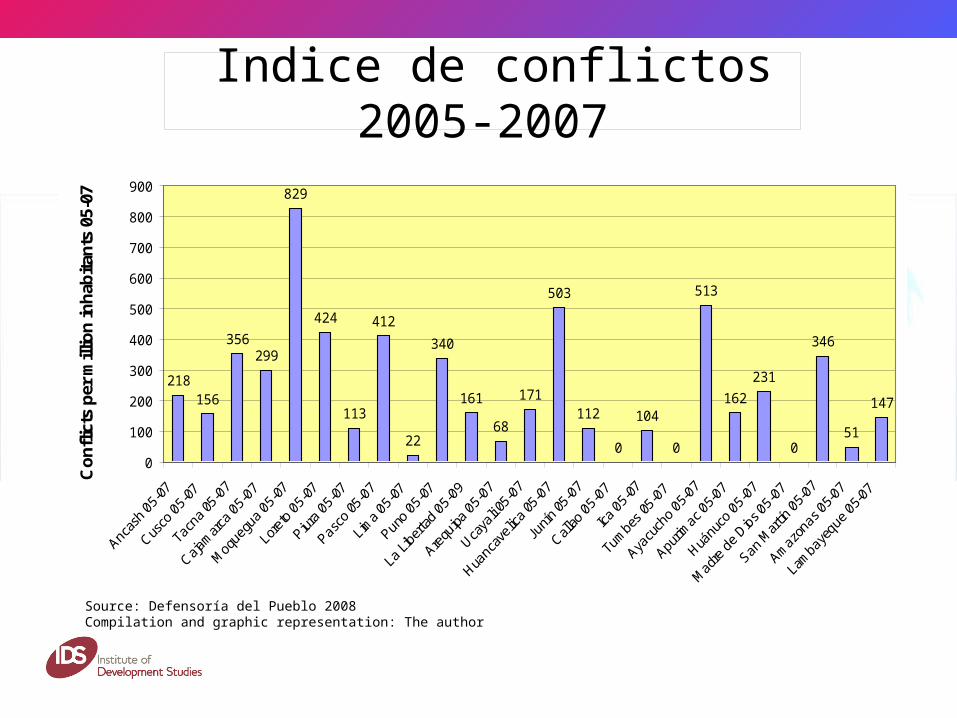
Indice de conflictos 2005-2007
218156
356299
829
424
113
412
22
340
161
68
171
503
112
0
104
0
513
162
231
0
346
51
147
0
100
200
300
400
500
600
700
800
900
Co
nfl
icts
per
mill
ion
inh
abit
ants
05-
07
Source: Defensoría del Pueblo 2008Compilation and graphic representation: The author
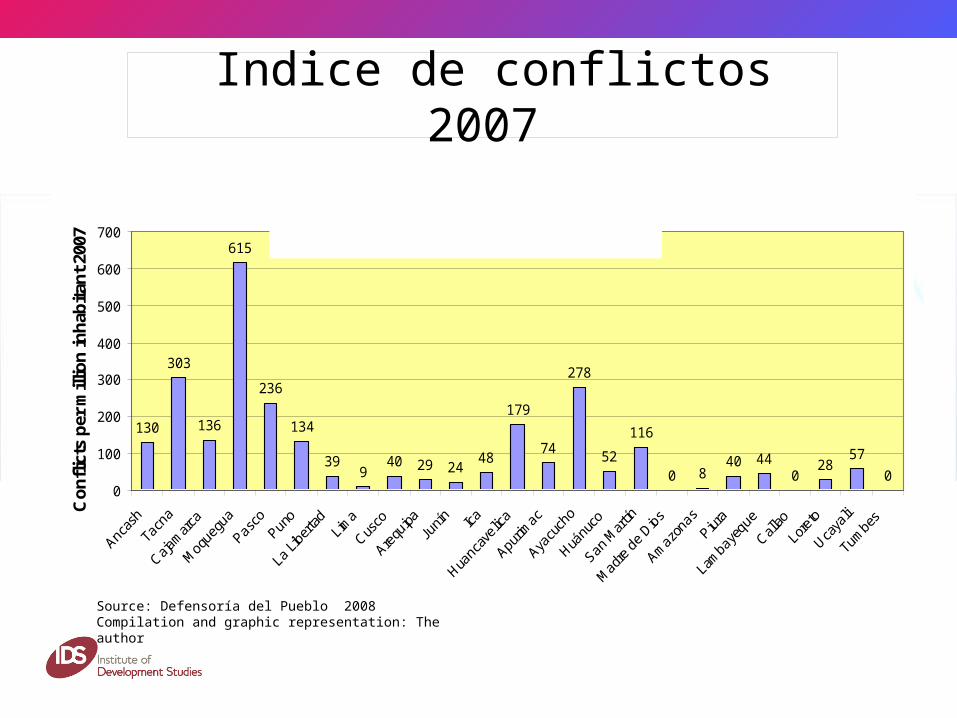
Indice de conflictos 2007
Per capita conflict index aggregated 2007
130
303
136
615
236
134
399
40 29 2448
179
74
278
52
116
0 840 44
028
57
00
100
200
300
400
500
600
700
Co
nfl
icts
per
mill
ion
inh
abit
ant
2007
Source: Defensoría del Pueblo 2008Compilation and graphic representation: The author
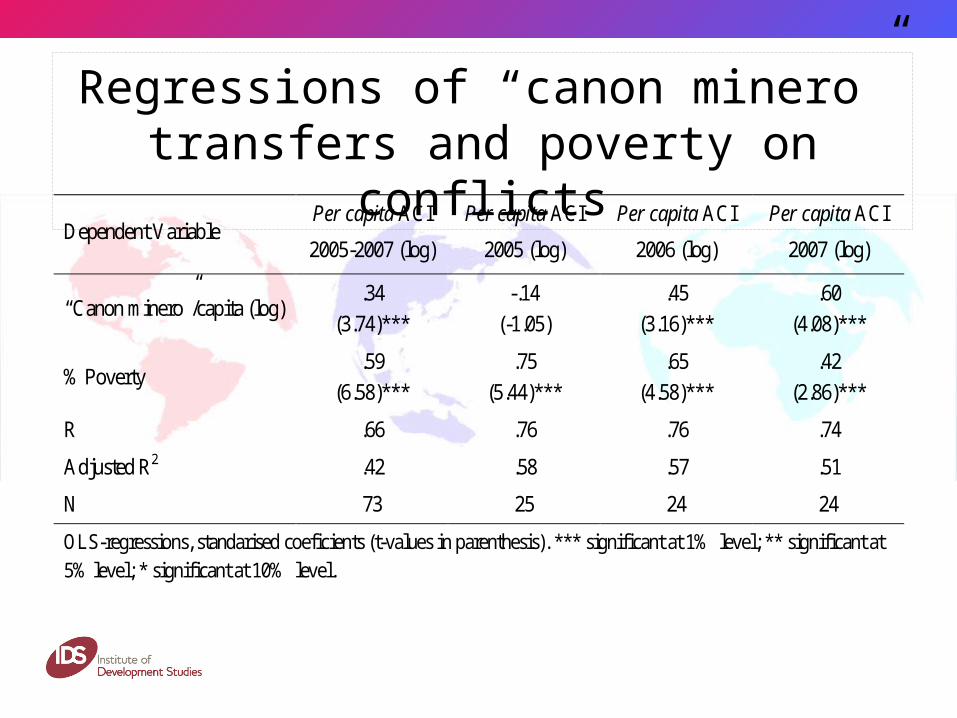
Regressions of “canon minero” transfers and poverty on conflicts
Dependent Variable Per capita ACI
2005-2007 (log)
Per capita ACI
2005 (log)
Per capita ACI
2006 (log)
Per capita ACI
2007 (log)
“Canon minero”/capita (log) .34
(3.74)***
-.14
(-1.05)
.45
(3.16)***
.60
(4.08)***
% Poverty .59
(6.58)***
.75
(5.44)***
.65
(4.58)***
.42
(2.86)***
R .66 .76 .76 .74
Adjusted R2 .42 .58 .57 .51
N 73 25 24 24
OLS-regressions, standarised coeficients (t-values in parenthesis). *** significant at 1% level; ** significant at 5% level; * significant at 10% level.

Conflicts, poverty and canon minero transfers
Table 2. Evolution of correlation between “canon minero” transfers and conflicts
2005 2006 2007
Pearson Correlation -.16 .44* .65**
N 25 25 25
Pearson Correlation between “canon minero” transfers/capita (log) and ACI/capita (log). ** Sig. (2-tailed) significant at 1% level; * Sig. (2-tailed) significant at 5% level.
Table 3- Evolution of correlation between poverty and conflicts
2005 2006 2007
Pearson Correlation .75** .61** .45*
N 25 24 24
Pearson Correlation between % Poverty and ACI/capita (log). ** Sig. (2-tailed) significant at 1% level; * Sig. (2-tailed) significant at 5% level.

Correlation between conflicts and transfers 2005

Correlation between conflicts and transfers 2006
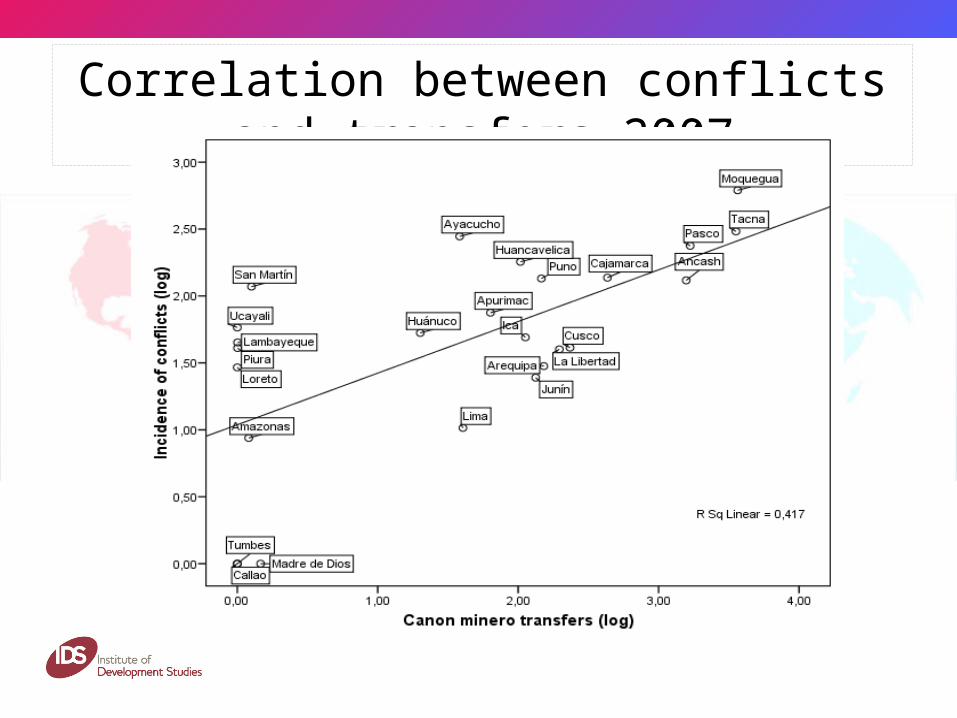
Correlation between conflicts and transfers 2007
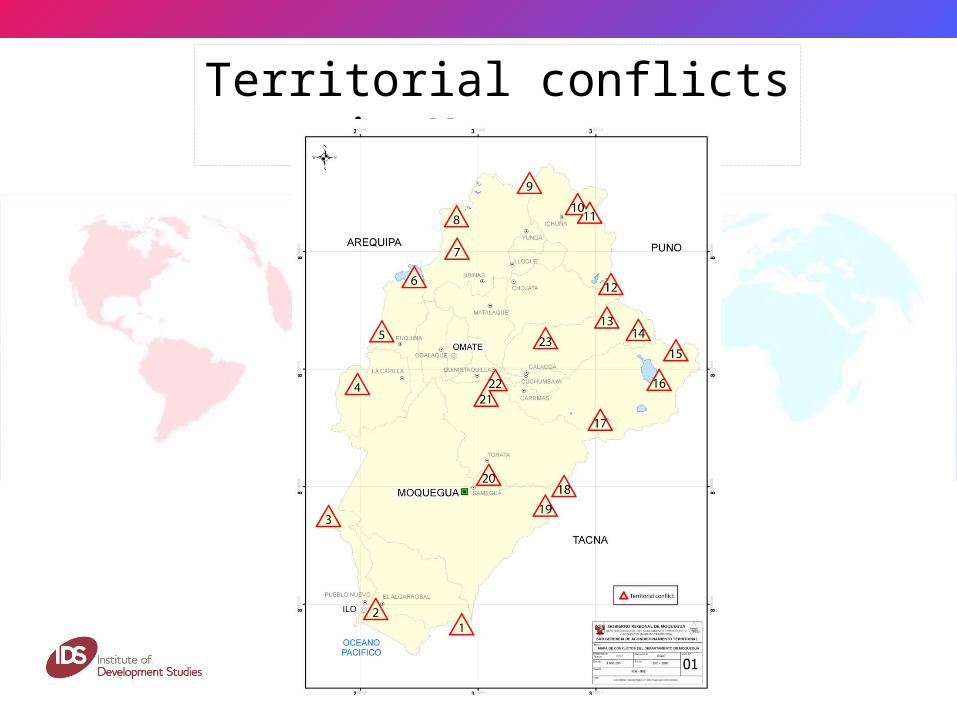
Territorial conflicts in Moquegua