jefferson county, missouri
TRANSCRIPT

JEFFERSON COUNTY, MISSOURI
DATA BOOK 2013
2013 DATA BOOK This is the fifth edition of the Jefferson County Data Book. The Data Book, prepared by the
Jefferson County Planning Division, is designed as a source of information on Jefferson
County for citizens, elected officials, public service providers, and researchers. For
additional information about the Data Book please call (636) 797-5580 or write:
Jefferson County Department of County Services & Code Enforcement
PO Box 100
Hillsboro, MO 63050
2013 Jefferson County Data Book _________________________________________________________
2
Jefferson County, Missouri, Executive
Ken Waller
Jefferson County, Missouri, Council
Council District 1 – Don Bickowski
Council District 2 – Renee Reuter
Council District 3 – Bob Boyer
Council District 4 – George Engelbach
Council District 5 – Teresa “Terri” Kreitler, Council Vice-Chair
Council District 6 – Cliff Lane
Council District 7 – Kelly Waymon, Council Chair
PLANNING AND ZONING COMMISSION
Mike Price, Chairman Windsor Township
Paul Kopp, Vice Chairman Plattin Township
Lester Munzlinger, Secretary High Ridge Township
Tom Dismuke, P.E. Rock Township
Jason Jonas, P.E. Department of Public Works
Mike Huskey Central Township
Terry Praechter Imperial Township
Tim Dugan Big River Township
Don Geatley Meramec Township
Jesse Ford Valle Township
Charlie Lesch Joachim Township
Vacant Riverview Township
COUNTY SERVICES & CODE
ENFORCEMENT
Kristi A. Bales, Director
Carey Renshaw, Administrative Assistant
PLANNING DIVISION
Dennis J. Kehm, Jr., Code Compliance Officer
Justin Randall, Planner II
Jay Rodenbeck, Planner II
Larry Kennedy, Zoning Inspector
Cindy Smetzer, Planning Technician
Elaine Roesch, Administrative Clerk II

__________________________________________________________2013 Jefferson County Data Book
3
INTRODUCTION TO JEFFERSON COUNTY
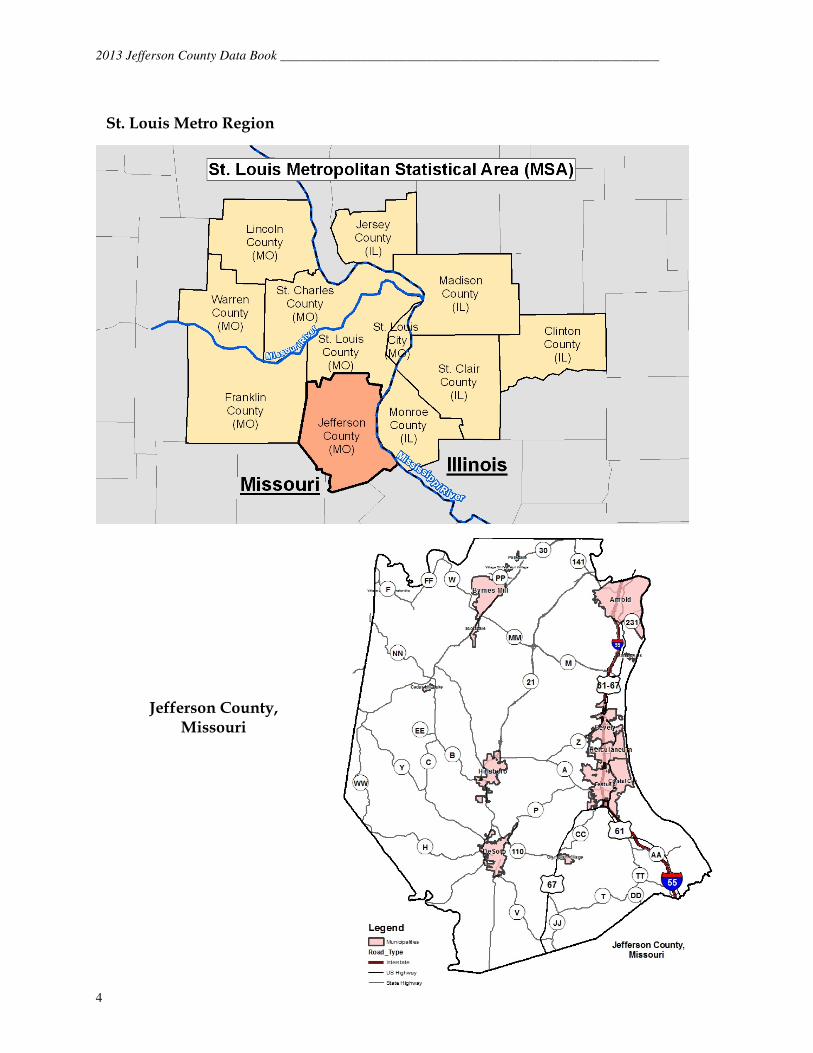
Jefferson County is located in the east central part of the State of Missouri. It is bounded on the north by St. Louis County; east by the Mississippi River, which separates it from Illinois; south by Ste. Genevieve, St. Francois and Washington Counties; and west by Franklin County. It has a land area of 423,000 acres. Jefferson County was officially formed on December 8, 1818 with Herculaneum, then a town of 200 serving as the County seat. The availability of valuable natural resources, including lead and sand for glass-making, combined with the introduction of regular rail service contributed to the rapid growth of the County in the later years of the 19th Century and early part of the 20th Century. The County seat was moved to the present day location of Hillsboro on February 8, 1839. Post-World War II suburbanization has greatly influenced the character of the County, the challenges facing the County and the opportunities offered to residents of the County. In 1950, Jefferson County had a population of 38,000, nearly 9,000 more than St. Charles County and 2,000 more than Franklin County. Jefferson County continued to experience rapid growth throughout the latter part of the 20th Century. The County increased in population by 75% between the period of 1950 and 1960 and by over 420% between the period of 1950 to 2000. The 2000 census, estimated the population of Jefferson County at 198,099. According to the 2007 American Community Survey (ACS), Jefferson County’s estimated population was 216,076, while the 2010 census estimated the population of Jefferson County at 218,733.
2013 Jefferson County Data Book _________________________________________________________
4
St. Louis Metro Region
Jefferson County, Missouri

__________________________________________________________2013 Jefferson County Data Book
5
Above is a map of the Jefferson County Government buildings within Hillsboro, Missouri.

2013 Jefferson County Data Book _________________________________________________________
6
Jefferson County, Missouri
2013 Data Book Physical Characteristics ---------------------------------------------------- Page 7 Archeological and Historical Features ------------------------------- Page 19 Population Characteristics ---------------------------------------------- Page 26 Economic Conditions ----------------------------------------------------- Page 32 Social Indicators ----------------------------------------------------------- Page 38 Housing Characteristics ------------------------------------------------- Page 42 Transportation Characteristics ----------------------------------------- Page 46 Utility Features ------------------------------------------------------------- Page 54 Community Facilities ----------------------------------------------------- Page 63 Local Government -------------------------------------------------------- Page 80

__________________________________________________________2013 Jefferson County Data Book
7
PHYSICAL CHARACTERISTICS
Geologic Features ---------------------------------------------------------------- Page 8 Hydrographic Features --------------------------------------------------------- Page 9 Topographic Features --------------------------------------------------------- Page 11 Mineral Resources ------------------------------------------------------------- Page 13 Agricultural Resources ------------------------------------------------------- Page 13 Air Quality ---------------------------------------------------------------------- Page 17 FIGURES Geologic Map --------------------------------------------------------------------- Page 8 Watershed Map ------------------------------------------------------------------ Page 9 Flood Hazard Area ----------------------------------------------------------- Page 10 Topographic Characteristics ------------------------------------------------- Page 11 Percent of Slope ---------------------------------------------------------------- Page 12 Mineral Resources ------------------------------------------------------------- Page 13
TABLES Jefferson County Farm Size Statistics, 1950-2007 ----------------------- Page 14 Jefferson County Historical Agricultural Statistics, 1900-2007 ------ Page 16

2013 Jefferson County Data Book __________________________________________________________
8
Geologic Features
General The southwestern portion of Jefferson County is dominated by geologic formations as old as 470 million years. The eastern and northeastern portions of the County are much "younger", being only 240 to 260 million years old. This age difference partially explains the difference in the topography between the northern portions and the southern portions of the County. Simply put, the land in the southern part of the County has been exposed to erosion for 200 million years longer than land located in the northern part of the County. The types of soil, natural resources, creeks, vegetation, wildlife, and land uses found in the County are greatly influenced by this significant geologic difference.
Geologic Map
Hazards The geology of the County and the surrounding area has resulted in a number of development risks. Hazards range from earthquakes to landslides. Many of these hazards are associated with the differing geologic formations and their associated soils and landforms. Due to the type of geologic formations, soils, and landforms, many of the significant hazards can primarily be found in the northeastern portion of the County.
Earthquakes
Due to the proximity of the New Madrid fault, all of Jefferson County has some
threat of an earthquake, though the majority is considered to have a low potential. Liquefication and collapse are the main consequences of earthquakes. Liquefication, characteristics certain soils take on during earthquakes that resemble a liquid, threaten the County along its rivers and creeks. The most severe risks can be found along the Mississippi River. Significant public investments including roads, bridges, schools, fire, police, and ambulance stations, as well as private investments such as homes, pipelines, and power transmission lines are at risk. Likewise the loss of life is a real possibility should an earthquake of significant magnitude occur.
__________________________________________________________2013 Jefferson County Data Book
9
Landslides Due to the underlying geology and associated soil types, landslides are a threat throughout the northern one-third of Jefferson County, particularly for north facing slopes that are known to contain shale formations. Improper construction techniques, significant disturbance of unstable slopes, and periods of heavy rains may result in landslides and cause substantial damage.
Erosion and Sediment Build-up Due to the lack of soil in some areas and the physical composition of soils, erosion and sedimentation control can be difficult, but is of considerable importance throughout Jefferson County. Failure to control erosion can result in sedimentation build-up, instability of the underlying geologic formations, and increases in stormwater run-off.
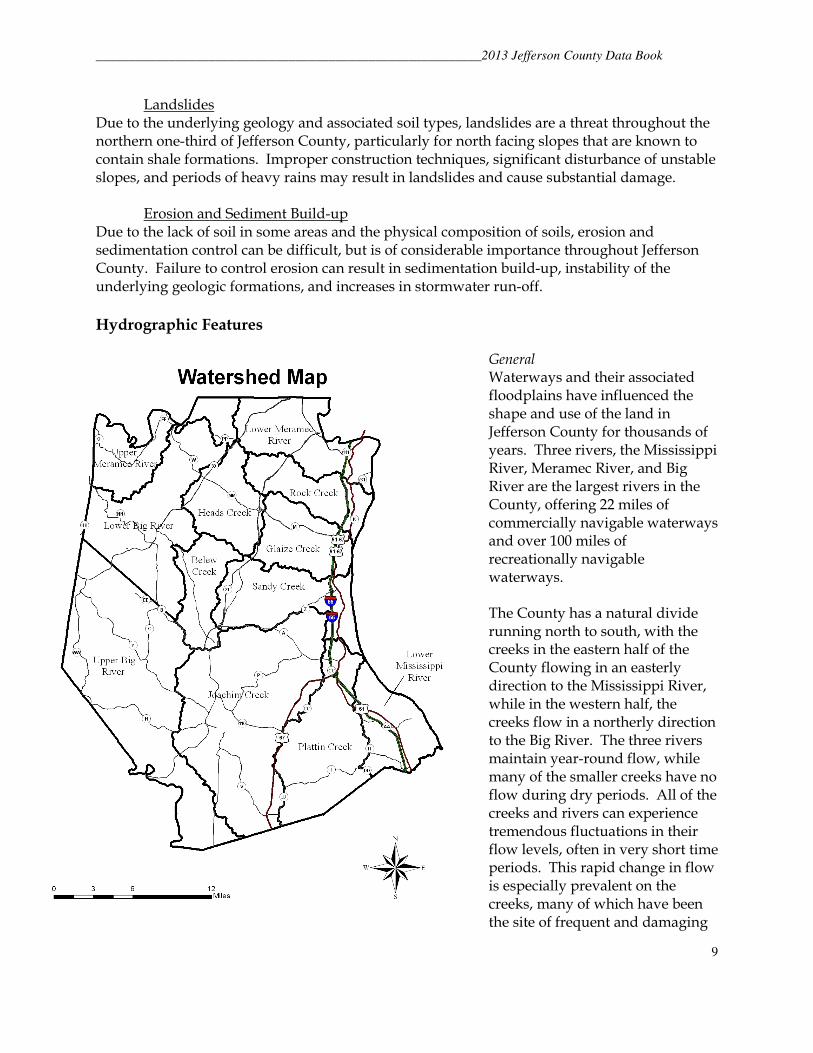
Hydrographic Features
General Waterways and their associated floodplains have influenced the shape and use of the land in Jefferson County for thousands of years. Three rivers, the Mississippi River, Meramec River, and Big River are the largest rivers in the County, offering 22 miles of commercially navigable waterways and over 100 miles of recreationally navigable waterways.
The County has a natural divide running north to south, with the creeks in the eastern half of the County flowing in an easterly direction to the Mississippi River, while in the western half, the creeks flow in a northerly direction to the Big River. The three rivers maintain year-round flow, while many of the smaller creeks have no flow during dry periods. All of the creeks and rivers can experience tremendous fluctuations in their flow levels, often in very short time periods. This rapid change in flow is especially prevalent on the creeks, many of which have been the site of frequent and damaging

2013 Jefferson County Data Book __________________________________________________________
10
flash floods.
In addition to the creeks and rivers, numerous lakes and springs are present throughout Jefferson County. Most of the lakes in the County are man-made, primarily serving as amenities for residential development. The largest of these lakes are Raintree Lake at Raintree Plantation (150 acres), Lake Tishimingo (100 acres), and Lake Wauwanoka (90 acres). All of these lakes are privately owned and maintained.
Constraints and Impacts Floodplain
Over 10% or 50,000 acres of the County is subject to some form of flooding. The largest and most destructive flooding is found along the three major rivers, though lives have been lost and
significant property damage has occurred along many of the smaller creeks and streams. The Flood of 1993 resulted in substantial damage to nearly 600 homes. Over 200 of these homes were purchased by the County through a federally funded buy-out program. The land is being reverted to wetlands, open space, and park land.
Water Pollution In general, the waters of Jefferson County are free of significant pollution. However, most if not all of the rivers, streams, and aquifers contain contaminants in some amount. These contaminants tend to be fecal coliform bacteria that enter the water supply from failed on-site treatment systems, inadequate public treatment of sanitary sewer waste, and livestock waste.
The Missouri Clean Water Commission maintains a list of polluted waters for the State of
Missouri under Section 303(d) of the Federal Clean Water Act. In the 2002 Missouri 303 (d) Listed Waters report, Rock Creek, which is located in the Imperial area of the County, has been identified as a high priority on this list as a result of the presence of concentrations of ammonia and high biological oxygen demand. Saline Creek, which is located northwest of Arnold, has been identified as a medium priority on this list as a result of the presence of concentrations of

__________________________________________________________2013 Jefferson County Data Book
11
ammonia and high biological oxygen demand. The Big River was also identified as a high priority on this list as a result of the presence of lead and mercury. The 2012 EPA Approved 303(d) List had only one Jefferson County waterway. Tiff Creek was added to the 2012 list. The creek is located in the southern most are of Jefferson County. The creek originates from Cole Lake, just east of State Road E and traverses westward along Upper Blackwell Road to the Big River. The 2012 list indicates that the pollutant is Fishes Bioassessments and the source point is unknown.
Topographic Features General The topography of Jefferson County varies considerably throughout its entirety, though it can be safely stated that most of the County has rugged topography. Rugged topography is especially prevalent in the northern half of the County. Features such as narrow ridges and deep ravines are common throughout the northern portion of the County. The southern half of the County is characterized by rolling topography, with wider and flatter crests and shallower valleys.
The highest elevation in Jefferson County is 1,060 feet, near Valles Mines.
The lowest elevation in Jefferson County is 380 feet, at the confluence of Isle Du Dois Creek and the Mississippi River.

2013 Jefferson County Data Book __________________________________________________________
12
As mentioned previously, narrow ridges and deep ravines characterize much of the County. Much of this change in elevation takes place in very short distances. For analysis purposes, the percent of this slope can be categorized into three areas to enable analysis. These three categories are as follow: � Gentle Slopes (0% - 10%) which accounts for 45% of Jefferson County. � Moderate Slopes (10% - 20%) which accounts for 38% of Jefferson County. � Severe Slopes (20% and over) which accounts for 17% of Jefferson County.
Constraints and Impacts The majority of the County consists of gentle slopes, though they tend to be located in the southern two-thirds of the County. Development of land within this category is relatively free of natural constraints and is often the first land sought for development. A sizeable amount of the land with gentle slopes is located within the flood hazard area and is thus limited in its availability for intensive development. The rolling hills of the southern portion of the County and the "foothills" of the more rugged northern portion of the County contain moderate slopes and are more difficult and riskier areas to develop. Portions of the northern one-third of the
County, particularly in the vicinity of Rock Creek, Glaize Creek, Heads Creek, and the Upper Meramec River, contain severe slopes. Site alteration, erosion control, and wastewater treatment are all very difficult and potentially dangerous in these areas.

__________________________________________________________2013 Jefferson County Data Book
13
Mineral Resources General Historically, mineral extraction activities played an integral part in the County's economy. Though these activities have diminished considerably, they still contribute to the County's economy and sense of place. Gravel and Sand By far the most common and profitable mineral extraction present in Jefferson County is the extraction of gravel and sand. Thirteen operating quarries are located in Jefferson County, including several rock crushing plants, cement plants, and asphaltic cement plants.
Though its contribution to the local economy is significantly less than in the past, the presence of very high quality silica sand throughout the County represents a significant mineral resource. A band of this sand runs diagonal across the center of the County roughly from Pacific to Danby. One mine operated by Unimin Corporation, southwest of Pevely, remains operational. Lead Lead deposits can be found in the extreme southern portion of the County. Once part of the very active lead belt of Missouri, limited mining activities are currently conducted in these areas. The Doe Run Lead Company's lead smelter reclamation facility in Herculaneum remains a significant asset in the County.
Agricultural Resources General Agricultural activities in Jefferson County have historically been an integral part of the County. As with mineral resources, the significance of these activities has diminished considerably, but they still contribute to the County's economy and sense of place.
2013 Jefferson County Data Book __________________________________________________________
14
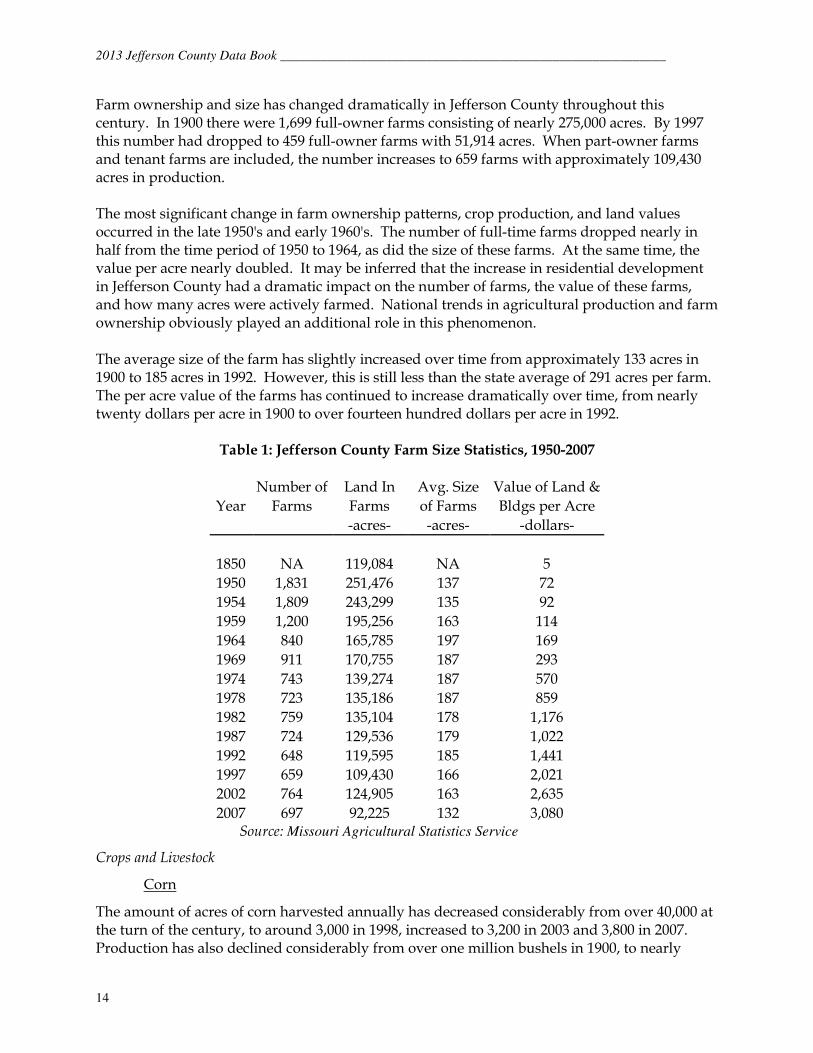
Farm ownership and size has changed dramatically in Jefferson County throughout this century. In 1900 there were 1,699 full-owner farms consisting of nearly 275,000 acres. By 1997 this number had dropped to 459 full-owner farms with 51,914 acres. When part-owner farms and tenant farms are included, the number increases to 659 farms with approximately 109,430 acres in production. The most significant change in farm ownership patterns, crop production, and land values occurred in the late 1950's and early 1960's. The number of full-time farms dropped nearly in half from the time period of 1950 to 1964, as did the size of these farms. At the same time, the value per acre nearly doubled. It may be inferred that the increase in residential development in Jefferson County had a dramatic impact on the number of farms, the value of these farms, and how many acres were actively farmed. National trends in agricultural production and farm ownership obviously played an additional role in this phenomenon. The average size of the farm has slightly increased over time from approximately 133 acres in 1900 to 185 acres in 1992. However, this is still less than the state average of 291 acres per farm. The per acre value of the farms has continued to increase dramatically over time, from nearly twenty dollars per acre in 1900 to over fourteen hundred dollars per acre in 1992.
Table 1: Jefferson County Farm Size Statistics, 1950-2007
Number of Land In Avg. Size Value of Land &
Year Farms Farms of Farms Bldgs per Acre
-acres- -acres- -dollars-
1850 NA 119,084 NA 5
1950 1,831 251,476 137 72
1954 1,809 243,299 135 92
1959 1,200 195,256 163 114
1964 840 165,785 197 169
1969 911 170,755 187 293
1974 743 139,274 187 570
1978 723 135,186 187 859
1982 759 135,104 178 1,176
1987 724 129,536 179 1,022
1992 648 119,595 185 1,441
1997 659 109,430 166 2,021
2002 764 124,905 163 2,635
2007 697 92,225 132 3,080 Source: Missouri Agricultural Statistics Service
Crops and Livestock
Corn
The amount of acres of corn harvested annually has decreased considerably from over 40,000 at the turn of the century, to around 3,000 in 1998, increased to 3,200 in 2003 and 3,800 in 2007. Production has also declined considerably from over one million bushels in 1900, to nearly

__________________________________________________________2013 Jefferson County Data Book
15
243,000 bushels in 1998. Production has increased to 302,000 bushels in 2003 and 419,000 in 2007. The amount of land used for corn production declined sharply beginning in the late 1950's and early 1970's corresponding with a dramatic increase in the population of the County. The amount of acres of corn harvested was 25,200 in 1950, but 4,000 in 1970, 3,600 in 2003 and 3,800 acres in 2007. The amount of bushels of corn yielded per acre has risen considerably over time from only 30 bushels per acre in 1900, to 81 in 1998, to 94 in 2003. In 2007 the yield per acre increased to 100 bushels per acre.
Soybeans
The amount of acres of soybeans harvested annually has remained fairly stable over time, with a low point of 1,400 acres in 1950 and a high of 8,300 acres in 1985. Land dedicated to the harvest of soybeans declined in 1998, with 5,100 acres harvested, in 2003, 6,900 acres were harvested. 2007 again declined slightly from the 2003 numbers with 5,700 acres harvested. Production has increased dramatically over time from 21,300 bushels in 1950, to 182,000 in 1998, to 218,000 in 2003, but declined to 152,000 bushels in 2007. However, it should be noted that this production has been declining in recent years, down from 252,000 bushels in 1985. The amount of bushels of soybean yielded per acre has risen over time, though not nearly as dramatic as that of corn. The yield has gone from 15.2 bushels per acre in 1950, to 35.7 bushels in 1998, to 31.6 bushels in 2003, but declined to 27 bushels per acre in 2007.
Wheat
The amount of acres planted in wheat has dropped dramatically over the years, as has the production of wheat. The decline has been from a total of 30,000 acres at the start of the 20th century, to 2,100 acres in 1998. Only 800 acres were harvested for wheat in 2007. Production has declined from 400,000 bushels at the start of the 20th century, to 75,200 bushels in 1998, to 63,000 bushels in 2003 and only 32,000 bushels in 2007. As with corn production, the 1950's and 1960's began a dramatic decrease in the amount of acreage dedicated to wheat production. The yield per acre has steadily increased over the years from 12 bushels per acre at the start of the 20th century, to 35.8 bushels in 1998, to 48.5 bushels in 2003, with a slight decline in 2007 to 40 bushels per acre.
Hay
Both the amounts of acres used for hay production and the actual amount of production have remained steady for nearly a century. A total of 19,644 acres were planted in hay at the start of the 20th century with a production of 21,000 tons. In 1998, 19,900 acres were planted and production was 35,900 tons. In 2007, 25,000 acres were harvested and the production of hay was 37,000 tons. Likewise, the yield per acre has held fairly stable, approximately 1.3 tons per acre at the start of the 20th century, 1.80 tons per acre in 1998, and 1.48 tons in 2007.
Livestock
The total number of cattle has held fairly stable throughout the 20th century, though the makeup of the herd has varied considerably. At the start of the 20th century, there were approximately 20,000 head of cattle, with nearly 9,000 milk cows. In 1999, the total herd was nearly 14,400,

2013 Jefferson County Data Book __________________________________________________________
16
with approximately 1,000 milk cows. In 2003, the total herd was 13,500 with approximately 800 milk cows. The number of hogs and pigs has declined considerably through the century. Nearly 30,000 hogs and pigs were being raised at the start of the 20th century, while only 1,000 were present in 1999, and 700 were present in 2003. As with corn and wheat production, the 1950's and 1970's were the time period of significant change in the number of hogs and pigs raised, from over 20,000 in 1950 to approximately 10,100 by 1970. There has not been any data collected on the number of hogs and pigs by the National Agricultural Statistic Service since 2003.
Cows
Jefferson County ranked 41 within the 114 counties throughout the State in the production of milk cows from 1998 to 1999, while it ranked 100 in the production of beef cows. In 1980, the County had 8,400 beef cows, 1,500 milk cows, and 8,100 hogs on farms. The number of head of all three livestock has declined at least 25% over the past 20 years. In 1999, there were 6,300 beef cows and 1,000 milk cows on farms in Jefferson County. In 2003, there were 6,000 beef cows and 800 milk cows on farms in Jefferson County. The number of beef cows remained at 6,000 in 2007, while the number of milk cows increased to 850 head.
Year 1900 1950 1970 1990 1998 2003 2007 Number of Farms
2,596 1,831 911* 648** 659*** 764 697
Corn Production (bushels)
1.2 Million 1.0 Million 172,100 133,000 243,000 302,000 419,000
Soybean Production (bushels)
NA 21,300 72,000 90,400 182,000 218,000 152,000
Wheat Production (bushels)
363,700# 216,600 129,500 100,000 75,200 63,000 32,000
Hay Production (tons)
20,588# 31,200 33,400 43,900 35,900 50,000 37,000
Livestock (Hogs & Pigs)
23,694 21,000 10,100 2,900 1,100 700 N/A
Livestock (Cattle)
20,977 18,400 17,800 14,900 14,400 13,500 12,180
Source: National Agricultural Statistics Service – Missouri Field Office University of Missouri Outreach and Extension
* (1969) ** (1992) *** (1997) # (1899)
Table 2: Jefferson County Historical Agricultural Statistics, 1900 - 2007

__________________________________________________________2013 Jefferson County Data Book
17
Air Quality General Jefferson County's air quality is greatly affected by that of the St. Louis region and other areas of the Midwest. Likewise, land uses and local weather patterns in Jefferson County contribute to the quality of the metropolitan area's air. Beginning in 1993, the St. Louis Metropolitan area was classified by the U.S. Environmental Protection Agency as "non-attainment" for air quality. The entire eight-county region is placed within this classification. The region has been placed in this classification due to the high presence of hydrocarbons and nitrogen oxides [Volatile Organic Compounds (VOC)], substances known to lead to the formation of ozone and carbon monoxide. The following emissions are produced by vehicles traveling in the St. Louis Metropolitan area:
� Autos 69 tons of VOC per day � Light Trucks 34 tons of VOC per day � Heavy Trucks 14 tons of VOC per day � Motorcycles 2 tons of VOC per day � Heavy Duty Diesel 5 tons of VOC per day
Constraints and Impacts
Transportation investments and land uses can be greatly impacted in areas classified as non-attainment. The State of Missouri has prepared a State Implementation Plan (SIP) for air quality that outlines the maximum amount of hydrocarbons permitted to be emitted in any given year. Transportation investments receiving federal funding and some land uses must be shown that they will not contribute to exceeding this limit. Nitrogen oxide emissions must remain below the 1990 benchmark. There are 22 active air quality-monitoring stations in the St. Louis Metropolitan Region. Jefferson County has 10 of the active monitoring stations, nine around the Herculaneum area and one facility is located in the Arnold area. The nine stations in the Herculaneum area monitor the Lead (Pb) and Sulfur Dioxide (SO2), while the Arnold location monitors Ozone (O3) and Inhalable Particulate (PM2.5). From 2005 through 2008, the Arnold facility has had 12 days in which the Ozone (O3) measurement exceeded the acceptable maximum measurement of 0.8 parts per million, compared to 15 days at the Sunset Hill location, 24 days at the Maryland Heights location, and 17 days in the St. Louis City location. The St. Louis area has regularly exceeded the established air quality standards and stands on the verge of being moved into a serious non-attainment category, a classification shared by other metro areas such as Washington, D.C., Atlanta, and San Diego. A "bump-up" to the serious non-attainment category could result in serious constraints to transportation investments and specific land uses. These constraints include:
� Higher annual required reduction of VOC � Control of land uses emitting a specific level of VOC � Mandatory enhanced vehicle inspection and maintenance program
2013 Jefferson County Data Book __________________________________________________________
18
� Higher annual required reduction of emissions � Required phase-in of alternative fuels for auto fleets � Additional air quality monitors � Additional traffic control measure implementation � Required "off-set" of emission reduction for new or added sources
The Missouri Department of Natural Resources (DNR) which oversees the development of the SIP, has suggested the following steps to ensure compliance with the Clean Air Act and to ensure that a "bump-up" not occur:
� Implement enhanced inspection and maintenance program � Introduce reformulated gasoline � Enhance the reduced vapor pressure gasoline program � Implement transportation control measures � Improve petroleum storage/transfer practices � Closing of obsolete plants � Improve the application procedures for architectural coatings � Continue implementation of open burning bans during specific periods � Reduce the emission of landfill gases
The DNR program hinges significantly on the implementation of both an enhanced inspection and maintenance program and a reformulated gasoline program (approximately 56% of total expected reduction in VOC emissions). The Missouri State Legislature delayed authorization of both of these programs in 1998. While St. Louis struggles with achieving compliance of current federal standards, the U.S Congress has directed the Environmental Protection Agency to begin implementation of additional, more stringent air quality standards. Existing and future regulations have the potential to significantly impact transportation funding and land use decisions within all of the St. Louis Metropolitan area, and demand local, regional, and state action. However, in 2009, the metro area saw a reduction in nearly 55 tons of VOC per day reduction in automotive emissions. The report indicates the reduction in VOC emission is a testament to the combined state and federal regulations with regard to the quality of air in the metro region. The report can be found at: http://www.dnr.mo.gov/env/apcp/airadvisory/stlaqmpfinal2-23-10.pdf

_________________________________________________________ 2013 Jefferson County Data Book
19
ARCHEOLOGICAL AND HISTORICAL FEATURES Archeological Resources ---------------------------------------------------------------- Page 20 Historical Resources --------------------------------------------------------------------- Page 21
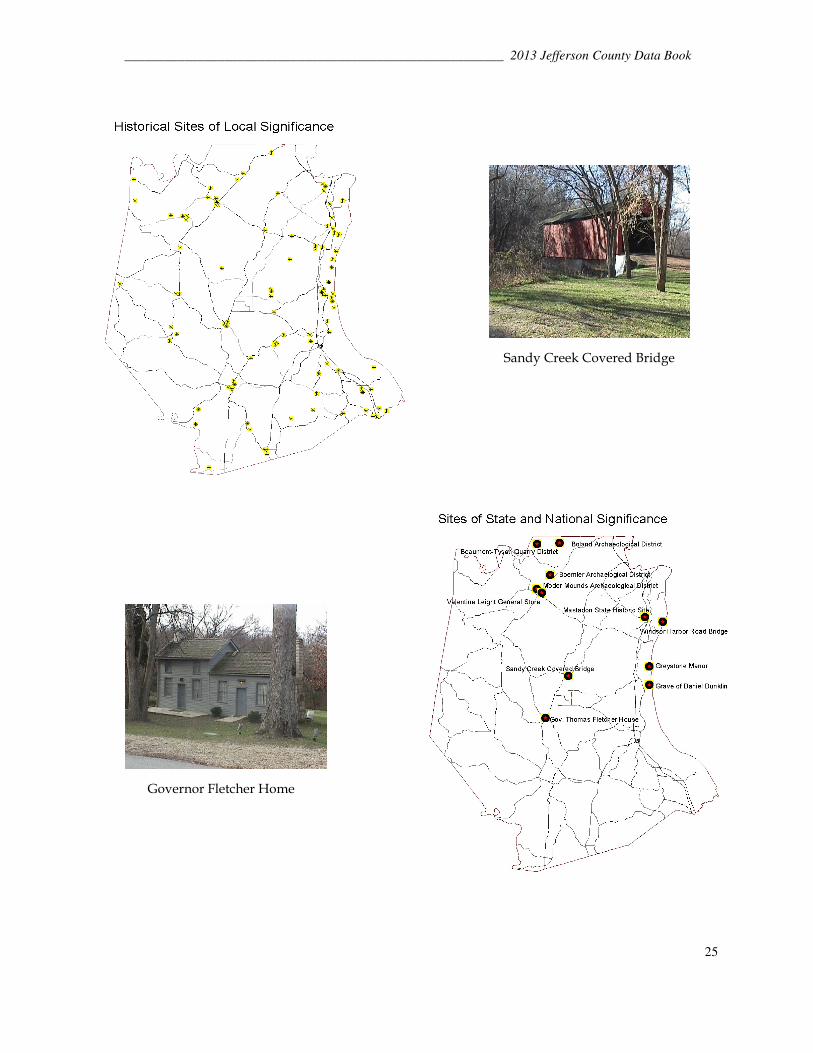
FIGURES Historical Sites of Local Significance ------------------------------------------------- Page 25 Historical Sites of State and National Significance-------------------------------- Page 25

2013 Jefferson County Data Book __________________________________________________________
20
Archeological Resources Paleo-Indian and Dalton Periods Due to the presence of significant waterways (Mississippi River, Meramec River, and Big River) and the proximity of major population centers (Cahokia), Jefferson County has long been the site of human occupation. Some of the earliest evidence of human occupation is found at Kimmswick and the Mastodon State Historic Site. Hunting and butchering tools along with fluted Clovis points were found in these areas in direct association with extinct Pleistocene animals including mastodons and giant bison. Though these sites are significant, little is known about the Paleo-Indian/Dalton settlements that may have existed in the County in the vicinity of the Meramec and Mississippi Rivers. Archaic Periods At least two sites of significance exist for this period in Jefferson County. These areas are the Bonacker and Hidden Valley shelters; both located in the south-central portion of Jefferson County. Weapons, tools, and other settlement materials have been found at both sites. Again, little is known about the settlements that existed in Jefferson County during this period. Woodland Periods
Early Woodland
Sites representing the middle and late woodland period have been found in Jefferson County. It is presumed that there existed continual occupation of Jefferson County from the Archaic period into the woodland period, but little is known about either the late Archaic period or the early Woodland period. Middle & Late Woodland The most significant site for the Middle Woodland period is in the Festus area, with a possible additional site along the Big River. Late woodland sites have included tools, weapons, and pottery. Occupation features have included rock shelters and burial mounds. Mississippian Periods All phases of the Mississippian culture are found in Jefferson County with sites found along the Big River, Plattin Creek, and Mississippi River. Settlement evidence includes farming activities, mud houses, temple mounds, and stone-box grave cemeteries. Agricultural activities were significant and tended to be located on the bottomland along the major river drainages. Numerous examples of petrographs and pictographs from this time period are found throughout the County.

_________________________________________________________ 2013 Jefferson County Data Book
21
Historical Resources Historic Indians Numerous Indian settlements were located throughout Jefferson County, though they tended to be concentrated along the major waterways, including the Mississippi River, Meramec River, and Big River. The most common tribe was the Osage, especially along the Big River. Other tribes include the Missouri and Illinois, who tended to settle along the Mississippi near the mouth of the Meramec River. European Settlement The French were the first to arrive in Jefferson County, though they built no significant settlements. They settled instead in St. Genevieve County, Washington County, and St. Louis County. The lands were turned over to the Spanish in 1763, and Spanish continued to occupy the area until its acquisition by the United States through the Louisiana Purchase. The earliest settlers began arriving in the County while it was still under Spanish control. John Hildebrand, who settled along the Saline Creek in 1774, is recognized as the first European settler in the County. The first town in the County was laid out in 1806 and was known as New Hartford. It was located along the Mississippi River near present-day Herculaneum. In 1808, Moses Austin and Samuel Hammond laid out the town of Herculaneum to serve the newly established lead mining activities in Washington and St. Francois counties. On December 8, 1818, Jefferson County was formed, with Herculaneum serving as the County seat. The seat was moved in 1838 to its present day location in Hillsboro. In 1857, the Iron Mountain Railroad introduced rail service to Jefferson County. In 1868 Pittsburgh Plate Glass was formed. The St. Joseph Lead Company began operations in the 1890's. The rail lines and new industries contributed significantly to the early growth and development of the County. Following World War II, Jefferson County experienced tremendous suburban style growth. This national trend was largely fueled through federal activities that included federally backed loans, interstate construction, and grants providing public drinking water. Most of this new growth occurred near the St. Louis County line along the major transportation networks, which included Highway 30, Highway 141, Highway 61-67, and Interstate 55. This trend has persisted and expanded to this day. Settlements
Maxville
Maxville was located near present-day Highway 141 and Old Lemay Ferry Road. Most of the area is currently a part of the City of Arnold. The Maxville post office was established in 1873, and Maxville was incorporated in 1874. The area once included a sizeable nineteenth century commercial district that was mostly destroyed by fire in the 1970's. Notable sites and structures in the area include the Immaculate Conception Church (1895) and the Stone House (1840).
Imperial The Imperial area was founded by E.J. White, and was originally known as "West Kimmswick". The town was laid out in 1905 with a rail line running roughly through the middle of the town. The area became
2013 Jefferson County Data Book __________________________________________________________
22
known as Imperial following the establishment of the Imperial Clock Works in 1918. Notable sites and structures include the commercial structures along Imperial Main Street.
Kimmswick The area around the present day city of Kimmswick included numerous mineral and salt springs that were frequented by Indians and later French and Spanish travelers. The area became known as Montesano Springs and was used as a resort during the late nineteenth and early twentieth centuries. Theodore Kimm laid out the town of Kimmswick in 1859. It was served first by steamboats on the Mississippi River and later by rail service on the Iron Mountain Railroad. Notable sites and structures include the El Camino Real (The King's Road), St. Joseph Catholic Church (1927), Wenom-Drake House (1877), Maul House (1865), Burgess-How House (1840), Barbagallo House (1850), Old House (18th Century), Windsor Harbor Bridge (1874), and the Hermann House (1859)
De Soto The area that became the city of De Soto was first settled in 1803 by Isaac Van Metre. The town was laid out in 1857 by Thomas Fletcher and Louis Rankin. The City was incorporated in 1869, and un-incorporated in 1872 to enable the Missouri Pacific Railroad to construct their main machine shops outside of the city limits. The City was re-incorporated shortly thereafter excluding the area where the shops were located. Notable sites and structures include the Auerswald House (1880), Trinity Episcopal Church (1871), Saint Rose of Lima Church (1885), Pearl Cottage (1832), Central School (1899), many fine homes, and numerous storefronts along a nearly two mile long main street.
Hematite Hematite is a settlement laid out along the Missouri Pacific Railroad (previously the Iron Mountain Railroad), and primarily served as a shipping point for farm products raised on surrounding farms. Notable sites and structures include the Hematite Christian Cemetery, Hematite Stone Barn (1855), Perkins Place (1883), Hematite Methodist Church (1863), and the Donnell House (1867).
Victoria Victoria is a settlement laid out along the Missouri Pacific Railroad, and primarily served as a shipping point for farm products raised on surrounding farms. Notable sites and structures include the Victoria Methodist Church (1853) and the Victoria Rail Station (circa 1900).
Crystal City Crystal City is a settlement located on the El Camino Real, south of Herculaneum. It started as a company town, housing the employees of the American Plate Glass Company, which started production in 1872. In 1895, the Pittsburgh Plate Glass Company purchased the property and continues to own the land to this day, though the plant has ceased production. Crystal City remained a company town until 1912, when it was incorporated as the City of Crystal City. Notable sites and structures include the Jewett House (1856), Grace Presbyterian Church (1891), the PPG Plant site, and many fine homes.

_________________________________________________________ 2013 Jefferson County Data Book
23
Festus
Festus is considered the sister city to Crystal City. The town was settled shortly after the establishment of Crystal City and served as a commerce center for Crystal City. Festus was incorporated in 1888. Notable sites include numerous storefronts along Main Street and Gamel Cemetery.
Selma Selma is a small settlement located a few miles south of Festus, near the Mississippi River. A post office was established in 1827, with Luther Kennett serving as the postmaster. Kennett later served as the Mayor of St. Louis. Notable sites and structures include the Canepa House (1883) and Kennett's Castle or Selma Hall (1854).
Valles Mines Valles Mines is a small settlement built around the mining activities common in the area during the late 1800's. Notable sites and structures include the Rozier House (1839), Miners Cabin (1840), Foreman House (1870), and the General Store (1885).
Sulphur Springs The town of Sulphur Springs was laid out in 1860 by James Burgess and is located along the Mississippi River. The town served as the County's first mail stop, receiving mail delivered by steamboat. The town once had a large hotel and several resort buildings serving St. Louis residents who visited because of the presence of springs in the area.
Bushberg The town of Bushberg was laid out along the Mississippi River, south of Sulphur Springs and served primarily as a shipping point. At the turn of the century, produce and wine made from grapes grown in the surrounding area were shipped via steamboat to St. Louis. Notable sites and structures include the Meissner House (1875), Greystone Manor (1845) and the Obermiller House (1815).
Pevely The town of Pevely was originally laid out along the El Camino Real in the 1860's by Judge Rankin. Pevely was once the country's largest shipping point for milk and butter produced from the cows raised on the surrounding farms. Notable sites and structures include the Rankin Home (1870), Lilly Ellis Home (1867), and Landmark Estate (1863).
Herculaneum The town of Herculaneum was laid out in 1808 by Moses Austin and served as the first County seat. The town originally served as a shipping point for lead smelted in nearby communities. The St. Joseph Lead Company operated a large smelter in Herculaneum, a site now operated by the Doe Run Lead Company. The town was the site of the first Protestant services held west of the Mississippi in 1798. Notable sites and structures include the grave of Governor Dunklin and the Doe Run Lead Company operations.
Hillsboro

2013 Jefferson County Data Book __________________________________________________________
24
The town of Hillsboro may have been settled as early as 1804, but was not incorporated until 1839. Originally named Monticello (French for Hillsborough), Hillsboro today serves as the County seat. Notable sites and structures include the McMullin House (1878), Fletcher House (1851), Masonic Hall (1894), and Thomas Home (1858).
Byrnesville The area of Byrnesville, located along the Big River, is one of the oldest commercial settlements in the County. Notable sites and structures include the Byrnesville Hotel Site (1870), Byrnesville Mill (1870), and the Bonnacker Mill Site (1890).
House Springs
The settlement of House Springs is one of the oldest in Jefferson County. Originally known as Demaree, it is located along Heads Creek near Highway 30. The area was originally settled in 1795 by James Head. Notable sites and structures include the site of the House Massacre, House Springs General Store (1870), site of St. Philomena Church and Cemetery, Votaw Saloon (circa 1840), and Weber Home (1850). Significance of Sites and Structures Many structures are remnants of the rich history of Jefferson County and today contribute significantly to the character or sense of place of specific areas. Farm houses, barns, churches, and schools are but a few examples. A few sites and structures stand out as having state and/or national significance. These range from archeological sites to a covered bridge. Some of the sites are in public ownership, while most remain privately held. These sites include the following:
� Grave of Governor Daniel Dunklin - Herculaneum � Fletcher House - Hillsboro � Sandy Creek Covered Bridge -Hillsboro � Moder Mounds - House Springs � Mastodon State Historic Site - Imperial � Greystone Manor - Pevely � Valentine General Store - House Springs � Windsor Harbor Bridge - Kimmswick � Boemler Archeological District - Byrnes Mill Area � Beaumont-Tyson Quarry District - Times Beach Area � Boland Archeological District - Times Beach Area
While most of the structures and sites in Jefferson County hold little, if any, state or national significance, they may be very significant to the local character or sense of place. De Soto Main Street, Sandy Valley Baptist Church, and numerous vernacular farmhouses and outbuildings are but a few examples.
_________________________________________________________ 2013 Jefferson County Data Book
25
Governor Fletcher Home
Sandy Creek Covered Bridge
2013 Jefferson County Data Book _________________________________________________________
26
POPULATION CHARACTERISTICS
Population Characteristics -------------------------------------------------------------- Page 27
FIGURES 2010 Age Distribution for Jefferson County, Missouri --------------------------- Page 29 Jefferson County Population Estimates and Projections, 2000 to 2030 -------------------------------------------------------------------------------- Page 30 Missouri’s Top Ten Projected Numeric Increase by 2030 ----------------------- Page 30 Missouri’s Top Ten Projected Populations 2030 ----------------------------------- Page 31
TABLES
Population Growth Components for Jefferson County: 2010-2011 ----------- Page 27 Population for Jefferson County and the St. Louis Region, 1980 to 2010 -------------------------------------------------------------------------------- Page 27 Distribution of Gender, Race, and Ethnicity of Jefferson County Residents, 2010 -------------------------------------------------- Page 28 Age Distribution of Jefferson County Residents, 2010 --------------------------- Page 28 Population Projections for Jefferson County and the St. Louis Region, 2000 to 2030 ----------------------------------------------- Page 30 Geographic Mobility of Residence of Jefferson County Residents ------------ Page 31

_________________________________________________________ 2013 Jefferson County Data Book
27
Population Characteristics General This chapter of the Data Book presents an evaluation of demographic trends for Jefferson County. For comparison purposes, information is also provided for the St. Louis Region, which is linked, to Jefferson County through growth trends, regional economy, natural environment, and cultural heritage. For clarification and simplicity, St. Louis Region (or Region) will refer to the 2000 St. Louis Metropolitan Statistical Area (MSA) as defined by the U.S. Census Bureau, unless otherwise noted. The MSA is comprised of Jefferson, Franklin, St. Charles, St. Louis, St. Clair, Madison and Monroe Counties, and the City of St. Louis. In 2003, the U. S. Census Bureau added Washington County, Missouri, and Calhoun, Macoupin, and Bond Counties in Illinois. Where available through the U.S. Bureau of the Census, Claritas, Inc., or other government agencies, the most recent data on demographic trends is provided. The population of Jefferson County in 2000 was 198,099. In 2007, the population was estimated at 216,076. This represented an increase of 17,977 (9.1%) people from 2000. The 2010 U.S. Census found Jefferson County’s population increase to 218,733. The statistics represented an increase of 2,657 (1.2%) from the 2007 estimates and a 20,634 (10.4%) increase over the previous Census in 2000. Between 1990 and 2000, more than half of the population growth was due to the net migration (balance of persons moving into and out of the county). The county experienced a positive net migration of 13,571. Natural increase (balance of births and deaths) just accounted for 49% of this growth, totaling 13,150. Census data has changed since 2000 and there has been limited data collected county wide, however the ACS recently released information on changes from the 2010 Census and the 2011 survey (Table 1). There has been an interesting trend much different than in 2000, in which the county has lost population because of people leaving the county. Table 1: Population Growth Components for Jefferson County
� 2010-2011 population increase = 424 � 2010-2011 natural increase = 947 � 2010-2011 net migration = (– 520) � 2010-2011 deaths = 1,786 � 2010-2011 births = 2,733 (Source: U.S. Census – July 1, 2010 to July 1, 2011)
Table 2: Population for Jefferson County and the St. Louis Region, 1980 to 2010
Area1980 1990 2000 2010
% Chg 1980-
2010
% Chg 2000-
2010
Jefferson County 146,183 171,380 198,099 218,733 49.6% 10.4%
St. Louis MSA 2,503,549 2,580,897 2,698,687 2,812,896 12.3% 4.2%
Sou rce: US Census Bu reau

2013 Jefferson County Data Book _________________________________________________________
28
Gender and Race Composition Jefferson County’s population and that of surrounding counties are predominantly white. The
Hispanic population increase by over a half of a percent from 2000 (1.0% of the population) to 1.6% of the population in 2010. Minorities
account for fewer than 4% of the total population in Jefferson County, a trend that has continued in Jefferson County from the 2000 Census. The minority population for the St. Louis Metropolitan Statistical Area in 2010 consisted of 23.5%, a full 20% higher rate than Jefferson County. The county is nearly evenly split between males (49.8%) and females (50.2%). The St. Louis Metropolitan Statistical Area has a slightly larger split between genders, with males consisting of 48.4% and females consisting of 51.6% of the population.
Age More than 25% of Jefferson County’s population is under the age of nineteen, while 11.1% of the population is aged sixty-five and older. The age group between 20 to 44 years comprises 32.4% of the population, down from 37.6% in 2000. The remaining population (28.7%) range in age from 45 to 64
years old, which has increased 6.2% since 2000. The median age of the County is 37.8 years, an increase of 7.1 years compared to 1990’s median age of 30.7. The median age of Jefferson County is slightly higher than the median age of St. Charles County, 37.1 years, and is younger than St. Louis County median age of 40.0 years and the regional median age of 38.2 years.
Table 3: Distribution of Gender, Race and Ethnicity of Jefferson County Residents, 2010
Table 4: Age Distribution of Jefferson County Residents, 2010
Number Percentage
Age Younger than age 19 60,699 27.7 Aged 20 to 44 71,027 32.4 Aged 45 to 64 62,613 28.7 Aged 65 and older 24,394 11.1
Median Age 37.8 Source: U.S. Census Bureau
Total Population 218,733 100.0%
Race
White 211,007 96.5%African-American 1,798 0.8%
American Indian 677 0.3%Asian 1,417 0.6%
Pacific Islander 49 0.0%Other 836 0.4%
Two or more races 2,949 1.3%
Ethnic Group
Hispanic 3,408 1.6%Not Hispanic 215,325 98.4%
Source: US Census Bureau

_________________________________________________________ 2013 Jefferson County Data Book
29
This figure shows a detailed age distribution chart for Jefferson County in 2010. Forty-three percent of the population falls between the ages of 25 – 54. This indicates that Jefferson County continues to have a younger population, but the population is ageing. Therefore, specific community services should be tasked with assisting the young professional and the aging population. Figure 1: Age Distribution for Jefferson County, Missouri; 2010
Source: U. S Census 2010
Projections Periodically, the East West Gateway Coordinating Council (EWGCC), the St. Louis Region’s Metropolitan Planning Organization, will calculate population projections for the counties within the St. Louis region. The projections are calculated utilizing the Survival-Cohort method, which projects historical trends on births, deaths, and migration. Based on these calculations, Jefferson County is projected to grow by 45,067 people between the year 2010 and 2030. This represents a 20.6% increase over the next 20 years, compared to only a 0.50% for St. Louis County.
1.07%
7.07%06.9%6.85% 6.95%
5.7%
12.96%13.8%
16.47%
6.71%
5.46%
6.78%
3.31%
0
5,000
10,000
15,000
20,000
25,000
30,000
35,000
40,000
Und
er 5
Yea
rs
5-9
Yea
rs
10-
14 Y
ears
15-
19 Y
ears
20-
24 Y
ears
25-
34 Y
ears
35-
44 Y
ears
45-
54 Y
ears
55-
59 Y
ears
60-
64 Y
ears
65-
74 Y
ears
75-
84 Y
ears
85
Yea
rs a
nd
Old
er

2013 Jefferson County Data Book _________________________________________________________
30
Figure 3: Growth Estimates, Missouri
Table 5: Population Projections for Jefferson County and the St. Louis Region 2000 to 2030
Jurisdiction 2000 2010 2015 2020 2025 2030
% change
from 2000 to
2030
St. Louis 1,016,315 1,021,800 1,020,900 1,016,200 1,008,700 1,004,200 -1.19
St. Charles 283,883 344,700 364,800 385,000 397,200 408,000 45.72
St. Louis City
348,189 310,000 314,500 317,400 323,100 327,400 -5.97
Madison 258,941 271,500 278,600 285,900 293,100 300,300 15.97
St. Clair 256,082 265,800 270,600 274,300 279,600 284,100 10.94
Jefferson 198,099 224,700 233,600 245,400 255,500 263,800 33.17
Franklin 93,807 106,900 116,800 125,500 135,000 144,400 53.93
Monroe 27,619 32,400 34,200 35,500 36,900 38,300 38.67
Total 2,482,935 2,577,800 2,634,000 2,685,200 2,729,100 2,770,500 11.58
Source: East West Gateway Coordinating Council and Claritas, Inc.
Figure 2: Growth Estimates Jefferson County, Missouri
The Missouri Office of Administration, Division of Budget and Planning, also calculates population projections for the County. Using the Survival-Cohort method as well, the State calculates three separate projections based on differing assumptions of migration. The first projection, Projection “L” (“long-term” trend) carries the 1980 to 1992 net migration patterns into the
future. The second, Projection “R” (“recent” trend), carries 1987 to 1992 net migration patterns forward.
A third, Projection “Z” (“zero” migration), illustrates the future county population base on solely natural growth (births and deaths being the only agents of population change). Each projection incorporates the same moderate assumptions about future fertility and mortality. The State projections are provided to illustrate different possible scenarios of the population growth in the County. The East West Gateway projections are perhaps the most significant, however, because transportation funding for the County (and the Region) is based on those projections. As the chart above shows, Projection “L” is similar to the East West Gateway Projections.
Jefferson County Population Estimates and Projections, 1990 to 2020
150000
175000
200000
225000
250000
275000
1990 1991 1992 1993 1994 1995 1996 1997 1998 2000 2005 2010 2015 2020
Years
People
Actual (EWGCC estimates) MSCDC (L) MSCDC (R) MSCDC (Z) EWGCC

_________________________________________________________ 2013 Jefferson County Data Book
31
The estimates are shown to provide some comparison between what has occurred over the last eight years with what is expected. As the Data Book is updated and newer estimates become available, it is possible to compare actual population to the projections. As the chart above shows, Jefferson County’s population was overestimated for 2010 by nearly 6,000. However, the St. Louis area was underestimated at 2,577,800 for 2010. The metro area was estimated at 2,812,896, however the East-West Gateway calculations in Table 5 do not include Lincoln County and Warren County in Missouri and portions of Jersey County and Clinton County in Illinois. The estimated population from those counties omitted was 146,463. Thus the full metro area 2010 could be estimated at 2,724,263, nearly 90,000 people difference. From the 1970 to 2010 census, Jefferson County has continued to increase its share of the regional population, and it is expected that this trend will continue through the year 2030. It should be noted that while Jefferson County is expected to continue to increase its share of the regional population, from the 2010 census through the 2030 projection, the County ranks sixth in the region in total population, ahead of only Franklin and Monroe Counties, omitting Lincoln County, Warren County, portions of Jersey County and Clinton County. Migration Patterns According to information provided by the East-West Gateway Coordinating Council through the U.S. Census Bureau, about 66% of Jefferson County’s in-migration is from other counties in the St. Louis Region. St. Louis County provides over one-third of the in-migrating population, while St. Louis City contributed 20%. The remaining counties from the St. Louis Region contributed 8.6% in total. The 2011 American Community Survey has estimated that between 2010 and 2011 there has been population growth, but the growth has come from a higher rate birth over death and not from an influx of new residences. However, there has not been data collected or released that provides a detailed update to where the county’s decrease in population has migrated to. Of those Jefferson County residents, just over half lived in the same house in 1995 as they did in 1990. That statistically changed in 2011 with over 90% of the residences living in the county staying in the same house. 2011 also showed a major decline in moves within the county. In 1995 nearly one-quarter of the population moved within Jefferson County compared to 4.7% estimated in 2011. Large decreases were also found in relocations from within Missouri and from other states to Jefferson County from 1995 and 2011.
Table 6: Geographic Mobility of Residence of Jefferson County Residents (1995 / 2011)
Number 1995 2011
Percentage 1995 2011
Total 183,819 216,328 100 100
Lived in same house 106,054 196,005 57.7 90.6 Lived in different house within Jefferson County 41,845 10,254 22.8 4.6 Lived in different house within state 26,713 7,151 14.5 3.3 Lived outside the state 9,207 2,794 5.0 1.3
Source: East-West Gateway Coordinating Council and U.S. American Community Survey

2013 Jefferson County Data Book _________________________________________________________
32
ECONOMIC CONDITIONS
Economic Characteristics --------------------------------------------------------------- Page 33
FIGURES Jefferson County Labor Force, 2002 to 2012 ---------------------------------------- Page 33 Comparative Unemployment Rates: 2002-2012 ----------------------------------- Page 33 2010 Employment Distribution by Industry Group ------------------------------ Page 35 Share of Employment Base by Economic Sector, 1974-2011 -------------------- Page 35 Self-Employed Workers in Jefferson County: 2002 to 2012 -------------------- Page 36 Income Comparison of St. Louis Metropolitan Region, 2011------------------- Page 37 TABLES
Jefferson County Employment by Sector, 1970-2010 ----------------------------- Page 34 Small Businesses of Jefferson County ------------------------------------------------ Page 36

_________________________________________________________ 2013 Jefferson County Data Book
33
3.00%
4.00%
5.00%
6.00%
7.00%
8.00%
9.00%
10.00%
11.00%
12.00%
02 03 04 05 06 07 08 09 10 11 12
Year
Figure 2: Comparative Unemployment Rate 2002-2012
Jefferson County
St. Louis MSA (MO states)
United States
Economic Characteristics General
Jefferson County has exhibited many of the economic characteristics one might expect of a county at the edge of a large metropolitan region. Employment opportunities within the County continue to increase, as does a growing labor force, though a significant majority still leaves the County to work. Trends in the various sectors of the economy further reinforce Jefferson County’s position as a County at the edge of a large metropolitan region. Agricultural services, mining, and wholesale trade remain historically insignificant sectors of the
economy with regard to their percentage of the County’s employment base. The manufacturing sector, which contributed the highest percentage of jobs three decades ago, has declined steadily; while sectors such as retail trade and services have increased to represent nearly half of the County’s employment base. Trends indicate that small businesses continue to make up a significant majority of the total number of businesses in the County. While having declined slightly in recent years, self-employed workers continue to represent one-quarter of the workers in the County.
Un
em
plo
yme
nt
Ra
te
3.0%
4.0%
5.0%
6.0%
7.0%
8.0%
9.0%
10.0%
11.0%
0
20,000
40,000
60,000
80,000
100,000
120,000
02 03 04 05 06 07 08 09 10 11 12
Year
Figure 1: Jefferson County Labor Force, 2002 to 2012
Persons Employed
Persons Unemployed
Unemployment Rate
Source: Missouri Department of Economic Development – Labor Market Information & US Department of Labor – Bureau of Labor Statistics
Pe
rce
nt
Un
em
plo
yed
Pe
rso
ns

2013 Jefferson County Data Book _________________________________________________________
34
Labor force In 1993, Jefferson County had a labor force of 92,858 people and an unemployment rate of 6.3%. By 2004, the labor force had increased by 116,164 people. The labor force has not grown since 2004, with an actual decrease in the workforce in 2012 to 115,486. The County had experienced a steady and low unemployment rate during the 1990s, with an unemployment rate of 3.2% in 1999, but it suddenly increased by 1.6% from 1999 to 2001.
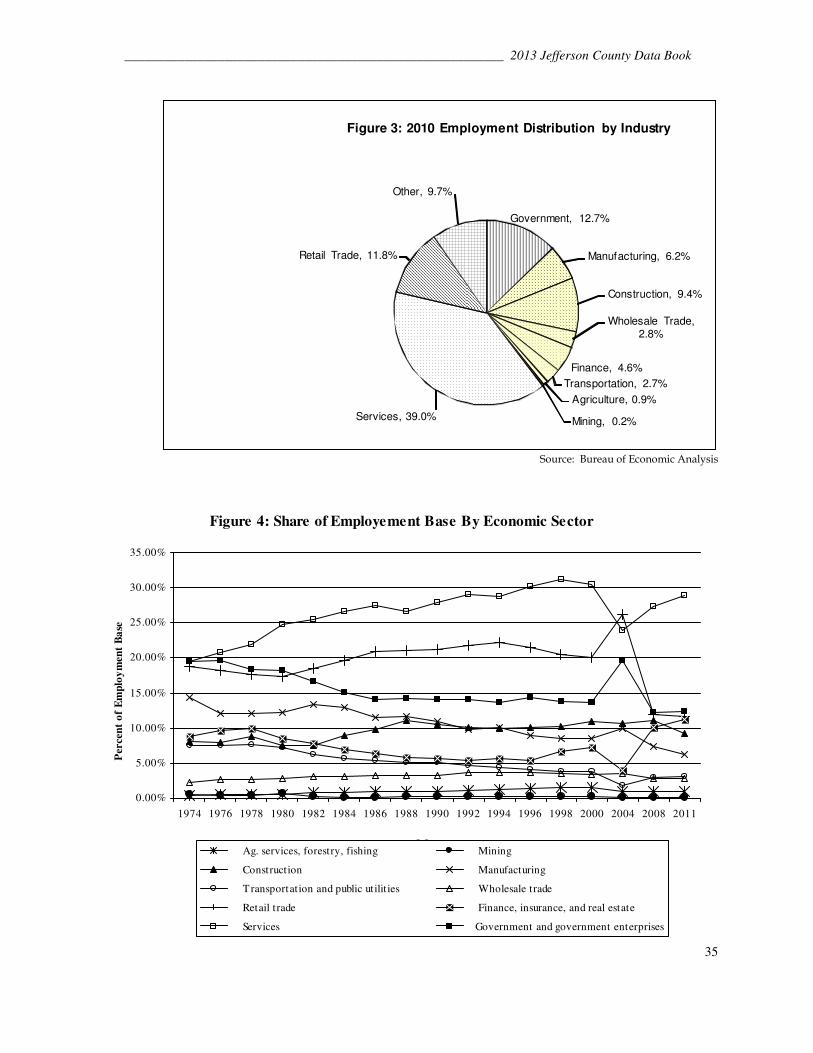
The 2001 County unemployment rate of 4.8% was higher than the U.S. rate of 4.77%, which happened the first time in 9 years. But it was still slightly lower than the 4.9% of the Missouri part of the St. Louis Metropolitan Statistical Area (comprised of Jefferson, Franklin, St. Charles, and St. Louis Counties, and St. Louis City). Jefferson County was on par with the state and country throughout the early and mid-2000s with an unemployment rates ranging between 5-5.5%. The recession of the late 2000s caused the unemployment rate of the county to increase from 5.1% in 2007 to 10.8% in 2009. The unemployment rate in Jefferson County was 1.5% higher than the nationwide average and 0.8% higher than the St. Louis area. However, a negative trend was bucked in 2012 with Jefferson County having a lower unemployment rate than the national average for the first time since 2003. Employment As the number of employed Jefferson County residents increased by approximately 21% from the period 1990 to 2000, the number of employees working within the County also increased by 35% for the same period (though some of this increase is being filled by residents of other counties). As is indicative of the economy throughout the country and the region, employment in the retail and service sectors in Jefferson County continue to climb, as employment in the manufacturing, governmental, and other sectors decline. In 1970, manufacturing, retail, and services each represented approximately 20% of the employment base of the County. By 1990, manufacturing had dropped to 10%, while retail and services combined rose to comprise nearly half of the employment base. The 2010 report for the Bureau of Economic Analysis indicates that the population of Jefferson County continues to work primarily in the retail and service sectors. The county saw a downtrend in construction related employment, an employment sector that had been rising since 1970. County employment in the manufacturing sector continued to decline from 18.08% of the population working in manufacturing in 1970 to 6.23% in 2010.
Table 1: Jefferson County Employment by Sector, 1970-2010
Total Employment*
Retail & Services
Construction Manufacturing Governmental Other**
(number) (% of total) (% of total) (% of total) (% of total) (% of total)
1970 19, 696 39.82 5.85 18.08 17.83 18.69 1980 29, 828 42.12 7.56 12.25 18.24 19.82 1990 46, 794 49.20 10.55 10.96 14.02 15.27 2000 2010
63, 417 74, 811
50.52 50.82
10.89 9.37
8.54 6.23
13.69 12.70
16.36 20.88
Source: Bureau of Economic Analysis *Total Employment does not include those workers employed on farms **Other includes Agriculture, Mining, Transportation and Utilities, Wholesale Trade, and Finance
_________________________________________________________ 2013 Jefferson County Data Book
35
Government, 12.7%
Manufacturing, 6.2%
Construction, 9.4%
Wholesale Trade, 2.8%
Finance, 4.6%
Transportation, 2.7%
Agriculture, 0.9%
Mining, 0.2%Services, 39.0%
Retail Trade, 11.8%
Other, 9.7%
Figure 3: 2010 Employment Distribution by Industry
Source: Bureau of Economic Analysis
Figure 4: Share of Employement Base By Economic Sector
0.00%
5.00%
10.00%
15.00%
20.00%
25.00%
30.00%
35.00%
1974 1976 1978 1980 1982 1984 1986 1988 1990 1992 1994 1996 1998 2000 2004 2008 2011
Year
Per
cen
t o
f E
mp
loy
men
t B
ase
Ag. services, forestry, fishing Mining
Construction Manufacturing
T ransportation and public utilit ies Wholesale trade
Retail trade Finance, insurance, and real estate
Services Government and government enterprises
2013 Jefferson County Data Book _________________________________________________________
36
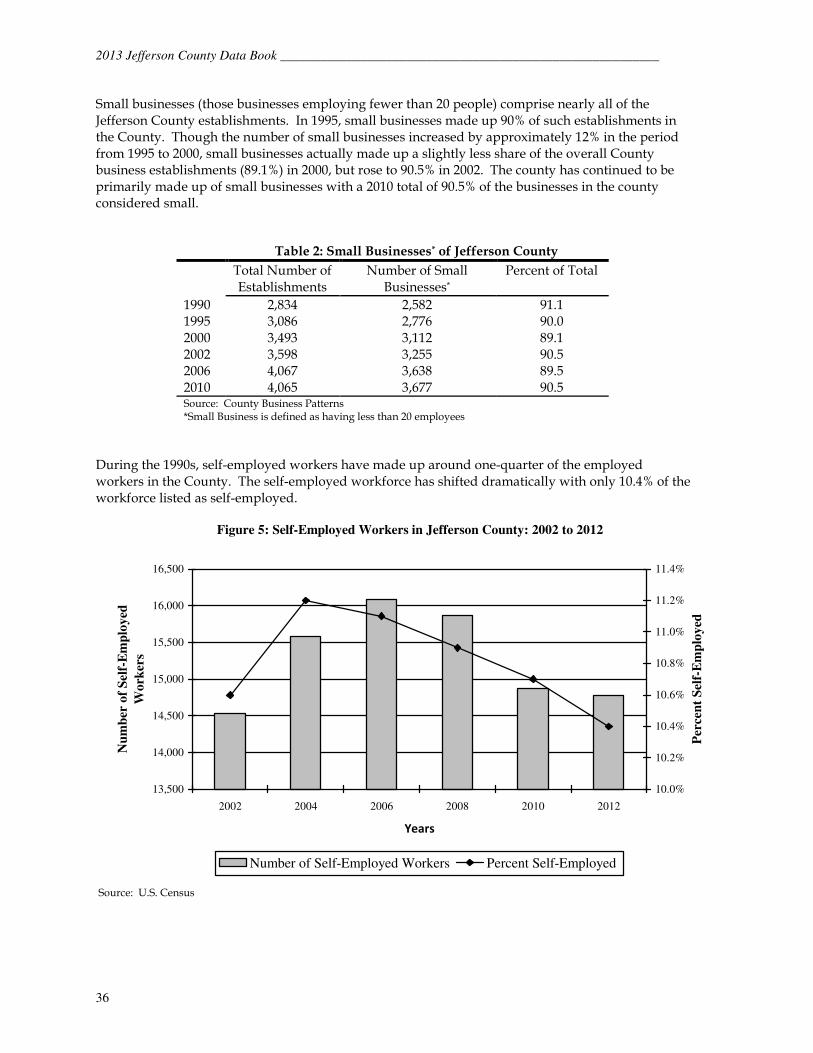
Small businesses (those businesses employing fewer than 20 people) comprise nearly all of the Jefferson County establishments. In 1995, small businesses made up 90% of such establishments in the County. Though the number of small businesses increased by approximately 12% in the period from 1995 to 2000, small businesses actually made up a slightly less share of the overall County business establishments (89.1%) in 2000, but rose to 90.5% in 2002. The county has continued to be primarily made up of small businesses with a 2010 total of 90.5% of the businesses in the county considered small.
Table 2: Small Businesses* of Jefferson County
Total Number of Establishments
Number of Small Businesses*
Percent of Total
1990 2,834 2,582 91.1 1995 3,086 2,776 90.0 2000 3,493 3,112 89.1 2002 2006 2010
3,598 4,067 4,065
3,255 3,638 3,677
90.5 89.5 90.5
Source: County Business Patterns *Small Business is defined as having less than 20 employees
During the 1990s, self-employed workers have made up around one-quarter of the employed workers in the County. The self-employed workforce has shifted dramatically with only 10.4% of the workforce listed as self-employed.
Figure 5: Self-Employed Workers in Jefferson County: 2002 to 2012
13,500
14,000
14,500
15,000
15,500
16,000
16,500
2002 2004 2006 2008 2010 2012
Years
Nu
mb
er o
f S
elf-
Em
plo
yed
Wo
rker
s
10.0%
10.2%
10.4%
10.6%
10.8%
11.0%
11.2%
11.4%
Per
cen
t S
elf-
Em
plo
yed
Number of Self-Employed Workers Percent Self-Employed
Source: U.S. Census

_________________________________________________________ 2013 Jefferson County Data Book
37
Income
The median household income for Jefferson County residents, according to the 2007-2011 American Community Survey (5-year estimate) was $56,400. This figure was slightly higher than the median household income for the entire St. Louis Metropolitan Region ($47,272), but was less than that for St. Charles County and St. Louis County ($71,458; $58,630 respectively).
Figure 6: Income Comparison of St. Louis Metropolitan Region, 2011
The median family income for Jefferson County residents estimated in 2011 was $65,950 and the per capita income was $24,965. These figures exceed the $58,171 median family and $25,819 per
capita income for the entire St. Louis Metropolitan Region. Jefferson County has seen an estimated $5,279 increase in median family income while the St. Louis Metropolitan Region saw an estimated $4,062 decrease in median family income. Jefferson County ranked third in the region in median family income, below St. Charles and St. Louis counties. Jefferson County has also seen an increase in per capita income, ranking 3rd in the region in 2011 estimates after being ranked 6th in the region in 2005.
In 2011, 8.1% of Jefferson County families lived below the poverty level, a 2.8% increase from 2005. Jefferson County was slightly lower than the 2011 poverty rate of 10.4% (only a 2.7% increase from 2005) of the families in the St. Louis Metropolitan Region, and 9.6% (only a 2.5% increase from 2005) of the families in the St. Louis Missouri Area (comprised of Jefferson, Franklin, St. Charles and St. Louis Counties, and St. Louis City). This comparison is skewed, however, by the high poverty rate in St. Louis City (21%). But still, Jefferson County has lower poverty rate than most counties in the region, except for Franklin County (8.1%), St. Charles County (3.4%) and St. Louis County (7.2%). These trends are evidence of the economic benefits that Jefferson County has in the past and is currently receiving, due to the shift in population to the suburbs of the metropolitan area. As defined by the census, the median income level divides a population’s income distribution into two equal groups, one having incomes above the median and the others having incomes below the median. Also, as defined by the census, a household includes all the people who occupy a housing unit as heir usual place of residence, and a family is defined as a group of two or more people who reside together that are related by birth, marriage, or adoption.
$0
$10,000
$20,000
$30,000
$40,000
$50,000
$60,000
$70,000
$80,000
$90,000
Median Household
Median Family
Per Capita
Source: U.S. American Community Survey

2013 Jefferson County Data Book _________________________________________________________
38
SOCIAL INDICATORS Social Indicators --------------------------------------------------------------------------- Page 39 TABLES Jefferson County’s Wealthiest Zip Codes ------------------------------------------- Page 40 The Rest of Jefferson County by Zip Code ----------------------------------------- Page 41 Average Home Value for 1999/ 2011 ------------------------------------------------ Page 41

_________________________________________________________ 2013 Jefferson County Data Book
39
Social Indicators General Throughout the various stages of life, residents find themselves presented with new opportunities and facing new challenges. Opportunities may come as a better paying job or the availability of public transit to provide transportation to the doctor's office. Challenges may come from the lack of adequate pre-natal care, the inadequacy of one's income, or they may be as commonplace as simply getting older. Throughout each of these stages, key indicators exist that may help discern whether the opportunities are being seized upon or whether the challenges are proving difficult to overcome. These indicators can be used to help educators, social service providers, planners, and elected officials make better and informed decisions. Children In 2010, it was estimated that there were 30,057 children under the age of ten in Jefferson County, representing 13.7% of the County's total population. In 2000, approximately 8.1% of the school-aged children in Jefferson County were classified as living in poverty, and 20% of them lived in single parent family. The 2010 Missouri Kids Count Data Book estimated that school-aged children living in poverty increase to 11.1% and 26.7% from 2000 to 2010 of school-aged children lived in a single parent family. In 2010, 68.7% of the children under 6 years old in the County were living in families with all parents in labor force, continuing an upward trend from 1990 at 62.1% and then 2000 at 64.2%. The state average has also increased from 64.2% in 2000 to 67.8% in 2010. In 2010, nearly 17% of Jefferson County children (less than 6 years old) lived in families whose income was below poverty level, a 6 percent increase over 2000. Approximately 27.9% of the children in Jefferson County were receiving food stamps and 27.1% were enrolled in Medicaid, over a 7 percent and 5 percent increase respectively from 2000. Roughly 88.5% of the children in the County received what is considered adequate immunizations in 2002. This percentage has been increasing in recent years and is consistent with the state trends. In 2010, the licensed childcare capacity in Jefferson County was 3,897; while 1,019 children were receiving subsidized childcare, up almost 300 children since 2007. Adolescents and Young Adults In 2010, there was an estimated 30,642 teenagers (children aged between 10 and 19) in Jefferson County, representing 14.0% of the County’s total population, down from 15.7% in 2003 and 14.1% in 2007. In 2009, Jefferson County recorded juvenile law violations for youth aged 10 - 17 were listed at 47.9 per 1,000, representing a decrease from 2003 and 2007 (58.7 per 1,000 and 48.7 per 1,000 respectively) and significantly lower than the Missouri rate (51.3 per 1,000 in 2009). In 2010, there were 210 teen births (age 15-19), down from 256 in 2007. The county’s teen birth rate was 8.2 percent lower than the Missouri state rate. ** Source: 2011 Missouri Kids Count Data Book

2013 Jefferson County Data Book _________________________________________________________
40
Adults and Families The marriage rate has steadily declined in the state, with 2009 having the lowest marriage rate since the Department of Health began compiling the data in 1950. In 2009, there were 5.2 marriages per 1,000 residents in Jefferson County, lower than both the regional planning area (5.5 per 1,000) and the state (6.5 per 1,000). At the same time the divorce rate was 2.7 per 1,000 residents, also lower than the state (3.7 per 1,000) and the regional planning area (2.8 per 1,000). The state divorce rate has continued to decline since the late 70s when in 1979 the divorce rate hit a state high of 5.7 per 1,000. Elderly In 2010, the population over the age of 65 represented 11.2% or 24,394 senior citizens, up from the 2000 total of 18,305 or 9.2% of the County's population. In 2000, 6.3% were listed with incomes below the poverty rate and has since increase to 7.6% in 2010. The increase in senior citizens that are below the poverty rate is interesting because the education level has increased substantially since 2000 and 2007. The percentage of senior citizens without a high school diploma has decreased from 48.5% to 35.4% and the percentage of senior citizens with some college education increased from 19.4% to 26.2%. Health In 2009, there were 1,772 deaths in Jefferson County, the leading cause of death was major cardiovascular diseases (heart diseases) totaling 615 deaths, or 34.7%, which continues the tread from the early 90s. Heart disease was the leading cause, causing almost one-third of all deaths in the past twenty years. Cancer diseases were the second leading cause of death in 2009 totaling 393 deaths, down from 404 deaths in 2007. Income The following ZIP codes in Jefferson County ranked among the top 50 wealthiest ZIP codes in the St. Louis region (ranked by 1999 median household income) in the December 11-17 edition of the St. Louis Business Journal. The American Community Survey has estimates for the metro area zip codes and was used to provide an updated ranking system for 2011.
Table 1: Jefferson County’s Wealthiest ZIP Codes 1999 / 2011
Zip Code
Geographic Area
1999 Population
Ranking in 1999
1999 MHI
2011 Population
Ranking in 2011
2011 MHI
63012 Barnhart 10,203 16 $56,342 10,545 32 $73,294
63052 Imperial 21,612 28 $52,837 25,842 49 $67,666
63016 Cedar Hill 8,066 38 $50,335 8,050 69 $61,162
63010 Arnold 34,797 42 $49,890 35,746 65 $62,682
63050 Hillsboro 13,066 47 $48,831 15,085 74 $60,500
63049 High Ridge 15,223 48 $48,761 15,839 72 $60,731
63030 Fletcher 19 49 $48,750 361 143 $45,777
63041 Grubville 293 Not Ranked $38,250 244 64 $63,000 Source: News Democrat Journal, St. Louis Business Journal, CACI Marketing Systems in Arlington, VA, 2001
American Community Survey

_________________________________________________________ 2013 Jefferson County Data Book
41
The remaining ZIP codes in Jefferson County had the following statistics, according to the CACI Marketing Systems website for 1999 data and the American Community Survey from the U.S. Census for 2011 data.
Table 2: The Rest of Jefferson County National Average: $41,914 (1999) - $61,455 (2011) for Median Household Income
ZIP Code Geographic Area 1999 MHI 2011 MHI 1999
Population 2011
Population 63051 House Springs $45,041 $53,207 12,561 13,979
63023 Dittmer $44,741 $50,204 4,978 5,412
63070 Pevely $44,388 $39,911 6,085 7,934
63048 Herculaneum $43,618 $50,230 2,297 3,324
63028 Festus $43,253 $54,531 23,146 25,426
63019 Crystal City $41,496 $50,049 3,679 4,463
63020 De Soto $41,214 $46,835 19,508 20,592 Source: News Democrat Journal, St. Louis Business Journal, CACI Marketing Systems in Arlington, VA, 2001 American Community Survey
CACI Marketing Systems, which compiled data used by the St. Louis Business Journal to rate the wealthiest ZIP codes in the St. Louis Region, lists the following average home values (Median Housing Value MHV) for 1999. The American Community Survey was used for the 2011 data.
Table 3: Average Home Value for 1999 / 2011
ZIP Code Geographic Area 1999 MHV 2011 MHV 63052 Imperial $101,507 $171,900
63050 Hillsboro $100,126 $169,500
63030 Fletcher $100,000 $119,000
63049 High Ridge $93,016 $152,800
63012 Barnhart $92,938 $165,000
63028 Festus $92,793 $146,700
63019 Crystal City $92,741 $123,700
63051 House Springs $91,764 $139,400
63010 Arnold $90,765 $157,300
63016 Cedar Hill $90,038 $146,100
63023 Dittmer $87,015 $163,300
63048 Herculaneum $83,218 $152,300
63070 Pevely $81,977 $118,900
63020 De Soto $77,779 $129,800
63041 Grubville $72,786 $134,100 Source: News Democrat Journal, St. Louis Business Journal, CACI Marketing Systems in Arlington, VA, 2001 American Community Survey

2013 Jefferson County Data Book _________________________________________________________
42
HOUSING CHARACTERISTICS
Housing Characteristics ----------------------------------------------------------------- Page 43 TABLES Total Housing Units ---------------------------------------------------------------------- Page 43
Jefferson County and the Region Average Household Size -------------------- Page 43 Area Building Permits as a Percentage of the Regional Building Permits -- Page 45 Jefferson County Building Permit Characteristics -------------------------------- Page 45
FIGURES
Jefferson County Specified Owner-Occupied Housing Value ----------------- Page 44

_________________________________________________________ 2013 Jefferson County Data Book
43
Housing Characteristics General In 2010, there were 79,171 housing units in Jefferson County, a 5% increase from that (75,586 units) in 2000. Table 1 shows that the County had been experiencing faster housing growth than the entire Region for the last 40 years.
Table 1: Total Housing Units
1970 1980 1990 2000 2010
Jefferson County 33,677 51,159 63,423 75,586 87,626
Increase (percent) _ 52 24 19 17
St. Louis Region 791,693 887,425 985,049 1,043,635 1,112,442
Increase (percent) _ 12 11 6 7
Source: East-West Gateway Coordinating Council, U.S. Census 2010
About 93% percent (81,700) of the total housing units were occupied, of which 81% (66,836) were owner-occupied and 18% (14,864) were renter-occupied. The homeowner vacancy rate was 2.0 percent, and the rental vacancy rate was 8.7 percent, both up slightly from 2000 (1.3 and 8.2 respectively). The median year structure built for owner-occupied housing units was 1979 and for renter-occupied housing units was 1974 in 2000. The 2010 Census and American Community Survey do not provide a median housing age, however the 2010 American Community Survey does estimate that 17.4% of the housing stock is has been constructed since 200. (Source: Bureau of Census, Census 2000, Census 2010 & American Community Survey 2010) The 2010 average household size in Jefferson County was 2.65 persons per unit, while for the owner-occupied and renter-occupied units, the number were 2.74 and 2.36 respectively. Following the national trend, this average household size of the County had been decreasing over the last 30 years. However, the County still had a larger household size than the region and all counties in the region. The average household in Jefferson County had approximately 2.76 bedrooms and 5.6 total rooms. Slightly less than one-half percent (0.3%) of the units lacked plumbing facilities, and less than one-half percent (0.4%) lacked kitchen facilities, down from 0.6% and 0.8% respectively in 2000.
Table 2: Jefferson County and the Region Average Household Size, 2010
Place People
St. Louis City 2.16 St. Louis 2.42 St. Charles 2.64 Jefferson 2.65 Franklin 2.57
Missouri Subtotal 2.45 St. Louis Region 2.46
Source: U.S. Bureau of the Census
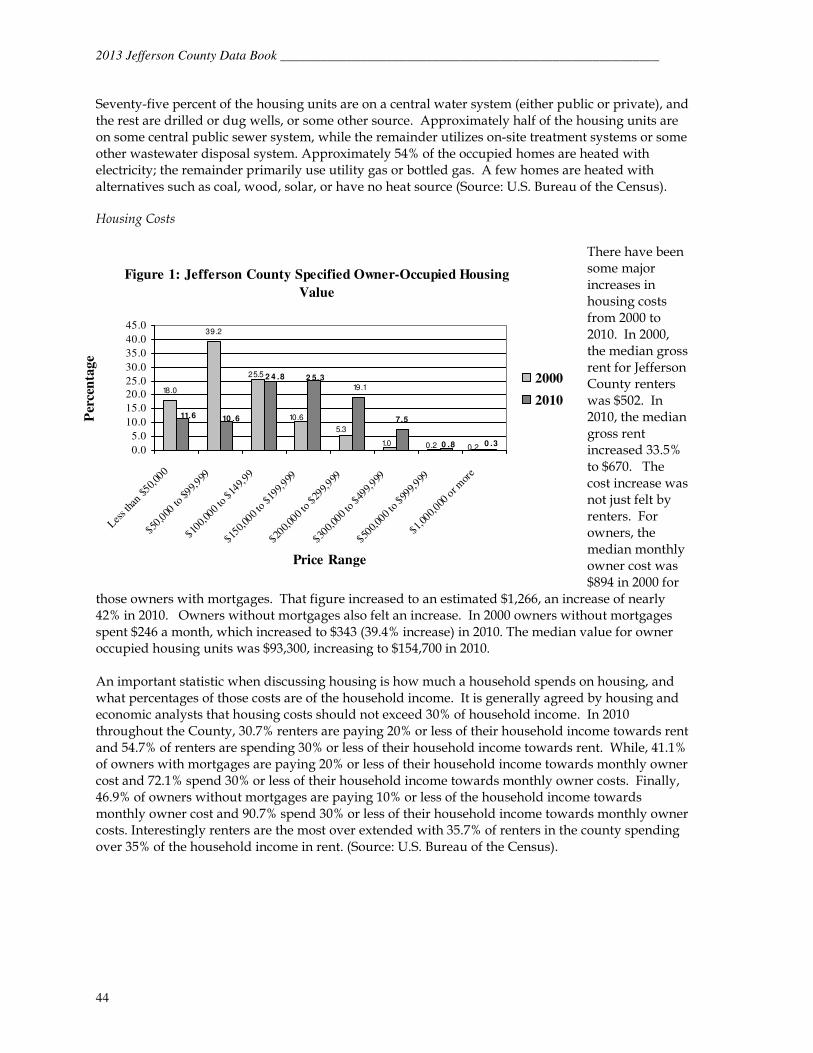
2013 Jefferson County Data Book _________________________________________________________
44
Seventy-five percent of the housing units are on a central water system (either public or private), and the rest are drilled or dug wells, or some other source. Approximately half of the housing units are on some central public sewer system, while the remainder utilizes on-site treatment systems or some other wastewater disposal system. Approximately 54% of the occupied homes are heated with electricity; the remainder primarily use utility gas or bottled gas. A few homes are heated with alternatives such as coal, wood, solar, or have no heat source (Source: U.S. Bureau of the Census). Housing Costs
There have been some major increases in housing costs from 2000 to 2010. In 2000, the median gross rent for Jefferson County renters was $502. In 2010, the median gross rent increased 33.5% to $670. The cost increase was not just felt by renters. For owners, the median monthly owner cost was $894 in 2000 for
those owners with mortgages. That figure increased to an estimated $1,266, an increase of nearly 42% in 2010. Owners without mortgages also felt an increase. In 2000 owners without mortgages spent $246 a month, which increased to $343 (39.4% increase) in 2010. The median value for owner occupied housing units was $93,300, increasing to $154,700 in 2010. An important statistic when discussing housing is how much a household spends on housing, and what percentages of those costs are of the household income. It is generally agreed by housing and economic analysts that housing costs should not exceed 30% of household income. In 2010 throughout the County, 30.7% renters are paying 20% or less of their household income towards rent and 54.7% of renters are spending 30% or less of their household income towards rent. While, 41.1% of owners with mortgages are paying 20% or less of their household income towards monthly owner cost and 72.1% spend 30% or less of their household income towards monthly owner costs. Finally, 46.9% of owners without mortgages are paying 10% or less of the household income towards monthly owner cost and 90.7% spend 30% or less of their household income towards monthly owner costs. Interestingly renters are the most over extended with 35.7% of renters in the county spending over 35% of the household income in rent. (Source: U.S. Bureau of the Census).
Figure 1: Jefferson County Specified Owner-Occupied Housing
Value
18.0
39.2
7.5
0.20.21.0
5.3
10.6
25.5
0 .30 .8
19.1
2 5.32 4 .8
10 .611.6
0.0
5.0
10.0
15.0
20.0
25.0
30.0
35.0
40.0
45.0
Less t
han $
50,00
0
$50,0
00 to
$99,
999
$100,
000
to $
149,
99
$150,
000
to $
199,
999
$200,
000
to $
299,
999
$300,
000
to $
499,
999
$500,
000
to $
999,
999
$1,00
0,000
or m
ore
Price Range
Per
cen
tag
e
2000
2010

_________________________________________________________ 2013 Jefferson County Data Book
45
Building Activity Building permit data collected from 1982 through 2010 shows that Jefferson County had continued to increase its share of the regional housing growth until 1997, with a high of 20% of the regional building permits. Since the late 1990s, Jefferson County has, in general, has issued between 16% and 18% of the regions building permits. In 2010, only St. Charles County issued more building permits in the St. Louis Region (Jefferson, St. Louis, and St. Charles Counties, St. Louis City and as of 2005 a combined total for Franklin, Lincoln and Warren Counties). In 2010, the county issued 586 permits for new construction.
Table 3: Area Building Permits as a Percentage of the Regional Building Permits
Jefferson Co. St. Charles Co. St. Louis Co. St. Louis City Other*
1982 8% 28% 39% 25% No Data 1990 17% 35% 47% 1% No Data 1997 20% 43% 34% 3% No Data 2000 16% 54% 25% 5% No Data 2002 2005 2007 2010
16% 16% 17% 18%
58% 43% 47% 48%
20% 20% 17% 16%
5% No Data No Data 5%
No Data 9% 11% 13%
Source: Home Builders Association of Greater St. Louis
* Combined Totals of Franklin, Lincoln and Warren Counties Single-family homes have historically dominated new residential construction in the County. In every year since 1982, single-family homes have comprised at least 85% of the new residential permits. In the period from 1990 to 1996, essentially all of the building permits issued in the County was for single-family homes. In 1997, single-family homes dropped off to nearly 88% of the total residential building permits issued. However, starting from 1998, the single-family homes raised up again to more than 94% of the total residential permits every year. During 2007, the multifamily permits had the highest percentage shown on Table 4.
Table 4: Jefferson County Building Permit Characteristics
Single-family Multi-family Total Building Permits No. of Permits Percent of Total No. of Permits Percent of Total
1982 305 85 54 15 359 1990 881 96.7 30 3.3 911 1997 1,264 87.9 174 12.1 1,438 2000 1208 94.8 66 5.2 1,274 2002 2005 2007 2010
1,375 1,416 903 538
99.7 100.0 83.2 91.8
4 0 182 48
0.3 0.0 16.8 8.2
1,379 1,416 1,085 586
Source: Home Builders Association of Greater St. Louis

2013 Jefferson County Data Book _________________________________________________________
46
TRANSPORTATION CHARACTERISTICS
Transportation Features ----------------------------------------------------------------- Page 47
FIGURES Means of Transportation for Jefferson County Residents: 2010 --------------- Page 50 Railroad and Port facilities in Jefferson County ----------------------------------- Page 52
TABLES
Vehicle Miles Traveled, 2007 to 2011 ------------------------------------------------- Page 47 Traffic Volumes in Jefferson County, 1992 to 2010 ------------------------------- Page 48 Pavement Conditions of Jefferson County Maintained Roads, 2009 --------- Page 49 Pavement Conditions of State Maintained Roads, 2001, 2006 ------------------ Page 49 Location of Place of Work for Jefferson County Workers Aged 16 Years and Older, 2010 -------------------------------------------------------- Page 49 Travel Time to Work for Jefferson County Workers Aged 16 Years and Older, 2010 -------------------------------------------------------- Page 50 Accident Rates in Jefferson County, 2002 ------------------------------------------- Page 51

_________________________________________________________ 2013 Jefferson County Data Book
47
Transportation Features General Jefferson County contains more than 1,500 miles of public roads including those maintained by the Missouri Department of Transportation, Jefferson County, and various special road districts and municipalities. Nearly 45% of these roads are the responsibility of the Jefferson County Highway Department. In addition, Jefferson County is responsible for the maintenance of 191 bridges located throughout the County. Source: Jefferson County GIS The County is served by two international rail companies, Union Pacific Railroad and Burlington Northern Railroad. The County also includes a number of privately owned and operated port facilities on the Mississippi River. Public transportation in Jefferson County is currently limited to paratransit activities providing service for the elderly and disabled. The county has one airport that is open to the public, Festus Memorial Airport (FES). has two runways and has hangers available. The airport is located at 900 Airport Road, two miles south of Festus. The airport is under private ownership. Highway Transportation In 2011, there were 4,645,460 trips in Jefferson County. The county represented 7.24% of all trips in the St. Louis region. The county and region has seen a steady decline in vehicle mile traveled from 2007 to 2011. The county’s vehicle mile traveled has decreased by 8.23%, while the region dropped by nearly 4.5%.
2007 2008 2009 2010 2011
Jefferson County 5,061,951 4,993,344 4,800,984 4,762,136 4,645,460
St. Louis Region* 67,166,127 66,059,901 66,031,915 65,841,928 64,189,745
* Counties include St. Clair, Madison, Monroe, Franklin, Jefferson, St Charles, St. Louis, St. Louis City Source: East-West Gateway
Table 1: Vehicle Miles Traveled

2013 Jefferson County Data Book _________________________________________________________
48
Source: Missouri Department of Transportation
Table 2: Traffic Volumes in Jefferson County 1992 to 2010
ROUTE LOCATION
TRAFFIC
COUNTS
1992
TRAFFIC
COUNTS
1997
TRAFFIC
COUNTS
2002
TRAFFIC
COUNTS
2007
TRAFFIC
COUNTS
2010
I 55 ST. LOUIS COUNTY LINE 78,180 88,654 96,418 107,290 101,882
NORTH OF RT M 57,465 80,806 89,950 82,382 54,396
NORTH OF FESTUS/CRYSTAL CITY 33,980 42,095 45,609 59,818 57,174
SOUTH OF FESTUS/CRYSTAL CITY 19,502 20,256 20,266 27,922 29,435
US 61/67 ST. LOUIS COUNTY LINE 18,436 20,824 18,598 13,701 12,994
SOUTH OF MO 141 12,272 20,328 20,457 17,672 15,052
SOUTH OF RT Z 12,606 14,600 14,990 10,318 10,917
AT RT A IN FESTUS 14,900 18,404 22,249 22,436 20,462
US 61 NORTH OF RT AA 1,372 4,100 4,208 5,480 6,902
US 67 SOUTH OF I-55 AT FESTUS 28,737 30,188 39,646 31,947 33,910
AT MO 110 16,667 17,176 21,139 20,988 20,378
ST FRANCOIS COUNTY 13,785 14,566 19,269 17,950 18,443
MO 21 SOUTH OF MO 141 12,574 8,021 8,692 28,542 26,937
SOUTH OF RT M AND RT MM 11,306 13,516 18,787 13,061 14,958
SOUTH OF DeSOTO 5,640 6,118 7,070 6,310 6,452
MO 30 ST LOUIS COUNTY LINE 32,118 30,987 52,483 44,119 38,346
NORTH OF RT MM AND RT W 19,419 21,706 34,025 27,072 25,923
MO 110 WEST OF US 67 85,722 662 6,798 11,408 11,012
EAST OF MO 21 4,880 6,342 7,044 6,826 6,536
MO 141 SOUTH OF ST. LOUIS COUNTY LINE 24,291 29,029 28,315 36,626 35,658
SOUTHEAST OF MO 21 34,220 33,170 32,358 29,993 31,223
WEST OF I-55 - - - 33,177 34,536
MO 231 NORTH OF US 61/67 - 12,452 13,158 12,522 11,486
RT M WEST OF I-55 - 14,048 14,889 18,111 17,480
RT MM WEST OF MO 21 5,886 6,798 8,462 9,464 9,001
RT W WEST OF MO 30 6,514 10,160 11,865 6,328 6,408
RT A BETWEEN I-55 AND MO 21 6,562 8,076 9,366 8,414 8,620
RT Z BETWEEN I-55 AND RT A 7,042 7,480 7,676 8,948 7,744
RT B AT RT C 3,216 5,470 7,004 - -
WEST OF MO 21 - - - 7,442 8,320
EAST OF MO 30 - - - - 5,716
RT BB BETWEEN MO 21 AND MO 30 1,728 1,768 1,794 1,784 1,078
RT Y BETWEEN MO 21 AND MO 30 1,706 2,224 2,830 2,156 2,184
RT E SOUTH OF DeSOTO 5,896 13,254 10,432 3,324 3,398

_________________________________________________________ 2013 Jefferson County Data Book
49
Maintenance Regular maintenance of roadways is essential if the existing road network is to be preserved. Both the State of Missouri and Jefferson County focus significant sums of money and manpower in this effort. The following tables demonstrate the results of these efforts:
Good Pavement Condition
Fair Pavement Condition
Poor Pavement Condition
Miles 519.11 158.59 5.33
Percentage 76.0% 23.2% 0.8%
Source: Jefferson County Highway Department
Functional Good Pavement Fair Pavement Poor Pavement
Classification Condition Condition Condition
2001 2006 2001 2006 2001 2006
Interstate 31.2 87.5 12.8 11.2 55.9 1.4
Principal Arterial* 12.2 85.8 18.4 7.6 69.4 6.6 Other** 0.0 28.1 39.1 27.1 60.9 44.7 *Includes freeways, expressways and other principal arterial ** Includes minor arterials, collectors, and other minor roads Source: East-West Gateway Coordinating Council, MoDot
In 2016, the county’s one-half cent sales tax for road improvements will expire. In the upcoming years the voters of Jefferson county will be asked to vote on whether to extend the sales tax for continued roadway improvements. Travel Characteristics Approximately two-thirds of Jefferson County workers aged 16 years and older work outside Jefferson County. More than half has a commute time to work greater than 30 minutes, and 84.7% drive to work alone. While the 2010 Census data does not allow direct correlations to be drawn between where people work, how they get there, and how long it takes them to get there, these statistics can be used as general indicators for much larger community issues. For example, place of work, commute time, and means to work for Jefferson County workers can begin to point to significant impacts on such issues as the County’s tax base, air pollution, road congestion, and general quality of life.
Table 5: Location of Place of Work for Jefferson County Workers Aged 16 Years and Older, 2010
Number Percentage
Total 16 yrs. and older 105,359 100 Work within Jefferson County 37,402 35.5 Work outside Jefferson County 67,957 64.5
Source: U.S. Census Bureau
Table 3: Pavement Conditions of Jefferson County Maintained Roads, 2009
Table 4: Pavement Conditions of State Maintained Roads: 2001, 2006

2013 Jefferson County Data Book _________________________________________________________
50
Table 6: Travel Time to Work for Jefferson County Workers Aged 16 Years and Older, 2010
Number Percentage
Worked at home 2,747 2.6
Workers who did not work at home 102,612 97.4
Workers who did not work at home 100
14 minutes or less 18,470 18.0
15 to 29 minutes 31,091 30.3
30 to 44 minutes 28,731 28.0
45 to 59 minutes 15,084 14.7
60 minutes or more 9,236 9.0
Median travel time 30.2
Source: U.S. Census Bureau
Drove alone, 84.7%
Carpooled, 10.8%
Public Transportation,
0.1%
Walked, 1.0%
Other means, 0.8%
Worked at home,2.6%
Source: U.S. Census Bureau
Figure 1: Means of Transportation for Jefferson County Residents, 2010

_________________________________________________________ 2013 Jefferson County Data Book
51
Safety One of the most discussed transportation issues in Jefferson County, and throughout the St. Louis region, is safety. As traffic counts increase so does the potential for conflict and accidents. Good maintenance, improvements in engineering and construction, and public awareness campaigns have helped to minimize these risks. However, accidents still occur and in some cases occur more often than what is expected. The table below demonstrates the accident rates on numerous state roads. Accident rates are determined by the number of accidents on a roadway relative to the amount of traffic it handles. The rate is expressed in accidents per 100 million vehicle miles of travel.
Highway Highway Segment Accident Rate 1-Year
2002 Statewide Accident Rate
For Same Type of
Roadway
IS 55 St. Louis County to RT M 212 110
IS 55 RT M to US 67 223 110
IS 55 US 67 to Ste. Genevieve County 118 110
US 61 US 67 to Ste. Genevieve County 132 173
US 61-67 RT M to US 67 589 173
US 61-67 St. Louis County to RT M 744 173
US 67 US 61 to St. Francois County 192 173
MO 110 US 67 to MO 21 366 281
MO 141 St. Louis County to US 61-67 644 281
MO 21 St. Louis County to Lake Lorraine 221 281
MO 21 Lake Lorraine to RT A 294 281
MO 21 RT A to RT N/H 477 281
MO 21 RT N/H to Washington County 232 281
MO 231 St. Louis County to US 61-67 432 281
MO 30 RT B to Franklin County Line 326 281
MO 30 St. Louis County to RT B 203 281
RT A US 61-67 to MO 21 584 287
RT B MO 21 To MO 30 308 287
RT BB MO 21 to MO 30 645 287
RT E RT N to St. Francois County 184 287
RT M US 61-67 to MO 21 738 287
RT MM MO 21 to MO 30 658 287
RT W MO 30 to St. Louis County Line 233 287
RT Y MO 30 to MO 21 331 287
RT Z US 61-67 to RT A 634 287
Source: East-West Gateway
Table 7: Accident rates in Jefferson County, 2002

2013 Jefferson County Data Book _________________________________________________________
52
Railroad and Waterway Approximately 65 miles of track, (owned by Burlington Northern and Union Pacific), exists in Jefferson County. Over 100,000 tons of materials pass through the County daily via these rail lines. In addition, Union Pacific operates a multi-million dollar car repair and paint shop in De Soto which employs 350 people as of January 2013.
Slightly more than twenty-two miles of the Mississippi River in Jefferson County is considered commercially navigable, overseen by the Jefferson County Port Authority. The majority of the facilities provide for the transfer of bulk commodities (rock, fertilizer, etc.) at approximately ten privately owned and maintained facilities/sites.
Public Transportation Bi-State Development Agency (Metro), the St. Louis region's transit provider, currently offers no services in Jefferson County, though services
located at Telegraph and Interstate 255, Lemay Ferry Road and 255, Meramec Bottom Road and Interstate 55, and Interstate 44 and Interstate 270 in St. Louis County are often used by Jefferson County residents. Metro had expanded into Jefferson County with bus service provided in the Arnold at the Richardson Road Park and Ride Lot, just off of Interstate 55. In November 2008, Proposition M was voted on by the citizens of St. Louis County and St. Louis City to approve a tax increase for the public transit system. The proposition failed and on March 30, 2009, Metro terminated the bus route that served Jefferson County. No light rail or commuter rail services are offered in Jefferson County, although a 1995 study by East-West Gateway Coordinating Council indicated that, at some time in the future, it may be appropriate to offer commuter rail service in Jefferson County along the I-55 corridor.
Rails near Horine
Figure 2: Railroad and Port Facilities in Jefferson County

_________________________________________________________ 2013 Jefferson County Data Book
53
Aviation
Currently Jefferson County has two airports. Moders Airport in the House Springs area is a privately owned, "restricted use" airport. The county has one airport that is open to the public, Festus Memorial Airport (FES). Festus Memorial Airport has two runways and has hangers available. The airport is located at 900 Airport Road, two miles south of Festus. The airport is under private ownership group, Wings Portco, Inc. The airport has 40 single engine aircrafts based
on the field. The airports aircraft operations average is 27 per day, with 80% of the air traffic identified as local general aviation. Source: Festus Memorial Airport & AirNav.com Pedestrian/Bicycle With the exception of small trails located within parks, and sidewalks located within many of the cities in the County, no formal pedestrian or bicycle facilities currently exist in Jefferson County.
The MRT is a unique way to experience the Mississippi River’s natural wonders, transportation system, recreational facilities and cultural heritage. The Mississippi River Trail (MRT) is an on-road trail about 3,000 miles in length leading through ten states from Lake Itasca in Minnesota to the Mississippi River Delta in Louisiana. A portion of the trail traverses Jefferson County. The trail crosses into Jefferson County at the Meramec River on Telegraph Road, in Arnold. The trail proceeds along U.S. Highway 61-67 to Festus and then enters Ste. Genevieve County on U.S. Highway 61.

2013 Jefferson County Data Book _________________________________________________________
54
UTILITY FEATURES
Utilities -------------------------------------------------------------------------------------- Page 55
FIGURES Public Sewer Districts-------------------------------------------------------------------- Page 55 Public Water Districts -------------------------------------------------------------------- Page 60 TABLES Northeast Public Sewer District Facilities ------------------------------------------- Page 56 Rock Creek Public Sewer District Facilities ----------------------------------------- Page 57 Glaize Creek Public Sewer District Facilities --------------------------------------- Page 57 Lake Adelle/Valle Lake Sewer District Facilities --------------------------------- Page 58 Municipal Wastewater Treatment Facilities ---------------------------------------- Page 59 Private Wastewater Treatment Facilities -------------------------------------------- Page 59 Public Water Supply District Facilities ---------------------------------------------- Page 61 Municipal Water Supply Facilities ---------------------------------------------------- Page 61
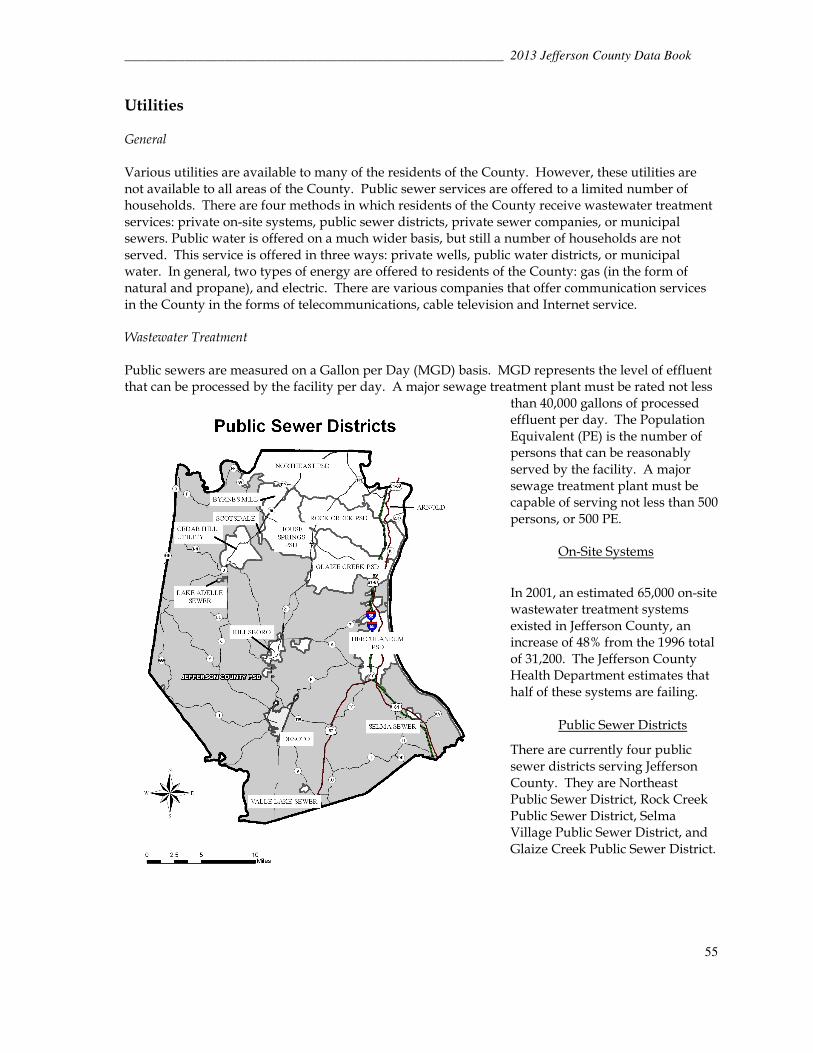
_________________________________________________________ 2013 Jefferson County Data Book
55
Utilities General Various utilities are available to many of the residents of the County. However, these utilities are not available to all areas of the County. Public sewer services are offered to a limited number of households. There are four methods in which residents of the County receive wastewater treatment services: private on-site systems, public sewer districts, private sewer companies, or municipal sewers. Public water is offered on a much wider basis, but still a number of households are not served. This service is offered in three ways: private wells, public water districts, or municipal water. In general, two types of energy are offered to residents of the County: gas (in the form of natural and propane), and electric. There are various companies that offer communication services in the County in the forms of telecommunications, cable television and Internet service. Wastewater Treatment Public sewers are measured on a Gallon per Day (MGD) basis. MGD represents the level of effluent that can be processed by the facility per day. A major sewage treatment plant must be rated not less
than 40,000 gallons of processed effluent per day. The Population Equivalent (PE) is the number of persons that can be reasonably served by the facility. A major sewage treatment plant must be capable of serving not less than 500 persons, or 500 PE.
On-Site Systems
In 2001, an estimated 65,000 on-site wastewater treatment systems existed in Jefferson County, an increase of 48% from the 1996 total of 31,200. The Jefferson County Health Department estimates that half of these systems are failing.
Public Sewer Districts
There are currently four public sewer districts serving Jefferson County. They are Northeast Public Sewer District, Rock Creek Public Sewer District, Selma Village Public Sewer District, and Glaize Creek Public Sewer District.
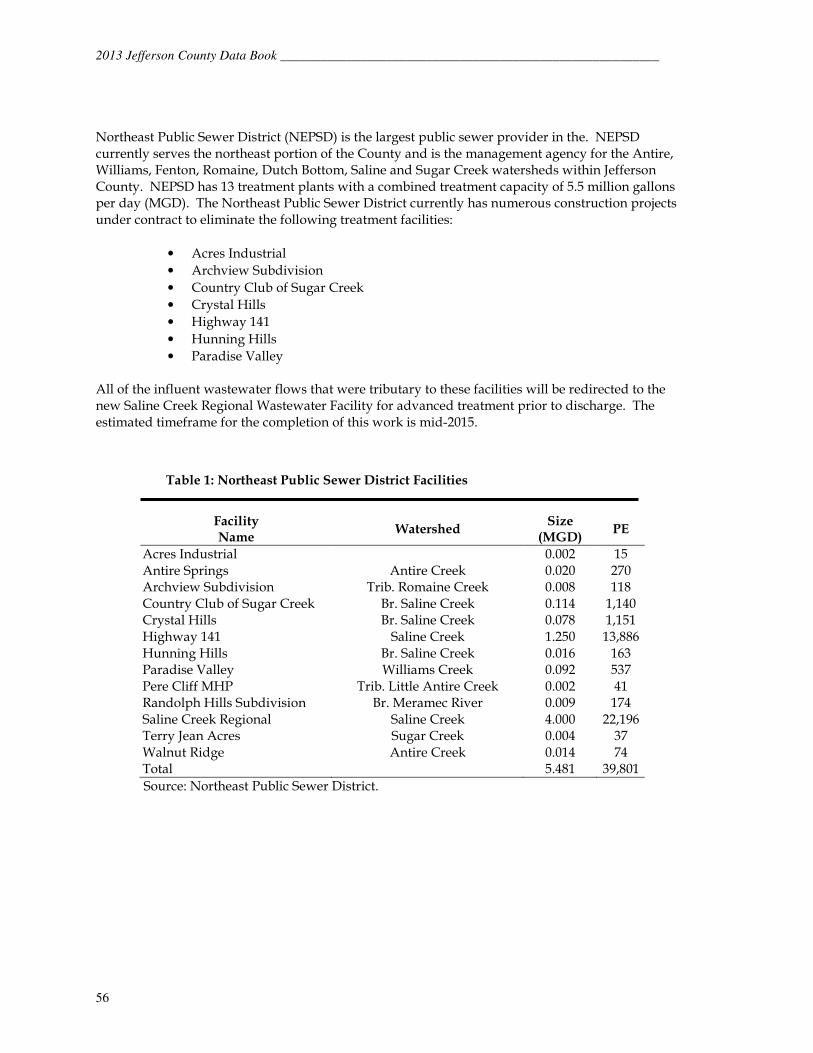
2013 Jefferson County Data Book _________________________________________________________
56
Northeast Public Sewer District (NEPSD) is the largest public sewer provider in the. NEPSD currently serves the northeast portion of the County and is the management agency for the Antire, Williams, Fenton, Romaine, Dutch Bottom, Saline and Sugar Creek watersheds within Jefferson County. NEPSD has 13 treatment plants with a combined treatment capacity of 5.5 million gallons per day (MGD). The Northeast Public Sewer District currently has numerous construction projects under contract to eliminate the following treatment facilities:
• Acres Industrial • Archview Subdivision
• Country Club of Sugar Creek • Crystal Hills • Highway 141
• Hunning Hills • Paradise Valley
All of the influent wastewater flows that were tributary to these facilities will be redirected to the new Saline Creek Regional Wastewater Facility for advanced treatment prior to discharge. The estimated timeframe for the completion of this work is mid-2015.
Facility Name
Watershed Size
(MGD) PE
Acres Industrial 0.002 15 Antire Springs Antire Creek 0.020 270 Archview Subdivision Trib. Romaine Creek 0.008 118 Country Club of Sugar Creek Br. Saline Creek 0.114 1,140 Crystal Hills Br. Saline Creek 0.078 1,151 Highway 141 Saline Creek 1.250 13,886 Hunning Hills Br. Saline Creek 0.016 163 Paradise Valley Williams Creek 0.092 537 Pere Cliff MHP Trib. Little Antire Creek 0.002 41 Randolph Hills Subdivision Br. Meramec River 0.009 174 Saline Creek Regional Saline Creek 4.000 22,196 Terry Jean Acres Sugar Creek 0.004 37 Walnut Ridge Antire Creek 0.014 74 Total 5.481 39,801
Source: Northeast Public Sewer District.
Table 1: Northeast Public Sewer District Facilities

_________________________________________________________ 2013 Jefferson County Data Book
57
Rock Creek Public Sewer District is approximately 32 square miles or 20,480 acres. The district’s borders include the watershed that runs south of east and west Rock Creek Road. The west side of the watershed ends at Rock Creek Valley Road. The east side of the watershed is bordered by East Four Ridge Road. The east side of the watershed lies between Shipwatch Road and Telegraph Road and is bordered by the Mississippi River. The Kimmswick Treatment Plant is located adjacent and east of the City of Kimmswick. The effluent from the plant discharges into the Mississippi River. The population of the service area is approximately 25,000 as of 2013. The Rock Creek Public Sewer District has five pump stations. Rock Creek Sewer District has 180 miles of sewer line and 5,000 manholes. The age of the sewer system is 50% over 30 years, 30% over 20 years, 10% over 10 years, and 10% less than 10 years.
Facility Name Watershed Size (MGD)
PE
Kimmwick Plant Serves Rock Creek, but discharges to Mississippi River 4.800 48,000
Godfrey Gardens Joachim Creek 0.012 115
Total 4.812 48,115
The Glaize Creek Public Sewer District (GCPSD) serves portions of the Glaize Creek watershed. The Glaize Creek PSD provides sanitary sewer for commercial and residential uses along Highway M, east of Moss Hollow Road and along the Interstate 55 and U.S. Highway 61-67 corridors in the Barnhart arear. GCPSD is permitted to treat 2-MGD at its facilities located off of Sulphur Springs Road, just west of the Mississippi River.
Facility Name Watershed Size (MGD)
PE
Glaize Creek Plant 1
Mississippi River
1.00
10,000
Glaize Creek Plant 2 Mississippi River 1.00 10,000
Table 2: Rock Creek Public Sewer District Facilities
Table 3: Glaize Creek Public Sewer District Facilities

2013 Jefferson County Data Book _________________________________________________________
58
Other Public Sewer Districts
In addition to the three public sewer districts previously mentioned, there are three additional sewer providers that are classified by MoDNR as public sewer districts. These districts are Lake Adelle Sewer District, Valle Lake Sewer District, Selma Village Public Sewer District and Jefferson County Public Sewer District. The Selma Village Public Sewer District (SVPSD) serves an area southeast of Festus and Crystal City. SVPSD currently is permitted to treat 100,000 gallons per day. However, SVPSD presently treats 30,000 to 40,000 gallons per day, or 300 people. This is the smallest of the public sewer districts. Further information regarding this district is not provided, as it is not classified by the Missouri Department of Natural Resources (MoDNR) as a major treatment facility. The Jefferson County Public Sewer District provides sewer maintenance on five sewer plants outside of city limits and other public sewer districts. The largest sewer plant Jefferson County PSD operates is the Raintree Plantation lake development. Although these districts receive their discharge permits from MoDNR, they service only the households located within their respective subdivision areas and essentially function in the same manner as private sewer companies.
Facility Name Watershed Size (MGD)
PE
Lake Adelle Plant Skullbone Creek 0.050 500
Valle Lake Plant Trib. to Joachim Creek
0.200 2,009
Selma Village Trib. to Muddy Creek 0.150 1,500
Jefferson County PSD
Brookside Parc Sandy Creek 0.010 103
Mirasol Meramec River 0.150 1,500
Raintree Belew’s Creek 0.285 1,600
Sandy Branch Sandy Branch 0.006 89
Sunrise Acres Trib. to Big River 0.004 44
Table 4: Other Public Sewer District Facilities

_________________________________________________________ 2013 Jefferson County Data Book
59
Municipalities
There are seven municipalities that offer their own wastewater treatment services. They are Byrnes Mill, DeSoto, Festus-Crystal City, Herculaneum, Hillsboro, Olympian Village and Pevely. The City of Arnold contracts out its treatment with the Metropolitan Sewer District of St. Louis (MSD), which pumps the waste to a treatment plant on the Meramec River.
Municipality
Facility Name
Watershed
Size (MGD)
PE
Byrnes Mill Byrnes Mill South Trib. to Big River 0.500 5,000 DeSoto DeSoto WWTF Trib. to Joachim Creek 1.400 10,000
Festus Festus Airport Lagoon Plattin Creek 0.020 206 Festus Interim TP Joachim Creek 0.300 3,00 Festus Crystal City STP Plattin Creek 3.000 30,000
Herculaneum Herculaneum WWTF Joachim 1.045 9,450
Hillsboro Brickyard TP Trib. to Cotter Creek 0.098 980 Hillsboro North WWTF Sandy Creek 0.050 500 Hillsboro Wastewater
Reclamation Belew’s Creek 0.500 5,000
Jamestown Trib. to Cotter Creek 0.024 220
Olympian Village
Olympian Village WWTF
Trib. to Plattin Creek .112 1,500
Pevely Hunter’s Glen Trib. to Mississippi River 0.065 675 Pevely WWTP Trib. to Sandy Creek 1.8 18,000
Source: Missouri Department of Natural Resources
Private Sewer Companies
There are three private sewer companies in Jefferson County. They are the House Springs Sewer Company, and Missouri American Water Company. House Springs Sewer Company operates 12 wastewater facilities around the unincorporated area of House Springs. The Missouri American Water Company operates two wastewater facilities in the unincorporated area of Cedar Hill. The MoDNR and the Missouri Public Service Commission (PSC) regulate private sewer companies. The PSC grants “franchise areas” to each of the private companies.
Owner Watershed Total Size (MGD)
PE
House Springs Sewer Company Bear Creek, Dulin Creek, Heads Creek
0.598 6,440
Missouri American Water Company Trib. to Big River, Sand Creek 0.314 3,500
Meramec Sewer Company Meramec 0.209 2,450
Source: Missouri Department of Natural Resources
Table 5: Municipal Wastewater Treatment Facilities
Table 6: Private Wastewater Treatment Facilities

2013 Jefferson County Data Book _________________________________________________________
60
In addition to the public districts and private companies, there are over 100 wastewater permits issued by the Missouri Department of Natural Resources to private citizens, private companies, homeowners associations and other public entities. Water In Jefferson County there are primarily three ways that homes and businesses receive their drinking water: private wells, public water districts, and municipalities.
Private Wells
According to DNR, there are approximately 190 private community wells and 4,154 public wells located throughout the County that provide service to individual homes and businesses. Due to the lack of available information, and the difficulty in providing a reliable analysis, private wells will be discussed no further.
Public Water District There are eleven public water districts that currently serve Jefferson County. Jefferson County Public Water Supply District (PWSD) #1 serves the Arnold area. CWSD #C-1 serves the Imperial,
Barnhart, Sulphur Springs, Otto, Seckman, Shady Valley, and Meramec Heights areas. PWSD #2 serves the Murphy, High Ridge, Parkdale, and part of the City of Byrnes Mill areas. PWSD #3 serves the Fenton and Paulina Hills area. PWSD #5 serves the Hematite, the city of Olympian Village, and the unincorporated area surrounding the eastern part of the city of De Soto. PWSD #6 serves the House Springs, Hoene Springs, Scottsdale, and the other portion of Byrnes Mill areas. PWSD #7 serves Mapaville, Goldman, the western city limits of Pevely and Herculaneum, as well as the northwestern city limits of Festus. PWSD #8 serves the Cedar Hill area. PWSD #10 serves the area around and including the city of Kimmswick. PWSD #12 serves the area south of Festus and Crystal City including the Danby and Selma areas. The Jefferson County Public Sewer District provides development outside of the existing water districts service for maintaining

_________________________________________________________ 2013 Jefferson County Data Book
61
private wells and other water systems.
Water System Name
Population Served
Service Connections
Supply Capacity (MGD)
Avg. Daily Consumption (MGD)
Finished Water Storage (MGD)
PWSD C-1 35,000 12,897 14.000 3.500 6.061 PWSD #1 20,000 7,212 - 2.394 0.000 PWSD #2 20,000 6,352 3.000 1.300 4.095 PWSD #3 16,760 7,111 - 0.980 2.750 PWSD #5 8,500 2,643 0.973 0.600 1.528 PWSD #6 7,235 2,955 0.648 0.570 1.100 PWSD #7 6,100 2,289 2.000 0.509 1.000 PWSD #8 4,600 1,855 0.570 0.313 0.580 PWSD #10 8,750 2,689 - 0.590 1.100 PWSD #12 3,000 1,250 0.230 0.150 0.916
Source: Missouri DNR (2013 Census of Missouri Public Water Systems)
Municipal Water Districts
There are six municipalities that provide water for their residents and businesses. They are Crystal City, De Soto, Festus, Herculaneum, Hillsboro, and Pevely.
Water System Name
Population Served
Service Connections
Supply Capacity (MGD)
Avg. Daily Consumption (MGD)
Finished Water Storage (MGD)
Crystal City
4,010
2,010
0.900
0.484
1.350
De Soto 7,500 2,622 1.500 0.450 1.000 Festus 9,000 5,002 0.899 0.850 1.465 Herculaneum 2,805 1,379 0.748 0.470 0.450 Hillsboro 2,100 1,086 1.300 0.265 0.350 Pevely 4,000 1,535 2.282 0.450 1.901
Source: Missouri DNR (2013 Census of Missouri Public Water Systems)
Table 7: Public Water Supply District Facilities
Table 8: Municipal Water Supply Facilities

2013 Jefferson County Data Book _________________________________________________________
62
Natural Gas Natural gas is provided in Jefferson County by Missouri Natural Gas Company, a subsidiary of Laclede Gas. Missouri Natural Gas Company services an eight county area, mostly south of the St. Louis metropolitan area. The Jefferson County office is located in Festus. The Missouri Natural Gas Company serves approximately 50,000 customers, with approximately 30,000 customers within Jefferson County. Average household use of natural gas tends to be greater in the winter than the summer. The average CFH (cubic foot per hour) per household for winter and summer is 120-150 and 50, respectively. Electric Ameren Missouri is the only public provider of electric service in Jefferson County. The Jefferson County office is located in House Springs. Ameren Missouri provides electricity for 1.2 million customers across central and eastern Missouri. Ameren Missouri generate its power (approximately 10,500 megawatts) from a variety of sources. Within the county, there is one power plant, Rush Island, located south of Festus. This plant serves part of this County and other counties to the south. The northern and western parts of the County are served by power plants located in St. Louis and Franklin Counties. Ameren UE completed the construction of a high voltage line within the northwest portion of Jefferson County that runs from Cedar Hill to St. Louis County. Communications
Communication services offered in the County include telecommunications, paging services, digital and cellular phone service, Internet access, and cable television. All of the national firms as well as many local service providers offer service within Jefferson County.

_________________________________________________________ 2013 Jefferson County Data Book
63
COMMUNITY FACILITIES CHARACTERSITICS
Community Facilities -------------------------------------------------------------------- Page 64 TABLES Educational Attainment of People Aged 25 Years and Older, Jefferson County, 2000 and 2011 ------------------------------------------------------ Page 64 Teacher and Administrative Profiles, 2007-08 and 2011-12 -------------------- Page 65 Student Performance, 2002, 2008 and 2012 ----------------------------------------- Page 65 Student Characteristics, 2007-08 and 2011-12 -------------------------------------- Page 66 Municipal Library Information ------------------------------------------------------- Page 67 Improved Parks owned by Jefferson County -------------------------------------- Page 68 Land Bank Properties owned by Jefferson County------------------------------- Page 68 Parks owned by Municipalities ------------------------------------------------------- Page 70 Parks owned by the State of Missouri ----------------------------------------------- Page 72 Ambulance District ---------------------------------------------------------------------- Page 74 Fire Protection District ----------------------------------------------------------------- Page 76 Criminal Offenses in Jefferson County, 2007 and 2011 -------------------------- Page 78 Criminal Offenses in Jefferson County, 2007 and 2011 -------------------------- Page 79 FIGURES School Districts --------------------------------------------------------------------------- Page 64 Jefferson County Parks ------------------------------------------------------------------ Page 69 Municipal Parks -------------------------------------------------------------------------- Page 71 Dept. of Natural Resources / Dept. of Conservation ---------------------------- Page 72 Ambulance Districts --------------------------------------------------------------------- Page 73 Fire Districts ------------------------------------------------------------------------------- Page 75

2013 Jefferson County Data Book _________________________________________________________
64
Community Facilities General
As Jefferson County continues to suburbanize, the services offered continue to grow and change. Educational opportunities include public schools, private schools, vocational-technical and four-year degree programs. A number of full service libraries are located throughout the County. A variety of parks and recreation opportunities exist in the municipalities and throughout the remainder of the County. Most of the County is protected by the County’s Sheriff’s Department and a number of fire protection districts and ambulance districts.
Education
A variety of educational opportunities are offered throughout Jefferson County. There are 11 public school districts, all which are accredited by the state. All of the districts offer high schools except for Sunrise School District. Following are tables of the statistics for the high schools in the County for 2000 and 2011.
Table 1: Educational Attainment of People Aged 25 Years and Older
Number Percentage
2000 2011* 2000 2011*
Total 25 yrs. and older 125,956 144,284 100.0 100.0 Less than 9th grade 8,247 5,552 6.5 3.8 9th – 12th with no diploma 17,749 13,661 14.1 9.5 High school graduate 45,773 49,290 36.3 34.2 Some college 30,175 37,323 24.0 25.9 Associate Degree 8,722 14,318 6.9 9.9 College Degree 4 plus years and above 15,290 24,140 12.1 16.7
Source: U.S. Census 2000 * Estimate from American Community Survey

_________________________________________________________ 2013 Jefferson County Data Book
65
There are many attributes taken into consideration when rating a school district, such as graduation and attendance rates, teachers’ salaries and years of on the job experience. According to data collected from the Office of Social and Economic Data Analysis for years 2008 and 2012 accredited school districts within Jefferson County rate at or above the state average in many categories. Table 2: Teacher and Administrative Profiles, 2007-08 and 2011-12
Average Teacher Salary $
Average Administration
Salary $
Average Exp. (years)
% Master Degree
Year 2007-08 2011-12 2007-08 2011-12 2007-08 2011-12 2007-08 2011-12
Crystal City 47 $39,106 $43,312 $76,011 $84,264 8.4 10.7 35.4 46.0 De Soto 73 $49,257 $48,815 $86,733 $91,198 12.9 13.2 48.6 62.8 Dunklin R-5 $40,222 $42,963 $81,967 $89,509 11.9 10.4 26.6 22.2 Festus R-6 $45,478 $49,226 $87,469 $91,702 9.8 12.0 45.2 66.2 Fox C-6 $52,339 $55,986 $97,697 $113,284 10.8 12.1 67.8 72.9 Grandview R-2 $37,572 $37,062 $83,786 $89,475 9.6 10.1 39.0 44.1 Hillsboro R-3 $44,666 $45,244 $86,507 $94,785 11.3 10.9 48.4 57.4 Jefferson County R-7 $38,409 $40,087 $77,340 $91,271 8.9 8.6 29.1 56.6 Northwest R-1 $50,980 $56,229 $97,747 $104,259 12.6 14.2 62.0 73.9 Sunrise R-9 $40,617 $38,992 $58,000 $74,000 11.6 11.1 51.9 61.1 Windsor C-1 $41,964 $46,364 $92,004 $89,728 10.1 11.7 38.4 50.4 Missouri $45,027 $46,739 $80,208 $84,776 12.4 12.4 51.3 58.8 Source: Department of Elementary and Secondary Education.
Table 3: Student Performance, 2002, 2008 and 2012
Graduates Scoring at
or above the National
Average on ACT %
Graduation Rate % Graduates entering College %
Year 2002 2008 2012 2002 2008 2012 2002 2008 2012
Crystal City 47 27.3 32.2 34.8 80.9 90.9 85.2 78.2 89.2 82.0 De Soto 73 26.1 36.4 26.5 76.7 89.5 85.3 71.2 61.4 61.2 Dunklin R-5 22.0 28.1 25.3 85.2 85.7 85.6 72.3 54.0 50.5 Festus R-6 40.4 38.5 35.5 83.4 86.5 90.1 68.5 77.0 79.3 Fox C-6 25.9 33.1 32.1 80.7 90.6 92.8 71.3 77.9 71.8 Grandview R-2 38 17.6 25.3 80.7 94.9 95.2 63.2 66.2 70.5 Hillsboro R-3 Jefferson County R7*
25.0 25.8 23.5 --
81.7 --
91.9 89.8 66.9 --
76.7 68.0 -- -- -- -- -- --
Northwest R-1 Sunrise R-9**
25.5 --
28.9 27.4 74.7 --
86.5 85.1 68.0 --
73.0 60.4 -- -- -- -- -- --
Windsor C-1 36.3 30.0 33.8 85.4 96.3 90.3 63.2 67.2 72.0 Missouri 34.8 35.2 26.6 82.5 85.2 88.1 64.4 66.7 68.4
Source: Department of Elementary and Secondary Education. * Jefferson Co. R-7 will not have a graduating class until 2012-13. ** Sunrise R-4 does not have a high school.

2013 Jefferson County Data Book _________________________________________________________
66
Table 4: Student Characteristics, 2007- 08 and 2011-12
Fall Enrollment Attendance Rate % $ Per ADA Student
Students Eligible for Free or Reduced
Lunch (%) Year 2007-08 2011-12 2007-08 2011-12 2007-08 2011-12 2007-08 2011-12
Crystal City 47 718 742 94.0 94.2 $7,400 $7,986 29.5 37.8 De Soto 73 2,860 2,955 95.0 94.7 $8,391 $8,968 45.0 51.9 Dunklin R-5 1,347 1,339 95.0 94.4 $7,755 $9,036 38.3 51.0 Festus R-6 3,103 3,084 94.0 95.1 $6,342 $6,864 31.0 35.1 Fox C-6 11,664 11,690 95.0 94.9 $8,328 $8,728 25.5 30.5 Grandview R-2 829 822 94.0 94.8 $8,008 $8,743 32.3 41.0 Hillsboro R-3 3,691 3,574 95.0 94.4 $7,342 $8,048 25.6 32.7 Jefferson County R-7
691 839 95.0 95.3 $7,843 $8,915 27.0 29.1
Northwest R-1 6,886 6,661 94.0 95.5 $10,106 $8,927 33.6 43.0 Sunrise R-9 326 331 95.0 95.3 $9,310 $8,081 63.6 55.5 Windsor C-1 3,017 3,029 94.0 95.4 $7,958 $7,433 25.5 35.1 Missouri 894,609 889,929 94.0 94.4 $9,338 $9,619 42.1 47.8 Source: Department of Elementary and Secondary Education.
Libraries In 1989, by popular vote, the Jefferson County Library subdistricts of Fox-Windsor and Northwest were established. The Fox-Windsor subdistrict has expanded since then into two separate library systems. All libraries offer a wide variety of additional resources. These include voter registration, summer reading programs, interlibrary loans, tours, preschool storyhours, Internet access, and outreach. The current library system now consists of three branches and the Central Services Office in High Ridge. These are listed below: Windsor Library Arnold Library 7479 Metropolitan Blvd. 1701 Missouri State Road Barnhart, MO 63012 Arnold, MO 63010 PH: (636) 461-1914 PH: (636) 296-2204
Northwest Library Central Services 5680 State Road PP 5678 State Road PP High Ridge, MO 63049 High Ridge, MO 63049 PH: (636) 677-8186 PH: (636) 677-8689 The library system has a total of 242,111 items. The items include books, cassettes, compact discs, reference books, videos, DVDs and maps. In 2012, the three branches of the system circulated 725,897 books and other items, an increase of 1,183 rentals from the 2008 number of 724,714 books and other items. In 2000, the Jefferson County Libraries had a total of 71,288 registered borrowers and in 2012 the library system had 65,814 individual card holders.

_________________________________________________________ 2013 Jefferson County Data Book
67
Four libraries exist in the incorporated areas of Jefferson County. These libraries and their locations are listed below. Table 5. Municipal Library Information, 2012
Library, Address, and Phone Number
Number of Books, including reference volumes
Number of Patrons
Festus Public Library 222 N Mill St. Festus, MO 63028
PH: (636) 937-2017
42,421
11,847
De Soto Public Library 712 Main St. De Soto, MO 63020
PH: (636) 586-3858
32,275
4,703
City of Crystal City Library 736 Mississippi Ave.
Crystal City, MO 63019 PH: (636) 937-7166
28,667
2,443
City of Herculaneum Library 1 Parkwood Ct.
Herculaneum, MO 63048 PH: (636) 479-9164
Not Available
Not Available
Source: Librarians from pertinent library.

2013 Jefferson County Data Book _________________________________________________________
68
Parks and Recreation
Jefferson County offers a variety of parks and recreation activities for the residents of the county. Parks are under the ownership of the county, municipalities, and the State of Missouri. These parks total over 3,800 acres of land, both improved and unimproved. Following is an inventory of the park systems throughout the county. Table 6. Improved Parks owned by Jefferson County.
PARK NAME LOCATION PUBLIC ACREAGE
AREA TYPE
Winter Park Fenton Land-30 & Lake-10 Park / Recreation / Access Rockford Beach House Springs 8.2 Park / Recreation / Access High Ridge Civic Center High Ridge 2 Park / Recreation / Civic Center Cedar Hill Park Cedar Hill 7 Park / Recreation / Access Brown’s Ford Park Ware 3 Access Big River Saddle Club Grubville 10 Park / Recreation Morse Mill Park Morse Mill 10 Park / Recreation / Access Pleasant Valley Nature Preserve High Ridge 40 Park / Recreation / Preserve Sunridge Park Hillsboro 6 Park / Recreation Northwest Jefferson County Athletic Complex
Byrnes Mill 20 Recreation
Source: Jefferson County Parks and Recreation Department.
Jefferson County is currently “Land Banking” properties that have been donated to the people of Jefferson County. “Land Banking” is the practice of acquiring raw land with the intent to hold it until such time as it is practical to develop the property for public use. This decision has been made in reaction to lack of funds necessary to develop the areas for public use. Table 7. Land Bank Properties owned by Jefferson County.
PARK NAME LOCATION PUBLIC ACREAGE
Ball Memorial Park Morse Mill 7 Beck Property Eureka 125 Kimmswick Property Kimmswick 40 River Bend Park High Ridge 30 Stone Bridge Property Festus 12 Source: Jefferson County Parks and Recreation Department.

_________________________________________________________ 2013 Jefferson County Data Book
69

2013 Jefferson County Data Book _________________________________________________________
70
Following is a list of parks within Jefferson County, owned by individual municipalities. Table 8. Parks owned by Municipalities.
PARK NAME LOCATION PUBLIC ACREAGE
AREA TYPE
Sunset Park Festus 20 Park / Recreation South Mill Park Festus 12 Park / Recreation Billy Porter Park Festus 3.5 Park / Recreation South 4th Street Park Festus 2 Park / Recreation West City Park Festus Land-178 & Lake-3 Park/Recreation/Wildlife/Access/Historic Civic Center Festus NA Civic Center Jefferson County YMCA Festus NA Recreational Charles Brown Park Crystal City 0.5 Park / Recreation Hickey-White Park Crystal City 3 Park / Recreation Municipal Crystal City Park Crystal City 26 Park / Recreation Hillsboro City Park Hillsboro 49 Park / Recreation Fletcher House Hillsboro 0.6 Historic Kimmswick City Park Kimmswick 6 City Blocks Park / Recreation Bernhardt Park De Soto 1 City Block Park / Recreation / Historic Walther Park De Soto 25 Park / Recreation Spross Park De Soto 18 Park / Recreation Joachim Park De Soto 1 City Block Park / Recreation Fletcher Park De Soto 1 City Block Park / Recreation East Side Park De Soto 2 City Blocks Park / Recreation Ritcher Park De Soto 3 Park Springdale Park Fenton Land-45 & Pool-1 Park / Recreation Arnold Athletic Association Arnold 40 Recreation Arnold City Park Arnold Land-35 & Lake-17 Park / Recreation Lang Park Arnold 21 Park / Recreation Collins Park Arnold 25 Unimproved Strawberry Creek Park Arnold 121 Nature Area w/Trails Byrnes Mill City Park Byrnes Mill 6 Park / Recreation / Wildlife / Historic The Point Byrnes Mill 2 Historic Source: Jefferson County Parks and Recreation Department-Park Plan, 2001.
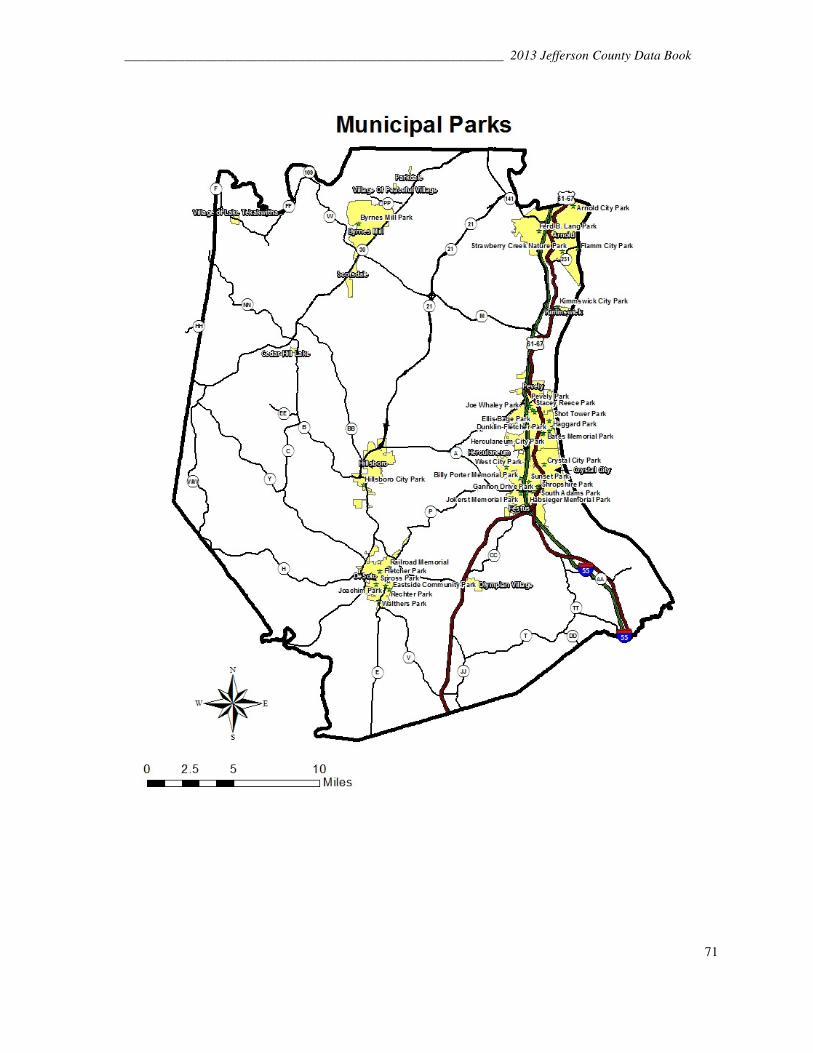
_________________________________________________________ 2013 Jefferson County Data Book
71

2013 Jefferson County Data Book _________________________________________________________
72
The State of Missouri owns 12 various parks throughout the county. Table 9. Parks owned by the State of Missouri.
PARK NAME LOCATION PUBLIC ACREAGE
AREA TYPE
Sandy Creek Covered Bridge
Hillsboro 201 Park / Recreation / Historic
Mastodon State Historic Site
Imperial 425 Park / Recreation / Nature / Preserve / Historic
Blackwell Access De Soto 3 Access Mammoth Access De Soto 5 Access Merrill Access De Soto 74 Access Valley View Glades Hillsboro 225 Forest / Nature Preserve Hilda Young Conservation Area
Eureka 970 Forest / Wildlife / Nature Preserve
Pacific Palisades Conservation Area
Pacific 635 Forest / Wildlife / Access
Victoria Glades Victoria 239 Forest / Nature / Preserve Truman Access South of
Crystal City 14 Access
LEASE SITES
Arnold-Teszars Woods Arnold 52 Forest Arnold-Flamm City Arnold 36 Access Source: Jefferson County Parks and Recreation Department-Park Plan, 2001.
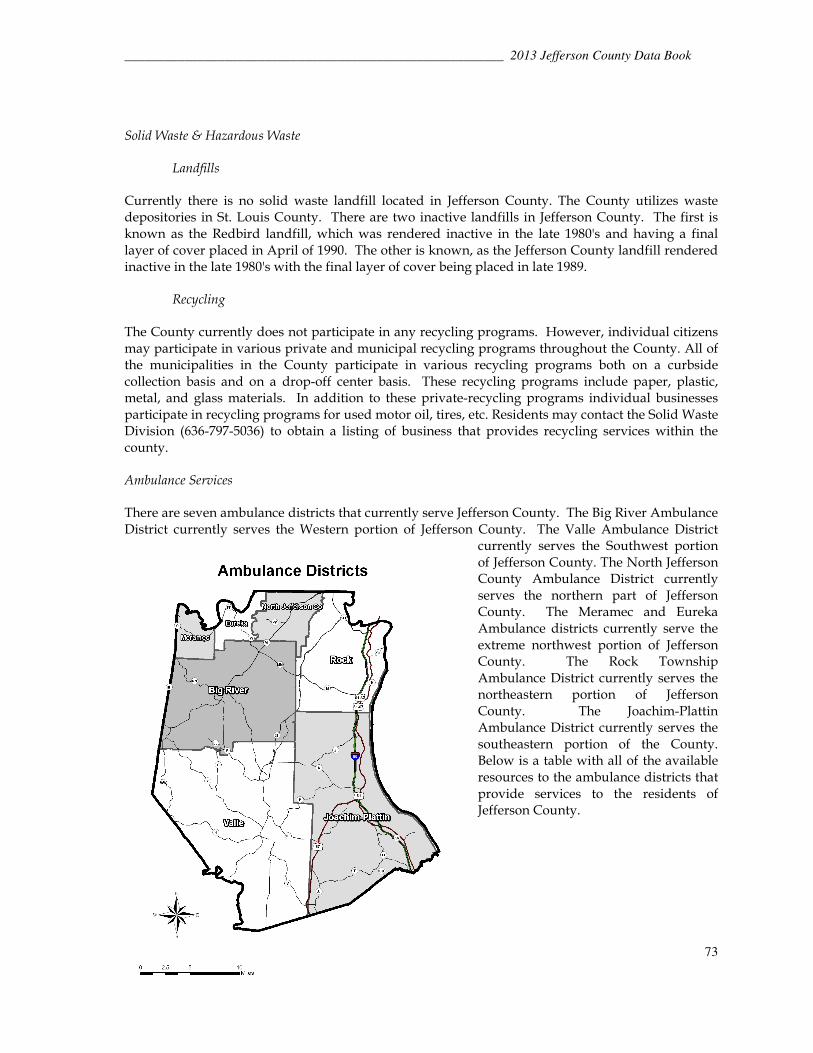
_________________________________________________________ 2013 Jefferson County Data Book
73
Solid Waste & Hazardous Waste
Landfills Currently there is no solid waste landfill located in Jefferson County. The County utilizes waste depositories in St. Louis County. There are two inactive landfills in Jefferson County. The first is known as the Redbird landfill, which was rendered inactive in the late 1980's and having a final layer of cover placed in April of 1990. The other is known, as the Jefferson County landfill rendered inactive in the late 1980's with the final layer of cover being placed in late 1989.
Recycling The County currently does not participate in any recycling programs. However, individual citizens may participate in various private and municipal recycling programs throughout the County. All of the municipalities in the County participate in various recycling programs both on a curbside collection basis and on a drop-off center basis. These recycling programs include paper, plastic, metal, and glass materials. In addition to these private-recycling programs individual businesses participate in recycling programs for used motor oil, tires, etc. Residents may contact the Solid Waste Division (636-797-5036) to obtain a listing of business that provides recycling services within the county. Ambulance Services
There are seven ambulance districts that currently serve Jefferson County. The Big River Ambulance District currently serves the Western portion of Jefferson County. The Valle Ambulance District
currently serves the Southwest portion of Jefferson County. The North Jefferson County Ambulance District currently serves the northern part of Jefferson County. The Meramec and Eureka Ambulance districts currently serve the extreme northwest portion of Jefferson County. The Rock Township Ambulance District currently serves the northeastern portion of Jefferson County. The Joachim-Plattin Ambulance District currently serves the southeastern portion of the County. Below is a table with all of the available resources to the ambulance districts that provide services to the residents of Jefferson County.

2013 Jefferson County Data Book _________________________________________________________
74
Districts Facilities Vehicles Employees
Big River Ambulance District Chief Gary Prasuhn 636-274-3964
House 1 6321 Lorens Lane Cedar Hill, MO 63016 House 2 4795 Tishimingo Rd. Hillsboro, MO 63050 House 3 6969 Wild Cherry House Springs, MO 63051
5
3-maned
15 Full time
24 Part time
Eureka EMS Chief Greg Brown 636-274-3964
House 1 4849 Highway 109 Eureka, MO 63025 House 3 3570 White Oak School Road Eureka, 63025
17 18
Joachim-Plattin Ambulance District Administrator Curt Stueve 636-937-2224
House 1 619 Collins Dr. Festus, MO 63028 House 2 1281 Abbey Ln. Pevely, MO 63070 House 3 2410 Highway 61 Festus, MO 63028 House 4 2986 Parthenon Drive DeSoto, MO 63020
8
4-maned
24 Full time
25 Part time
North Jefferson Ambulance District Administrator John Scullin 636- 677-3399
House 1 2820 Horrell Drive High Ridge, MO 63049
4 12 Full time
32 Part time
Rock Township Ambulance District Chief Margie Sammons 636-296-5066
House 1 1800 Lonedell Rd. Arnold, MO 63010 House 2 4537 Old Highway 21 Imperial, MO 63052 House 3 1501 Prehistoric Hill Imperial, MO 63052
5 34 Full time
23 Part time
Meramec Ambulance District Chief Christine Neal 636-451-5816
House 1 429 E. Osage Pacific, MO 63069 House 2 3279 Highway 100 Villa Ridge, MO 63089 House 3 7390 Highway O Robertsville, MO 63072 House 4 385 Old Manchester Road Pacific, MO 63069
6 27 Full time
20 Part time

_________________________________________________________ 2013 Jefferson County Data Book
75
Valle Ambulance District Chief Jesse Barton 636-586-2132
House 1 12363 Highway 21 DeSoto, MO 63020 House 2 1540 Hillcrest Drive DeSoto, MO 63020 House 3 5379 Highway B Hillsboro, MO 63050
3 18 Full time
18 Part time
Fire Protection Services
Currently there are 18 Fire Protection Districts in the County. These districts serve incorporated as well as unincorporated areas of Jefferson County.
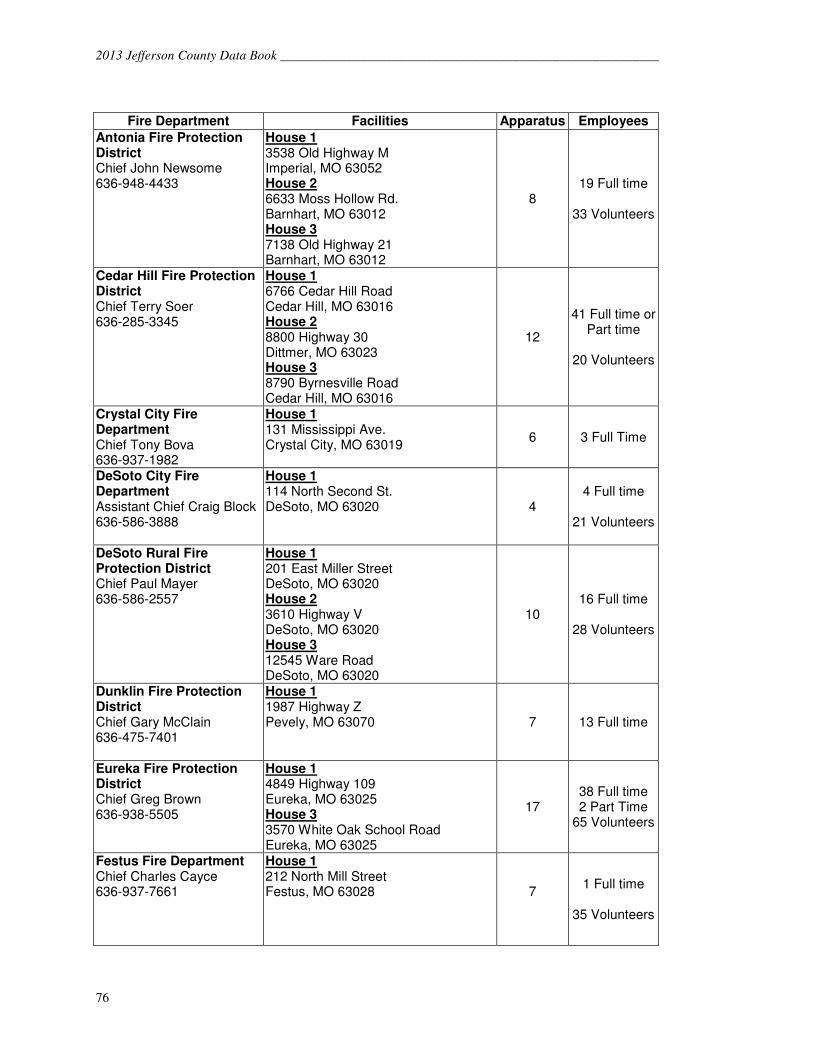
2013 Jefferson County Data Book _________________________________________________________
76
Fire Department Facilities Apparatus Employees
Antonia Fire Protection District Chief John Newsome 636-948-4433
House 1 3538 Old Highway M Imperial, MO 63052 House 2 6633 Moss Hollow Rd. Barnhart, MO 63012 House 3 7138 Old Highway 21 Barnhart, MO 63012
8 19 Full time
33 Volunteers
Cedar Hill Fire Protection District Chief Terry Soer 636-285-3345
House 1 6766 Cedar Hill Road Cedar Hill, MO 63016 House 2 8800 Highway 30 Dittmer, MO 63023 House 3 8790 Byrnesville Road Cedar Hill, MO 63016
12
41 Full time or Part time
20 Volunteers
Crystal City Fire Department Chief Tony Bova 636-937-1982
House 1 131 Mississippi Ave. Crystal City, MO 63019
6 3 Full Time
DeSoto City Fire Department Assistant Chief Craig Block 636-586-3888
House 1 114 North Second St. DeSoto, MO 63020
4 4 Full time
21 Volunteers
DeSoto Rural Fire Protection District Chief Paul Mayer 636-586-2557
House 1 201 East Miller Street DeSoto, MO 63020 House 2 3610 Highway V DeSoto, MO 63020 House 3 12545 Ware Road DeSoto, MO 63020
10 16 Full time
28 Volunteers
Dunklin Fire Protection District Chief Gary McClain 636-475-7401
House 1 1987 Highway Z Pevely, MO 63070 7 13 Full time
Eureka Fire Protection District Chief Greg Brown 636-938-5505
House 1 4849 Highway 109 Eureka, MO 63025 House 3 3570 White Oak School Road Eureka, MO 63025
17 38 Full time 2 Part Time
65 Volunteers
Festus Fire Department Chief Charles Cayce 636-937-7661
House 1 212 North Mill Street Festus, MO 63028
7
1 Full time
35 Volunteers
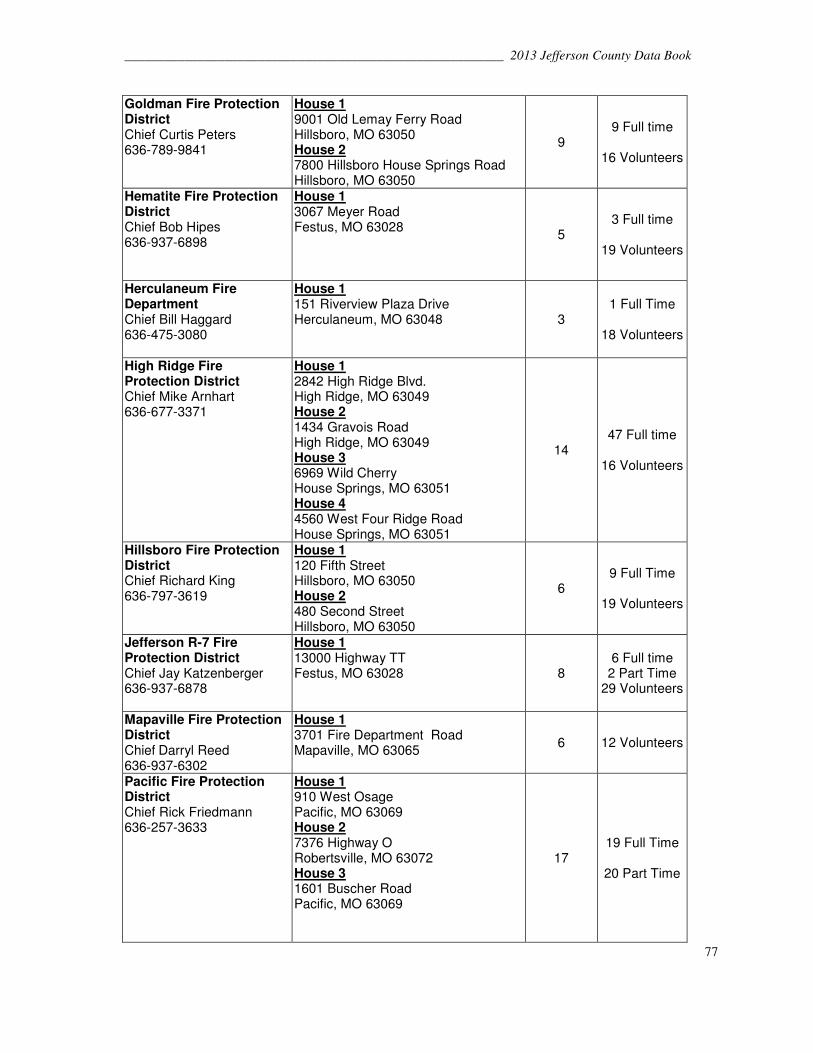
_________________________________________________________ 2013 Jefferson County Data Book
77
Goldman Fire Protection District Chief Curtis Peters 636-789-9841
House 1 9001 Old Lemay Ferry Road Hillsboro, MO 63050 House 2 7800 Hillsboro House Springs Road Hillsboro, MO 63050
9 9 Full time
16 Volunteers
Hematite Fire Protection District Chief Bob Hipes 636-937-6898
House 1 3067 Meyer Road Festus, MO 63028
5 3 Full time
19 Volunteers
Herculaneum Fire Department Chief Bill Haggard 636-475-3080
House 1 151 Riverview Plaza Drive Herculaneum, MO 63048
3 1 Full Time
18 Volunteers
High Ridge Fire Protection District Chief Mike Arnhart 636-677-3371
House 1 2842 High Ridge Blvd. High Ridge, MO 63049 House 2 1434 Gravois Road High Ridge, MO 63049 House 3 6969 Wild Cherry House Springs, MO 63051 House 4 4560 West Four Ridge Road House Springs, MO 63051
14 47 Full time
16 Volunteers
Hillsboro Fire Protection District Chief Richard King 636-797-3619
House 1 120 Fifth Street Hillsboro, MO 63050 House 2 480 Second Street Hillsboro, MO 63050
6 9 Full Time
19 Volunteers
Jefferson R-7 Fire Protection District Chief Jay Katzenberger 636-937-6878
House 1 13000 Highway TT Festus, MO 63028 8
6 Full time 2 Part Time
29 Volunteers
Mapaville Fire Protection District Chief Darryl Reed 636-937-6302
House 1 3701 Fire Department Road Mapaville, MO 63065
6 12 Volunteers
Pacific Fire Protection District Chief Rick Friedmann 636-257-3633
House 1 910 West Osage Pacific, MO 63069 House 2 7376 Highway O Robertsville, MO 63072 House 3 1601 Buscher Road Pacific, MO 63069
17
19 Full Time
20 Part Time

2013 Jefferson County Data Book _________________________________________________________
78
Rock Community Fire Protection District Chief Jim Allred 636-296-2211
House 1 1533 Jeffco Boulevard Arnold, MO 63010 House 2 1299 Main Street Imperial, MO 63052 House 3 3540 Lonedell Road Arnold, MO 63010 House 4 3885 Miller Road Arnold, MO 63010 House 5 (Headquarters) 3749 Telegraph Road Arnold, MO 63010
9
70 Full time
2 Volunteers
Saline Valley Fire Protection District Chief Bob Dunn 636-343-9300
House 1 1771 Springdale Boulevard Fenton, MO 63026 House 2 2198 Saline Road Fenton, MO 63026 House 3 4535 Old Highway 21 Imperial, MO 63052
18
31 Full time
5 Part time
12 Volunteers
Law Enforcement
The majority of the County is patrolled and protected by the Jefferson County Sheriff’s Office, who provides service to all of the unincorporated areas of the County, as well as assistance to incorporated areas of the County. The Sheriff’s Office as well as the County jail, is located at 510 First Street in Hillsboro. The Department currently maintains 3 substations, which are located, respectively, in High Ridge at Gravois Dillon Plaza, in Hillsboro at Jefferson College, and in Imperial at Windsor Harbor Road. The County jail has a capacity of 334 prisoners. Municipalities throughout Jefferson County also provide law enforcement services to their cities. These municipalities are: Arnold, Byrnes Mill, Crystal City, De Soto, Festus, Herculaneum, Hillsboro, and Pevely. Table 9: Criminal Offenses in Jefferson County, 2007 and 2011
Offense Murder Rape Aggravated Assault
Robbery Burglary Larceny Theft
Year 2007 2011 2007 2011 2007 2011 2007 2011 2007 2011 2007 2011
Jefferson CO Rural*
2 6 36 23 342 263 17 12 377 456 2829 1844
Arnold 0 0 2 3 30 18 4 8 68 53 1206 648 Byrnes Mill 0 0 0 0 2 5 0 0 1 0 9 31 Crystal City 0 0 5 2 8 14 5 2 23 25 123 190
De Soto 0 0 0 0 26 22 0 3 26 39 175 253 Festus 0 0 5 4 95 33 3 4 36 35 221 247
Herculaneum 1 0 1 0 1 2 1 0 6 10 302 59 Hillsboro 0 0 0 3 10 6 0 1 6 10 50 61
Kimmswick 0 0 0 0 0 0 0 0 0 0 0 0 Pevely 1 0 2 0 11 12 2 2 17 25 104 91
Source: Missouri State Highway Patrol; Missouri Uniform Crime Reporting Program
* Olympian Village has been rolled up to Jefferson County - Rural
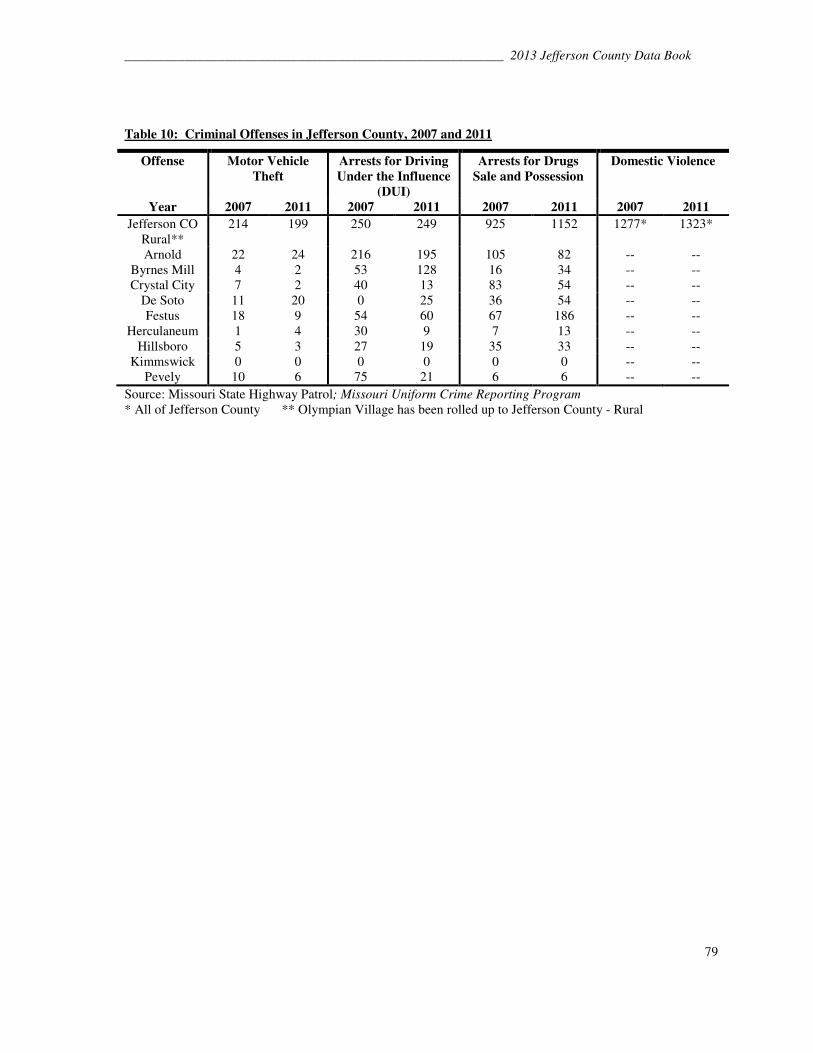
_________________________________________________________ 2013 Jefferson County Data Book
79
Table 10: Criminal Offenses in Jefferson County, 2007 and 2011
Offense Motor Vehicle Theft
Arrests for Driving Under the Influence
(DUI)
Arrests for Drugs Sale and Possession
Domestic Violence
Year 2007 2011 2007 2011 2007 2011 2007 2011
Jefferson CO Rural**
214 199 250 249 925 1152 1277* 1323*
Arnold 22 24 216 195 105 82 -- -- Byrnes Mill 4 2 53 128 16 34 -- -- Crystal City 7 2 40 13 83 54 -- --
De Soto 11 20 0 25 36 54 -- -- Festus 18 9 54 60 67 186 -- --
Herculaneum 1 4 30 9 7 13 -- -- Hillsboro 5 3 27 19 35 33 -- --
Kimmswick 0 0 0 0 0 0 -- -- Pevely 10 6 75 21 6 6 -- --
Source: Missouri State Highway Patrol; Missouri Uniform Crime Reporting Program * All of Jefferson County ** Olympian Village has been rolled up to Jefferson County - Rural

2013 Jefferson County Data Book _________________________________________________________
80
LOCAL GOVERNMENT
Local Government Services ------------------------------------------------------------ Page 81 County & Municipal Profiles ---------------------------------------------------------- Page 83 FIGURES Jefferson County Missouri Representative Districts ------------------------------ Page 87 Jefferson County Missouri Senate Districts ----------------------------------------- Page 87

_________________________________________________________ 2013 Jefferson County Data Book
81
Local Government Services General The citizens of Jefferson County voted in November 2008 to adopt a first-charter form of government that has replaced the three-person Commission operating under the statutory authority of first-class non-charter counties in the State of Missouri. The government has fully transitioned to the seven member council with the November 2010 election. Many of the services provided by the County government are mandated by state law. Still others are provided as a result of action taken by the voters of Jefferson County. Most of the municipalities offer services similar to that of the County, though they still rely on the County for essential services such as tax assessment, and judicial services. Services offered by Jefferson County Below are some of the basic services offered by the County government: Revenue
Tax Assessment - Jefferson County Tax Assessor's Office Tax Collection - Jefferson County Tax Collector's Office Deed Recording - Jefferson County Recorder of Deeds Mapping - Jefferson County Tax Assessor's Office Licensing - Jefferson County Tax Collector's Office Jefferson County Clerk's Office (Liquor Only)
Financial Management - Jefferson County Treasurer’s Office - Jefferson County Auditor’s Office Justice Services
Prosecution - Jefferson County Prosecuting Attorney’s Office County Jail - Jefferson County Sheriff’s Department Probation & Parole - 23rd Judicial Circuit Court
Courts/Judicial Administration
Circuit Court - 23rd Judicial Circuit Court Juvenile Justice - 23rd Judicial Circuit Court Bailiff Services - Jefferson County Sheriff’s Department Court Clerk - 23rd Judicial Circuit Court Clerk’s Office
Public Works
County Engineering - Jefferson County Department of Public Works Highways/Bridges - Jefferson County Highway Department County Buildings - Jefferson County Maintenance Division
- Jefferson County Housekeeping Division
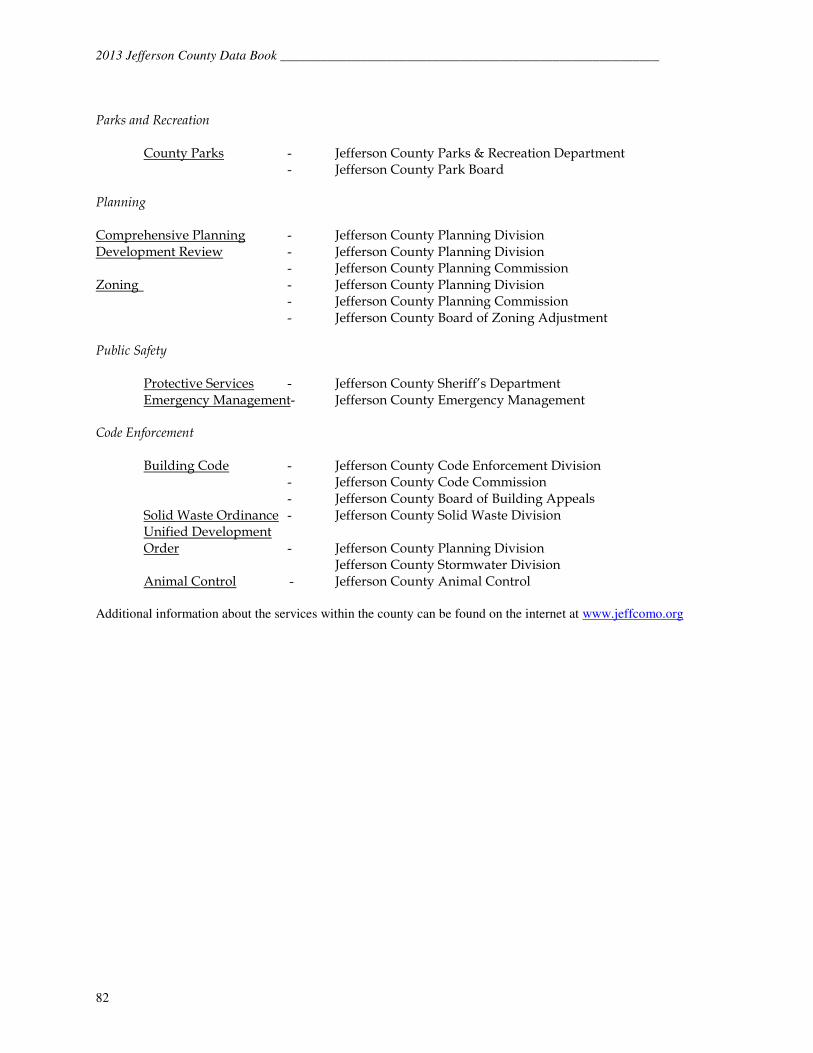
2013 Jefferson County Data Book _________________________________________________________
82
Parks and Recreation
County Parks - Jefferson County Parks & Recreation Department - Jefferson County Park Board
Planning Comprehensive Planning - Jefferson County Planning Division Development Review - Jefferson County Planning Division
- Jefferson County Planning Commission Zoning - Jefferson County Planning Division
- Jefferson County Planning Commission - Jefferson County Board of Zoning Adjustment
Public Safety
Protective Services - Jefferson County Sheriff’s Department Emergency Management- Jefferson County Emergency Management Code Enforcement
Building Code - Jefferson County Code Enforcement Division - Jefferson County Code Commission - Jefferson County Board of Building Appeals
Solid Waste Ordinance - Jefferson County Solid Waste Division Unified Development Order - Jefferson County Planning Division Jefferson County Stormwater Division
Animal Control - Jefferson County Animal Control Additional information about the services within the county can be found on the internet at www.jeffcomo.org
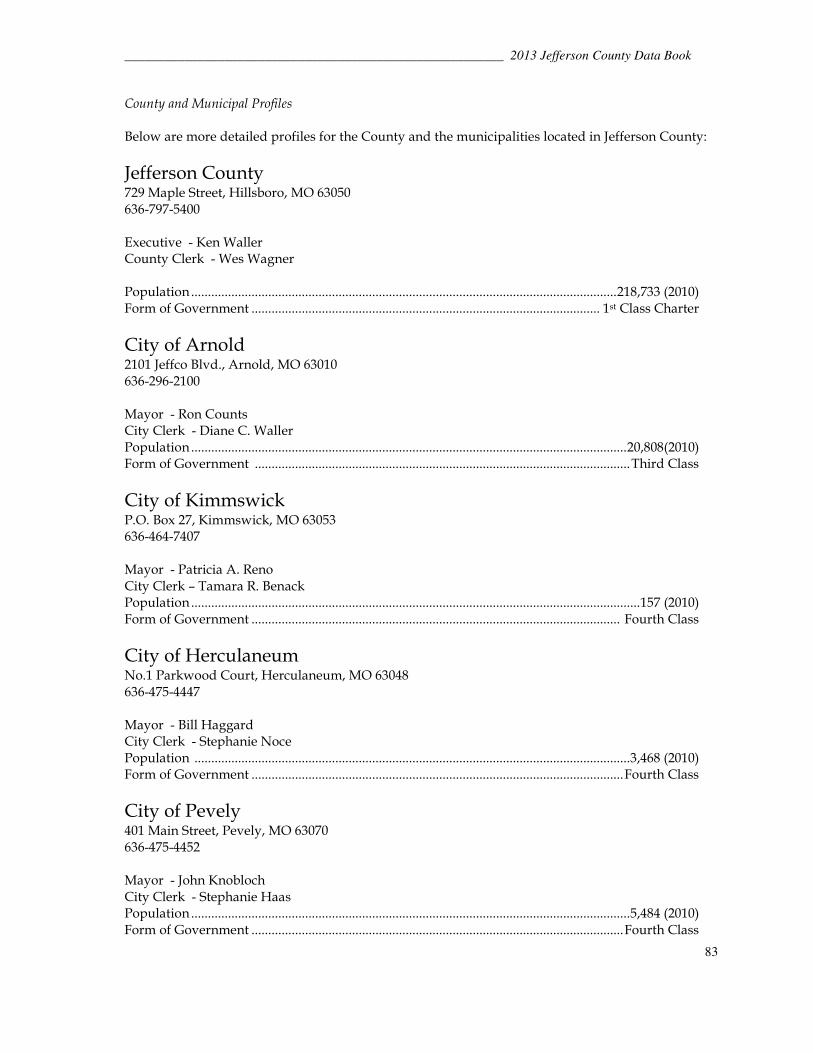
_________________________________________________________ 2013 Jefferson County Data Book
83
County and Municipal Profiles Below are more detailed profiles for the County and the municipalities located in Jefferson County:
Jefferson County 729 Maple Street, Hillsboro, MO 63050 636-797-5400 Executive - Ken Waller County Clerk - Wes Wagner
Population ............................................................................................................................... 218,733 (2010) Form of Government ........................................................................................................ 1st Class Charter
City of Arnold 2101 Jeffco Blvd., Arnold, MO 63010 636-296-2100 Mayor - Ron Counts City Clerk - Diane C. Waller Population .................................................................................................................................. 20,808(2010) Form of Government ................................................................................................................ Third Class
City of Kimmswick P.O. Box 27, Kimmswick, MO 63053 636-464-7407 Mayor - Patricia A. Reno City Clerk – Tamara R. Benack Population ...................................................................................................................................... 157 (2010) Form of Government .............................................................................................................. Fourth Class
City of Herculaneum No.1 Parkwood Court, Herculaneum, MO 63048 636-475-4447 Mayor - Bill Haggard City Clerk - Stephanie Noce Population .................................................................................................................................. 3,468 (2010) Form of Government ............................................................................................................... Fourth Class
City of Pevely 401 Main Street, Pevely, MO 63070 636-475-4452 Mayor - John Knobloch City Clerk - Stephanie Haas Population ................................................................................................................................... 5,484 (2010) Form of Government ............................................................................................................... Fourth Class

2013 Jefferson County Data Book _________________________________________________________
84
City of Crystal City 130 Mississippi Avenue, Crystal City, MO 63019 636-937-4614 Mayor - Thomas V. Schilly City Clerk - Debbie Johns Population .................................................................................................................................. 4,855 (2010) Form of Government ................................................................................................................ Third Class
City of Festus 711 West Main Street, Festus, MO 63028 636- 937-4694 Mayor – Mike Cage City Administrator – Happy Welch Population................................................................................................................................. 11,602 (2010) Form of Government ................................................................................................................. Third Class
City of Olympian Village 205 Kronos, De Soto, MO 63020 636-586-5452 Mayor - Raymond Paul City Clerk - Julie Turner Population..................................................................................................................................... 774 (2010) Form of Government ............................................................................................................... Fourth Class
City of De Soto 17 Boyd Street, De Soto, MO 63020 636- 586-3326 Mayor – Rick Lane City Manager - David Dews Population................................................................................................................................... 6,400 (2010) Form of Government ................................................................................................................. Third Class
City of Hillsboro 101 Main Street, Hillsboro, MO 63050 636-797-3334 Mayor - Frank Roland Jr. City Administrator - Gery Marmaduke Population................................................................................................................................... 2,821 (2010) Form of Government ............................................................................................................... Fourth Class

_________________________________________________________ 2013 Jefferson County Data Book
85
City of Byrnes Mill 127 Osage Executive Drive, PO Box 255, Byrnes Mill, MO 63051 636-677-7727 Mayor - Susan Gibson City Clerk - Debbie LaVenture Population ................................................................................................................................... 2,781 (2010) Form of Government ............................................................................................................... Fourth Class
Town of Scotsdale P.O. Box 37, House Springs, MO 63051 636-671-0650 Board Chairmen- Terisa Koehler City Clerk – Justin Campbell Population ...................................................................................................................................... 222 (2010) Form of Government .......................................................................................................................... Town
Village of Cedar Hill Lakes PO Box 64, Cedar Hill, MO 63016 636-285-8804 Board Chairperson – Bob Crist Village Clerk – Julia Terry Population ......................................................................................................................................237 (2010) Form of Government ......................................................................................................................... Village
Village of Lake Tekakwitha Address - Unknown Phone Number - Unknown Board Member – Joseph Bowers Clerk - Unknown Population ...................................................................................................................................... 254 (2010) Form of Government ......................................................................................................................... Village
Village of Parkdale P.O. Box 606, High Ridge, MO 63049 636-677-8222 Chairmen of the Board – Michael Humes Clerk- Sherry Schlichtig Population ...................................................................................................................................... 170 (2010) Form of Government ......................................................................................................................... Village

2013 Jefferson County Data Book _________________________________________________________
86
Village of Peaceful Village 2828 All God’s Children Drive, High Ridge, MO 63049 Phone Number - Unknown Board Member - Jack Walters Clerk- Unknown Population.......................................................................................................................................... 9 (2009) Form of Government ......................................................................................................................... Village

_________________________________________________________ 2013 Jefferson County Data Book
87
97th District Representative - John McCaherty–R 111st District Representative
- Michael Frame–D 112nd District Representative
- Paul Wieland–R 113rd District Representative - Jeff Roorda–D 114th District Representative
- TJ McKenna–D 115th District Representative
- Elaine Gannon–R 118th District Representative
- Ben Harris–D
22nd District Senator -Ryan McKenna-D
3rd District Senator
-Gary Romine-R


_________________________________________________________ 2013 Jefferson County Data Book
88