júlia varga labour market success of hungarian higher ... · júlia varga labour market success of...
TRANSCRIPT

143
Júlia Varga
LABoUR MARKet sUCCess oF HUnGARIAn HIGHeR eDUCAtIon GRADUAtes In 2011
Introduction
Based on the data of Higher Education Graduates’ Survey 2011 (Graduates 2011) this chapter investigates early labour market success of young higher education graduates. The survey collected data on the labour market situation of graduates of higher education from 2008 and 2010. The analysis focuses on two questions: fi rst, what are the diff erences in labour market success of graduates by fi eld of study at the beginning of their career? Second: are there diff erences in labour market suc-cess at labour market entry between the two groups, those who graduated in 2008 and those who graduated in 2010?
Previous works for other countries and for Hungary have found large varia-tion in labour market success of higher education graduates by fi eld of study. Grubb (1992), Rumberger–Thomas (1993) for the US, Finnie–Frenette (2003) for Canada, Bratti et al. (2005), Chevalier et al. (2002), Walker and Zhu (2005), Chevalier (2011) for the UK, Buonanno–Pozzoli (2007), Brunello–Cappellari (2005) for Italy, Liva-nos–Pouliakas (2009) for Greece, and Machin and Puhani (2006) for France, Ger-many and the US investigated the question for example. All of these studies have found that there is large variation in labour market success of graduates. In most cases it has been revealed that returns to engineering, economics and business and in some cases to medical studies and social studies are signifi cantly higher than those of the arts, humanities or education. Earlier studies for Hungary, those that used data of FIDEV survey (Galasi, 2002, 2004a, 2004b, 2007; Galasi–Varga, 2006) and those that used data of Hungarian Higher Education Graduate Career Track-ing 2010 (Varga, 2010) investigated the eff ect of fi eld of study on labour market success of graduates. The results show that there were small if any changes in the rank order of labour market success by fi elds of study between the late 1990s and 2007. Comparison of the two cohorts, those who graduated in 2008 and those in 2010 is interesting because we have no other information about whether or not the economic crises have had diff erent eff ects on early labour market success of young graduates by their subject degree.
DPR_angol.indd 143 3/14/13 12:40 PM

144
Labour market success in 2011
Labour market success of higher education graduates – a descriptive analysis
In 2010, 78% of young graduates was employed 7.5% of them defi ned themselves as un-employed 9% studied at full time education and 5.7% was other inactive (on childcare subsidy, homemaker or other dependent). In the sample some of the graduates fi nished their studies in 2008, while others in 2010. The two groups – those who graduated in 2008 and those who graduated in 2010 – have diff erent potential years of experience. The members of the latter group fi nished their studies 6 or 7 months before the sur-vey while the members of the fi rst group might have graduated 32 months before the survey. Due to the fact that the chances to fi nd employment of the members of the two groups seems to be diff erent, the distribution of the two groups by employment status will be studied separately. Figure 1 shows the distribution of young graduates by em-ployment status by the year of graduation and their fi eld of study.
The employment rate of the 2008 cohort is higher; the unemployment rate is lower than the employment and unemployment rates of the 2010 cohort. The share of full-time students is lower in the 2008 cohort than in the 2010 cohort. The share of those who are in other inactive status is much higher among 2008 graduates than among those who graduated in 2010. The employment rate is rather high among 2008 year graduates it was 85% in 2011. There are two fi elds of studies that show a much lower employment rate than the average: only 73% of those who studied natural sciences and mathematics and graduated in 2008 were employed in 2011, and only 66% of the same cohort who studied arts was employed. The low employment rate of the fi rst group can be attributed to the fact that the rate of graduates of natural sciences and mathemat-ics who are studying in full-time education three years after graduatin is much higher than the average. In February 2011 18% of them were full time students. The share of the other inactive was extremely high among graduates of art management.
The average employment rate of the 2010 cohort was 71% in 2011. Graduates of teacher training, law and administration, information technology, and medical and health care studies have above average employment rates. The lowest employment rates characterize graduates of natural sciences, humanities, social sciences and art manage-ment. The reason for the low employment rates of the fi rst three fi elds is that graduates with these degree subjects are studying in full time education in above average ratio, while graduates of art management are unemployed in the 2010 cohort in an extremely high ratio. 4% of 2008-year graduates and 10% of 2010-year graduates said that they were unemployed in 2011. Comparison of unemployment rates in the two cohorts by fi eld of study shows that graduates of agricultural, humanities and social sciences are unemployed in above average ratio in both cohorts. Among graduates with the degree subjects of art and art management only those have above average unemployment rates who graduated in 2010. It seems that graduates of these fi elds of studies leave the labour market and became ‘other inactive’ haven’t they found an appropriate job before.
J Ú L I A VA R G A
DPR_angol.indd 144 3/14/13 12:40 PM

145L A B O U R M A R K E T S U C C E S S O F H U N G A R I A N H I G H E R E D U C A T I O N G R A D U A T E S I N 2 011
Source: Graduates 2011 (Frissdiplomások 2011 ) Educatio Public Services Non-profi t LLC
Figure 1b. Distribution of graduates by labour market status (%)
Ratio of full-time students
0 010 1020 2030 3040 40
Graduated in 2008 Graduated in 2010
Technology Information technology
Social sciences Agriculture
Agriculture Average
Humanities Technology
Information technology Economics
Economics Medical and health sciences
Law and administration
Law and administration
Teacher training Teacher training
Average Social sciencesMedical and health
sciences Humanities
Natural sience Natural sience
Source: Graduates 2011 (Frissdiplomások 2011 ) Educatio Public Services Non-profi t LLC
Figure 1a. Distribution of graduates by labour market status (%)
Ratio of employed
0 020 2040 4060 6080 80100 100
Graduated in 2008 Graduated in 2010
Law and administration
Law and administration
Agriculture Agriculture
Average Average
Social sciences Social sciences
Medical and health sciences
Medical and health sciences
Humanities Humanities
Teacher training Teacher training
Natural sience Natural sience
Economics Economics
Technology TechnologyInformation technology
Information technology
DPR_angol.indd 145 3/14/13 12:40 PM

146 J Ú L I A VA R G A
Source: Graduates 2011 (Frissdiplomások 2011 ) Educatio Public Services Non-profi t LLC
Figure 1d. Distribution of graduates by labour market status (%)
Ratio of other inactives
Source: Graduates 2011 (Frissdiplomások 2011 ) Educatio Public Services Non-profi t LLC
Figure 1c. Distribution of graduates by labour market status (%)
Ratio of unemployed
0 05 510 1015 1520 20
Graduated in 2008 Graduated in 2010
Humanities Humanities
Law and administration
Law and administration
Average Average
Natural sience Natural sience
Technology Technology
Information technology
Information technology
Medical and health sciences
Medical and health sciences
Economics Economics
Agriculture Agriculture
Social sciences Social sciences
Teacher training Teacher training
0 05 510 1015 1520 20
Graduated in 2008 Graduated in 2010
Average Average
Social sciences Social sciences
Natural science Natural science
Agriculture Agriculture
Economics Economics
Law and administration
Law and administration
Technology Technology
Information technology
Information technology
Humanities HumanitiesMedical and health
sciencesMedical and health
sciencesTeacher training Teacher training
DPR_angol.indd 146 3/14/13 12:40 PM

147L A B O U R M A R K E T S U C C E S S O F H U N G A R I A N H I G H E R E D U C A T I O N G R A D U A T E S I N 2 011
The diff erence in the distribution of young graduates by employment status may be caused by two factors. First, the two cohorts those who graduated in 2008, and those who graduated in 2010 have diff erent potential years of experience. The tran-sition from education to work is fi rst characterized by a searching period, which might involve postponing entry into employment, but later on labour market state of graduates may become more stable. As time passes by after graduation the share of unemployed and full time students’ decreases among graduates and the share of employed increases. At the same time, as time passes by, more graduates establish a family and become parents so they shift to other inactive status (childcare sub-sidy, homemaker). The better labour market position of the 2008-year cohort may be simply the result of these changes. Nevertheless, the reason for the diff erence be-tween the two cohorts may also be due to the worsening of labour market prospects of graduates and young career beginners between 2008 and 2010. As we do not have data on what was the labour market position of the 2008-year cohort after one year of graduation we cannot separate the two eff ects.
We know from the survey for both groups how much time it took to fi nd their fi rst job and the lengthening of this period may refl ect the worsening of labour market prospects of young career beginners.
Employment rates for both cohorts, the 2008-year graduates as well as the 2010-year graduates been was 81%, but the average duration for fi nding a fi rst job after graduation was longer for the 2010-year cohort than for the 2008-year cohort. 30% of graduates who graduated in 2010 have found their fi rst job in one month after graduation, while 36% of 2008-year graduates. The average duration of fi nding a fi rst job is longer for the 2010-year graduates, 3.6 months as opposed to 3.2 months of 2008-year graduates.
Changes in the average duration of fi nding a fi rst job by fi eld specialization show that for most specialisations the average duration has increased, for those graduates who have BA/BSc or college-level degree in a larger extent than for graduates with MA/MSc, or university degree. The increase in the duration of fi nding a fi rst job was extremely high for graduates of teacher training and social sciences. For graduates of some specialisations with diff erent levels of degree the duration of fi nding a fi rst job has changed in the opposite direction. For graduates of humanities and technical science the duration of fi nding a fi rst job has increased for career beginners with higher-level degrees and decreased for graduates with BA/BSc, or college-level degrees. The opposite changes took place for graduates of information technology. While the duration of fi nding a fi rst job has increased for graduates with BA/BSc or college-level degrees it has decreased graduates with MA/MSc, or university level degree with this degree subject. Finally, the duration of fi nding a fi rst job for graduates of law and administration and information tech-nology was shorter for the 2010-year cohort than for the 2008-year cohort both for graduates with BA/BSc or college-level degrees and for graduates with MA/MSc or university-level degrees.
DPR_angol.indd 147 3/14/13 12:40 PM

148 J Ú L I A VA R G A
Source: Graduates 2011 (Frissdiplomások 2011) Educatio Public Services Non-profi t LLC
Field of study BA/BSc or college-level degree
MA/MSc, or university-level degree
graduated in 2008
graduated in 2010
graduated in 2008
graduated in 2010
Humanities 3.7 3.3 2.8 3.6
Economics 2.8 3.8 3.1 3.7
Information technology 2.6 3.4 4.1 2.6
Law and administration 4.0 3.1 3.8 3.1
Technology 4.5 3.5 3.3 3.9
Medical and health science 2.6 3.2 2.8 3.9
Teacher training 2.6 4.3 2.7 4.7
Social science 1.9 3.5 2.4 3.3
Natural science 2.8 3.4 3.2 3.6
Average 3.3 3.5 3.4 3.6
Table 1. Duration of fi nding a fi rst job (months)
In addition to employment status and the duration of fi nding a fi rst job the most im-portant indicator of labour market success of fresh graduates is earnings. We investi-gate earnings of the two cohorts separately, as earnings usually increase with experi-ence and those who graduated in 2008 have two more potential years of experience than those who graduated in 2010, so we expect lower earnings for the latter group.
According to the data of the survey the net monthly earnings of the 2008 cohort was 172,000 HUF at the beginning of 2011 and 148,000 HUF for the 2010 cohort. Net monthly earnings of graduates with BA/BSc or college degree was 157,000 HUF for the 2008 cohort and 137,000 HUF for the 2010 cohort, while of graduates with MA/MSc degree was 193,000 HUF for the 2008 cohort and 162,000 for the 2010 cohort.
Simple comparison of average earnings (Table 2) of young graduates shows that in both cohorts the highest earnings were gained by career beginners who graduated from informatics, engineering, defence and military studies, economics and business, and the lowest earnings by graduates of art management, teacher training, social sci-ences and agricultural sciences. Graduates of fi eld specialization natural sciences and mathematics have below average earnings in both cohorts, but the lag behind the aver-age was smaller for the 2010-year graduates than for the 2008-year graduates.
DPR_angol.indd 148 3/14/13 12:40 PM

149
The average lag in earnings behind the average of graduates for the worst-paying specialisations were higher for graduates who fi nished their studies in 2008 than for those who graduated in 2010, while the average gain for the best paying fi elds was higher for those who graduated in 2010 than for those who graduated in 2008. It seems that not only starting wages are higher for the best-paying specialisations than the average, but later on earnings are increasing more for graduates of the best-paying fi elds while the increase of earnings is smaller with years of experience for specialisations which provide below average starting salaries. As a consequence the lag behind the average earnings is increasing for the latter group. For instance, grad-
L A B O U R M A R K E T S U C C E S S O F H U N G A R I A N H I G H E R E D U C A T I O N G R A D U A T E S I N 2 011
Field of study Graduated in 2008 Graduated in 2010
Total
BA/BSc, or college-
level degree
MA/MSc, or university-
level degree
Total
BA/BSc, or college-
level degree
MA/MSc, or
university-level
degree
Agriculture 147 141 149 135 126 140
Humanities 198 183 238 164 152 188
Economics 252 207 294 192 166 227
Information technology 173 162 179 145 129 153
Law and administration 208 186 241 176 162 193
Technology 137 112 173 126 105 148
Arts 101 101 - 93 93 94
Arts management 200 171 221 165 148 195
National defence and military 166 133 236 142 125 165
Medical and health sciences 114 113 129 118 113 128
Teacher training 127 126 132 137 138 133
Sport science 151 138 166 128 126 134
Social sciences 143 118 154 139 117 148
Natural sciences 172 157 193 148 137 162
Average 172 157 193 148 137 162
Table 2. Net monthly average earnings by fi eld of study, year of graduation and level of degree (1,000 HUF)
Source: Graduates 2011 (Frissdiplomások 2011) Educatio Public Services Non-profi t LLC
DPR_angol.indd 149 3/14/13 12:40 PM

150
uates who fi nished their studies in teacher training with BA/BSc or college-level degree earned 82% of average earnings of graduates with the same level of degree while career beginners who graduated in 2008 earned 72% of the average. There is even a higher diff erence for graduates with MA/MSc or university level degree. The earnings of graduates who fi nished their studies in 2010 with MA/MSc or univer-sity-level degree were 79% of average graduate earnings and the earnings of gradu-ates who fi nished their studies in 2008 were 67% of average graduate earnings.
Those specialisation assure the best labour market prospects which provide above average earnings, and where the duration of fi nding a fi rst job is below aver-age. Figures 3 and 4 show average earnings of graduates by fi eld specialization as a ratio of average graduate earnings and average duration of fi nding a fi rst job by fi eld specialization as a ratio of average duration of fi nding a fi rst job.
BA/BSc or college level degree graduates in informatics, economics and defence and military had the best labour market position out of the 2008 year cohort. For them the above average earnings were coupled with below average duration of fi nd-ing fi rst job (Figure 2).
Graduates of fi eld specialization informatics and defence and military studies of the 2010 cohort were still in the best labour market position. From this cohort graduates whose degree subject was engineering have got into the best group also because their duration of fi nding fi rst job has decreased below the average. On the contrary duration of fi nding fi rst job for graduates from fi eld specialization eco-nomics and business has increased and although they still earned above average earnings their labour market position has slightly worsened. In both cohorts gradu-ates from art management were in the worst labour market position as for them the below average earnings were coupled with above average duration of fi nding a job. There are some fi eld specializations which have got into the worst group by 2010, as not only the earnings were below average in that year as in 2008, but the duration of fi nding fi rst job has also increased above average. Graduates of teacher training and agricultural studies belong to this group.
There was only one fi eld specialization of graduates with MA/MSc or university-level degree who had better position than the average in both labor market success indicators both in 2008 and in 2010, graduates with degree subject defence and mili-tary (Figure 3). In the 2008 cohort graduates from fi eld specialization economics and business and medical studies are also in the best group. It is worth mentioning that the above avarage earnings of graduates with degree subject medical studies are due to the above average earnings of those graduates who are working abroad. In the 2010 cohort graduates from fi eld specialization defence and military and informatics had better than the average position in both labour market success indicators. Gradutaes from engineering, economics and business and medical studies still had higher earn-ings than the average but the duration to fi nd fi rst job has increased for them.
Graduates with MA/MSc or university degree from agricultural studies and arts were in the worst position both in the 2008 and the 2010 cohort, their earnings
J Ú L I A VA R G A
DPR_angol.indd 150 3/14/13 12:40 PM

151
Figure 2. Average net monthly earnings of graduates from different fi elds of study as a ratio of net monthly earnings of graduates and average duration of fi nd-ing fi rst job of graduates from different fi elds of study as a ratio of average duration of fi nding fi rst job of graduates BA/BSc or college-level degree
Law and administration
1.4
Social sciences Humanities
Duration of fi nding 1st job
Net
mon
thly
ear
ning
sN
et m
onth
ly e
arni
ngs
Informatics
Teacher training
Agriculture
0.6
0.6 0.8 1 1.2
0.8
1.2
1.4
1
Economics
Medical and health sciences
Natural sciences
Technology
2008
Duration of fi nding 1st job
Economics
Informatics
Technology
Natural sciences
Teacher training
Agriculture
0,8
0.8 0.9 1 1.1 1.2
0.9
1.1
1.2
1
Social sciences
Medical and health sciencesHumanities
Law and administration
Source: Graduates 2011 (Frissdiplomások 2011 ) Educatio Public Services Non-profi t LLC
2010
L A B O U R M A R K E T S U C C E S S O F H U N G A R I A N H I G H E R E D U C A T I O N G R A D U A T E S I N 2 011
DPR_angol.indd 151 3/14/13 12:40 PM

152 J Ú L I A VA R G A
Figure 3. Average net monthly earnings of graduates from different fi elds of study as a ratio of net monthly earnings of graduates and average duration of fi nd-ing fi rst job of graduates from different fi elds of study as a ratio of average duration of fi nding fi rst job of graduates MA/MSc or university level degree
Duration of fi nding 1st job
Net
mon
thly
ear
ning
s
0,6
0,5 1 1,5 2 2,5
0,8
1,2
1,4
1,6
1Law and administration
Informatics
Technology
Agriculture
EconomicsMedical and health sciences
Natural sciences
Social sciences
Humanities
Teacher training
Source: Graduates 2011 (Frissdiplomások 2011 ) Educatio Public Services Non-profi t LLC
Duration of fi nding 1st job
Humanities
Informatics
Agriculture
0.8
0.6 0.8 1 1.2 1.4
1
1.4
1.2Economics
Medical and health sciences
Natural sciences
Technology
Teacher trainingSocial sciences
Law and administration
2008
2010
Net
mon
thly
ear
ning
s
DPR_angol.indd 152 3/14/13 12:40 PM

153
were below average and duration of fi nding fi rst job was above average. In the 2010 cohort graduates from some other fi eld specializations also got into that category: teacher training and sport studies because in 2010 not only earnings were below average of graduates from these fi eld specializations but the duration of fi nding fi rst job has incresed above the average for them.
The survey asked young graduates what level of degree and what fi eld special-ization would be adequate for their current job. With the help of these answers I have created two indicators. The fi rst one shows the qualifi cation and job match in terms of level of degree. Those were classifi ed to the non-matching category who answered that their job needs a lower qualifi cation than the qualifi cation ob-tained by them. It means that the share of graduates in non-matching occupations shows the share of graduates who feel to be overeducated for their current job. The other indicator shows whether the current job of the graduate fi ts to the fi eld of study of him or her. Those answers were classifi ed as ‘matching’ when the gradu-ates thought that the adequate fi eld specialization for their current job was their degree subject or related subjects. The non-matching group consists of graduates who thought that other or any subjects fi t to their current jobs. Table 3 shows the share of graduates in matching jobs in terms of degree of qualifi cation in the 2008 and 2010 cohorts, and Table 4 shows the share of the graduates in matching jobs in terms of fi eld of study in view of graduates.
L A B O U R M A R K E T S U C C E S S O F H U N G A R I A N H I G H E R E D U C A T I O N G R A D U A T E S I N 2 011
Field of study Graduated in 2008 Graduated in 2010
Agriculture 75.2 72.7
Humanities 80.5 72.0
Economics 81.8 78.9
Information technology 89.9 89.7
Law and administration 90.2 86.7
Technology 86.5 83.5
Medical and health sciences 83.2 83.1
Teacher training 80.4 84.9
Social sciences 86.3 73.2
Natural sciences 86.7 75.4
Average 83.7 79.0
Table 3. Share of graduates in ‘matching’ jobs by fi eld of study and year of graduation In terms of level of degree (%)
Source: Graduates 2011 (Frissdiplomások 2011 ) Educatio Public Services Non-profi t LLC
DPR_angol.indd 153 3/14/13 12:40 PM
154
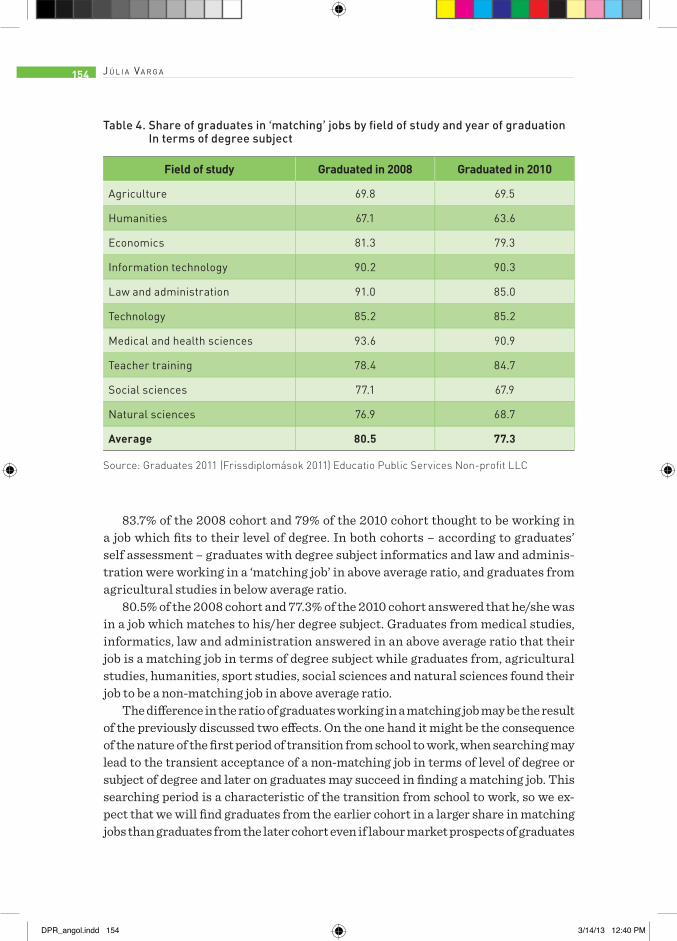
83.7% of the 2008 cohort and 79% of the 2010 cohort thought to be working in a job which fi ts to their level of degree. In both cohorts – according to graduates’ self assessment – graduates with degree subject informatics and law and adminis-tration were working in a ‘matching job’ in above average ratio, and graduates from agricultural studies in below average ratio.
80.5% of the 2008 cohort and 77.3% of the 2010 cohort answered that he/she was in a job which matches to his/her degree subject. Graduates from medical studies, informatics, law and administration answered in an above average ratio that their job is a matching job in terms of degree subject while graduates from, agricultural studies, humanities, sport studies, social sciences and natural sciences found their job to be a non-matching job in above average ratio.
The diff erence in the ratio of graduates working in a matching job may be the result of the previously discussed two eff ects. On the one hand it might be the consequence of the nature of the fi rst period of transition from school to work, when searching may lead to the transient acceptance of a non-matching job in terms of level of degree or subject of degree and later on graduates may succeed in fi nding a matching job. This searching period is a characteristic of the transition from school to work, so we ex-pect that we will fi nd graduates from the earlier cohort in a larger share in matching jobs than graduates from the later cohort even if labour market prospects of graduates
J Ú L I A VA R G A
Field of study Graduated in 2008 Graduated in 2010
Agriculture 69.8 69.5
Humanities 67.1 63.6
Economics 81.3 79.3
Information technology 90.2 90.3
Law and administration 91.0 85.0
Technology 85.2 85.2
Medical and health sciences 93.6 90.9
Teacher training 78.4 84.7
Social sciences 77.1 67.9
Natural sciences 76.9 68.7
Average 80.5 77.3
Table 4. Share of graduates in ‘matching’ jobs by fi eld of study and year of graduation In terms of degree subject
Source: Graduates 2011 (Frissdiplomások 2011) Educatio Public Services Non-profi t LLC
DPR_angol.indd 154 3/14/13 12:40 PM

155
have not changed. On the other hand the diff erence in labour market success of the two cohorts may be a sign for changing equilibrium of demand and supply in other words for worsening of the labour market prospects of graduates. Again we are not able to separate these two eff ects, but the diff erences in rate of changes by fi eld spe-cializations may signal what are the reasons for the diff erence in the labour market position of the two cohorts. There are some fi eld specializations where the change in the ratio of graduates working in ‘matching’ jobs between the 2008 and the 2010 co-hort were much above the average change. In terms of level of degree, an above average increase in the share of graduates working in non-matching jobs could be observed in case of graduates from humanities, arts and arts management, sport studies, social sciences and natural sciences. An above average change can be observed in the share of graduates working in matching jobs in terms of degree subject between the 2008 and 2010 cohorts in the case of graduates from arts and art management, sport stud-ies, social sciences and natural sciences. It worth mentioning that among graduates of the 2010 cohort with degree subject teacher training a larger share is working in ‘matching jobs’ both in terms of level of degree and in terms of degree subject than among graduates of the 2008 cohort with the same fi eld specialization.
Labour market success of higher education graduates – multi-variable analysis
The descriptive statistics have highlighted that labour market success of graduates dif-fer by subject, however the simple comparison of the average earnings of graduates by fi elds of study may be misleading. The composition of graduates from diff erent degree subjects, their observable and unobservable characteristics may vary by fi elds of study and the diff erences in the labour market success of graduates may refl ect these diff er-ences and not the eff ect of the degree subject. For example, there are diff erences in the composition of the graduates of diff erent fi elds of studies by gender, age, level of degree and there might be diff erences in ability of graduates also. For controlling these eff ects, the eff ect of fi eld of study on earnings was analyzed by multivariable methods too.
First, I estimated Mincer-type earnings functions with simple OLS regressions where the dependent variable was the natural logarithm of the earnings of the in-dividual. The earnings function was estimated by using diff erent specifi cations. The fi rst specifi cation (F1) shows the raw wage diff erentials compared to law and administration graduates. In specifi cations F2–F6 we control for more and more individual and job characteristics. In specifi cation F2 we add gender, age, level of degree, year of graduation as independent variables. In specifi cation F3 we control for some characteristics of the job: hours of work, tenure in months, a dummy vari-able indicating if the sector of employment is public or private and another dummy variable indicating if the graduate is working abroad. In specifi cation F4 we add the matching indicators: (if the job is matching in terms of fi eld of study and in terms of
L A B O U R M A R K E T S U C C E S S O F H U N G A R I A N H I G H E R E D U C A T I O N G R A D U A T E S I N 2 011
DPR_angol.indd 155 3/14/13 12:40 PM

156
level of degree), a dummy variable indicating if the graduate has been unemployed and two proxy variables for measuring the ‘ability of graduates’. The fi rst one is showing if the individual has been studying in ‘cost-priced education’ on a paying – as opposed to state-funded – education, the second one indicates if the graduate has fi nished his/her studies ‘in time’ or has gained his/her qualifi cation with delay. In specifi cation F5 we control for family background of the individual: marital sta-tus, if the graduate has children, categorical variables describing the educational attainment of the graduates’ parents and dummy variable indicating if someone in the family has qualifi cation in the same or related fi elds, and the type of secondary school the individual had fi nished his/her secondary school studies. These charac-teristics may have an eff ect on the labour supply of the graduate or his/her chances to fi nd an appropriate job. The quality of the institution where the individual has graduated may have an impact on the labour market prospects of graduates. For controlling this we put institution fi xed eff ects in specifi cation F6.
For the analysis some fi elds of studies were contracted in the ‘Other’ category. The base category is law and administration; wage diff erentials are compared to this category. Table 3 displays the OLS regression detailed estimation results are reported in Annex Table A1.
J Ú L I A VA R G A
Field of Study(ref.: Law and
administration)(F1) (F2) (F3) (F4) (F5) (F6)
Agriculture –0.131 –0.128 –0.186 –0.140 –0.123 –0.129
Humanities –0.149 –0.120 –0.133 –0.096 –0.097 –0.083
Economics 0.123 0.225 0.135 0.140 0.140 0.090
Information technology 0.279 0.233 0.161 0.147 0.155 0.136
Technology 0.180 0.168 0.087 0.090 0.094 Not sig-nifi cant
Medical and health sciences –0.098 –0.012 –0.069 –0.063 Not sig-nifi cant
Not sig-nifi cant
Teacher training –0.261 –0.182 –0.155 –0.136 –0.129 –0.105
Social sciences –0.162 –0.080 –0.091 Not sig-nifi cant
Not sig-nifi cant
Not sig-nifi cant
Natural sciences –0.143 –0.134 –0.157 –0.121 –0.114 –0.097
Other (arts, arts manage-ment, sports science, na-tional defence and military)
–0.165 –0.101 –0.108 Not sig-nifi cant
Not sig-nifi cant
Not sig-nifi cant
Table 5. Effect of fi eld of study on earnings (OLS regression coeffi cients)
Source: Results of OLS regressions presented in Annex Table A1
DPR_angol.indd 156 3/14/13 12:40 PM

157
Comparing the results for specifi cation F1 and F2 shows that a large part of the raw wage diff erentials are simply the results of diff erences in the composition of graduates by level of degree, year of graduation gender and age between fi elds of studies. Those graduates who have BA/BSc or college level qualifi cation earn 15–19% lower wages than graduates with MA/MSc or university degree. Wages of graduates of the 2008 cohort are 10–12% higher than wages of graduates of the 2010 cohort, male graduates earn 15–19% higher wages than female graduates, and earnings increase with age (Annex Table A1).
As for the eff ect of fi eld of study the results show (Table 4), that raw earnings dif-ferentials are decreasing with controlling for more and more eff ects but not in the same measure for the diff erent fi eld specializations. Graduates from agricultural studies earn 12–13% lower wages than base category in all specifi cations. Those individuals who studied humanities have 8% lower earnings than graduates from law and administration after controlling for all individual and job characteristics. The earnings advantage of graduates with fi eld specialization economics reduces substantially after controlling for the other eff ects, but graduates with this degree subject still have 9% higher earnings than graduates from the reference category. The 27% raw wage premium of informatics drops to 14%, but this fi eld specializa-tion still assures the highest wages. The 18% wage premium of engineering pulls out if we control for individual and job characteristics. In specifi cation F6 the wage ad-vantage of engineering is only 3% and the coeffi cient is insignifi cant. Similarly we do not fi nd signifi cant wage diff erentials between graduates from medical and health care studies and graduates of law and administration if we control for the eff ect of other factors. The substantial wage disadvantage of graduates from teacher training drops to 10%, and there is no signifi cant eff ect of fi eld of study concerning graduates from social sciences. Finally the wage disadvantage of graduates with degree subject natural sciences slightly decreases, but is 10% in specifi cation F6.
It’s worth summarizing the eff ect of the other variables in the models. As it were expected earnings increase with hours of work. Graduates who are working in the public sector have 14–16% lower wages than graduates who are working in the pri-vate sector. Graduates who have found a job abroad earn 75–78% higher wages than graduates who are working in Hungary if we control for all observable characteris-tics. Graduates who said to be working in a ‘matching job’ in terms of level of degree have 20–21 higher wages than graduates who answered that their job does not need higher education qualifi cation. It is worth mentioning that to work in a ‘matching job’ in terms of fi eld of study do not has signifi cant eff ect on wage diff erentials between graduates, in other words graduates who are working in a job that requires other fi eld of study than the graduate holds do not suff er wage loss. Earnings of graduates who have studied in cost-priced education have 3–4% higher wages than graduates who have studied in state-funded education if we control for fi eld specialization and other observable characteristics. The delayed graduation results 3–4% lower wages. Out of the variables describing family background and the secondary school of the gradu-
L A B O U R M A R K E T S U C C E S S O F H U N G A R I A N H I G H E R E D U C A T I O N G R A D U A T E S I N 2 011
DPR_angol.indd 157 3/14/13 12:40 PM

158
ate only one has signifi cant eff ect on wage diff erentials between graduates. Individuals who have studied in a 6 or 8-grade secondary grammar school have 4–5% higher earn-ings than individuals from the reference category (4-grade secondary grammar school).
Regression results suggest that graduates from agricultural studies have the worst earning prospects and graduates from teacher training, natural sciences and humani-ties can expect below average earnings. Graduates from information technology and economics have signifi cant earnings advantage.
OLS estimates show the mean eff ects of fi eld of study on earnings and do not capture the heterogeneity in wages within fi elds of study. Nevertheless, there is large variation in earnings within fi elds of studies. Figure 4 and Figure 5 shows variation in earnings within fi eld of study by level of degree and year of graduation with the help of box-plot diagrams. The box itself contains the middle 50% of the data. It illustrates where the interquartile range falls. The lower hinge indicates the 25th percentile; the upper hinge indicates the 75th percentile of the data set. The line in the box indicates the median value of the data. The marks above and below show the 5th and 95th percentile of the data. Outliers are not indicated.
The fi gures show that there are large diff erences between fi elds of studies at the diff erent points of the distribution for both cohorts and levels of degree. In some fi eld specialization for instance teacher training or medical studies the range of earnings is quite small, because most of the graduates of these specialisations fi nd a job in the pub-lic sector as teachers, doctors or nurses where their earnings are determined by cen-trally set wage scales, promotion is based on seniority and where wage compression is higher than in the private sector. In some other specialisations for instance informatics, engineering or economics and business the range of earnings is much larger. There are some specialisations where earnings of the 75th percentile are smaller than earnings of the 25th percentile in some other fi elds. Diff erences between the earnings of graduates of diff erent specialisations are larger for graduates with MA/MSc or university degree than for graduates with BA/BSc or college level degree.
As OLS estimates presented before capture only the mean eff ects of fi eld of study on earnings I also estimated earnings function by quantile regression which estimates the fi eld specifi c wage premium at various quantiles of the conditional wage distribu-tion (Koenker–Bassett, 1978, Chamberlain; 1994). Quantile regression method has the advantage that the eff ect of a given covariate is not assumed to be fi xed across the dis-tribution; the wage premium of fi eld of study may vary at diff erent points of the earnings distribution. Quantile regression estimates were made by using specifi cation F5, the estimations were made at the 10th, 25th, 50th , 75th and 90th percentile. The detailed results are presented in Annex Table A2.
Graduates of economics and business, and informatics can expect signifi cant higher wages than graduates of the reference category (law and administrattion) at all points of the earnings distribution controlling for individual and job specifi c characteristics. At the 10th , 25th and 50th percentilewage premium to economics and business is the highest, higher that that of informatics or engineering. A gradu-
J Ú L I A VA R G A
DPR_angol.indd 158 3/14/13 12:40 PM

159L A B O U R M A R K E T S U C C E S S O F H U N G A R I A N H I G H E R E D U C A T I O N G R A D U A T E S I N 2 011
*extreme values are excludedSource: Graduates 2011 (Frissdiplomások 2011 ) Educatio Public Services Non-profi t LLC
Figure 4. The distribution of earnings by fi elds of study, level of degree BA/BSc or college-level*
0
100
200
300
400
500
Graduated in 2008
Net
mon
thly
ear
ning
s (th
ousa
nd H
UF)
Net
mon
thly
ear
ning
s (th
ousa
nd H
UF)
0
100
Agricultu
re
Humanities
Economics
Informatio
n
technology
Law and
administra
tion
Tech
nology
Medical a
nd health
science
s
Teach
er tra
ining
Social s
cience
s
Natural s
cience
s
Agricultu
re
Humanities
Economics
Informatio
n
technology
Law and
administra
tion
Tech
nology
Medical a
nd health
science
s
Teach
er tra
ining
Social s
cience
s
Natural s
cience
s
200
300
400
500
Graduated in 2010
DPR_angol.indd 159 3/14/13 12:40 PM

160 J Ú L I A VA R G A
Figure 5. The distribution of earnings by fi eld of study, level of degree MA/MSc or university-level
0
100
200
300
400
500
600
700
Graduated in 2008
0
100
200
300
400
500
Source: Graduates 2011 (Frissdiplomások 2011 ) Educatio Public Services Non-profi t LLC
Graduated in 2010
Net
mon
thly
ear
ning
s (th
ousa
nd H
UF)
Agricultu
re
Humanities
Economics
Informatio
n
technology
Law and
administra
tion
Tech
nology
Medical a
nd health
science
s
Teach
er tra
ining
Social s
cience
s
Natural s
cience
s
Agricultu
re
Humanities
Economics
Informatio
n
technology
Law and
administra
tion
Tech
nology
Medical a
nd health
science
s
Teach
er tra
ining
Social s
cience
s
Natural s
cience
s
Net
mon
thly
ear
ning
s (th
ousa
nd H
UF)
DPR_angol.indd 160 3/14/13 12:40 PM

161
ate from economics and business studies earn 26% higher wages at the 50th quantile than a graduate at the 50th quantile of the reference fi eld specialization. At the top quantiles of the distribution, at the 75thand 90th quantile informatics assures the highest earnings. Graduates of engineering earn signifi cant higher wages than grad-uates of the reference fi eld specialization up to the median, but at the 75th and 90th percentiles the eff ect is not signifi cant. For most of the degree subjects there is no sig-nifi cant wage diff erentials between graduates with the given fi eld specialization and graduates of the reference category up to the median. On the contrary the earnings disadvantage is high at the upper end of the distribution although for most of the de-gree subjects but teacher training showing decresing diff erentials through quantiles. The earnings lag of graduates with degree subject Humanities and Languges is 13% at the 75th percentile and 10% at the 90th percentile. The wage loss of graduates of medical studies is 9% at the 75th percentile and 10% at the 90th percentile, the wage loss of graduates with degree subject natural sciences and mathematics is 15 and 14% respectively. Graduates with fi eld specialization agricultural sciences have 11% lower wages at the 50th percentile, and 17–17% lower wages at the 75th and 90th percentile than graduates of law and administration. The earnings disadvantage if graduates of teacher training is the highest at the top quantiles of the distribution. They earn 19% lower wages at the 75th percentile and 26% lower wages at the 90th percentile than graduates of reference category (Annex Table A2).
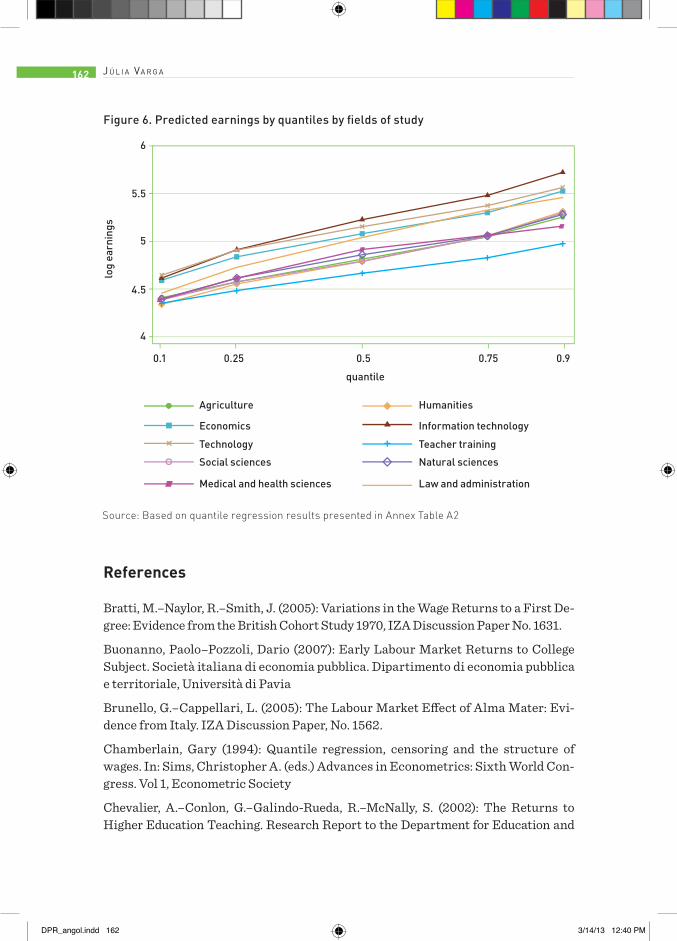
Figure 5 shows the predicted log wages at diff erent quantiles for a set of speciali-sations. The predicted earnings are incresing in quantile. Up to the 25th percentile specialisations with above average earnings prospects (informatics, economics and business and engineering) assure equal wages for graduates, from 75th percentile graduates of informatics can expect the highest earnings. Amongst the subjects re-ported in Figure 5 teacher training assures the lowest wages in all quantiles while the remaining fi elds ensure lower but equal wages at all quantiles than that of the well-paying subjects. There is a considerable large variation in predicted earnings within specialisations. The interquantile range of predicted log earnings is reported for each fi eld specialization in the last column of Annex Table A2. Informatics is the fi eld spe-cialization with the largest range and teacher training with the lowest range.
Quantile regression results suggest that the reason for that on average gradua-tion with fi eld specialization informatics assures the highest wages for young ca-reer beginners is that earnings advantage of graduates with this degree subject are very high at the top of the distribution. In other word graduates with degree subject informatics who have high earnings earn much higher wages than the well paid graduates with other degree subjects. Studying business and economics seems to be the less risky decision as graduates of this fi eld specialization have signifi cant earnings advantage at all points of the earnings distribution. The average earnings advantage of engineering is the result of that this fi eld specialization assures high wages at the lower tails of the distribution. Graduates of teacher training have sig-nifi cantly lower wages at all points of the earnings distribution.
L A B O U R M A R K E T S U C C E S S O F H U N G A R I A N H I G H E R E D U C A T I O N G R A D U A T E S I N 2 011
DPR_angol.indd 161 3/14/13 12:40 PM
162
References
Bratti, M.–Naylor, R.–Smith, J. (2005): Variations in the Wage Returns to a First De-gree: Evidence from the British Cohort Study 1970, IZA Discussion Paper No. 1631.
Buonanno, Paolo–Pozzoli, Dario (2007): Early Labour Market Returns to College Subject. Società italiana di economia pubblica. Dipartimento di economia pubblica e territoriale, Università di Pavia
Brunello, G.–Cappellari, L. (2005): The Labour Market Effect of Alma Mater: Evi-dence from Italy. IZA Discussion Paper, No. 1562.
Chamberlain, Gary (1994): Quantile regression, censoring and the structure of wages. In: Sims, Christopher A. (eds.) Advances in Econometrics: Sixth World Con-gress. Vol 1, Econometric Society
Chevalier, A.–Conlon, G.–Galindo-Rueda, R.–McNally, S. (2002): The Returns to Higher Education Teaching. Research Report to the Department for Education and
J Ú L I A VA R G A
Figure 6. Predicted earnings by quantiles by fi elds of study
4
Agriculture Humanities
Economics Information technology
Technology Teacher training
Social sciences Natural sciences
0.5
quantile
log
earn
ings
0.250.1 0.75 0.9
4.5
5
5.5
6
Source: Based on quantile regression results presented in Annex Table A2
Medical and health sciences Law and administration
DPR_angol.indd 162 3/14/13 12:40 PM

163L A B O U R M A R K E T S U C C E S S O F H U N G A R I A N H I G H E R E D U C A T I O N G R A D U A T E S I N 2 011
Skills. Centre for the Economics of Education, London School of Economics, London
Chevalier, Arnaud (2011): Subject choice and earnings of UK graduates. IZA Dis-cussion Paper No. 5652
Finnie, R.–Frenette, M. (2003): Earnings Differences by Major Field of Study: Evi-dence from Three Cohorts of Recent Canadian Graduates, Economics of Education Review, Vol. 22, No. 2, 179–192.
Galasi P.–Varga J. (2006): Hallgatói létszám és munkaerőpiac. Felsőoktatási Ku-tatóintézet, Budapest
Galasi P. (2002): Fiatal diplomások életpálya-vizsgálata. In: Társadalmi Riport 2002. Tárki, Budapest, 245–255.
Galasi P. (2004a): A felsőfokú végzettségű pályakezdők munkaerő-piaci sikeres-sége. In: Munkaerőpiaci tükör 2004. MTA KTI–OFA, Budapest, 110–118.
Galasi P. (2004b): Estimating wage equations for Hungarian higher-education gradu-ates. Budapest University of Economic Sciences – Institute of Economics, Hungarian Academy of Sciences, Budapest Working Papers on the Labour Market 4/2003.
Galasi P. (2007): Pályakezdő diplomások keresetének alakulása: az iskolázottság, a képzettség, valamint a túlképzés/alulképzés szerepe. In: Munkaerőpiaci tükör 2006. MTA KTI–OFA, Budapest, 107–129.
Grubb, W.N. (1992): The Economic Return to Baccalaureate Degrees: New Evidence from the Class of 1972. Review of Higher Education, Vol. 15, No. 2, 213–231.
Koenker, R.–Basset, G. (1978): Regression Quantiles. Econometrica, Vol. 46, No. 1. 33–50.
Livanos, Ilias–Pouliakas, Konstantinos (2009): Wage Returns to University Disci-plines in Greece: Are Greek Higher Education Degrees Trojan Horses? IZA Discus-sion Paper No. 4442
Machin, S.–Puhani, P. A. (2006). The contribution of Degree Subject to the Gender Wage Gap for Graduates: A Comparison of Britain, France and Germany. Report to the Anglo-German Foundation
Rumberger, R. W.–Thomas, S. L. (1993): The Economic Returns to College Major, Quality and Performance: A Multilevel Analysis of Recent Graduates. Economics of Education Review, Vol. 12, No. 1, 1–19.
Varga J. (2010): A pályakezdő diplomások keresete, munkaerő-piaci sikeressége a 2000-es évek elején. In: Garai O. et al. (eds.): Diplomás Pályakövetés IV. Frissdiplomások 2010. Educatio Társadalmi Szolgáltató Nonprofi t Kft. Felsőoktatási Osztály, 59–81.
Walker, I.–Zhu, Y. (2005): The College Wage Premium, Overeducation, and the Ex-pansion of Higher Education in the UK. Scandinavian Journal of Economics, 110. 695–709.
DPR_angol.indd 163 3/14/13 12:40 PM

164 J Ú L I A VA R G A
Vari
able
(F1)
(F2)
(F3)
(F4)
(F5)
(F6)
Agri
cult
ure
–0.1
319*
(0.0
269)
–0.1
284*
(0.0
251)
–0.1
867*
(0.0
269)
–0.1
408*
(0.0
262)
–0.1
239*
(0.0
267)
–0.1
291*
(0.0
280)
Hum
aniti
es
–0.1
498*
(0.0
204)
–0.1
202*
(0.0
191)
–0.1
338*
(0.0
2105
)–0
.096
0*(0
.021
0)–0
.097
2*(0
.021
8)–0
.083
4*(0
.022
3)
Econ
omic
s0.
1234
*(0
.019
5)0.
1259
*(0
.018
1)0.
1358
*(0
.020
0)0.
1404
*(0
.019
6)0.
1406
*(0
.020
3)0.
0903
*(0
.021
2)
Info
rmat
ion
tech
nolo
gy0.
2796
*(0
.028
1)0.
2333
*(0
.027
3)0.
1618
*(0
.027
9)0.
1475
*(0
.027
4)0.
1554
*(0
.028
1)0.
1367
*(0
.028
4)
Tech
nica
l0.
1801
*(0
.021
4)0.
1688
*(0
.020
4)0.
0877
*(0
.021
6)0.
0909
*(0
.021
2)0.
0948
*(0
.022
2)0.
0269
5(0
.025
0)
Med
ical
and
hea
lth
care
–0.0
984*
(0.0
262)
–0.0
129*
(0.0
250)
–0.0
696*
*(0
.023
8)–0
.063
2**
(0.0
241)
–0.0
630
(0.0
252)
–0.0
362
(0.0
2632
)
Teac
her
trai
ning
–0.2
619*
(0.0
202)
–0.1
828*
(0.0
194)
–0.1
558*
(0.0
218)
–0.1
368*
(0.0
217)
–0.1
293*
(0.0
228)
–0.1
052*
(0.0
2413
)
Soci
al S
cien
ce–0
.162
5*(0
.023
0)–0
.080
1*(0
.022
0)–0
.091
3*(0
.023
0)–0
.055
8(0
.022
7)–0
.054
9(0
.023
4)–0
.064
0(0
.023
8)
Nat
ural
sci
ence
–0.1
431*
(0.0
246)
–0.1
346*
(0.0
238)
–0.1
577*
(0.0
254)
–0.1
211
(0.0
247)
–0.1
145
(0.0
253)
–0.0
970*
(0.0
257)
Oth
er–0
.165
5*(0
.025
9)–0
.101
1*(0
.024
8)–0
.108
2*(0
.028
5)–0
.073
6(0
.028
1)–0
.068
4(0
.029
8)–0
.076
0(0
.031
3)
Mal
e–
0.19
39*
(0.0
108)
0.16
77*
(0.0
106)
0.15
40*
(0.0
104)
0.15
17*
(0.0
107)
0.14
48*
(0.0
106)
Age
–0.
0123
*(0
.000
5)0.
0118
*(0
.000
8)0.
0098
*(0
.000
8)0.
0098
*(0
.000
9)0.
0102
*(0
.000
9)
Tabl
e A1
. The
eff
ect o
f fi e
ld o
f stu
dy o
n (l
og) n
et m
onth
ly e
arni
ngs
OLS
regr
essi
on r
esul
ts
Ann
ex
DPR_angol.indd 164 3/14/13 12:40 PM

165L A B O U R M A R K E T S U C C E S S O F H U N G A R I A N H I G H E R E D U C A T I O N G R A D U A T E S I N 2 011
Vari
able
(F1)
(F2)
(F3)
(F4)
(F5)
(F6)
Leve
l of d
egre
e: B
A/B
Sc o
r co
llege
-lev
el
––0
.186
9*(0
.009
5)–0
.170
1*(0
.009
5)–0
.138
7*(0
.009
4)–0
.121
9*(0
.009
9)–0
.113
8*(0
.011
4)
Yea
r of
gra
duat
ion
2008
–
0.12
02*
(0.0
087)
0.09
35*
(0.0
088)
0.08
82*
(0.0
086)
0.09
21*
(0.0
088)
0.09
31*
(0.0
087)
(log
) hou
rs o
f wor
k–
–0.
3333
*(0
.024
0)0.
3353
*(0
.023
4)0.
3413
*(0
.024
3)0.
3446
*(0
.025
0)
Ten
ure
mon
ths
––
0.00
11*
(0.0
002)
0.00
06*
(0.0
001)
0.00
06*
(0.0
001)
0.00
05*
(0.0
001)
Pub
lic s
ecto
r em
ploy
men
t–
––0
.141
3*(0
.010
0)–0
.167
4*(0
.009
8)–0
.163
2*(0
.010
2)–0
.154
6*(0
.010
2)
––
0.74
950*
(0.0
305)
0.78
03*
(0.0
306)
0.77
29*
(0.0
310)
0.76
93*
(0.0
307)
Wor
king
abr
oad
––
––0
.025
1*(0
.012
1)–0
.024
7*(0
.012
4)–0
.023
05*
(0.0
124)
Mat
chin
g jo
b in
term
s of
fi el
d of
stu
dy–
––
0.21
11*
(0.0
123)
0.20
58*
(0.0
127)
0.20
01*
(0.0
126)
Mat
chin
g jo
b in
term
s of
leve
l of d
egre
e–
––
–0.1
307*
(0.0
100)
–0.1
246*
(0.0
103)
–0.1
195*
(0.0
100)
Has
bee
n un
empl
oyed
––
–0.
0397
*(0
.010
4)0.
0385
*(0
.010
8)0.
0310
*(0
.011
0)
Gra
duat
ed in
cos
t-pr
iced
edu
caio
n–
––
–0.0
527*
(0.0
095)
–0.0
391*
(0.0
099)
–0.0
305*
(0.0
098)
Del
ayed
gra
duat
ion
––
––
0.02
43(0
.011
8)0.
0267
(0.0
116)
Mar
ried
––
––
0.02
22(0
.015
0)0.
0260
(0.0
147)
Has
chi
ldre
n–
––
–0.
0521
*(0
.012
3)0.
0392
9*(0
.012
31)
DPR_angol.indd 165 3/14/13 12:40 PM

166 J Ú L I A VA R G A
Rob
ust s
tand
ard
erro
rs in
par
anth
eses
*sig
nifi c
ant a
t 1%
leve
l, **
sign
ifi ca
nt a
t 5 %
leve
lR
efer
ence
fi el
d: L
aw a
nd A
dmin
istr
atio
nR
efer
ence
cat
egor
y: fe
mal
e; M
A/M
Sc o
r un
iver
sity
leve
l deg
ree,
gra
duat
ed in
201
0, p
riva
te s
ecto
r em
ploy
men
t, w
orki
ng in
Hun
gary
, has
not
bee
n un
em-
ploy
ed, i
s no
t mar
ried
, has
no
child
ren,
gra
duat
ed in
tim
e, s
tudi
ed in
sta
te-f
unde
d ed
ucat
ion,
mot
her’
s ed
ucat
iona
l att
ainm
ent u
pper
sec
onda
ry g
ener
al
scho
ol, f
athe
r’s
educ
atio
nal a
ttai
nmen
t upp
er s
econ
dary
gen
eral
sch
ool,
type
of s
econ
dary
sch
ool 4
-gra
de g
ram
mar
sch
ool
Vari
able
(F1)
(F2)
(F3)
(F4)
(F5)
(F6)
Typ
e of
sec
onda
ry s
choo
l: 6-
or 8
-gra
de g
ram
mar
sch
ool
––
––
–0.0
103
(0.0
106)
–0.0
030
(0.0
104)
Typ
e of
sec
onda
ry s
choo
l: vo
catio
nal s
econ
day
scho
ol–
––
––0
.035
3(0
.017
3)–0
.031
8(0
.016
9)
Mot
her’s
edu
catio
nal a
ttai
nmen
t: at
mos
t low
er s
econ
d-ar
y ed
ucat
ion
––
––
–0.0
276
(0.0
132)
–0.0
2212
(0.0
130)
Mot
her’s
edu
catio
nal a
ttai
nmen
t: vo
catio
nal t
rain
ing
scho
ol–
––
–0.
0138
(0.0
116)
0.00
53(0
.011
5)
Mot
her’s
edu
catio
nal a
ttai
nmen
t: hi
gher
edu
catio
n–
––
––0
.004
9(0
.020
9)–0
.005
4(0
.020
7)
Fat
her’
s ed
ucat
iona
l att
ainm
ent:
voca
tiona
l tra
inin
g sc
hool
––
––
–0.0
215
(0.0
111)
–0.0
187
(0.0
109)
Farh
er’s
edu
catio
nal a
ttai
nmen
t: hi
gher
edu
catio
n–
––
–0.
0064
(0.0
120)
–0.0
045
(0.0
118)
Qua
lifi c
atio
n in
sim
ilar
fi eld
of s
tudy
in c
lose
rel
a-tio
nshi
p–
––
––0
.024
2(0
.012
1)–0
.015
2(0
.012
0)
Inst
itutio
n fi x
ed e
ffec
tsN
oN
oN
oN
oN
oYe
s
Con
stan
t49
.467
(0.0
169)
44.9
91(0
.023
3)2.
8962
*(0
.126
4)2.
8319
*(0
.123
2)2.
7792
*(0
.129
5)27
.168
(0.1
669)
R2
0.09
640.
1984
0.36
590.
4088
0.41
210.
4330
N13
044
12 4
929
312
9 19
78
689
8 68
9
DPR_angol.indd 166 3/14/13 12:40 PM

167
Q10
Q25
Q50
Q75
Q90
Expe
cted
ear
ning
sQ9
0–Q1
0
Agri
cult
ure
0.04
76(0
.047
3)–0
.088
2**
(0.0
302)
–0.1
125*
*(0
.049
2)–0
.171
5*(0
.027
4)–0
.175
7*(0
.041
2)0.
630
Hum
aniti
es
0.02
19(0
.043
9)–0
.072
0(0
.029
0)0.
0769
(0.0
491)
–0.1
295*
(0.0
273)
–0.1
017*
*(0
.038
)0.
711
Econ
omic
s 0.
2224
*(0
.040
1)0.
1730
*(0
.026
0)0.
2579
*(0
.040
7)0.
0812
*(0
.017
9)0.
0814
**(0
.035
2)0.
701
Info
rmat
ion
tech
nolo
gy0.
1780
*(0
.048
9)0.
1437
*(0
.031
6)0.
1998
*(0
.054
5)0.
1080
*(0
.030
3)0.
1177
(0.0
560)
0.85
5
Tech
nica
l0.
2064
*(0
.044
9)0.
1515
*(0
.029
7)0.
2266
*(0
.043
0)0.
0314
(0.0
218)
–0.0
093
(0.0
406)
0.78
1
Med
ical
and
hea
lth c
are
0.05
45(0
.055
4)–0
.037
2(0
.033
2)0.
0639
(0.0
462)
–0.0
941*
(0.0
190)
–0.1
003*
*(0
.051
0)0.
721
Tea
cher
trai
ning
0.06
99(0
.044
2)–0
.053
6(0
.023
5)0.
0842
(0.0
471)
–0.1
898*
(0.0
164)
–0.2
622*
(0.0
385)
0.47
4
Soci
al s
cien
ce0.
0537
(0.0
457)
–0.0
386
(0.0
293)
0.11
50**
(0.0
529)
–0.0
916*
(0.0
259)
–0.0
689
(0.0
437)
0.65
5
Nat
ural
sci
ence
0.03
79(0
.058
6)–0
.054
8(0
.029
9)0.
0562
(0.0
473)
–0.1
489*
(0.0
190)
–0.1
367*
*(0
.052
9)0.
653
Oth
er0.
0205
(0.0
447)
–0.0
662
(0.0
377)
0.05
20(0
.054
3)–0
.146
951*
(0.0
260)
–0.0
979*
*(0
.037
3)0.
951
Tabl
e A
2. T
he e
ffec
t of fi
eld
of s
tudy
on
(log
) net
mon
thly
ear
ning
s, Q
uant
ile r
egre
ssio
n re
sult
s
Rob
ust s
tand
ard
erro
rs in
par
anth
eses
*sig
nifi c
ant a
t 1 %
leve
l, **
sign
ifi ca
nt a
t 5 %
leve
lO
ther
con
rol v
aria
bles
: mal
e; a
ge; B
A/B
Sc o
r co
llege
-lev
el d
egre
e; y
ear
of g
radu
atio
n 20
08; (
log)
hou
rs o
f wor
k; te
nure
in m
oths
; pub
lic s
ecto
r oc
cupa
tion;
w
orki
ng a
broa
d; m
atch
ing
job
in te
rms
of fi
eld
of s
tudy
; job
nee
ds h
ighe
r ed
ucat
ion
qual
ifi ca
tion;
has
been
une
mpl
oyed
;gra
duat
ed in
sos
t-pr
iced
edu
catio
n;
dela
yed
grad
uatio
n; m
arri
ed; h
as c
hild
re; t
ype
of s
econ
dary
sch
ool 6
or
8-gr
ade
gram
mar
sch
ool;
type
of s
econ
dary
sch
ool v
ocat
iona
l sec
onda
ry s
choo
l; m
othe
r’s
educ
atio
nal a
ttai
nmen
t at m
ost l
ower
sec
onda
ry e
duca
tion;
mot
her’
s ed
ucat
iona
l att
ainm
ent v
ocat
iona
l sec
onda
ry s
choo
l; m
othe
r’s
educ
atio
nal
atta
inm
ent h
ighe
r ed
ucat
ion;
fath
er’s
edu
catio
nal a
ttai
nmen
t at m
ost l
ower
sec
onda
ry e
duca
tion;
fath
er’s
edu
catio
nal a
ttai
nmen
t voc
atio
nal s
econ
dary
sc
hool
; fat
her’
s ed
ucat
iona
l att
ainm
ent h
ighe
r ed
ucat
ion;
qua
lifi c
atio
n in
sim
ilar
fi eld
of s
tudy
in c
lose
rel
atio
nshi
p
L A B O U R M A R K E T S U C C E S S O F H U N G A R I A N H I G H E R E D U C A T I O N G R A D U A T E S I N 2 011
DPR_angol.indd 167 3/14/13 12:40 PM

DPR_angol.indd 168 3/14/13 12:40 PM