jo g vol7 no2 08
TRANSCRIPT

Journal of Geomatics iii Vol.7 No.2 October 2013
Journal of Geomatics (A publication of the Indian Society of Geomatics)
Vo. 7 No. 2 October 2013
Research articles
1. Land suitability analysis for industrial development using GIS 101Amita Johar, S.S. Jain and P.K Garg
2. Power distribution information system using GIS – A case study for SAC , ISRO, Ahmedabad 107 Rajeshkumar J. Ajwaliya and P.M. Udani
3. Applications of geo-informatics technology for Surkha lignite mining area in Bhavnagar district, Gujarat 112 Khalid Mehmood, Ajay Patel, Jose Joy and Manik H. Kalubarme
4. Material of interest based sub pixel classification of remote sensing images 120 R.D. Garg and M.D. Sarat Chandra
5. GIS for mapping updates of spatial spread and the ecological reasoning of JE transmission in India 126(1956 -2012)M. Palaniyandi
6. Morphometric and morphologic analysis of Lunar impact craters 134 Disha Lal, Prakash Chauhan, A. S. Arya and Ajai
7. Crowdsourcing geographic information using field based mobile GIS developed on open source for 138 biodiversity conservation- An Indian Bioresource Information Network (IBIN) spatial data node initiative Sameer Saran, Hariom Singh, S.P.S. Kushwaha, K.N. Ganeshaiah, P.L.N. Raju and Y.V.N Krishnamurthy
8. Prioritisation of sub-watersheds: A case study of Dohan and Krishnawati rivers in Mahendergarh, Haryana 145Gulshan Mehra and Rajeshwari
9. Effect analysis of GPS observation type and duration on convergence behavior of static PPP 153Ashraf Farah
10. Hydrological modelling to estimate rainfall based runoff in the lower Tapi basin 158 N. Goswami, P. K. Gupta and Ajai
11. FFT geoid models for Egypt using different modified kernels 163 Raaed Mohamed Kamel Hassouna
12. A web based solution for online application processing for mining information system- A pilot study 169for Kadapa district, Andhra Pradesh, India V.Raghu and K. Mruthyunjaya Reddy
13. Reservoir impact assessment on land use/land cover in the catchment of upper Tunga reservoir in 175 Shimoga taluk and district, Karanataka, India, using remote sensing and GIS
P. D. Jayakumar, Govindaraju and D. C. Lingadevaru
14. Energy balance modelling for ablation estimation of Gangotri glacier 178 Gunjan Rastogi and Ajai
15. Flood simulation for ungauged basin: A case study of lower Tapi basin, India 186 Sudhakar Sharma, Anupam K. Singh and Akshay O. Jain
16. Site suitability analysis for a central wastewater treatment plant in Accra metropolitan area using 191 geographic information system Alex Barimah Owusu and Paulina Ansaa Asante
17. Forest fire risk and degradation assessment using remote sensing and GIS 198
R. Nambi Manavalan and S. Jayalakshmi Reviewers for Journal of Geomatics, Volume-7 v Author Index, Volume-7 viISG Annual Awards viii National Geomatics Awards ix Format for nomination for National Geomatics Awards and Prof. Kakani Nageswara Rao Endowment Young Achiever Award x Fellows and Patron Members xi Instructions for Authors xii Journal of Geomatics: Advertisement Rates xivIndian Society of Geomatics - ISG Membership Form xv
Published biannually by the Secretary, Indian Society of Geomatics on Behalf of the Society
Copyright Indian Society of Geomatics ISG Website: www.isgindia.org
Distributed free to Members of the Society (other than annual members and student members) Design:
Printed at Chandrika Corporation Ahmedabad

Journal of Geomatics 145 Vol.7 No.2 October 2013�
�© Indian Society of Geomatics �
Prioritisation of sub-watersheds: A case study of Dohan and Krishnawati rivers in Mahendergarh, Haryana
Gulshan Mehra and Rajeshwari Department of Geography, Kurukshetra University, Kurukshetra, Haryana, India
Email: [email protected]
(Received: January 24, 2013; in final form August 18, 2013)
Abstract: Delineation of watersheds within a large drainage basin and their prioritisation within administrative boundary is required for proper planning and execution of plan for management of natural resources and sustainable development. In the present paper, detailed characteristics of two sub watersheds of Krishnawati and Dohan river falling in Mahendergarh district in Haryana are studied and their mini-watersheds are prioritised for sustainable development. The parameters for prioritisation were taken from the theme layers of hydrogeomorphology, landuse/landcover, slope, soil, underground water prospects, drainage density and rainfall distribution. The terrain information for these layers was obtained from geocoded satellite data and their corresponponding toposheet maps on 1:25,000 scale. Groundwater prospects and rainfall data were obtained from secondary sources. In order to measure the high priority areas, weightages have been assigned to 7 parameters, using Saaty’s analytical hierarchy process in both the sub-watersheds of Dohan and Krishnawati rivers. A composite picture of priority areas of both the sub-watersheds are presented for conservation and better management of natural resources in the area.
Keywords: Micro-watershed, prioritisation, Remote sensing, Geographical information system, Analytical hierarchy process, Sub-watershed
1. Introduction
A watershed is a natural hydrogeological entity which allows surface runoff to a defined channel, drain, stream or river at a particular point (Chopra et al., 2005). Watershed is considered as an ideal unit for management and sustainable development of its natural resources. Watershed management is the process of carrying out a course of action to achieve specified objectives. It is also a well-known fact that regional planning and its implementation in our country is largely based on administrative divisions rather than on natural divisions. Though the importance of natural divisions based watershed approach cannot be denied and land resource development programmes are applied on a watershed basis, even then the implementation is always carried out by individual administrative units. Hence, delineation of watersheds within a large drainage basin and overlapping district/administration boundaries is equally important (Mehra and Rajeshwari, 2012). Further their prioritisation is also required for proper planning and management of natural resources for sustainable development. The prioritisation of watersheds is generally for proper management in the most vulnerable parts of the watershed, which has been attempted by number of scientists in various areas (NWDPRA, 1991; Adinarayana et al., 1995; Rajora, 1998; Kumar and Kumar, 2011).
In high altitude areas, watersheds are prioritised applying sediment yield models. Literature reveals that a number of sediment yield models, both empirical and conceptual, are in practice to address wide ranging soil and water management problems (Shinde et al., 2012). It may be noted that All India Soil and Land Use Survey provides large scale watershed boundaries at various
levels of hierarchy using empirical formula on the basis of sediment yield index and annual erosion losses (GOI, 1990). In case of arid and semi areas, however, it is necessary to conserve and develop resources in the watersheds of the size ranging between 500 ha and 1000 ha (NWDPRA, 1991; IMSD, 1995; Joshi et al., 2008). It has been documented that the size of 500 ha of micro-watershed is a functional watershed development unit (Rajora, 1998; GOI, 2003). Literature suggests that the development of micro-watersheds which are lying within a district boundary may be suitable unit of development due to easy and effective implementation within a reasonably short period and which may have demonstration effect.
In this context, in the present paper an attempt was made to study the major watershed characteristics and its prioritisation for further augmentation of resources for sustainable development in one administrative unit of Haryana comprising two sub-watersheds (sws) of Dohan and Krishnawati rivers.
2. Objectives
The objectives of the present study were
i) to study a detailed watershed characteristics of Krishnawati and Dohan sub-watersheds of Mahendergarh district in terms size, drainage, soil, terrain, hydrogeomorphology, landuse and ground water prospects.
ii) to study and highlight the high priority micro-watersheds (based on 7 major themes) in both sub-watersheds of the region for better management.
�
Journal of Geomatics 146 Vol.7 No.2 October 2013�
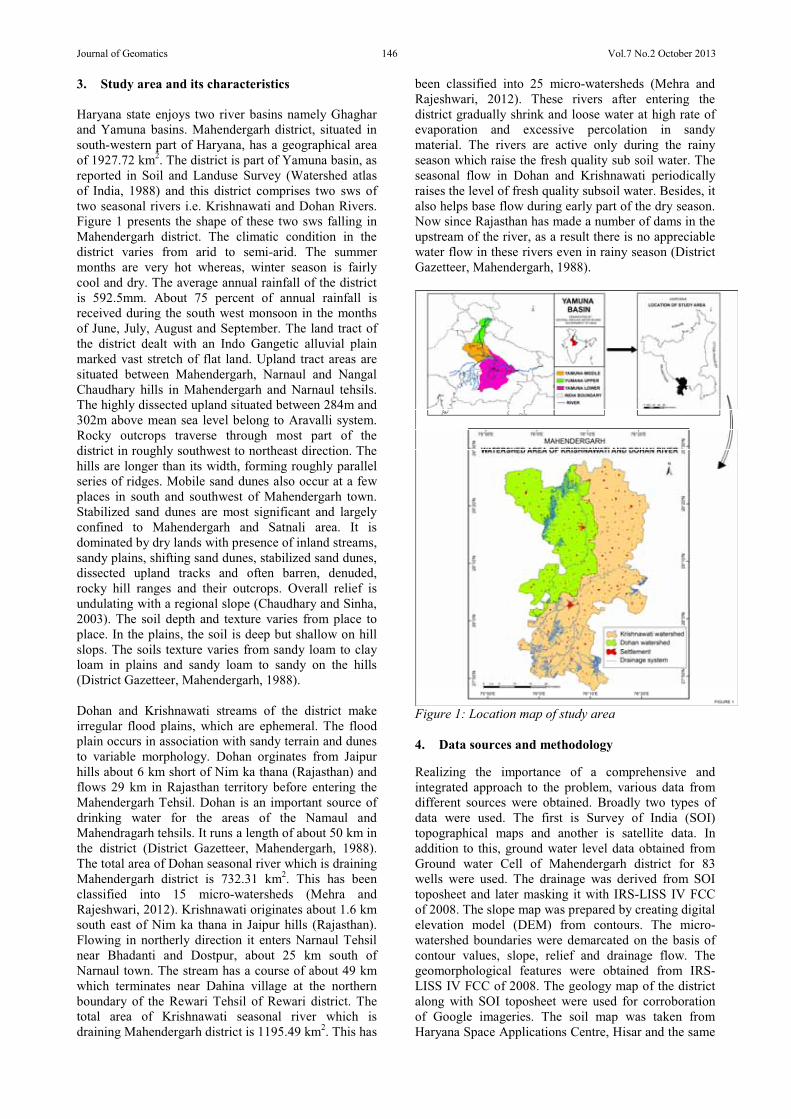
3. Study area and its characteristics
Haryana state enjoys two river basins namely Ghaghar and Yamuna basins. Mahendergarh district, situated in south-western part of Haryana, has a geographical area of 1927.72 km2. The district is part of Yamuna basin, as reported in Soil and Landuse Survey (Watershed atlas of India, 1988) and this district comprises two sws of two seasonal rivers i.e. Krishnawati and Dohan Rivers. Figure 1 presents the shape of these two sws falling in Mahendergarh district. The climatic condition in the district varies from arid to semi-arid. The summer months are very hot whereas, winter season is fairly cool and dry. The average annual rainfall of the district is 592.5mm. About 75 percent of annual rainfall is received during the south west monsoon in the months of June, July, August and September. The land tract of the district dealt with an Indo Gangetic alluvial plain marked vast stretch of flat land. Upland tract areas are situated between Mahendergarh, Narnaul and Nangal Chaudhary hills in Mahendergarh and Narnaul tehsils. The highly dissected upland situated between 284m and 302m above mean sea level belong to Aravalli system. Rocky outcrops traverse through most part of the district in roughly southwest to northeast direction. The hills are longer than its width, forming roughly parallel series of ridges. Mobile sand dunes also occur at a few places in south and southwest of Mahendergarh town. Stabilized sand dunes are most significant and largely confined to Mahendergarh and Satnali area. It is dominated by dry lands with presence of inland streams, sandy plains, shifting sand dunes, stabilized sand dunes, dissected upland tracks and often barren, denuded, rocky hill ranges and their outcrops. Overall relief is undulating with a regional slope (Chaudhary and Sinha, 2003). The soil depth and texture varies from place to place. In the plains, the soil is deep but shallow on hill slops. The soils texture varies from sandy loam to clay loam in plains and sandy loam to sandy on the hills (District Gazetteer, Mahendergarh, 1988).
Dohan and Krishnawati streams of the district make irregular flood plains, which are ephemeral. The flood plain occurs in association with sandy terrain and dunes to variable morphology. Dohan orginates from Jaipur hills about 6 km short of Nim ka thana (Rajasthan) and flows 29 km in Rajasthan territory before entering the Mahendergarh Tehsil. Dohan is an important source of drinking water for the areas of the Namaul and Mahendragarh tehsils. It runs a length of about 50 km in the district (District Gazetteer, Mahendergarh, 1988). The total area of Dohan seasonal river which is draining Mahendergarh district is 732.31 km2. This has been classified into 15 micro-watersheds (Mehra and Rajeshwari, 2012). Krishnawati originates about 1.6 km south east of Nim ka thana in Jaipur hills (Rajasthan). Flowing in northerly direction it enters Narnaul Tehsil near Bhadanti and Dostpur, about 25 km south of Narnaul town. The stream has a course of about 49 km which terminates near Dahina village at the northern boundary of the Rewari Tehsil of Rewari district. The total area of Krishnawati seasonal river which is draining Mahendergarh district is 1195.49 km2. This has
been classified into 25 micro-watersheds (Mehra and Rajeshwari, 2012). These rivers after entering the district gradually shrink and loose water at high rate of evaporation and excessive percolation in sandy material. The rivers are active only during the rainy season which raise the fresh quality sub soil water. The seasonal flow in Dohan and Krishnawati periodically raises the level of fresh quality subsoil water. Besides, it also helps base flow during early part of the dry season. Now since Rajasthan has made a number of dams in the upstream of the river, as a result there is no appreciable water flow in these rivers even in rainy season (District Gazetteer, Mahendergarh, 1988).
Figure 1: Location map of study area
4. Data sources and methodology
Realizing the importance of a comprehensive and integrated approach to the problem, various data from different sources were obtained. Broadly two types of data were used. The first is Survey of India (SOI) topographical maps and another is satellite data. In addition to this, ground water level data obtained from Ground water Cell of Mahendergarh district for 83 wells were used. The drainage was derived from SOI toposheet and later masking it with IRS-LISS IV FCC of 2008. The slope map was prepared by creating digital elevation model (DEM) from contours. The micro-watershed boundaries were demarcated on the basis of contour values, slope, relief and drainage flow. The geomorphological features were obtained from IRS-LISS IV FCC of 2008. The geology map of the district along with SOI toposheet were used for corroboration of Google imageries. The soil map was taken from Haryana Space Applications Centre, Hisar and the same

Journal of Geomatics 147 Vol.7 No.2 October 2013�
classification of soil types is being used as presented by HARSAC, Hisar. Landuse/landcover categories were identified using LISS IV and PAN merged data for the year 2008. The 5 year average from 2005 to 2009 of rainfall data for 16 stations were mapped. In order to prioritise areas for conservation and better resource management, seven themes/layers namely hydrogeomorphology, landuse/cover, slope, soil, underground water table, drainage density and rainfall distribution were taken into account. For ranking of areas with high and low priority, Saaty’s analytic hierarchy process was used (Saaty, 1980). Table 1: A comprehensive detail of its methodology Parameters Data sources Factor/Priority
Hydrogeomorphology
Satellite data of IRS 1D-LISS IV and PAN merged (Year 2008).
The more vulnerable terrain, more the priority.
Slope 23 topographic sheets of Survey of India on the scale of 1:25,000.
More the sloppiness, more the priority.
Landuse/cover Satellite data of IRS 1D-LISS IV and PAN merged (Year 2008).
Parameter of wasteland has been considered. More the wasteland, more the priority.
Soil Derived from Haryana space applications centre (HARSAC).
More the soil depth, less the priority.
Drainage density 23 topographic sheets of Survey of India (1:25,000).
Higher the drainage density, more the priority.
Underground water depth
83 hydrograph station’s data are used.
More the water depth, higher the priority.
Rainfall 16 location’s data has been used.
Less the rainfall, higher the priority.
5. Results and discussion
5.1 Characteristics of Dohan and Krishnawati sws
Hydrogeomorphology : Hydrogeomorphology generally describes the subsurface hydrological characteristics of a region based on its geological and geomorphological aspects (NRDMS, 2004). The terrain influences the surface water hydrology by modelling the movement of water over the land surface. In the present paper, different hydrogeomorphological units of both sws were categorized into 9 classes. For this, IRS LISS IV FCC image was visually interpreted for delineation of physiographic units of the sws. Different image elements such as colour, texture, pattern, association were considered to identify and delineate both physiographic units and hydrogeomorphology. These were corroborated with the hydrogeomorphological categories as delineated by NRDMS (NRDMS, 2004). Ancillary data from SOI toposheets and other secondary sources were utilised to delineate these features. The detailed features of both the sws are presented as Figure 2. Majority of the area in the sample study region is under eolian plain in both the sws i.e. 85.05 percent in Dohan and 87.74 percent in Krishnawati sws. Table 2 presents a detail account of these units. It shows that sand dunes account for around 6 percent area in Krishnawati sub-watershed and for about 3.2 percent in Dohan. Similarly pediment and rocky outcrops (i.e. structural, denudational and residual hills) account for 5 percent and 7 percent of total area in respective sws.
Figure 2: Hydrogeomorphology map of study area
Landuse/Land cover: The landuse affects rates of runoff, infiltration and types and quality of vegetation. Suitable landuse minimizes the soil erosion and reduces the runoff. The landuse/landcover mapping of the watershed was carried out by standard visual interpretation techniques. Satellite data of IRS 1D-LISS IV and PAN (merged) for year 2008 was used for studying the landuse/landcover pattern. Eight broad land use categories were identified in both the sws (Figure 3). These are (i) agricultural land, (ii) barren/rocky, (iii) forest, (iv) open scrub, (v) river course/channel (vi) sand dunes, (vii) settlements or built-up area and (viii) other water bodies i.e. dry and fill ponds. Since the study area represents a typical rain-fed characteristic, agriculture is the primary landuse activity for livelihood. Table 2 reveals that agriculture land occupies a total of 1547.62 km2 area accounting for 81.51 and 80.36 percent of Dohan and Krishnawati river sws respectively. The uncultivated area, which largely consists of barren or rocky land is quite considerable i.e. 6.3 and 4.4 percent of the Dohan and Krishnawati sws respectively (Table 2). In both sws, settlements or built-up area accounts for about 3 to 3.5 percent of total geographical area. It may also be noted that sand dunes occupy 6 percent area in Krishnawati sub-watershed, while it is 2 percent in Dohan sub-watershed. Forest cover is relatively high in Dohan sub-watershed (4 percent), as compared to Krishnawati sub-watershed, where it is 1.16 percent.
Journal of Geomatics 148 Vol.7 No.2 October 2013�
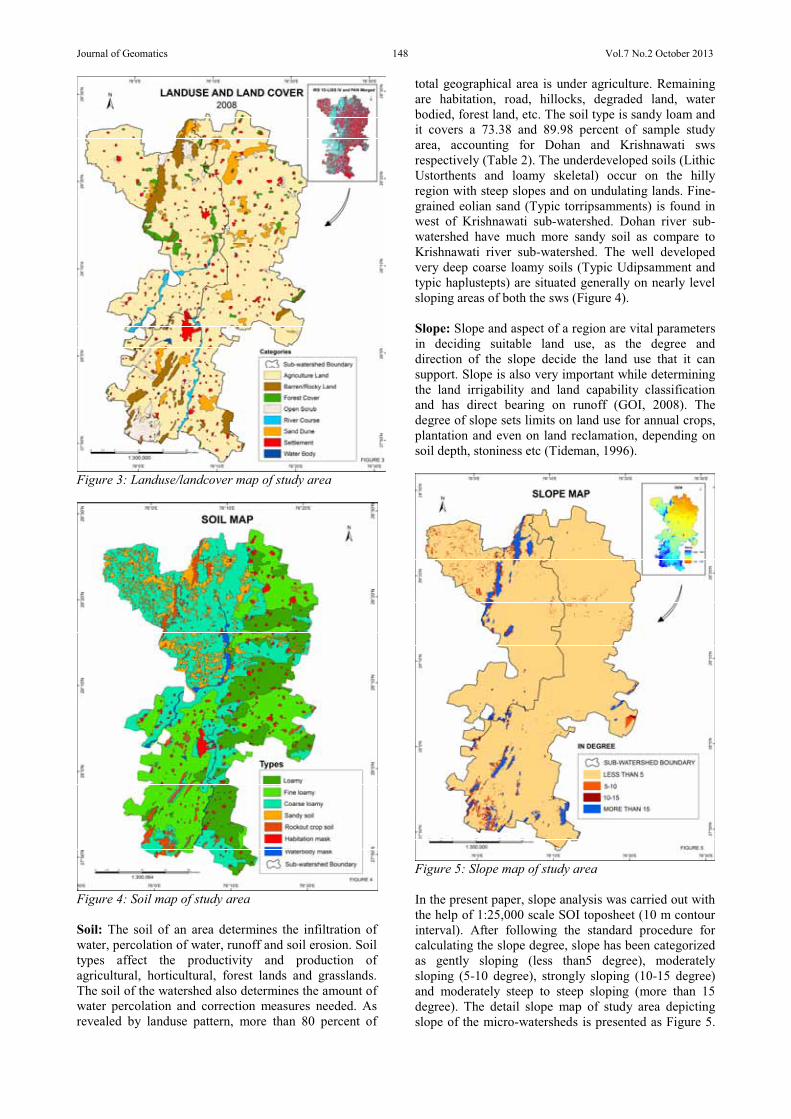
Figure 3: Landuse/landcover map of study area
Figure 4: Soil map of study area
Soil: The soil of an area determines the infiltration of water, percolation of water, runoff and soil erosion. Soil types affect the productivity and production of agricultural, horticultural, forest lands and grasslands. The soil of the watershed also determines the amount of water percolation and correction measures needed. As revealed by landuse pattern, more than 80 percent of
total geographical area is under agriculture. Remaining are habitation, road, hillocks, degraded land, water bodied, forest land, etc. The soil type is sandy loam and it covers a 73.38 and 89.98 percent of sample study area, accounting for Dohan and Krishnawati sws respectively (Table 2). The underdeveloped soils (Lithic Ustorthents and loamy skeletal) occur on the hilly region with steep slopes and on undulating lands. Fine-grained eolian sand (Typic torripsamments) is found in west of Krishnawati sub-watershed. Dohan river sub-watershed have much more sandy soil as compare to Krishnawati river sub-watershed. The well developed very deep coarse loamy soils (Typic Udipsamment and typic haplustepts) are situated generally on nearly level sloping areas of both the sws (Figure 4).
Slope: Slope and aspect of a region are vital parameters in deciding suitable land use, as the degree and direction of the slope decide the land use that it can support. Slope is also very important while determining the land irrigability and land capability classification and has direct bearing on runoff (GOI, 2008). The degree of slope sets limits on land use for annual crops, plantation and even on land reclamation, depending on soil depth, stoniness etc (Tideman, 1996).
Figure 5: Slope map of study area
In the present paper, slope analysis was carried out with the help of 1:25,000 scale SOI toposheet (10 m contour interval). After following the standard procedure for calculating the slope degree, slope has been categorized as gently sloping (less than5 degree), moderately sloping (5-10 degree), strongly sloping (10-15 degree) and moderately steep to steep sloping (more than 15 degree). The detail slope map of study area depicting slope of the micro-watersheds is presented as Figure 5.

Journal of Geomatics 149 Vol.7 No.2 October 2013�
Overall about 93.28 percent area is of gentle slope accounting 91.93 and 94.64 percent in Dohan and Krishnawati sws respectively. The category strongly sloping and moderately steep to steep sloping covers 4.21 percent area of the total geographical area accounting 5.21 and 3.22 percent in Dohan and Krishnawati sws respectively. It also reveals a highly dissected upland situated between 284 m and 650 m above mean sea level belong to Aravalli system and spread from south to north direction (District Gazetteer, Mahendergarh, 1988).
Figure 6: Drainage density map of study area
Drainage density: Drainage density has direct relationship with erodibility. High drainage density watershed drains runoff water rapidly. The coarser the drainage texture, the higher the conductivity (Tideman, 1996). Drainage density, which is characterized by the average length of streams per unit area (Adinarayana et al., 1995). In the term of watershed, Mahendergarh district is unique in the sense that it is a dry land which has presence of inland seasonal streams. Both the Dohan and Krishnawati rivers, and their tributaries, are non- perennial in nature (Figure 6). Drainage density was calculated in the sample study. Figure 6 shows drainage density ranging from nil to low, medium and high drainage density categories. Generally, the drainage density were higher in the hilly terrain, followed by pediments in both the watersheds. In Dohan sub-watershed, many streams in north of sub-watershed lose their water in dry land without joining Dohan river and in Krishnawati sub-watershed most of the tributaries flow towards north-east and finally join the Krishnawati river in several parts. Overall about 589.37 km² area is of less (0.000001-0.002336) to high (0.004547-0.009099) category accounting 27.90 and 29.95 percent in Dohan and Krishnawati sws respectively (Table 2). Area under high drainage
density is 5.34 and 1.74 percent in Dohan and Krishnawati sws respectively.
Figure 7: Underground water table depth map of study area
Underground water depth: The amount of water quality, quantity and regime of the underground water determines the behavior of watershed. The declining rate of ground water Table affects recharge adversely. In Mahendergarh district, there is acute shortage of water. The district has experienced prolonged period of aridity. The area under water bodies have been declining drastically in the district (Chaudhary and Sinha, 2003). A detail characteristic of underground water Table is presented in Figure 7. Total 83 hydrograph stations data with their geographic coordinates were obtained to prepare well location map. For underground water depth map, underground depth values at these locations were attached with well location map in form of attribute Table. After that spatial distribution maps were generated by carrying out point interpolations using moving average (inverse distance) method. The spatial variation of groundwater depth were classified into 25-45, 45-65, 65-85 and below 85 m ranges. The underground water table of Krishnawati sub-watershed is deeper than Dohan river sub-watershed. In 2010, the underground depth in Dohan sub-watershed was in the range of 65-85 meters. It occupies a 271.66 km² which is 37.10 percent of its total geographical area. It may also be noted that 28.45 km² area is having worst underground depth. The water table tends to be close to the surface (25 to 45 meters) in Krishnawati sub-watershed and covered 72.19 percent of the total area (Table 2).
Rainfall distribution: The 5 year average of rainfall data for 16 stations has been mapped, with the

Journal of Geomatics 150 Vol.7 No.2 October 2013�
interpolated isohytes, spatial distribution of rainfall was generated. It was overlaid with boundaries of both sws and resultant distribution is shown in Figure 8. It reveals that the average annual rainfall varies from 350 to 710 mm. Rainfall distribution has been classified into four zones: (i) less than 350 mm, (ii) 350-450 mm, (iii) 450-550 mm, and (iv) more than 550 mm. The spatial pattern shows that it decreases from south to northward in both of sws. The highest rainfall occurs in south-west of Krishnawati sub-watershed and covers almost 26.5 percent of the total area (Table 2).
The low rainfall area of this sws accounts for 24.26 percent of its total geographical area. In case of Dohan sub-watershed, only 2.79 percent area receives scanty amount of rainfall.
Figure 8: Rainfall distribution map of study area
5.2 Prioritisation of area for conservation of resources and sustainable development:
In this section, a composite picture of prioritised area of both Dohan and Krishnawati rivers sws is presented. The basic premise is to identify and give priority to those areas which are vulnerable and where intervention is needed on urgent basis for management of natural resources and development. In order to prioritise such areas, seven theme based layers were used. These are hydrogeomorphology, landuse/landcover, slope, soil, underground water table, drainage density and rainfall. Saaty’s analytic hierarchy classification was used for weights and to measure the area (Saaty, 1980). The more vulnerable themes were given higher weightage or rank and are considered as higher priority. In case of
slope parameter, the areas with gentle slope were given low priority and with very steep slope were considered for prioritisation. Soil mapping was carried out using HARSAC map as discussed in earlier section. The map area depicting deep soils with sandy clay and which are moderately deep and well drained are considered for prioritisation. In case of landuse/landcover, high forest cover was given less values. While high waste land and sand dunes were ranked high and considered for priority. Similarly ground water prospects was ranked, where high rank was assigned to areas where its prospects were low in term of deep water table. The drainage pattern of any terrain reflects the characteristics of surface as well as subsurface information. Its density (in terms of km/km²) indicates the closeness of spacing of channels. It characteristics the run-off in the area. Hence, lesser the drainage density, higher is the probability of recharge or potential groundwater zone (Vittala et al, 2008). In case of drainage density layer, higher density (4.547-9.099) was given highest value. Similarly, the highest rainfall region was given low priority. Applying the above said ranking values, a composite picture was obtained which is presented in Figure 9. This shows composite picture of vulnerable area in the district comprising of both sws. A segregated picture of both river sws is presented in Table 3.
Table 2: Watershed Characteristics of Dohan and Krishnawati rivers.
Dohan sub-watershed Krishnawati sub-watershed Hydrogeomorphology Total area in
Km² Percent area
Total area in Km²
Percent area
Alluvial Plane (Younger) 21.66 2.96 10.17 0.85 Sand Dune 23.43 3.20 68.65 5.74 Eolian Plain 622.84 85.05 1048.94 87.74 Gullies 2.93 0.40 1.68 0.14 Pediment 29.94 4.09 30.91 2.58 Valley Fill 8.66 1.18 4.14 0.35 Residual Hill 0.40 0.05 6.44 0.54 Denudational Hill 2.11 0.29 7.86 0.66 Structural Hill 20.67 2.82 16.77 1.40 Total Geographical area 732.31 100.00 1195.49 100.00 Drainage density in Km/Km² Nil 527.97 72.10 837.46 70.05 Less (0.000001-0.002336) 132.63 18.11 279.36 23.37 Moderate (0.002336-0.004547) 32.61 4.45 57.86 4.84 High (0.004547-0.009099) 39.10 5.34 20.81 1.74 Total Geographical area 732.31 100.00 1195.49 100.00 Slope in degree <5 Gently sloping 673.19 91.93 1131.43 94.64 5-10 Moderately sloping 20.91 2.85 25.29 2.12 10-15 Strongly sloping 12.02 1.64 15.23 1.27 >15 Moderately steep to steep sloping 26.16 3.57 23.38 1.95 Total Geographical area 732.31 100.00 1195.49 100.00 Landuse/cover Agriculture Land 596.89 81.51 960.73 80.36 Barren/Rocky 45.71 6.24 52.25 4.37 Forest 28.92 3.95 13.92 1.16 Open Scrub 14.83 2.03 42.31 3.54 River Course/channel 11.71 1.60 9.22 0.77 Sand Dune 13.21 1.80 71.91 6.01 Settlement/builtup 20.68 2.82 43.33 3.62 Other water Bodies 0.36 0.05 1.82 0.15 Total Geographical area 732.31 100.00 1195.49 100.00 Soil types Loamy 16.37 2.24 318.53 26.64 Fine loamy 88.91 12.14 475.17 39.75 Coarse loamy 432.05 59.00 282.04 23.59 Sandy soil 140.56 19.19 27.23 2.28 Rock out crop soil 25.97 3.55 33.47 2.80 Habitation mask 13.80 1.88 54.90 4.59 Water body mask 14.65 2.00 4.15 0.35 Total Geographical area 732.31 100.00 1195.49 100.00 Underground water depth in mts). 25-45 175.18 23.92 863.01 72.19 45-65 257.01 35.10 309.89 25.92 65-85 271.66 37.10 22.55 1.89 Below 85 28.45 3.89 0.00 0.00 Total 732.31 100.00 1195.49 100.00 Rainfall distribution in mm. Below 350 20.42 2.79 290.08 24.26 350-450 395.59 54.02 215.81 18.05 450-550 158.88 21.69 373.10 31.21 Above 550 157.43 21.51 316.49 26.47 Total 732.31 100.00 1195.49 100.00
Journal of Geomatics 151 Vol.7 No.2 October 2013�
Table 3: Composite profile of prioritised area. Dohan sub-watershed Krishnawati sub-watershed Priority categories
Total area in Km²
Percent area
Total area in Km²
Percent area
Low priority 665.07 90.82 1130.96 94.60
Moderate priority 28.05 3.83 33.43 2.80
High priority 22.14 3.02 22.02 1.84
Very high priority 17.06 2.33 9.074 0.76
Total 732.32 100.00 1195.49 100.00
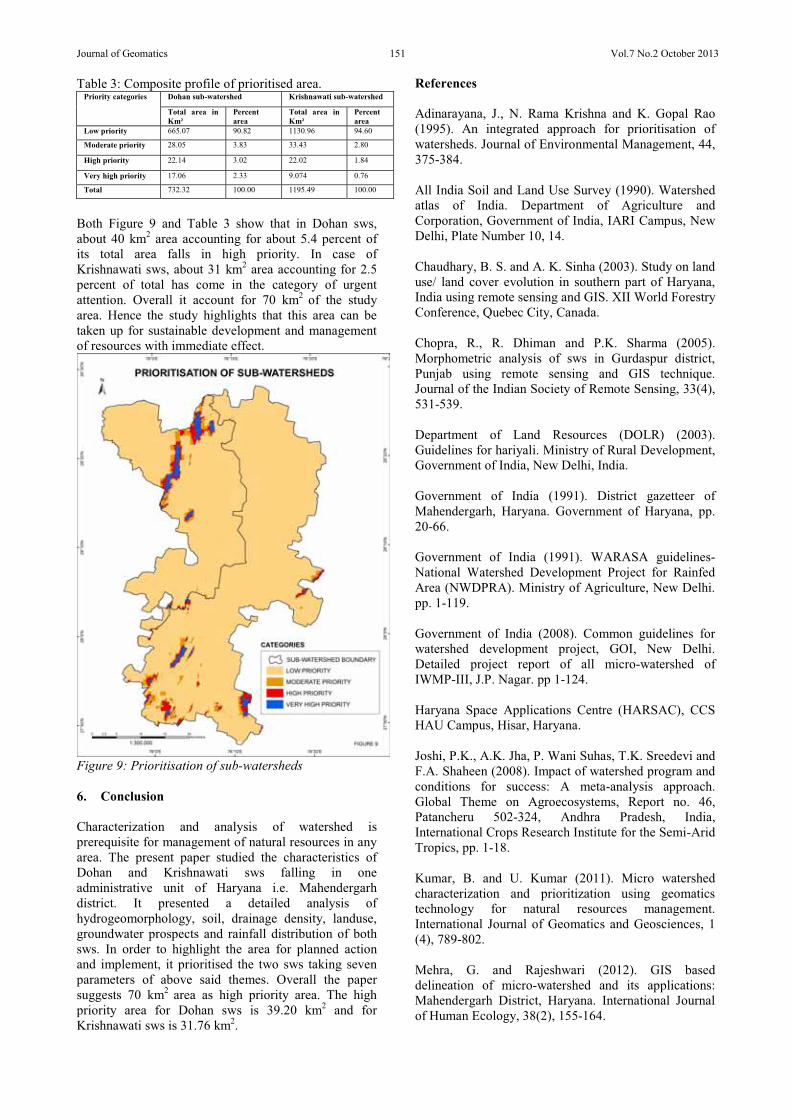
Both Figure 9 and Table 3 show that in Dohan sws, about 40 km2 area accounting for about 5.4 percent of its total area falls in high priority. In case of Krishnawati sws, about 31 km2 area accounting for 2.5 percent of total has come in the category of urgent attention. Overall it account for 70 km2 of the study area. Hence the study highlights that this area can be taken up for sustainable development and management of resources with immediate effect.
Figure 9: Prioritisation of sub-watersheds
6. Conclusion
Characterization and analysis of watershed is prerequisite for management of natural resources in any area. The present paper studied the characteristics of Dohan and Krishnawati sws falling in one administrative unit of Haryana i.e. Mahendergarh district. It presented a detailed analysis of hydrogeomorphology, soil, drainage density, landuse, groundwater prospects and rainfall distribution of both sws. In order to highlight the area for planned action and implement, it prioritised the two sws taking seven parameters of above said themes. Overall the paper suggests 70 km2 area as high priority area. The high priority area for Dohan sws is 39.20 km2 and for Krishnawati sws is 31.76 km2.
References
Adinarayana, J., N. Rama Krishna and K. Gopal Rao (1995). An integrated approach for prioritisation of watersheds. Journal of Environmental Management, 44, 375-384.
All India Soil and Land Use Survey (1990). Watershed atlas of India. Department of Agriculture and Corporation, Government of India, IARI Campus, New Delhi, Plate Number 10, 14.
Chaudhary, B. S. and A. K. Sinha (2003). Study on land use/ land cover evolution in southern part of Haryana, India using remote sensing and GIS. XII World Forestry Conference, Quebec City, Canada.
Chopra, R., R. Dhiman and P.K. Sharma (2005). Morphometric analysis of sws in Gurdaspur district, Punjab using remote sensing and GIS technique. Journal of the Indian Society of Remote Sensing, 33(4), 531-539.
Department of Land Resources (DOLR) (2003). Guidelines for hariyali. Ministry of Rural Development, Government of India, New Delhi, India.
Government of India (1991). District gazetteer of Mahendergarh, Haryana. Government of Haryana, pp. 20-66.
Government of India (1991). WARASA guidelines-National Watershed Development Project for Rainfed Area (NWDPRA). Ministry of Agriculture, New Delhi. pp. 1-119.
Government of India (2008). Common guidelines for watershed development project, GOI, New Delhi. Detailed project report of all micro-watershed of IWMP-III, J.P. Nagar. pp 1-124.
Haryana Space Applications Centre (HARSAC), CCS HAU Campus, Hisar, Haryana.
Joshi, P.K., A.K. Jha, P. Wani Suhas, T.K. Sreedevi and F.A. Shaheen (2008). Impact of watershed program and conditions for success: A meta-analysis approach. Global Theme on Agroecosystems, Report no. 46, Patancheru 502-324, Andhra Pradesh, India, International Crops Research Institute for the Semi-Arid Tropics, pp. 1-18.
Kumar, B. and U. Kumar (2011). Micro watershed characterization and prioritization using geomatics technology for natural resources management. International Journal of Geomatics and Geosciences, 1 (4), 789-802.
Mehra, G. and Rajeshwari (2012). GIS based delineation of micro-watershed and its applications: Mahendergarh District, Haryana. International Journal of Human Ecology, 38(2), 155-164.

Journal of Geomatics 152 Vol.7 No.2 October 2013�
National Remote Sensing Agency (1995). Integrated Mission for Sustainable Development (IMSD) technical guidelines. Dept. of Space, Govt. of India, Balanagar, Hyderabad, pp. 1-127.
National Watershed Development Programme for Rain fed Areas (NWDPRA) (1990-91). Guidelines for watershed development projects issued by the National Rainfed Area Authority (NRAA). Department of Agriculture and Cooperation, Government of India.
Rajora, R. (1998). Integrated watershed management. Rawat Publications, Jaipur, pp. 27-43.
Saaty, T. L. (1980). The analytic hierarchy process. McGraw Hill International, New York.
Shinde, V., K.N. Tiwari and M. Singh (2012). Prioritisation of micro-watersheds on the basis of soil erosion hazard using remote sensing and geographic information system. International Journal of Water Resources and Environmental Engineering, 2(5), 130–136.
Tideman, E.M. (1996). Watershed management guidelines for Indian conditions. Omega scientific publishers, New Delhi, pp. 11.
Vittala, S. S., S. Govindaiah and H. H. Gowda (2008). Prioritization of sub-watersheds for sustainable development and management of natural resources: An integrated approach using remote sensing, GIS and socio-economic data. Current Science, Volume 95, No. 3, 345-354.
