job satisfaction among public and private sector employees: an international comparison
TRANSCRIPT

Job satisfaction among public and privatesector employees: an international comparison
Pauli Forma
Director of working life services
Keva
Presentation in Nordic conference on working life, Tampere 2.11.2016

Background of the study• The role of the public sector varies in different countries
– Institutions: large, institutional welfare states vs. marginal welfare states
– Spending: High public expenditures versus low expenditures
– Number of public sector employees: large number of employees vs. small number of employees
– Working conditions: Well-being of the public sector employees?
• Well-being of the employees in the public sector can be influenced by:
– Role of the public sector in the society -> work characteristics
– Budget pressures, restructuring of the public sector
– On the other hand: according to the public service motivation (PSM) theory, some individuals may have desire to work in the public sector.
2.11.2016 Pauli Forma 2

Research questions and studiedcountries
The aim of the study is to analyze differences in job satisfaction and self-rated health in countries which have different types of public sectors.
Research questions:
1) How does job satisfaction and self-rated health among public sector employees vary between different countries?
2) What is the gap regarding job satisfaction and self-rated health between private and public sector employees in different countries?
Studied countries:
• Australia, Austria, Denmark, Finland, France, Norway, Sweden, Switzerland, United States, Germany, United Kingdom.
• Countries are different when it comes to the size and role of the publicsector.
2.11.2016 3Pauli Forma

Data and methods
• It was quite difficult to find a comparative data including a variable for sector of employment and variables measuringthe well being in working life.
• ISSP (International Social Survey Programme) data wasobtained from DAS (Leibniz Institute for Social Sciences).
• The data was collected in 2012, the theme of thestudy was changing family and gender roles.
• Descriptive methods and multivariate regression analysis(standardized beta coefficients) were used.
• Background-variables which could be used in the analyseswere gender, age and education.
2.11.2016 Pauli Forma 4

Employment in the public sector in different countries (% share of the labor-force working in the general
government and public corporations).
0,0
5,0
10,0
15,0
20,0
25,0
30,0
35,0
2000 2008
2.11.2016 Pauli Forma 5
Source: OECD statistics.

Structure of the labour force in the public and private sector in thestudied countries (Figures for private sector in parentheses).
%-share of female workers
Average age of the workers
Average educationin years
Australia 52 (44) 45 (48) 15 (14)
Austria 54 (52) 41 (40) 13 (11)
Denmark 65 (38) 45 (43) 14 (13)
Finland 74 (43) 44 (45) 16 (15)
France 72 (60) 44 (42) 16 (15)
Norway 66 (36) 46 (44) 15 (14)
Sweden 71 (41) 48 (45) 14 (13)
Switzerland 54 (40) 45 (44) 15 (14)
United States 52 (47) 44 (42) 15 (14)
Germany 54 (44) 46 (43) 14 (12)
United Kingdom 65 (46) 44 (44) 13 (14)
62.11.2016 Pauli Forma Source: ISSP 2012.
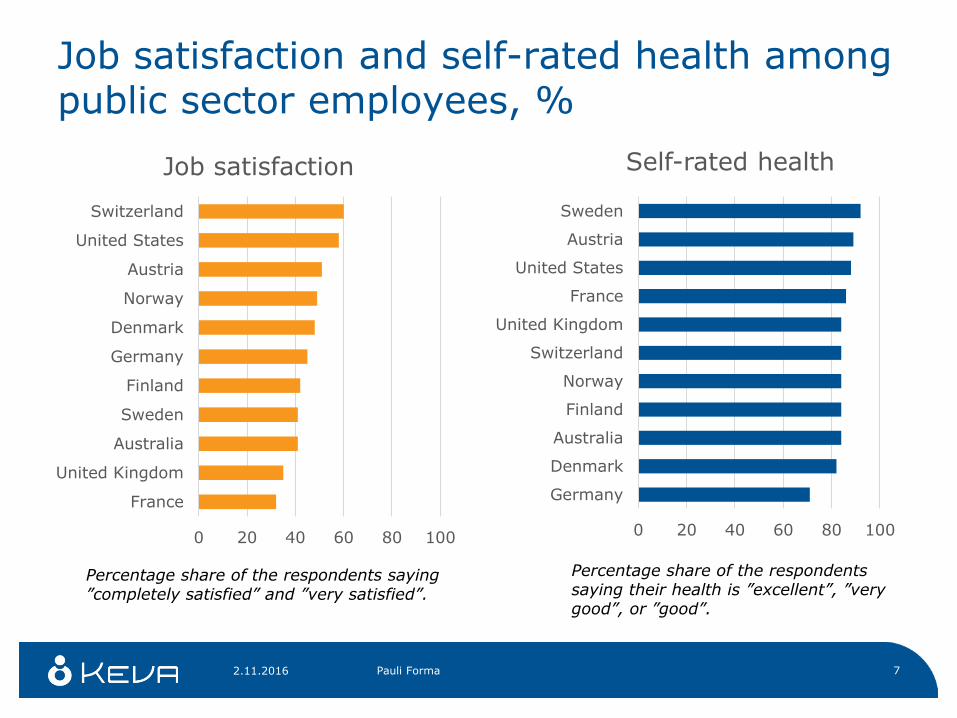
Job satisfaction and self-rated health amongpublic sector employees, %
0 20 40 60 80 100
Germany
Denmark
Australia
Finland
Norway
Switzerland
United Kingdom
France
United States
Austria
Sweden
Self-rated health
0 20 40 60 80 100
France
United Kingdom
Australia
Sweden
Finland
Germany
Denmark
Norway
Austria
United States
Switzerland
Job satisfaction
2.11.2016 7Pauli Forma
Percentage share of the respondentssaying their health is ”excellent”, ”verygood”, or ”good”.
Percentage share of the respondents saying”completely satisfied” and ”very satisfied”.

Job satisfaction among public and privatesector employees, %
0
10
20
30
40
50
60
70
80
90
100
Public Private
2.11.2016 Pauli Forma 8
Percentage share of the respondents saying ”completely satisfied” and ”verysatisfied”.
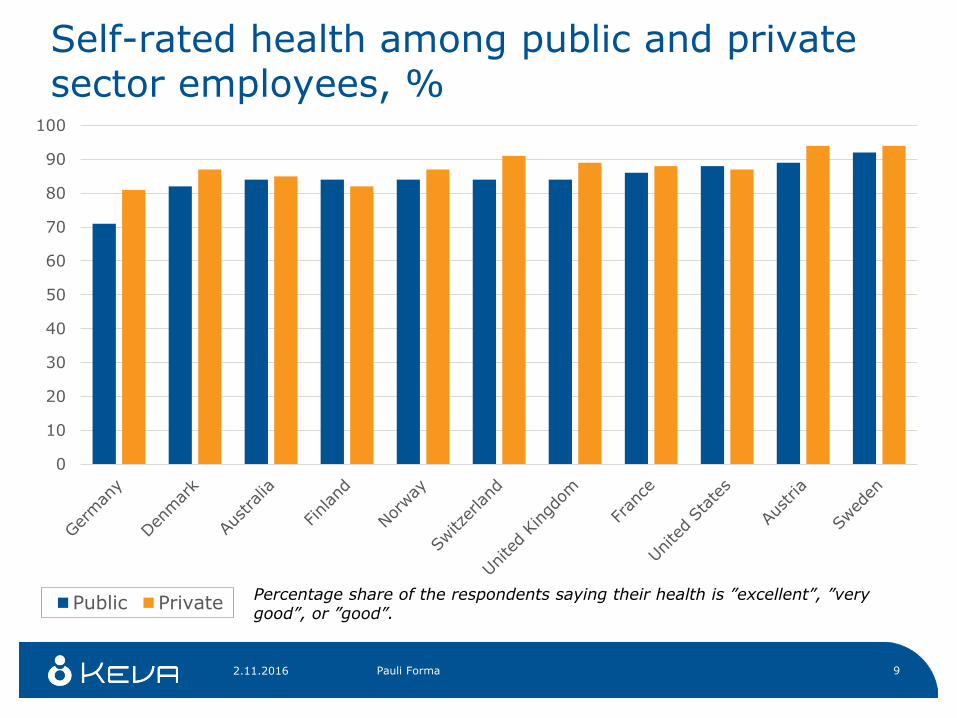
Self-rated health among public and privatesector employees, %
0
10
20
30
40
50
60
70
80
90
100
Public Private
2.11.2016 Pauli Forma 9
Percentage share of the respondents saying their health is ”excellent”, ”verygood”, or ”good”.

Multivariate regression analysis, betacoefficients, all studied countries included in the analyses
Jobsatisfaction
Self-ratedhealth
Age (years) .06*** -.16***
Gender (female) -.02 -.01
Education (years) .02 .09***
Sector of employment (public) -.01 -.04***
2.11.2016 Pauli Forma 10
Levels of statistical significance: * p ≤ 0.05; ** p ≤ 0.01; p ≤ 0.001.
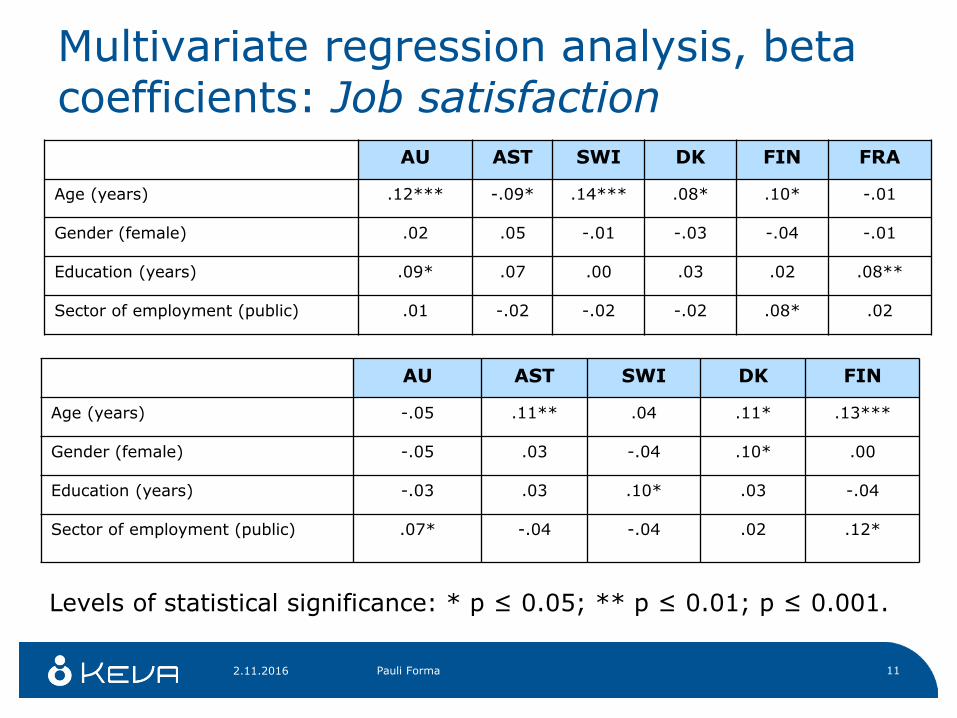
Multivariate regression analysis, betacoefficients: Job satisfaction
AU AST SWI DK FIN FRA
Age (years) .12*** -.09* .14*** .08* .10* -.01
Gender (female) .02 .05 -.01 -.03 -.04 -.01
Education (years) .09* .07 .00 .03 .02 .08**
Sector of employment (public) .01 -.02 -.02 -.02 .08* .02
2.11.2016 Pauli Forma 11
AU AST SWI DK FIN
Age (years) -.05 .11** .04 .11* .13***
Gender (female) -.05 .03 -.04 .10* .00
Education (years) -.03 .03 .10* .03 -.04
Sector of employment (public) .07* -.04 -.04 .02 .12*
Levels of statistical significance: * p ≤ 0.05; ** p ≤ 0.01; p ≤ 0.001.
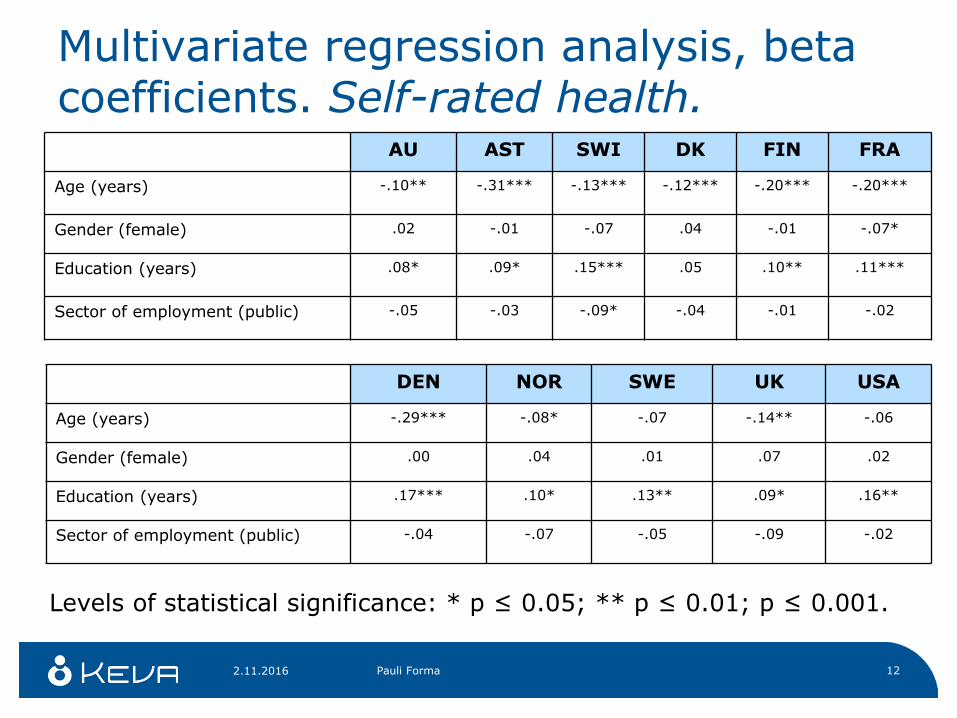
Multivariate regression analysis, betacoefficients. Self-rated health.
AU AST SWI DK FIN FRA
Age (years) -.10** -.31*** -.13*** -.12*** -.20*** -.20***
Gender (female) .02 -.01 -.07 .04 -.01 -.07*
Education (years) .08* .09* .15*** .05 .10** .11***
Sector of employment (public) -.05 -.03 -.09* -.04 -.01 -.02
2.11.2016 Pauli Forma 12
DEN NOR SWE UK USA
Age (years) -.29*** -.08* -.07 -.14** -.06
Gender (female) .00 .04 .01 .07 .02
Education (years) .17*** .10* .13** .09* .16**
Sector of employment (public) -.04 -.07 -.05 -.09 -.02
Levels of statistical significance: * p ≤ 0.05; ** p ≤ 0.01; p ≤ 0.001.

Main findings1) How does job satisfaction and self-rated health among public sector employees vary between different countries?
• Job satisfaction of the public sector employees varies betweendifferent countries.
• Only moderate differences were found when it comes to self-ratedhealth among public sector employees in the different countries.
2) What is the gap regarding job satisfaction and self-rated health between private and public sector employees in different countries?
• In some countries, a small gap between employment sectors werefound when it comes job satisfaction and self-rated health.
• However, the gap between sectors of employment was notsystematic.
2.11.2016 13Pauli Forma

Conclusions
• In the studied countries, sector of employment dividesnot the labour-force when it comes to job satisfactionand self rated health.
• Individual-level variables like education and age aremore important than the employment sector.
• Because of the limitations of the data, more researchis needed.
• Currently, when public sectors are adjusted in manycountries, it is important to analyse also the quality of the working life in the public sector.
2.11.2016 14Pauli Forma
Limitations of the data and researchdesign
• Sectors of employment are large and heterogeneous: there might be interestingdifferences behind the averages.
• Only two dependent variables were used: morespecific variables could reveal more detailedpicture about working conditions and well-being of the employees.
• Job satisfaction is not necessarily a good variablefor measuring well-being at work.
2.11.2016 Pauli Forma 15