joc container trade europe conference 2016 – … container trade europe conference 2016 –...
TRANSCRIPT
1 Hamburg, 13 September 2016
JOC Container Trade Europe Conference 2016 – Keynote Address
2
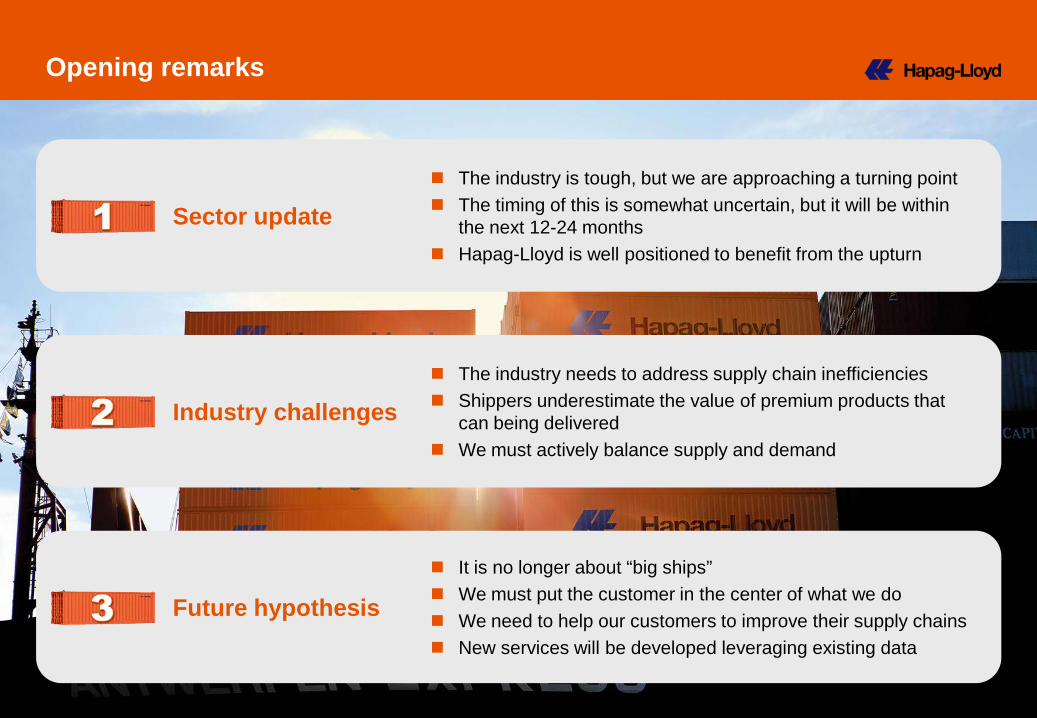
Opening remarks
Industry challenges The industry needs to address supply chain inefficiencies Shippers underestimate the value of premium products that
can being delivered We must actively balance supply and demand
Sector update The industry is tough, but we are approaching a turning point The timing of this is somewhat uncertain, but it will be within
the next 12-24 months Hapag-Lloyd is well positioned to benefit from the upturn
Future hypothesis
It is no longer about “big ships” We must put the customer in the center of what we do We need to help our customers to improve their supply chains New services will be developed leveraging existing data
3
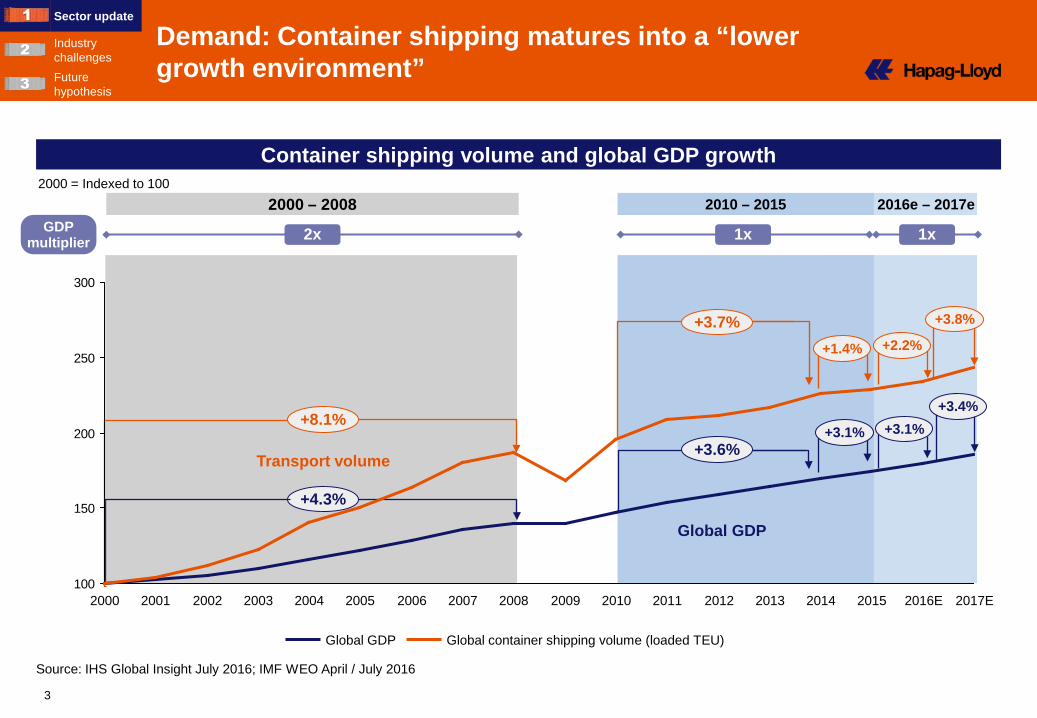
2000 = Indexed to 100
Global GDP Global container shipping volume (loaded TEU)
2016e – 2017e 2000 – 2008 2010 – 2015 GDP
multiplier 1x 1x 2x
Container shipping volume and global GDP growth
Transport volume
+8.1%
Global GDP
+4.3%
+3.6% +3.1%
+3.4%
+2.2%
+3.8%
Source: IHS Global Insight July 2016; IMF WEO April / July 2016
+3.7%
Demand: Container shipping matures into a “lower growth environment”
Sector update
Industry challenges Future hypothesis
+3.1%
+1.4%
100
150
200
250
300
2015 2016E 2013 2014 2008 2017E 2009 2010 2012 2011 2000 2001 2002 2003 2004 2005 2006 2007
4
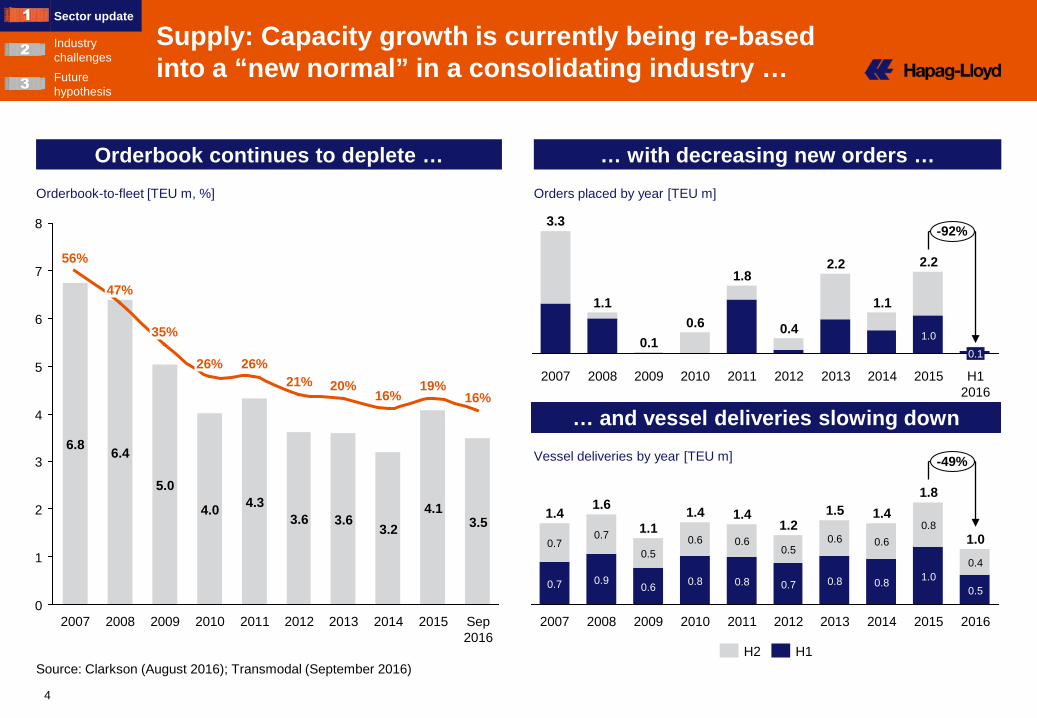
… and vessel deliveries slowing down
Source: Clarkson (August 2016); Transmodal (September 2016)
… with decreasing new orders … Orderbook continues to deplete … Orderbook-to-fleet [TEU m, %] Orders placed by year [TEU m]
Vessel deliveries by year [TEU m]
8
7
6
5
4
3
2
1
0 2012
21%
3.6
2011
26%
4.3
2010
26%
4.0
2009
35%
5.0
2008 Sep 2016
16%
3.5
2015
19%
4.1
2014
16%
3.2
2013
20%
3.6
47%
6.4
2007
56%
6.8
-92%
H1 2016
0.1
2015
2.2
1.0
2014
1.1
2013
2.2
2012
0.4
2011
1.8
2010
0.6
2009
0.1
2008
1.1
2007
3.3
0.7
0.7 0.7
0.9 0.6
1.0
0.5
0.4
1.8
1.0
0.8
2014
1.4
2013
1.5
2012
1.2
2011
1.4
2010
1.4
2009
1.1
2008
1.6
2007
0.7
0.6 0.5
0.8
0.6
0.8
2015
0.6 0.6
1.4
0.5
0.8
-49%
2016
0.8
H1 H2
Supply: Capacity growth is currently being re-based into a “new normal” in a consolidating industry …
Sector update
Industry challenges Future hypothesis
5
Cos
t
Vessel size
Total cost for transport chain Handling costs per TEU
Vessel cost per TEU
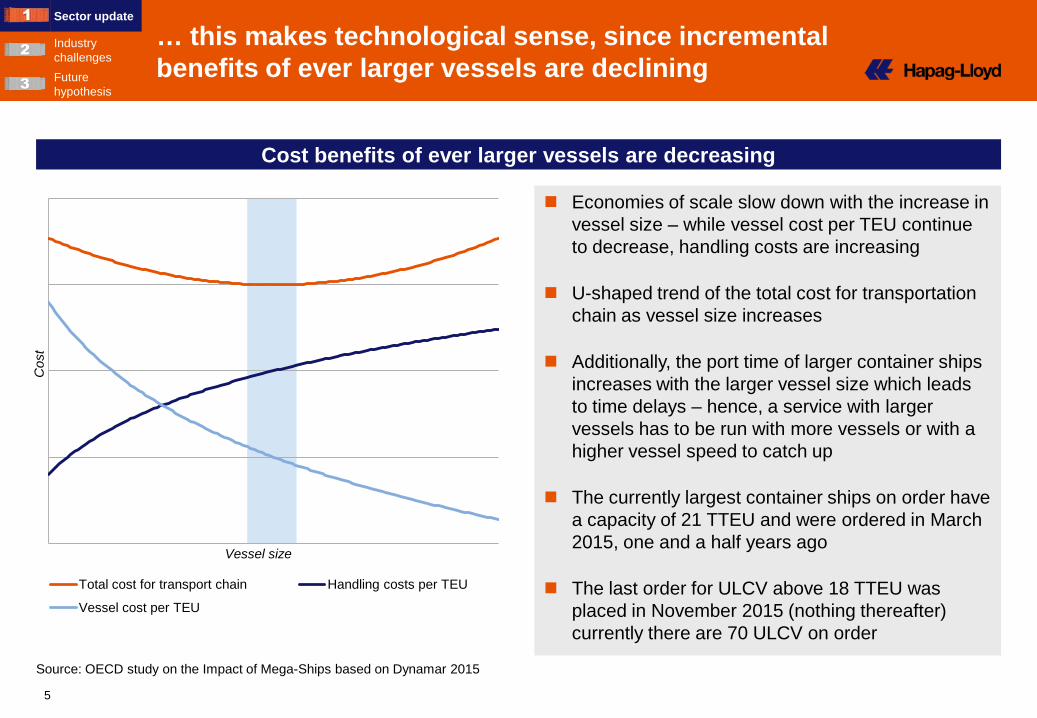
Cost benefits of ever larger vessels are decreasing
Economies of scale slow down with the increase in vessel size – while vessel cost per TEU continue to decrease, handling costs are increasing
U-shaped trend of the total cost for transportation chain as vessel size increases
Additionally, the port time of larger container ships increases with the larger vessel size which leads to time delays – hence, a service with larger vessels has to be run with more vessels or with a higher vessel speed to catch up
The currently largest container ships on order have a capacity of 21 TTEU and were ordered in March 2015, one and a half years ago
The last order for ULCV above 18 TTEU was placed in November 2015 (nothing thereafter) currently there are 70 ULCV on order
Source: OECD study on the Impact of Mega-Ships based on Dynamar 2015
… this makes technological sense, since incremental benefits of ever larger vessels are declining
Sector update
Industry challenges Future hypothesis
6
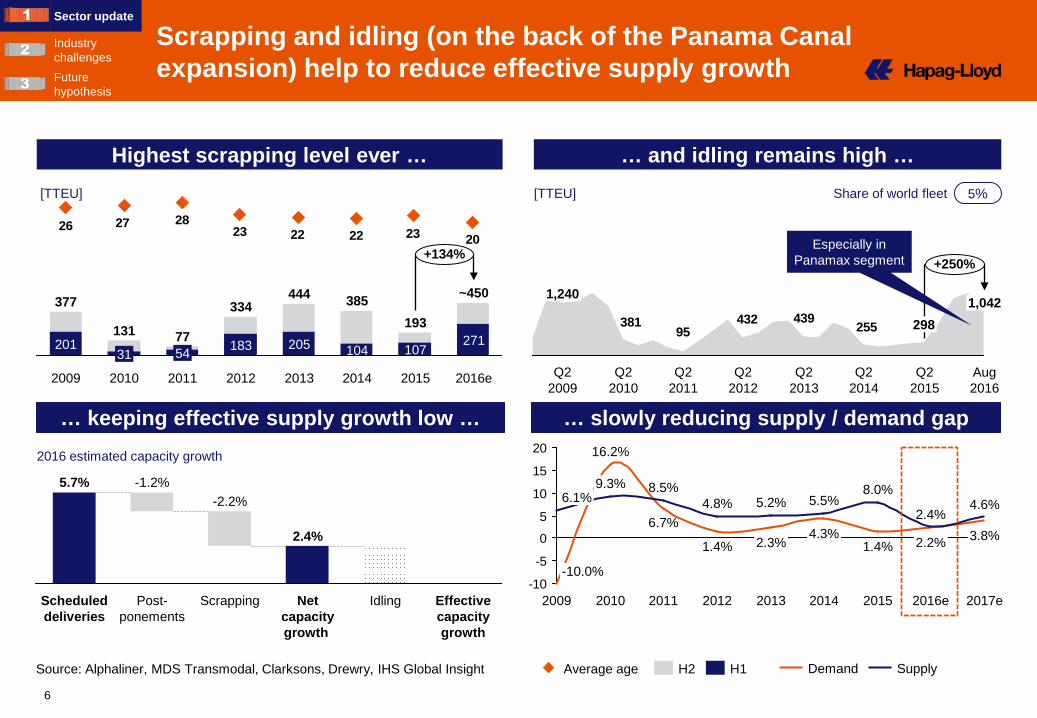
… slowly reducing supply / demand gap
Source: Alphaliner, MDS Transmodal, Clarksons, Drewry, IHS Global Insight
… and idling remains high … Highest scrapping level ever … [TTEU] [TTEU]
… keeping effective supply growth low … 2016 estimated capacity growth
2023222223282726
205 201
377
2011 2012
334
183 271
~450 444
2009
31
131
2010
54 77
2016e
+134%
2015
193
2013
104
385
2014
107
Average age H2 H1
25543943295
381
Q2 2012
Q2 2009
Q2 2011
1,240 1,042
Q2 2014
Q2 2015
298
Q2 2013
Aug 2016
Q2 2010
+250%
-10
-5
0
5
10
15
20
2009
6.7%
6.1% 4.6%
16.2%
-10.0%
2017e
2.2%
2015 2014
5.5% 5.2%
1.4% 4.3%
2013 2012
4.8% 8.5%
2.3% 1.4%
2011
9.3%
2010
8.0%
3.8%
2016e
2.4%
Demand Supply
Scheduled deliveries
5.7%
Post-ponements
-1.2%
Net capacity growth
2.4%
Scrapping
-2.2%
Idling Effective capacity growth
Especially in Panamax segment
5% Share of world fleet
Scrapping and idling (on the back of the Panama Canal expansion) help to reduce effective supply growth
Sector update
Industry challenges Future hypothesis
7
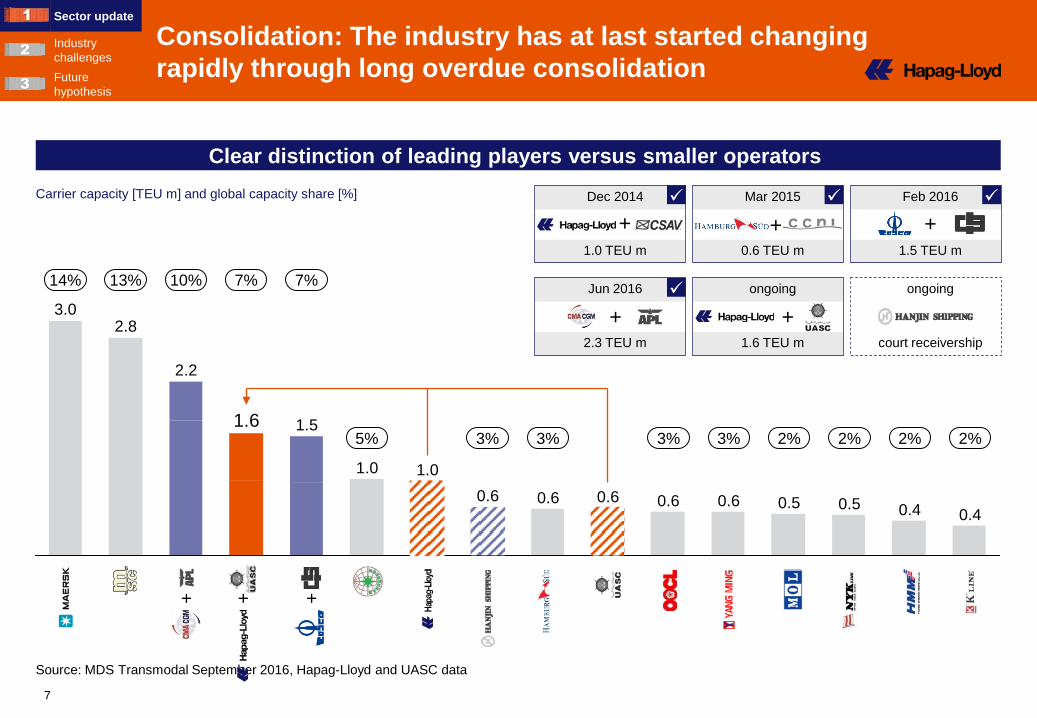
Clear distinction of leading players versus smaller operators
Consolidation: The industry has at last started changing rapidly through long overdue consolidation
Sector update
Industry challenges Future hypothesis
Source: MDS Transmodal September 2016, Hapag-Lloyd and UASC data
Carrier capacity [TEU m] and global capacity share [%]
1.0
0.6 0.6 0.5 0.5 0.6 0.6 0.6 0.4 0.4
2.2
1.6 1.5
1.0
2.8 3.0
+ + +
2.3 TEU m
Jun 2016
1.5 TEU m 0.6 TEU m
Feb 2016 Mar 2015
1.0 TEU m
Dec 2014 +
+
+
+
1.6 TEU m
ongoing +
court receivership
ongoing 14% 13% 10% 7% 7%
5% 3% 3% 3% 3% 2% 2% 2% 2%
8
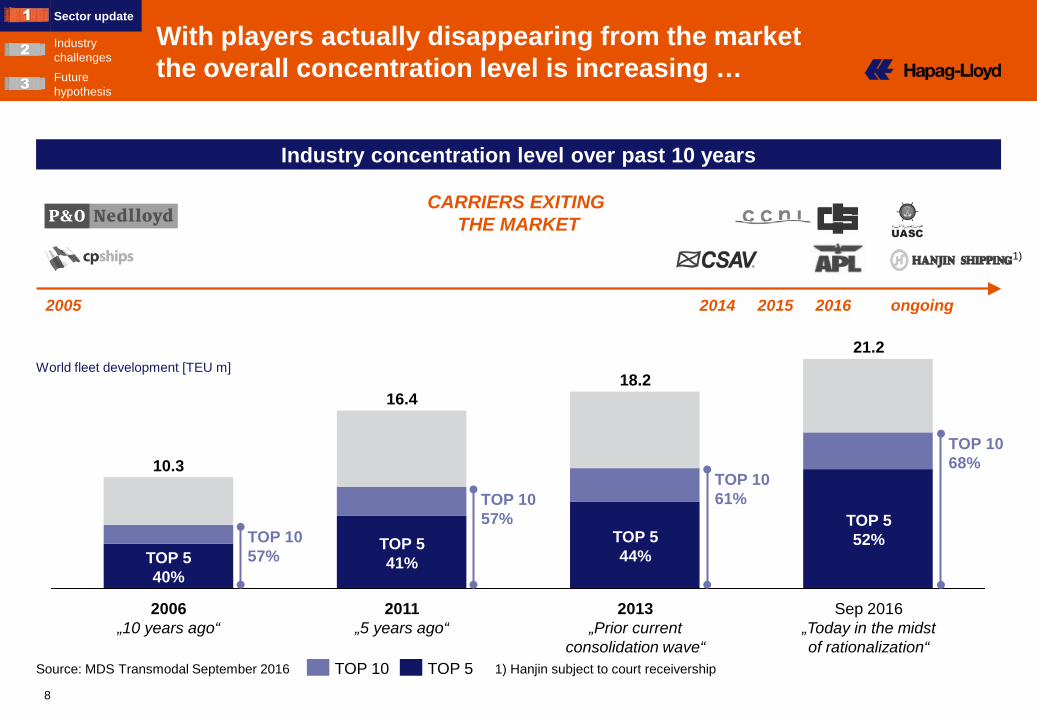
TOP 5 52%
21.2
Sep 2016 „Today in the midst of rationalization“
2006 „10 years ago“
TOP 5 41%
16.4
TOP 5 40%
10.3
2013 „Prior current
consolidation wave“
TOP 5 44%
2011 „5 years ago“
18.2
Industry concentration level over past 10 years
World fleet development [TEU m]
TOP 10 TOP 5
TOP 10 57%
TOP 10 57%
TOP 10 61%
TOP 10 68%
Source: MDS Transmodal September 2016
CARRIERS EXITING THE MARKET
2005 2014 2015 2016 ongoing
With players actually disappearing from the market the overall concentration level is increasing …
Sector update
Industry challenges Future hypothesis
1) Hanjin subject to court receivership
1)
9
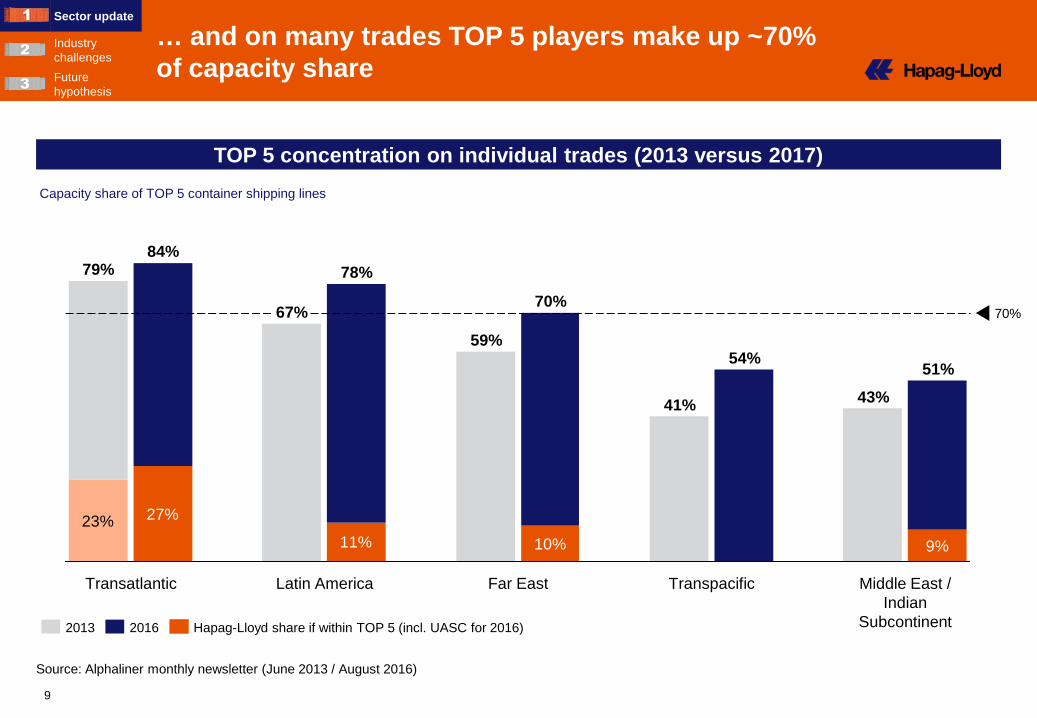
TOP 5 concentration on individual trades (2013 versus 2017) Capacity share of TOP 5 container shipping lines
9%10%11%
27%23%
54%
43% 41%
70%
51%
70%
59%
78%
67%
84% 79%
Transatlantic Transpacific Far East Latin America Middle East / Indian
Subcontinent 2016 Hapag-Lloyd share if within TOP 5 (incl. UASC for 2016) 2013
Source: Alphaliner monthly newsletter (June 2013 / August 2016)
… and on many trades TOP 5 players make up ~70% of capacity share
Sector update
Industry challenges Future hypothesis
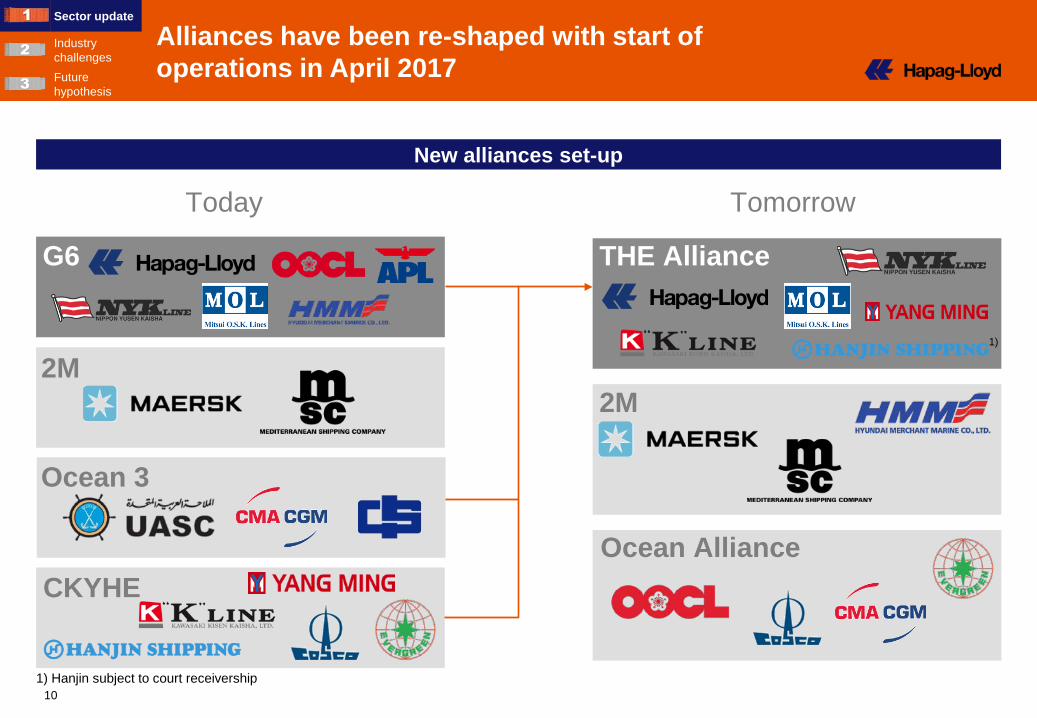
10
New alliances set-up
Alliances have been re-shaped with start of operations in April 2017
Sector update
Industry challenges Future hypothesis
Today Tomorrow
2M
CKYHE
2M
Ocean Alliance
THE Alliance G6
Ocean 3
1) Hanjin subject to court receivership
1)

11
Apr Jan Oct Jul Apr Jan Oct Jul Apr Jan Oct Jul Apr Jan Jul Oct
+3.3%
YTD July 2016
88.8
YTD July 2015
85.9
Global volumes are developing okay …
Since Q3 average margins are negative …
… while H1 freight rates were a disaster
… and in H1 even market leaders are “red”
Q2 2016
-2.4%
-8.1%
Q1 2016
0.2%
-5.5%
Q4 2015
0.8%
-5.8%
Q3 2015
3.8%
-1.8%
Q2 2015
Q1 2015
Q4 2014
Q3 2014
Q2 2014
Q1 2014
Q4 2013
Q3 2013
Q2 2013
Q1 2013
Hapag-Lloyd EBIT margin Average carrier operating margins
Wor
ld c
onta
iner
vol
ume
(C
TS) [
TEU
m]
2014 2015 2016
CCFI composite index (SSE)
2013
Hapag-Lloyd
-1.0%
Wan-Hai
2.4%
Hyundai
-18.5% Yang-Ming
-14.9%
COSCO
-12.6%
Hanjin
-9.8%
Evergreen
-9.0%
MOL
-7.6%
K-Line
-7.1%
NYK
-3.3%
OOCL
-2.9%
CMA CGM
-1.4%
Maersk
-1.1%
1)
Q2
Carrier results are not sustainable – In H1 all global liner companies posted negative operating margins
Sector update
Industry challenges Future hypothesis
1) Average of APL (until Q1 16), CMA CGM, CSCL (until Q1 16), Evergreen, Hanjin, HMM, Hapag-Lloyd, K-Line, Maersk, MOL, NYK, Wan Hai, Yang Ming, Zim (until Q1 16)
Source: Company information, Alphaliner, CTS, Drewry, SSE Note: Company reporting. EBIT margin as stated, otherwise calculated
12
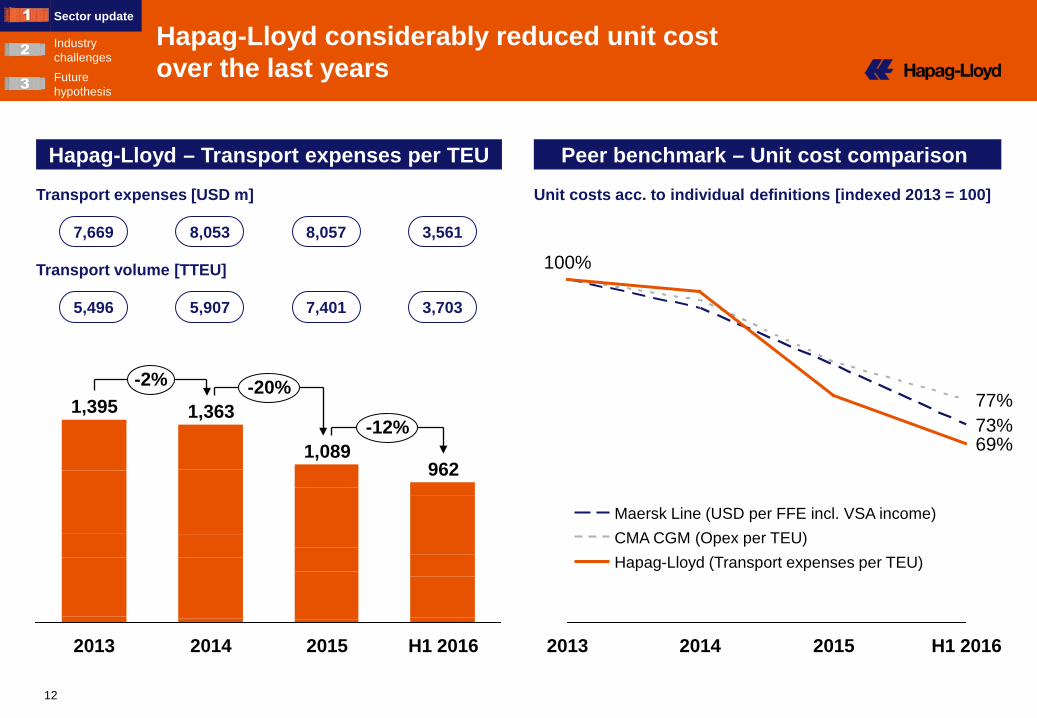
Hapag-Lloyd – Transport expenses per TEU Peer benchmark – Unit cost comparison
-12%
2015 H1 2016
962
-20% -2% 1,363
2013
1,395
1,089
2014
100%
H1 2016 2015 2014 2013
69% 73% 77%
Transport volume [TTEU]
5,496 5,907 7,401 3,703
Transport expenses [USD m]
7,669 8,053 8,057 3,561
Unit costs acc. to individual definitions [indexed 2013 = 100]
Hapag-Lloyd (Transport expenses per TEU) CMA CGM (Opex per TEU) Maersk Line (USD per FFE incl. VSA income)
Sector update
Industry challenges Future hypothesis
Hapag-Lloyd considerably reduced unit cost over the last years
13
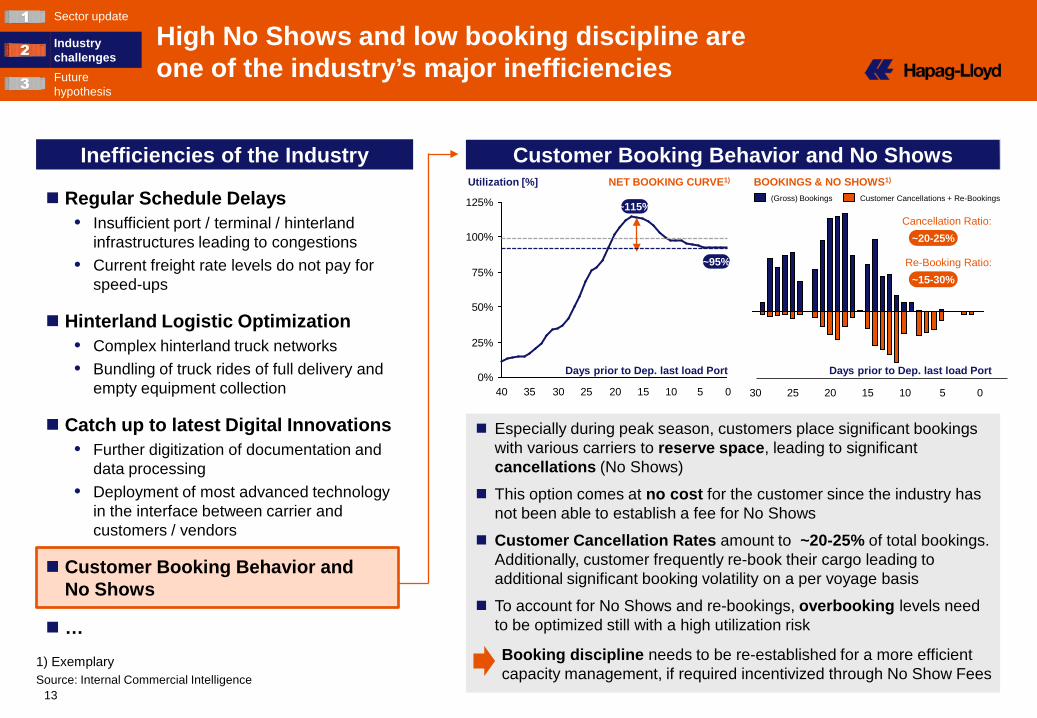
Inefficiencies of the Industry Customer Booking Behavior and No Shows
Especially during peak season, customers place significant bookings with various carriers to reserve space, leading to significant cancellations (No Shows)
This option comes at no cost for the customer since the industry has not been able to establish a fee for No Shows
Customer Cancellation Rates amount to ~20-25% of total bookings. Additionally, customer frequently re-book their cargo leading to additional significant booking volatility on a per voyage basis
To account for No Shows and re-bookings, overbooking levels need to be optimized still with a high utilization risk
Source: Internal Commercial Intelligence
Regular Schedule Delays • Insufficient port / terminal / hinterland
infrastructures leading to congestions • Current freight rate levels do not pay for
speed-ups
Hinterland Logistic Optimization • Complex hinterland truck networks • Bundling of truck rides of full delivery and
empty equipment collection
Catch up to latest Digital Innovations • Further digitization of documentation and
data processing • Deployment of most advanced technology
in the interface between carrier and customers / vendors
Customer Booking Behavior and No Shows
…
0%
25%
50%
75%
100%
125%
5 40 35 30 25 0 20 15 10
Days prior to Dep. last load Port
Utilization [%]
~95%
~115%
NET BOOKING CURVE1) BOOKINGS & NO SHOWS1)
Days prior to Dep. last load Port
1) Exemplary Booking discipline needs to be re-established for a more efficient capacity management, if required incentivized through No Show Fees
5 20 15 10 25 0 30
(Gross) Bookings Customer Cancellations + Re-Bookings
Cancellation Ratio: ~20-25%
Re-Booking Ratio: ~15-30%
High No Shows and low booking discipline are one of the industry’s major inefficiencies
Sector update
Industry challenges Future hypothesis
14
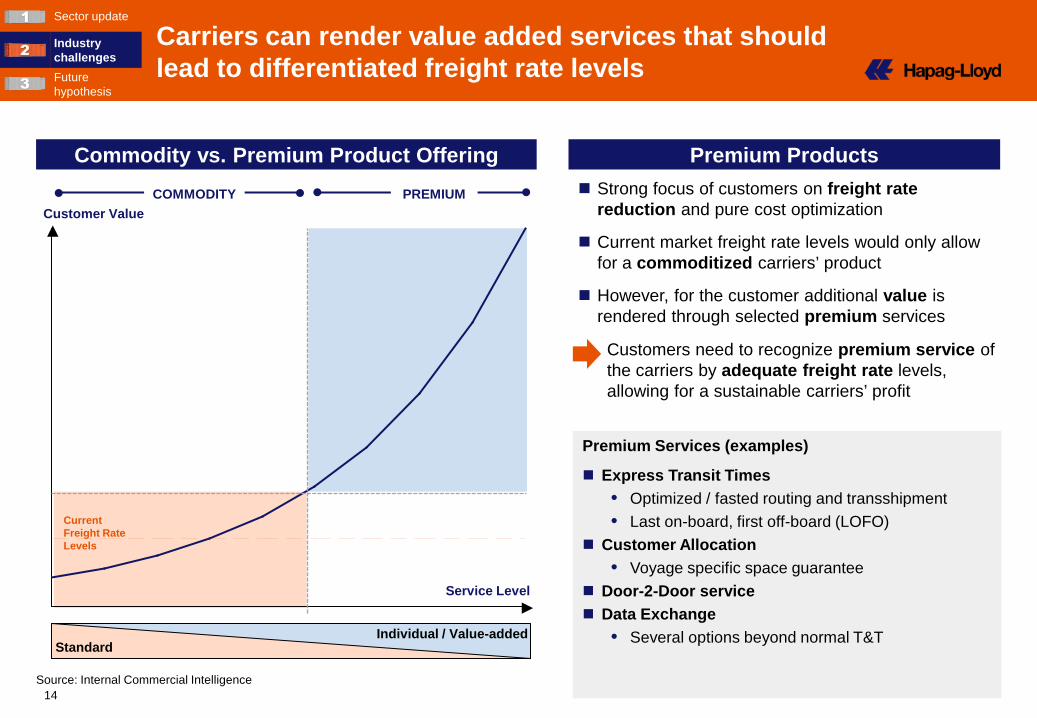
Commodity vs. Premium Product Offering Premium Products
Premium Services (examples)
Express Transit Times • Optimized / fasted routing and transshipment • Last on-board, first off-board (LOFO)
Customer Allocation • Voyage specific space guarantee
Door-2-Door service Data Exchange
• Several options beyond normal T&T
Customer Value
Service Level
Current Freight Rate Levels
Standard Individual / Value-added
COMMODITY PREMIUM Strong focus of customers on freight rate reduction and pure cost optimization
Current market freight rate levels would only allow for a commoditized carriers’ product
However, for the customer additional value is rendered through selected premium services
Source: Internal Commercial Intelligence
Customers need to recognize premium service of the carriers by adequate freight rate levels, allowing for a sustainable carriers’ profit
Carriers can render value added services that should lead to differentiated freight rate levels
Sector update
Industry challenges Future hypothesis
15
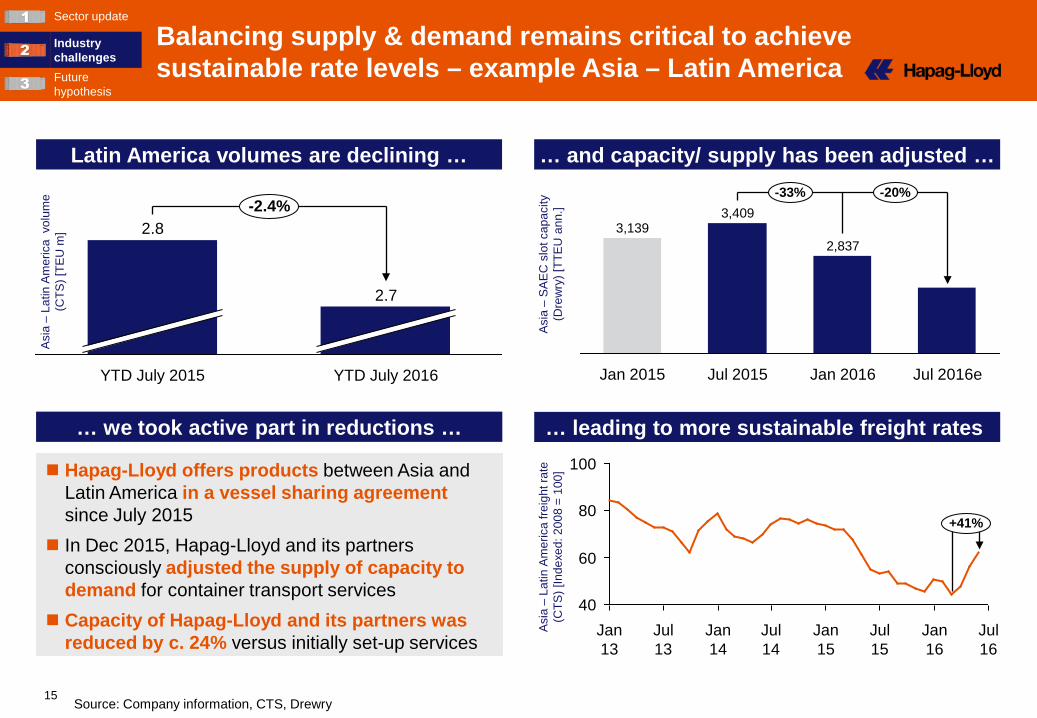
-2.4%
YTD July 2016
2.7
YTD July 2015
2.8
Latin America volumes are declining …
… we took active part in reductions …
… and capacity/ supply has been adjusted …
… leading to more sustainable freight rates
Source: Company information, CTS, Drewry
Asi
a –
Latin
Am
eric
a v
olum
e (C
TS) [
TEU
m]
-33% -20%
Jul 2016e Jan 2016
2,837
Jul 2015
3,409
Jan 2015
3,139
40
60
80
100
Jul 16
Jan 16
Jul 15
Jan 15
Jul 14
Jan 14
Jul 13
Jan 13
+41%
Hapag-Lloyd offers products between Asia and Latin America in a vessel sharing agreement since July 2015
In Dec 2015, Hapag-Lloyd and its partners consciously adjusted the supply of capacity to demand for container transport services
Capacity of Hapag-Lloyd and its partners was reduced by c. 24% versus initially set-up services
Asi
a –
SA
EC
slo
t cap
acity
(D
rew
ry) [
TTE
U a
nn.]
Asi
a –
Latin
Am
eric
a fre
ight
rate
(C
TS) [
Inde
xed:
200
8 =
100]
Balancing supply & demand remains critical to achieve sustainable rate levels – example Asia – Latin America
Sector update
Industry challenges Future hypothesis
16
1
2
3
4
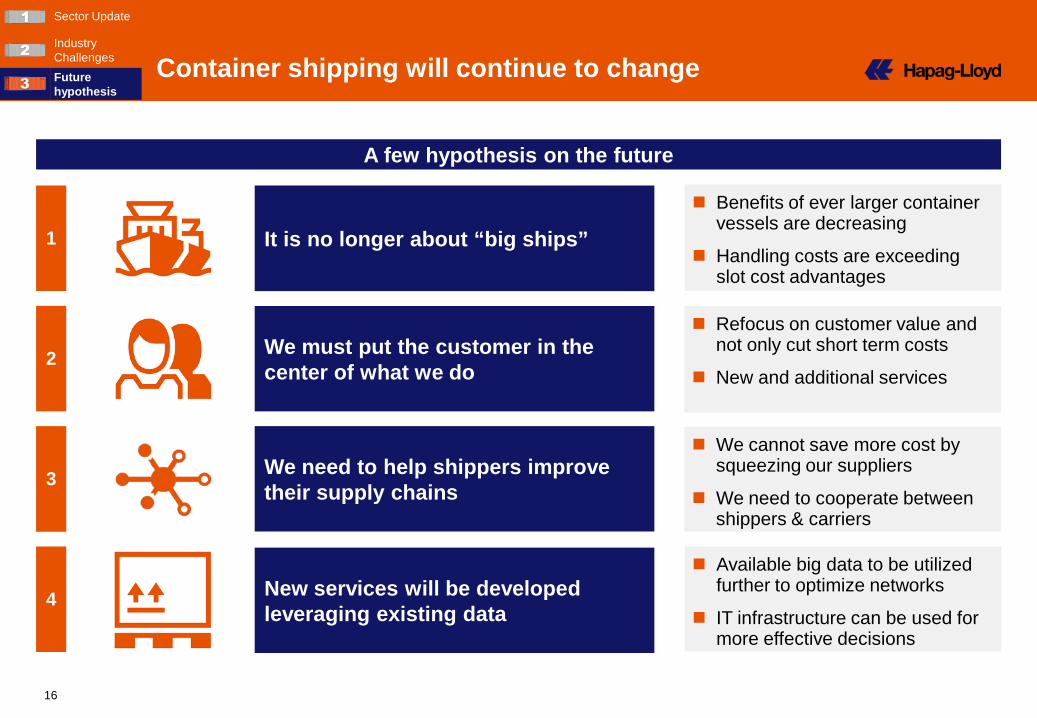
It is no longer about “big ships”
We must put the customer in the center of what we do
We need to help shippers improve their supply chains
New services will be developed leveraging existing data
Benefits of ever larger container vessels are decreasing
Handling costs are exceeding slot cost advantages
Refocus on customer value and not only cut short term costs
New and additional services
We cannot save more cost by squeezing our suppliers
We need to cooperate between shippers & carriers
Available big data to be utilized further to optimize networks
IT infrastructure can be used for more effective decisions
A few hypothesis on the future
Sector Update
Industry Challenges Future hypothesis
Container shipping will continue to change
17
Disclaimer
Forward-looking Statements
This presentation contains forward-looking statements that involve a number of risks and uncertainties. Such statements are based on a number of assumptions, estimates, projections or plans that are inherently subject to significant risks, as well as uncertainties and contingencies that are subject to change. Actual results can differ materially from those anticipated in the Company´s forward-looking statements as a result of a variety of factors, many of which are beyond the control of the Company, including those set forth from time to time in the Company´s press releases and reports and those set forth from time to time in the Company´s analyst calls and discussions. We do not assume any obligation to update the forward-looking statements contained in this presentation.
This presentation does not constitute an offer to sell or a solicitation or offer to buy any securities of the Company, and no part of this presentation shall form the basis of or may be relied upon in connection with any offer or commitment whatsoever. This presentation is being presented solely for your information and is subject to change without notice.