john wilson - chairmanmedia.nzherald.co.nz/webcontent/document/pdf/201313/fonterr2.pdf · •...
TRANSCRIPT


© Fonterra Co-operative Group Ltd. ‹#›
John Wilson - Chairman

© Fonterra Co-operative Group Ltd. 3
Key highlights
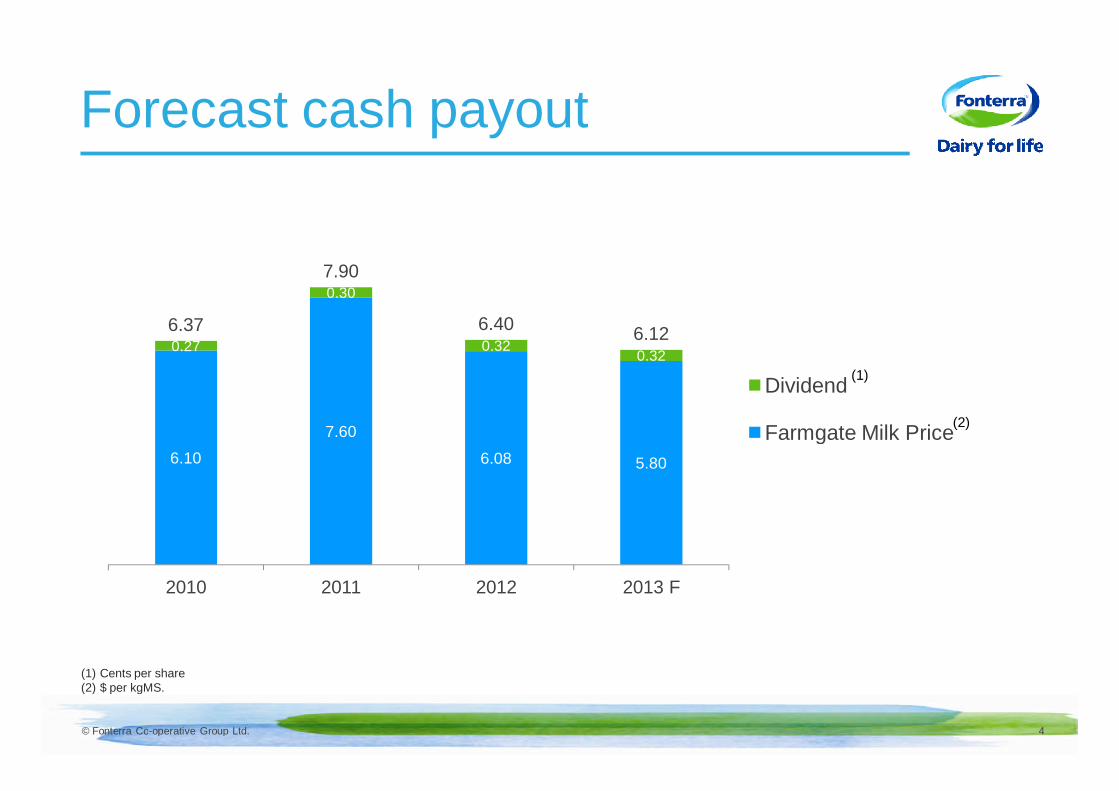
FORECAST CASH PAYOUT
$6.12Forecast Farmgate Milk Price lifted to $5.80kgMS. The full year dividend forecast remainsat 32 cps
VOLUME: MILK COLLECTIONS
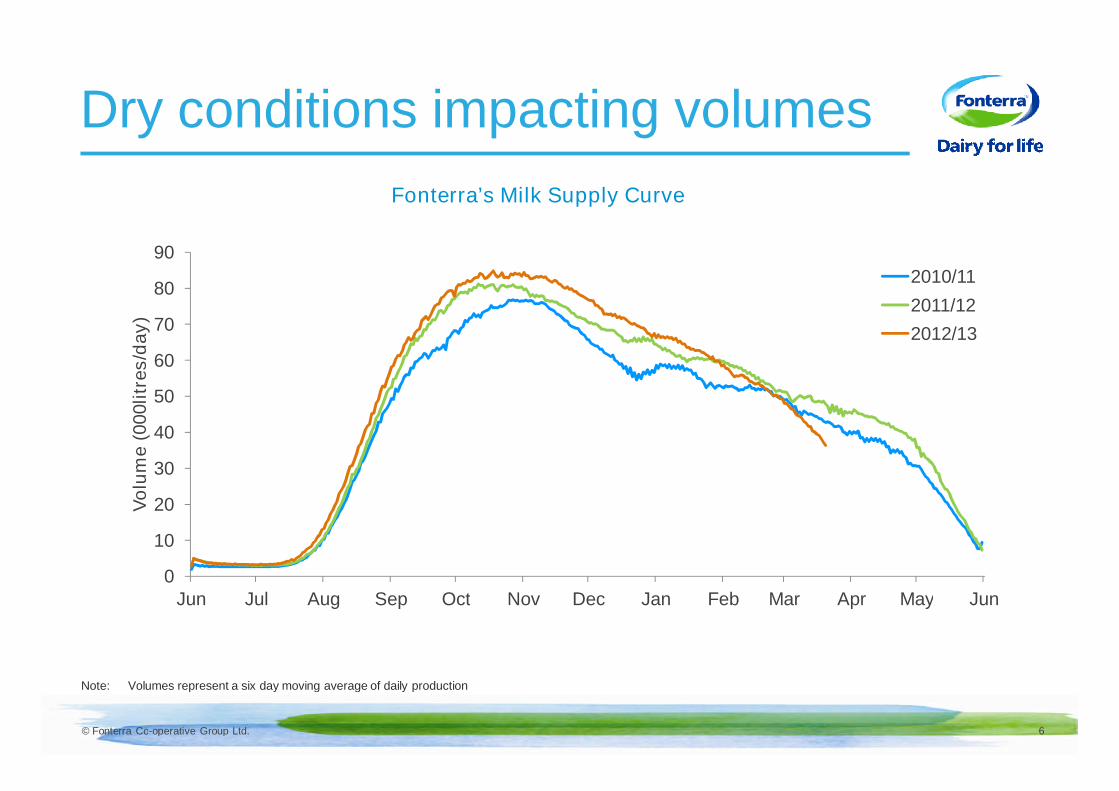
6%Record milk collections in the first half. MajorNorth Island drought is having significant impacton second half volumes
VALUE: EARNINGS PER SHARE
29cpsNet Profit After Tax up 33% to $459m
INTERIM DIVIDEND
16cpsInterim dividend represents 50% of our forecastdividend and the maximum available under the40-50% range in our dividend policy
© Fonterra Co-operative Group Ltd. 4
Forecast cash payout
(1) Cents per share(2) $ per kgMS.
(1)
6.10
7.60
6.08 5.80
0.27
0.30
0.320.32
6.37
7.90
6.406.12
2010 2011 2012 2013 F
Dividend
Farmgate Milk Price(2)
(1)
© Fonterra Co-operative Group Ltd. 5
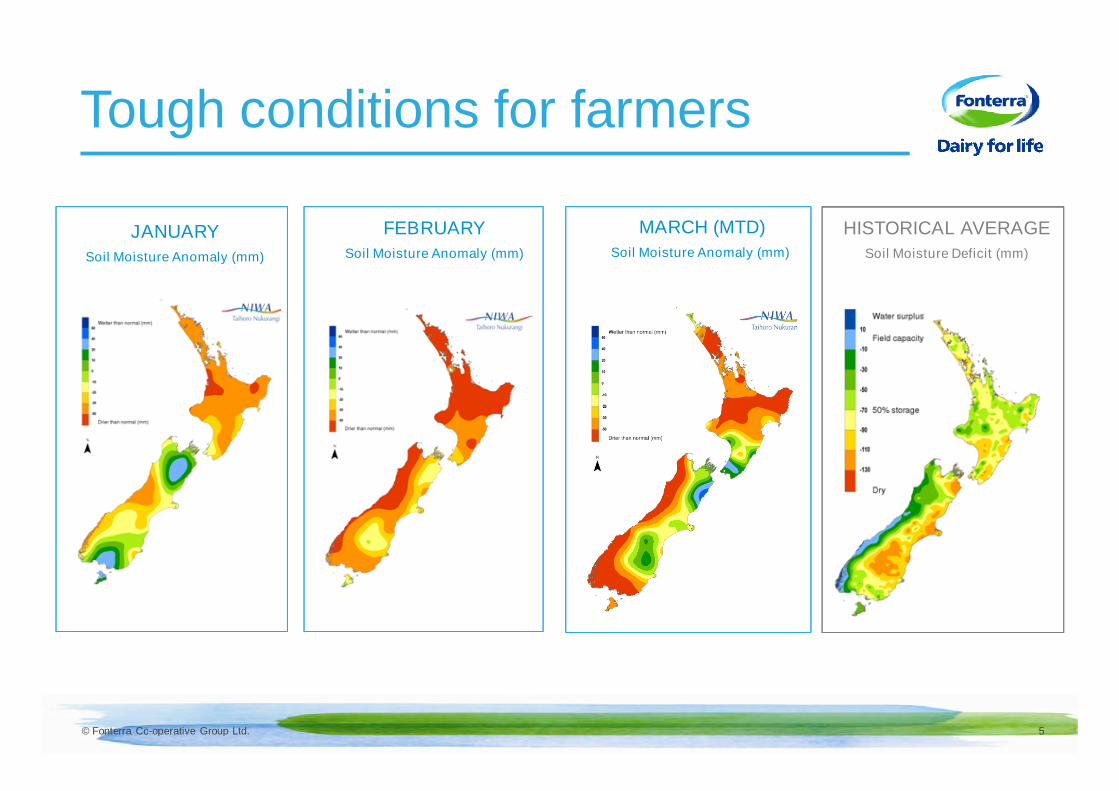
Tough conditions for farmers
JANUARY
Soil Moisture Anomaly (mm)
FEBRUARY
Soil Moisture Anomaly (mm)
MARCH (MTD)
Soil Moisture Anomaly (mm)
HISTORICAL AVERAGE
Soil Moisture Deficit (mm)
© Fonterra Co-operative Group Ltd. 6
Dry conditions impacting volumes
Note: Volumes represent a six day moving average of daily production
0
10
20
30
40
50
60
70
80
90
Jun Jul Aug Sep Oct Nov Dec Jan Feb Mar Apr May Jun
Vo
lum
e(0
00litr
es/d
ay)
2010/11
2011/12
2012/13
Fonterra’s Milk Supply Curve

© Fonterra Co-operative Group Ltd. 7
• Backed by our strong balance sheet and operating cash flows, we were able toincrease the advance rate paid to farmers for their milk
• The faster advance rate together with higher forecast milk price means onaverage farmer shareholders will receive around $100,000* earlier in theseason
• Means we are getting cash to farmers faster, as they begin to dry off their herdsfor the winter earlier because of the drought
Faster cash payments to farmers for milk
* As at June 2013, compared to opening advance rate schedules

© Fonterra Co-operative Group Ltd. 8
Major initiatives benefitting our farmers
1. A bonus issue of one for 40 – 24 April 2013
2. A further Supply Offer enabling shareholders to sell economic rights of someof their shares - May 2013
3. A Dividend Reinvestment Plan enabling shareholders and unit holders toelect to receive dividends in the form of shares or units - later this year
4. Flexible contracts to give new and growing farmers more time and options tofully back their milk production with Fonterra shares
5. New opportunities for winter milk supply contracts in the upper North Island tofuel Fonterra’s new UHT plant at Waitoa

© Fonterra Co-operative Group Ltd.
Theo Spierings

© Fonterra Co-operative Group Ltd. 10
Strong first half
Volume• Good first half volume growth
– NZ Milk Products up 9% driven by record milk collections
– Higher sales growth in Asia/AME & Latam
– ANZ volumes impacted by Norco divestment & less privatelabel
Value• NZ Milk Products up 65%
– Favourable product mix due to relatively higher cheese andcasein prices
– Improved price premiums
• Asia/AME up 27%
– Sustained growth in foodservice and consumer brands
• Soprole up 40%
– Higher consumer sales and margins in Chile
SALES VOLUME GROWTH:
8%Total sales volume growth of8% to 2.1m MT
NORMALISED EBIT:
$693mUp 26% on the prior period
© Fonterra Co-operative Group Ltd. 11
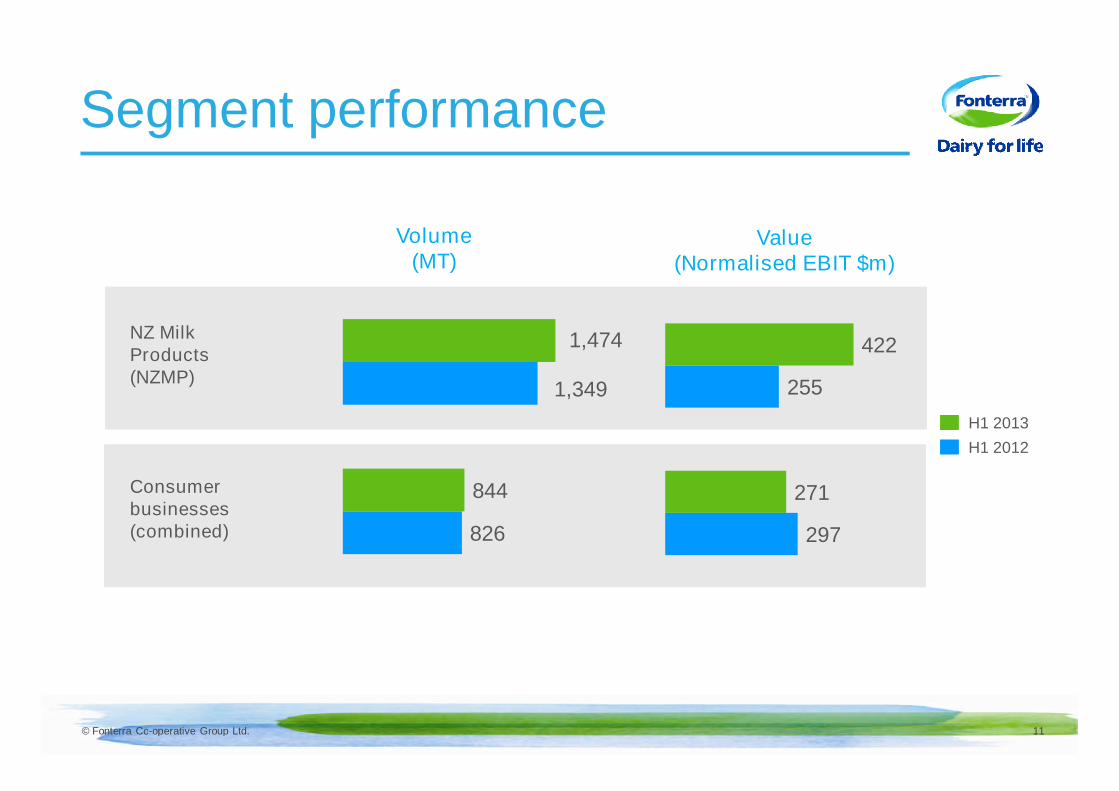
Segment performance
Consumerbusinesses(combined)
Volume(MT)
H1 2013
H1 2012
Value(Normalised EBIT $m)
NZ MilkProducts(NZMP)
297
255
271
422
826
1,349
844
1,474

© Fonterra Co-operative Group Ltd. 12
NZMP highlights
Normalised EBIT ($m)
ValueGrowth
65%
VolumeGrowth
9%255
422
H1 2012 H1 2013
Volume
• 9% increase to 1.5 million MT
Value
• Normalised EBIT margin up 2.8pp to 6.2%
• Key drivers of value:
– effective management of our product mix
– higher price premiums compared to dairycommodity prices
• Operating costs lower on a per unit basis,despite higher activity levels

© Fonterra Co-operative Group Ltd. 13
ANZ highlights
Volume
• 1% higher after adjusting for sale ofNorco distribution business
Value
• Normalised EBIT margin down 1.5pp to4.9%
• NZ consumer brands earnings slightly up
• Australian consumer brands impacted byincreased trade spend to maintain share
• Australian milk processing businessimpacted by intensifying competition formilk supply
Normalised EBIT ($m)
ValueGrowth
-32%
VolumeGrowth1
1%
145
98
H1 2012 H1 2013
1 Volume growth after adjusting for the sale of the Norco business

© Fonterra Co-operative Group Ltd. 14
Reshape of ANZ underway
Current Future State
Consumer • Number of brands
• A&P spread across brands
• Majority of A&P on fewer brands
• Everyday Nutrition key priority
• New innovations
Milk Processing • Under-utilised assets
• Competitive milk pool
• Higher utilisation of value addplants at the expense ofcommodity exports
Foodservice • Strong footprint inAustralia
• Fast expansion of foodserviceoperations
• Continued investment in networkof chefs
© Fonterra Co-operative Group Ltd. 15
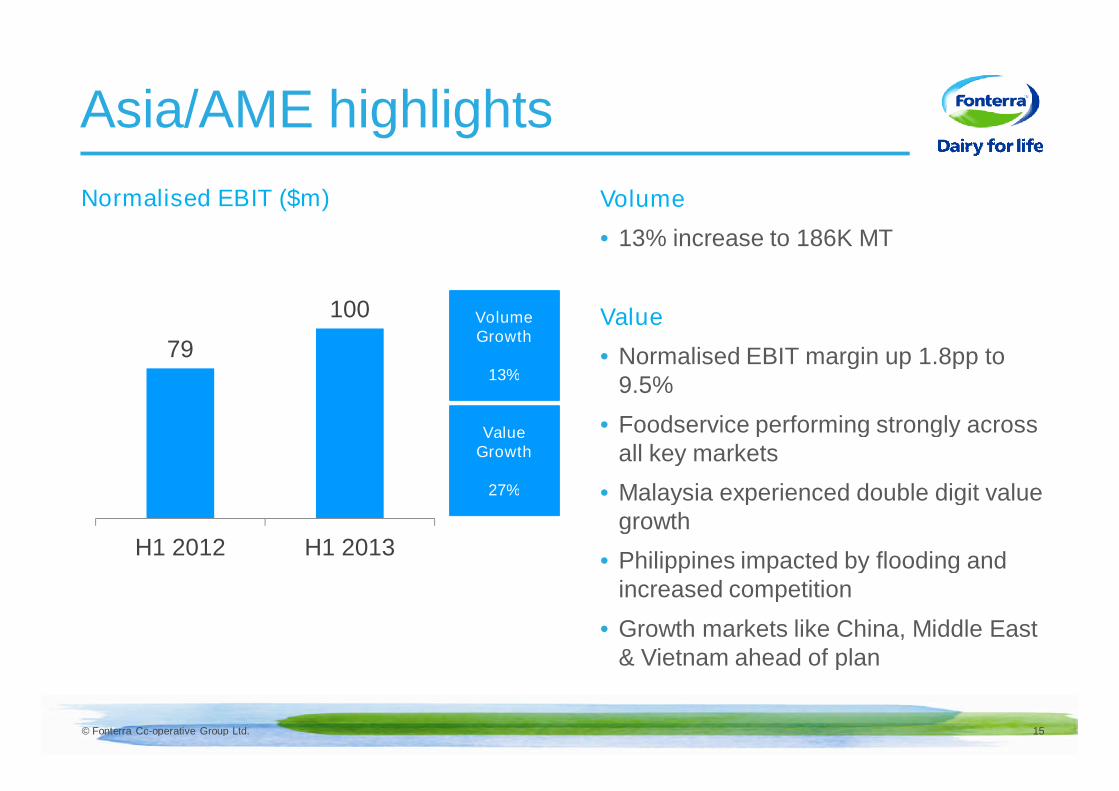
Asia/AME highlights
Volume
• 13% increase to 186K MT
Value
• Normalised EBIT margin up 1.8pp to9.5%
• Foodservice performing strongly acrossall key markets
• Malaysia experienced double digit valuegrowth
• Philippines impacted by flooding andincreased competition
• Growth markets like China, Middle East& Vietnam ahead of plan
Normalised EBIT ($m)
ValueGrowth
27%
VolumeGrowth
13%
79
100
H1 2012 H1 2013

© Fonterra Co-operative Group Ltd. 16
Latam highlights
Volume
• 11% growth in volume to 187K MT
Value
• Normalised EBIT margin down 0.7pp to 12%
• Soprole performed strongly with normalisedEBIT of $53m, up 40%
– Product innovation with successful launchof new desserts and yoghurts
– Growth in both flavoured and white milk
• DPA normalised EBIT of $13 million was46% lower
– Prior year impairment charge of $8m
– Negative impact from lower volumes inVenezuela
Normalised EBIT ($m)
64 67
H1 2012 H1 2013
ValueGrowth
5%
VolumeGrowth
11%
© Fonterra Co-operative Group Ltd. ‹#›
Jonathan Mason

© Fonterra Co-operative Group Ltd. 18
Improved Gearing and Working Capital
1. Gearing is measured in terms of economic net interest bearing debt over economic net interest bearing debt plus equity (reflecting the effect of debt hedging in place atbalance date)
2. Excluding suppliers payable
Half Year Gearing1
60%
54%
49% 47%
40%
H1 2009 H12010 H12011 H12012 H12013
Working Capital Days2
103104
97
H12011 H12012 H12011

© Fonterra Co-operative Group Ltd. 19
Interim dividend declared
• Board declared dividend of 16 cps
• Represents 50%of forecast dividend forthe current financial year
• Maximum available under 40-50% rangein our dividend policy
• Reflects expectation that earnings will beweighted more to the first half of the year
8
12
16
H1 2011 H1 2012 H1 2013

© Fonterra Co-operative Group Ltd. 20
Supply Offer
• Supply Offer in May 2013
• Maximum of $475m, being the net proceeds ofthe original seeding of the FonterraShareholders’ Fund
• Sell price will be based on an average of the Unitprice over a 10 day period
• Limit of 25 per cent of Wet Shares
• More to come in late April with the Supply OfferBooklet

© Fonterra Co-operative Group Ltd.
Theo Spierings

© Fonterra Co-operative Group Ltd. 22
Incre
asin
gM
arg
in
Strategy: Blueprint for growth
STRATEGIC PATHS PROGRESSMARGINPOTENTIAL
• New plant investments and Studholme acquisition
• Strong 1st half for price premiums, quality and productivity
• New group optimisation function driving better decision making
• Reshape Australia & New Zealand brands (refer slide 16)
• Taskforce developing a prioritised view of markets, products and brands
• ASEAN & China roll-out ahead of plan
• Continued focus on product innovation for both pastry and hot kitchen
• $100m UHT plant investment supports expansion
• Signed agreements to complete our first farming hub in China
• China farms on track to produce 69,000 MT of milk by end of 2013
• China, Vietnam Anlene roll-out on track
• Greenfields plant in the Netherlands to process whey and lactose intopremium nutrition dairy ingredients
• Expansion of Anmum in China
• New third party manufacturing contracts for paediatrics
• Increased through-put from paediatric plant in Australia
Selectively
invest in milk pools
Alignment of
business and organisation
6
7
Develop selected leading position
in paediatrics & maternal
Grow our
position in mobility
Deliver on
foodservice potential
Build and grow beyond our
current consumer positions
Optimise NZ milk1
2
3
4
5
EVERYDAYNUTRITION
OUT-OF-HOME
ENABLERS
ADVANCED
NUTRITION
• Rightsizing of Europe and US operations complete
• Restructure ANZ, ASEAN & MENA
• Support review underway

© Fonterra Co-operative Group Ltd. 23
Everyday Nutrition
• B2B: Optimise NZ Milk
‒ Enhance asset footprint (Darfield, Studholme,Waitoa UHT)
‒ New group optimisation function driving betterdecision making
‒ Strong first half for price achievement and costto serve
‒ Quality and productivity programmes deliveringahead of plan
• B2C: Build and grow beyond our currentconsumer positions
‒ Everyday Nutrition Taskforce developing aprioritised view across products and brand
‒ Reshape Australia & New Zealand brands
‒ Focused growth ASEAN/MENA
© Fonterra Co-operative Group Ltd. 24
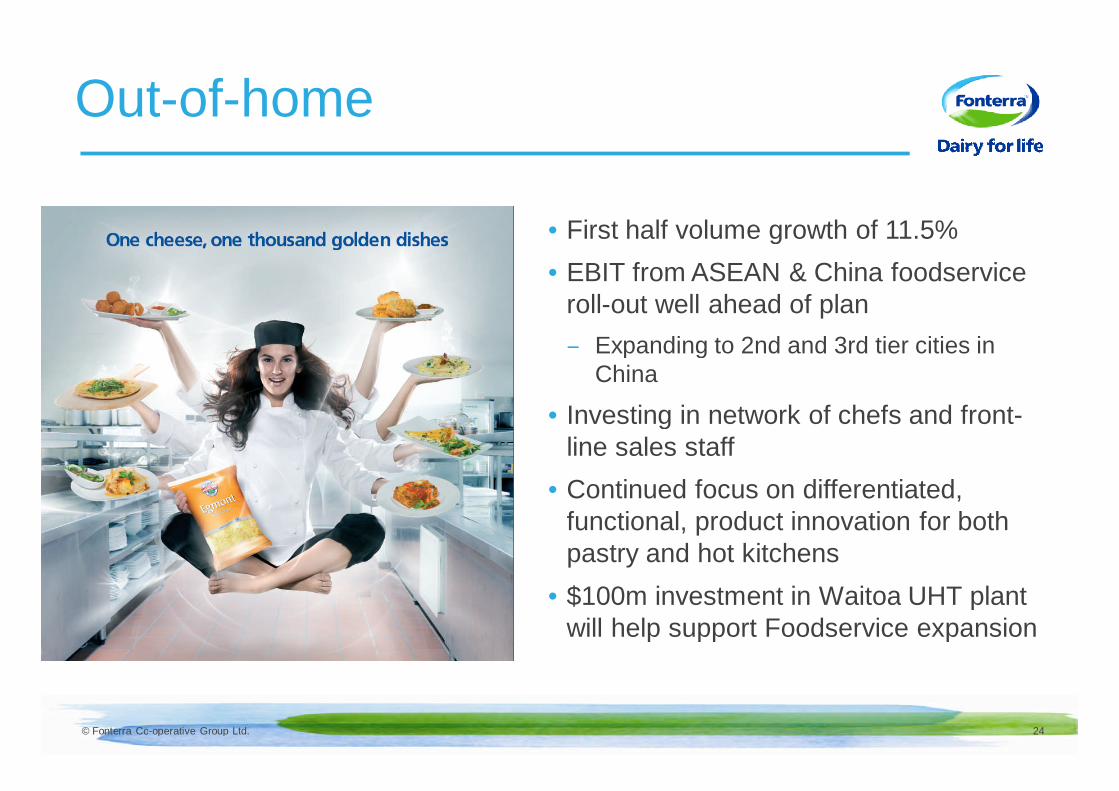
Out-of-home
• First half volume growth of 11.5%
• EBIT from ASEAN & China foodserviceroll-out well ahead of plan
‒ Expanding to 2nd and 3rd tier cities inChina
• Investing in network of chefs and front-line sales staff
• Continued focus on differentiated,functional, product innovation for bothpastry and hot kitchens
• $100m investment in Waitoa UHT plantwill help support Foodservice expansion

© Fonterra Co-operative Group Ltd. 25
Advanced Nutrition
• Growing our position in mobility
‒ China Anlene rollout on track
‒ Vietnam rollout ahead of plan
• Develop leading position in paediatrics andmaternal
‒ Expansion of Anmum in China
‒ New third party manufacturing contracts forpaediatrics
‒ Increased through-put from paediatrics plant inAustralia
• Greenfields plant in the Netherlands to processwhey and lactose into premium nutrition dairyingredients
© Fonterra Co-operative Group Ltd. 26
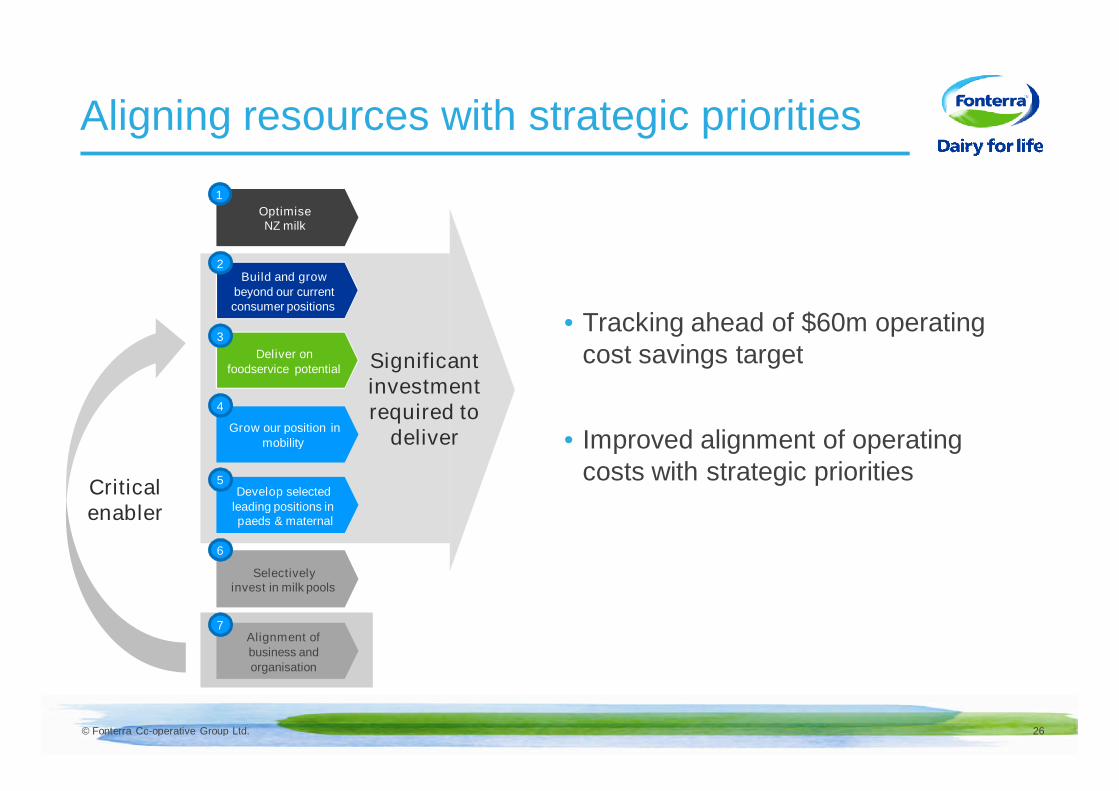
Aligning resources with strategic priorities
• Tracking ahead of $60m operatingcost savings target
• Improved alignment of operatingcosts with strategic priorities
OptimiseNZ milk
1
Build and growbeyond our currentconsumer positions
2
Deliver onfoodservice potential
3
Grow our position inmobility
4
Develop selectedleading positions inpaeds & maternal
5
Selectivelyinvest in milk pools
6
Alignment ofbusiness andorganisation
7
Criticalenabler
Significantinvestmentrequired to
deliver
© Fonterra Co-operative Group Ltd. 27
Outlook
• Making good progress on strategy execution and positioning the business for long-term growth
• Strong first half earnings are unlikely to be repeated in the second half
• For the full year we expect to see total milk volumes for the season to be in line withlast season
• The ongoing volatility in dairy commodity markets could have a negative impact onproduct mix profitability
• In many of our consumer markets, we are expecting intensified competition in thesecond half – particularly in Australia – and in Asia we are seeing signs of demandslowing
• Based on our best judgement the current expectation for the full year Milk Price is$5.80 kgMS and an earnings per share range of 45 to 50 cps.
• The dividend per share forecast of 32 cps remains unchanged

© Fonterra Co-operative Group Ltd.
Supplementary Information

© Fonterra Co-operative Group Ltd. 29
Normalised EBIT
6 months to31 January 2013
6 months to31 January 2012
Reported EBIT 669 530
Costs associated with the planned closure ofthe Cororooke site
24
Impairment losses recorded in equityaccounted investees
20
Other items 2
Normalised EBIT 693 552
Fonterra refers to Normalised Earnings/Normalised EBIT, EBIT, constant currency variances, Normalisation Adjustments and payout when discussingfinancial performance. These are non-GAAP financial measures and are not prepared in accordance with IFRS. Management believes that these measuresprovide useful information as they provide valuable insight on the underlying performance of the business. They are used internally to evaluate theunderlying performance of business units and to analyse trends. These measures are not uniformly defined or utilised by all companies. Accordingly, thesemeasures may not be comparable with similarly titled measures used by other companies. Non-GAAP financial measures should not be viewed in isolationnor considered as a substitute for measures reported in accordance with IFRS.