joint eucar/jrc/concawe study on: effects of gasoline vapour pressure and ethanol...
TRANSCRIPT
Joint EUCAR/JRC/CONCAWE Study on: Effects of Gasoline Vapour Pressure and
Ethanol Content on Evaporative Emissions from Modern Cars
Edited by G. Martini
Institute for Environment and Sustainability
2007
EUR 22713 EN
The mission of the Institute for Environment and Sustainability is to provide scientific-technical support to the European Union’s Policies for the protection the environment and sustainable development of the European and global environment. European Commission Directorate-General Joint Research Centre Institute for Environment and Sustainability Contact information Address:Giorgio Martini – T.P. 441- Via Fermi, 1 – 21020 Ispra (Italy) E-mail: [email protected] Tel.: +39 0332 789293 Fax: +39 0332 785869 http://ies.jrc.cec.eu.int http://www.jrc.cec.eu.int Legal Notice Neither the European Commission nor any person acting on behalf of the Commission is responsible for the use which might be made of this publication. A great deal of additional information on the European Union is available on the Internet. It can be accessed through the Europa server http://europa.eu.int EUR 22713 EN ISBN 978-92-79-05249-1 ISSN 1018-5593 Luxembourg: Office for Official Publications of the European Communities © European Communities, 2007 Reproduction is authorised provided the source is acknowledged Printed in Italy
JJooiinntt EEUUCCAARR//JJRRCC//CCOONNCCAAWWEE PPrrooggrraammmmee oonn::
Effects of gasoline vapour pressure and ethanol content on evaporative emissions
from modern cars
Authors: G. Martini, U. Manfredi, G. Mellios, V. Mahieu, B. Larsen, A. Farfaletti, A. Krasenbrink, G. De Santi European Commission – DG Joint Research Centre, Institute for Environment and Sustainability
S. McArragher, N. Thompson, J. Baro, P. J. Zemroch, J. Rogerson, J. Farenback-Brateman, J. Canovas, I. Dijs, K. Rose, R. Bazzani CONCAWE
F. Boggio, A. Celasco, C. Cucchi, G.F. (Barry) Cahill EUCAR Acknowledgments The authors would like to acknowledge the help and input from others who advised on the work, specifically T. Gameson (eBIO) and W. Mirabella (EFOA).
In particular the authors would like to acknowledge the essential contribution of the staff of the JRC VELA laboratory: P. Le Lijour. G. Lanappe, M. Sculati, R. Colombo. Special thank to V. Forcina and M. Douane for the analysis of unregulated pollutants.

2
INDEX 1. EXECUTIVE SUMMARY 2. BACKGROUND 3. OBJECTIVES 4. SCOPE OF TEST PROGRAMME
4.1. Test vehicles 4.2. Fuels 4.3. Programme structure 4.4. Test protocol 4.5. Issues not covered
5. TEST RESULTS 5.1. Test facility correlation (Phase 1) 5.2. Main test programme (Phase 2-3)
5.2.1. Total Evaporative Emissions 5.2.2. Evaporative VOCs Speciation and Ethanol Content 5.2.3. Exhaust Emissions and Fuel Consumption 5.2.4. Aldehyde Emissions
5.3. Extra tests 5.3.1. Tests performed with the canister vented out of the VT SHED 5.3.2. Consecutive multiple tests on the same fuel
6. DISCUSSION OF THE RESULTS 6.1. Evaporative emissions 6.2. Results of the extra tests 6.3. Effect of ethanol on canister efficiency 6.4. VOC Speciation data
7. CONCLUSIONS FROM EUCAR/CONCAWE/JRC EVAPORATIVE EMISSIONS TEST PROGRAMME 8. REFERENCES APPENDIX 1 - EVAPORATIVE EMISSIONS: OVERVIEW APPENDIX 2 – FUEL ANALYTICAL DATA APPENDIX 3 – DETAILS OF TEST PROCEDURE APPENDIX 4 – EVAPORATIVE EMISSIONS AND TEST PROTOCOL RELATED EFFECTS APPENDIX 5 – EVAPORATIVE EMISSIONS VOC SPECIATION AND ETHANOL CONTENT: ANALYTICAL METHOD APPENDIX 6 – EXHAUST EMISSIONS RESULTS APPENDIX 7 – ALDEHYDE EMISSIONS: ANALYTICAL METHOD AND STATISTICAL ANALYSIS

3
List of Special Terms and Abbreviations ACEA European Automobile Manufacturers Association ASTM American Society for Testing and Materials BWC Butane Working Capacity of activated carbon CARB California Air Resource Board CEN European Committee for Standardization CO Carbon Monoxide CO2 Carbon Dioxide CONCAWE The Oil Companies’ European Association for Environment, Health and
Safety in Refining and Distribution DG Directorate General DI Direct Injection DISI Direct Injection Spark Ignition DVPE Dry Vapour Pressure Equivalent at a temperature of 37.8 °C (kPa) EC European Commission EMS Engine Management System EN European standard issued by CEN EPA Environmental Protection Agency (USA) EPEFE European Programme on Emissions, Fuels and Engine Technologies ETBE Ethyl Tertiary Butyl Ether EU European Union EUCAR European Council for Automotive R & D EUDC Extra Urban Driving Cycle = Part 2 of the NEDC driving cycle EURO # European emission standard FID Flame ionization detector GC Gas chromatography GC-MS Gas chromatography mass spectrometry kPa 1 KiloPascal = 1000 N/m2 HC Hydrocarbon HPLC High performance liquid chromatography IES Institute of Environment and Sustainability IPCS The international programme on chemical safety IR Infrared red spectroscopy JRC Joint Research Centre LD Light Duty LHV Lower Heating Value MPI Multi Point Injection MS Mass spectrometry MTBE Methyl Tertiary Butyl Ether m/z Mass to charge ratio for detected ions in mass spectrometry NEDC New European Driving Cycle = Type I test NOx Oxides of Nitrogen PC Passenger Car RVP Reid Vapour Pressure Scan mode When operated in the scan mode the MSD collects data by scanning and
detecting through a range of ions TAEE Tertiary Amyl Ethyl Ether

4
Type I Type of emission test as laid down in the Directive 70/220/CEE and subsequent amendments
UDC Urban Driving Cycle= Part 1 of the NEDC driving Cycle US The United States of America VELA Vehicles Emission Laboratory VOC Volatile Organic Compound VT SHED Variable Temperature Sealed House for Evaporative Determination WCOT Wall Coated Open Tubular column, a type of capillary column

5
1. EXECUTIVE SUMMARY CONCAWE, EUCAR and the Joint Research Centre of the European Commission jointly carried out a major test programme specifically designed to investigate the influence of gasoline vapour pressure and ethanol content on evaporative emissions from modern passenger cars as determined using the current European regulatory test procedure. Breathing losses through the tank vent and fuel permeation are in general the most important sources of evaporative emissions in a vehicle. Breathing losses are due to evaporation of gasoline in the tank during driving, hot soak and normal diurnal temperature variation. In current vehicles vapour emissions are controlled by means of an activated carbon canister connected to the fuel tank vent to the atmosphere. Fuel permeation can also occur through plastic and rubber components of the fuel system. Evaporative emissions depend mainly on ambient temperature, fuel volatility and fuel system design [8]. As far as the fuel is concerned, Vapour Pressure (Dry Vapour Pressure Equivalent - DVPE) is a key parameter: higher values of DVPE, which is measured at 37.8 °C, mean that the fuel is more volatile or, in other words, that more fuel will evaporate at that temperature. When blended with gasoline, ethanol is known to cause an increase of the ethanol/gasoline blend DVPE compared to the base gasoline. As a consequence of the European policy aiming to promote the use of ethanol and other biofuels [21] [22], the question has arisen whether the vapour pressure limit for ethanol/gasoline blend should be relaxed with respect to the current fuel specifications laid down in the Directive 98/70/EC. The programme described in this report was conceived to assess specifically the effect of ethanol/gasoline blends on evaporative emissions with the objective of providing a technical basis for discussion on this issue. A range of seven gasoline passenger cars representative of current EURO 3-4 technology were tested for evaporative emissions with ten different test fuels. The test fuel matrix comprised 60 and 70 kPa hydrocarbon base fuels with 5 and 10% ethanol splash blends and 5 and 10% ethanol matched volatility blends. The evaporative emission tests were carried out according to a test protocol agreed by the partners of the programme and based on the European homologation test procedure. This test procedure turned out to have a considerable influence on the results; in particular repeating the test procedure, without any additional conditioning between tests above that prescribed by the legislation, resulted in an increase of the carbon canister weight with successive tests. In other words, the test protocol was not able to return the vehicle to a consistent condition at the start of each test. The increase of the canister weight, which is indicative of the accumulation of gasoline/ethanol vapours probably due to insufficient canister purging, may not represent real-world operating conditions as the canister load depends on the typical driving patterns. Running at these increased canister weights is a very severe test of the evaporative control system. The canister weight problem made it more difficult both to obtain representative emission measurements from the various vehicles and to clearly determine fuel effects. However the programme has provided valuable information and several clear conclusions can still be drawn from the results.
6
The vehicles tested differed in their level of evaporative emissions and in the extent of their response to fuel changes. All cars met the 2 g/test emission limit on the first test on fuel A, the reference fuel with DVPE of 60 kPa. Some vehicles slightly exceeded the limit on subsequent tests on fuel A, probably related to increased canister loading in later tests. The test results confirmed that vapour pressure (DVPE) is a key fuel variable for evaporative emissions; in general, increasing fuel vapour pressure above that of the 60 kPa DVPE reference fuel used for system development increased evaporative emissions. However the effect of vapour pressure is strongly non-linear, as expected for a process in which a vapour breakthrough effect may occur. The ethanol blends with final DVPE around 75 kPa gave considerably higher evaporative emissions than the other lower volatility fuels in most of the vehicles. Differences between fuels with DVPE in the range 60-70 kPa were small. Furthermore, due to the combination of DVPE variations, the presence or absence of ethanol, and to significant changes of canister weight it is difficult to draw any reliable conclusions on the influence of individual parameters. The results obtained in a few tests where extra purging of the canister was carried out suggest that differences in evaporative emission measurements on fuels in this volatility range could be reduced if a more extensive canister conditioning procedure was adopted. The engineering margin built into the system may also explain the reduced fuel effect. The evaporative emission control system is designed for the DVPE of the reference fuel (60 kPa) used in the homologation test but, as for other emission control devices, the manufacturer introduces a certain margin to take into account the production variability. Ethanol might influence evaporative emissions also via different mechanisms than the increased vapour pressure of ethanol/gasoline blends [19]. For example ethanol is known to be more difficult to purge from carbon canisters (as are heavy hydrocarbons), so could reduce their working capacity. To explore this possibility ethanol/gasoline blends matching the vapour pressure of the pure hydrocarbon base fuel were included in the fuel matrix. The increase in canister loading noticed during the programme could be due to increased adsorption of hydrocarbons or ethanol in the canister, or both. Unfortunately the poor repeatability of the main data set does not allow us to quantify the relative size of these effects. However multiple additional tests on one vehicle showed that ethanol containing fuels with matched volatility gave higher emissions than the hydrocarbon fuels. Ethanol was also found in the VT SHED vapour of tests on pure hydrocarbon fuels following use of ethanol-containing fuels. Further research would be required to clarify these effects. Extra diurnal emission tests were carried out on two vehicles with the canister vented outside of the VT SHED. The results of these tests suggest that fuel permeation through plastics and rubbers could be a significant contributor to evaporative emissions. As demonstrated by other studies, ethanol does increase the fuel permeation rate [3] [19] [20]. Measurements of regulated exhaust emissions showed few statistically significant differences between fuels. However, the test programme was not designed to look at exhaust emissions and this could explain the noticeable variability of the exhaust emission measurements. Specific conditioning between tests and multiple testing is essential for such studies. Nevertheless the data show clearly that volumetric fuel consumption (litres/100 km) increased with increasing ethanol content. This increase was roughly proportional to the oxygen content of the fuel. However there was no effect of ethanol on energy consumption.

7
The test programme was designed to explore only the effects of ethanol and fuel vapour pressure on evaporative emissions from a range of latest generation canister-equipped gasoline cars using the EU Evaporative Emissions test procedure. Other parameters like test temperature profile, presence of ethers in the fuel, fuel permeation and the long term effect of ethanol and water on carbon canister working capacity have not been addressed by this programme.

8
2. BACKGROUND One of the measures envisaged by the EU policies in the field of energy and transport is the promotion of biofuels usage in order to increase their market penetration in response to the need for energy supply security and implementation of the Kyoto protocol [21] [22]. In particular, the Directive 2003/30/EC has set a target market share for biofuels, to be achieved by 2010, of 5.75% in terms of energy content. Ethanol and biodiesel are at the moment the only biofuels available in sufficient quantity that can allow the achievement of this target. The EU Directive 2003/17/EC, in addition to provisions on gasoline and diesel fuel maximum sulphur content in 2005 and beyond, requires the European Commission to review a number of other fuel specifications for possible amendments. One specific requirement is to assess the current gasoline summer vapour pressure limits with respect to ethanol directly blended into gasoline. Ethanol is known to increase fuel DVPE when blended with gasoline [2]. The increase of DVPE is roughly constant at ~7 kPa for ethanol contents between 2% and 10% (see Fig. 1, [23]). The fuel Directive 98/70/EC defines gasoline volatility classes and their vapour pressure limits. Each European country applies one or more volatility classes depending on its climate and on the season, and all gasoline, including gasoline/ethanol blends, must comply with the relevant DVPE limits. A vapour pressure waiver for gasoline/ethanol blends has been proposed in order to facilitate the spread of ethanol usage and consequently to increase its market penetration. Ethanol is normally distributed separately to gasoline, and only blended at the terminal into road tankers for final distribution. However, there is concern about the possible consequences of the increased vapour pressure of the ethanol/gasoline blends on evaporative emissions from gasoline cars. Figure 1: Vapour pressure (DVPE) increase of ethanol/gasoline blends as a function of ethanol content [23]
Ethanol/gasoline blends: vapour pressure increase vs ethanol content
-10
-5
0
5
10
15
20
25
0 2 4 6 8 10 12 14 16 18 20
Ethanol (% vol.)
Del
ta P
(kPa
)
This is not a new issue, as a similar debate has already taken place in the USA especially in California. Some experimental and theoretical studies [2] [3] [4] [5] [6] [19] [20] to address
9
this issue have been carried out in the USA but those results cannot be easily extended to Europe for a number of reasons (different vehicles, differences in fuel system materials, evaporative emissions control systems, etc.). In Europe, most of the data available on evaporative emissions had been obtained in studies carried out in the late 1980’s on “uncontrolled” vehicles and early model carbon canister-equipped cars [24] mainly using conventional fuels. For this reason CONCAWE, EUCAR and the DG-JRC decided to investigate the influence of vapour pressure and ethanol content on evaporative emissions with a range of the current generation vehicle technologies. This study provides technical input to broader analyses of the potential air quality impact of ethanol fuels that will provide guidance to the Commission. 3. OBJECTIVES The objectives of the joint CONCAWE/EUCAR/JRC programme on evaporative emissions were the following:
o To assess the effects of ethanol content and vapour pressure on evaporative emissions as determined using the current European test procedure from a range of latest generation canister-equipped gasoline cars.
o To provide a technical basis for discussion on gasoline vapour pressure limits in
relation to ethanol blending for the Fuels Directive Review.
10
4. SCOPE OF TEST PROGRAMME The test programme was designed to investigate the influence of gasoline vapour pressure and ethanol content on evaporative emissions from gasoline passenger car models marketed in Europe. Evaporative emissions were measured according to the European legislative test procedure; therefore in this report the term “evaporative emissions” refers to the sum of all the Volatile Organic Compounds (VOCs), not deriving from fuel combustion, emitted by the vehicle during the Hot Soak and the Diurnal test as defined in the related European legislation (Directive 98/69/EC, Annex IV). An overview of sources and control of evaporative emissions from vehicles and of the related European legislation is given in Appendix 1. A representative range of vehicles covering 8 cars, some of which were provided by the European Auto manufacturers and others hired, was tested over a fuel matrix consisting of fuels differing in ethanol content and vapour pressure (DVPE) provided by CONCAWE. The programme was divided into three different phases. In Phase 1 a vehicle was tested with the specific objective of correlating evaporative emissions measured in the JRC VT SHED with an existing VT SHED owned by a European car manufacturer. In this case the tests were performed using only a certified reference fuel and just following the legislative procedure. After this first phase, seven cars were tested for evaporative emissions on the different test fuels according to an agreed procedure (Phase 2 and Phase 3, as described in section 4.3). The details of the test procedure are given in Appendix 3.
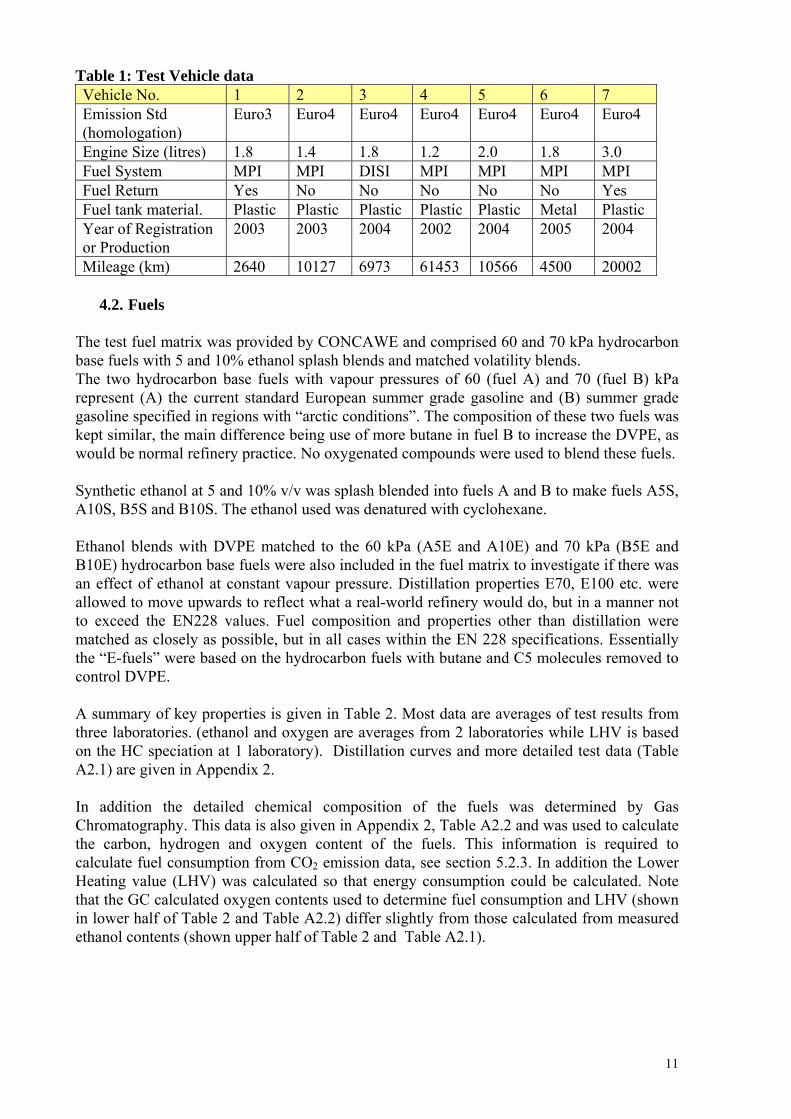
4.1. Test vehicles The test fleet included conventional Multi-Point Injection (MPI) vehicles and one Direct Injection Spark Ignition (DISI), with both fuel return to tank and returnless systems. Six vehicles had plastic fuel tanks and one was equipped with a metal tank. Test vehicle data are shown in Table 1: all are modern European vehicles meeting either Euro 3 or Euro 4 emission limits. Engine size varied from 1.2 to 3.0 litres and only two of the vehicles had a fuel return line. Most of the vehicles were supplied directly by ACEA, but two cars were rented locally and vehicle 6 with metal tank was also rented. For six vehicles the carbon canister used for the tests was the one present on the vehicle at the time of delivery. In one case (vehicle 4), the carbon canister originally installed on the vehicle did not work properly and was replaced with a new one (original OEM spare part). The vehicle was then driven on the road for more than 3000 km before starting the tests.
11
Table 1: Test Vehicle data Vehicle No. 1 2 3 4 5 6 7 Emission Std (homologation)
Euro3 Euro4 Euro4 Euro4 Euro4 Euro4 Euro4
Engine Size (litres) 1.8 1.4 1.8 1.2 2.0 1.8 3.0 Fuel System MPI MPI DISI MPI MPI MPI MPI Fuel Return Yes No No No No No Yes Fuel tank material. Plastic Plastic Plastic Plastic Plastic Metal Plastic Year of Registration or Production
2003 2003 2004 2002 2004 2005 2004
Mileage (km) 2640 10127 6973 61453 10566 4500 20002
4.2. Fuels The test fuel matrix was provided by CONCAWE and comprised 60 and 70 kPa hydrocarbon base fuels with 5 and 10% ethanol splash blends and matched volatility blends. The two hydrocarbon base fuels with vapour pressures of 60 (fuel A) and 70 (fuel B) kPa represent (A) the current standard European summer grade gasoline and (B) summer grade gasoline specified in regions with “arctic conditions”. The composition of these two fuels was kept similar, the main difference being use of more butane in fuel B to increase the DVPE, as would be normal refinery practice. No oxygenated compounds were used to blend these fuels. Synthetic ethanol at 5 and 10% v/v was splash blended into fuels A and B to make fuels A5S, A10S, B5S and B10S. The ethanol used was denatured with cyclohexane. Ethanol blends with DVPE matched to the 60 kPa (A5E and A10E) and 70 kPa (B5E and B10E) hydrocarbon base fuels were also included in the fuel matrix to investigate if there was an effect of ethanol at constant vapour pressure. Distillation properties E70, E100 etc. were allowed to move upwards to reflect what a real-world refinery would do, but in a manner not to exceed the EN228 values. Fuel composition and properties other than distillation were matched as closely as possible, but in all cases within the EN 228 specifications. Essentially the “E-fuels” were based on the hydrocarbon fuels with butane and C5 molecules removed to control DVPE. A summary of key properties is given in Table 2. Most data are averages of test results from three laboratories. (ethanol and oxygen are averages from 2 laboratories while LHV is based on the HC speciation at 1 laboratory). Distillation curves and more detailed test data (Table A2.1) are given in Appendix 2. In addition the detailed chemical composition of the fuels was determined by Gas Chromatography. This data is also given in Appendix 2, Table A2.2 and was used to calculate the carbon, hydrogen and oxygen content of the fuels. This information is required to calculate fuel consumption from CO2 emission data, see section 5.2.3. In addition the Lower Heating value (LHV) was calculated so that energy consumption could be calculated. Note that the GC calculated oxygen contents used to determine fuel consumption and LHV (shown in lower half of Table 2 and Table A2.2) differ slightly from those calculated from measured ethanol contents (shown upper half of Table 2 and Table A2.1).

12
Table 2: Fuels Inspection data
Fuel Unit A A5E A10E A5S A10S B B5E B10E B5S B10S DVPE kPa 60.1 59.7 59.9 67.1 66.8 69.0 69.9 66.5 75.4 75.6
E70 %v/v 38.3 40.2 44.6 42.7 51.8 38.9 42.0 46.3 44.0 53.1 E100 %v/v 54.7 61.3 54.8 56.6 59.4 54.8 61.8 58.0 56.8 60.0
Ethanol %v/v 0.0 5.0 10.4 4.7 9.7 0.0 5.4 9.9 5.0 10.2 Oxygen %m/m 0.00 1.84 3.79 1.71 3.52 0.00 1.97 3.64 1.83 3.70 Density kg/m3 755.5 747.1 756.0 757.2 758.7 753.3 747.1 750.0 754.3 756.0
Carbon %m/m 87.48 85.09 83.50 85.75 83.99 87.39 84.90 83.38 85.58 83.74Hydrogen %m/m 12.50 13.08 12.75 12.52 12.51 12.55 13.10 12.98 12.56 12.61Oxygen %m/m 0.01 1.82 3.74 1.72 3.49 0.06 2.00 3.63 1.86 3.64
LHV MJ/kg 42.80 42.29 41.25 42.05 41.24 42.81 42.23 41.41 42.00 41.22
4.3. Programme structure The evaporative emissions tests were performed at the EC DG-JRC VELA laboratories located in Ispra (Italy). Due to the amount of testing and the fact that only two tests per week were possible, the programme was run in three phases. Phase 1: Shakedown and correlation of the newly commissioned JRC VT SHED with an existing one owned by a car manufacturer and currently used for vehicle homologation. One vehicle (same model as test car no. 2 in Table 1 above) supplied by ACEA was used only for that purpose. This car was not used for the testing programme. The evaporative emission tests, performed initially at the car manufacturer’s laboratory and then at the JRC, were done using the same certification fuel. Phase 2: The tests were carried out according to the scheme shown in Figure 2. Four vehicles as two pairs, were initially tested on fuels A (Test A1) and B (Test B1) then A5S and B5S, followed by a repeat of A (A2). The subsequent tests were decided jointly by the consortium on the basis of an agreed test protocol, based on the results of the first five tests. Phase 3: This was originally intended as a repetition of the Phase 2 on the remaining vehicles, unless the partners of the project decided to amend either the test sequence or the test procedure after review of Phase 2 data. Eventually Phase 3 was performed on the three remaining vehicles following the same general scheme as in Phase 2.

13
Figure 2: Flow-chart of the test sequence
4.4. Test protocol Each vehicle/fuel combination was tested using the current European regulatory evaporative HC emissions VT SHED test procedure (see Directive 98-69-EC Annex VI, p. 27). A flow-chart and details of the procedure is given in Appendix 3. The current procedure comprises the following steps:
• Load canister to breakthrough with butane. • Drain and refill fuel tank with test fuel • Preconditioning Drive (NEDC + one further EUDC) • Soak for 12 – 36 hours • Evaporative Emission System conditioning drive (NEDC + one further UDC) • Hot soak test for 1 hour at 20 -30 ºC • Soak for 6 – 36 hours
TEST A1&B1
TEST A5E & B5E
Is A5S >1.25*A1 or B5S > 1.25*B1?
TEST A5S & B5S
TEST A10S & B10S
Is A10S > 1.25*A2 or B10S > 1,25*B1 ?
TEST A10E & B10E
TEST A4
YES
YES
TEST A2
TEST A3
NO
TEST A3
NO
End
Is A2>1.25A1 or <0.8A1 ?
NO
YES Arrange phone conf to discuss and decide next steps
Is A3>1.25A1 or <0.8A1 ?
YES
Arrange phone conf to discuss and decide next steps

14
• 24 hour Diurnal test with 20 - 35 ºC diurnal variation. For this programme the hot soak temperature range was controlled more tightly, at a constant value of 27 ºC over the whole test. The procedure allows two alternative ways to load the canister, with butane or with gasoline vapour. For this programme the butane loading procedure was used. The full details of the test procedure used in this programme are reported in Appendix 3. Each vehicle was first tested on fuel A, which is equivalent to the EU evaporative emissions test reference fuel RF-02-03 (apart from sulphur content), to ensure compliance with the EU standard. The following measurements were made for each test:
o VT SHED VOC mass Hot Soak and Diurnal emissions o Speciation of VT SHED emissions including ethanol content (see Appendix 5 for
details on the analytical methods used ) o Record of canister weight changes where possible (see Appendix 4 for details) o Record of gasoline temperature during hot soak and diurnal test (except for vehicle
7) o Exhaust emissions measured during Evap system conditioning drive (see Appendix
6) o Exhaust HC speciation and Aldehyde emissions.
No additional conditioning cycle was run between tests, in order to follow the EU evaporative emission test procedure exactly. This was originally thought unnecessary as the focus was on Evaporative Emissions, and the canister “load to breakthrough” part of the test was expected to ensure constant canister starting weight for each test.
4.5. Issues not covered There are a number of issues not covered by the programme as it was designed:
o Fuel Tank Permeation: the legislative procedure does not allow splitting the evaporative emissions into breathing losses and fuel permeation contributions.
o Influence of canister working capacity and canister purging strategy. o The programme was not designed to investigate ether effects, so Bio-Ethers (i.e. bio-
ETBE and bio-TAEE) were not included in the programme and were not present in the test fuels.
o Testing at different temperatures: this test programme was run according to the European legislative procedure that prescribes a temperature profile having a minimum and maximum temperature respectively of 20 °C and 35 °C. This profile can be considered representative, to a certain extent, only of summer temperature in southern Europe.
o Longer-term effects of ethanol and water on the working capacity of carbon canisters: it is understood that ethanol and water may be preferentially adsorbed, then remain in the canister to reduce its working capacity. This programme was not designed to investigate this aspect.

15
5. TEST RESULTS
5.1. Test facility correlation (Phase 1) As already described, in Phase 1 a vehicle was tested in the JRC laboratory and in another ACEA member’s lab in order to correlate the newly commissioned JRC VT SHED with an existing one. The scope of this exercise was limited to checking the correct functioning of the JRC’s SHED. The results are shown in Table 3 and confirm good correlation of JRC’s test results with those of a recognised vehicle certification laboratory. Table 3: Correlation between the JRC VT SHED and a second laboratory VT SHED HOT SOAK DIURNAL TEST TOTAL Test Number HC g/test HC g/test HC g/test 1 0.031 0.360 0.391 2 0.015 0.371 0.386 JRC VELA 3 0.027 0.296 0.324 Laboratory 4 0.035 0.381 0.416 Average 0.027 0.352 0.379 StdDev 0.0088 0.038 0.039 CV % 33% 11% 10% 1 0.016 0.349 0.365 Car 2 0.043 0.280 0.323 Manufacturer 3 0.025 0.380 0.405 laboratory Average 0.028 0.336 0.364 StdDev 0.014 0.051 0.041 CV % 49% 15% 11% Difference % -4% 5% 4%
5.2. Main Test Programme (Phase 2-3) Limited experimental resources (each evaporative emission test takes 3 days), lack of prior knowledge about the likely responses of the various cars to fuel changes, and concerns about carryover effects meant that an adaptive exploratory test sequence was adopted rather than a statistically-designed experiment with the same fuels repeat tested in random order in each car. As described in Section 4.3 fuel A was used as a reference and tested on several occasions during each vehicle test sequence. During the course of the programme it emerged that for most vehicles results on fuel A increased with time, and there were large changes in canister weight from test to test. These variations were of such a magnitude, and the test order so non random, that averaging repeat results on the various fuels in any particular vehicle would be misleading. Therefore it has been decided to report the raw emission measurements and to plot their evolution in time. Statistical techniques, such as multiple regression analysis, have been tried in conjunction with various visualisations to separate fuel and canister weight effects. However multiple regression models did not explain the variations in emissions in the various cars in a clear and consistent way and so will not be reported here.
16
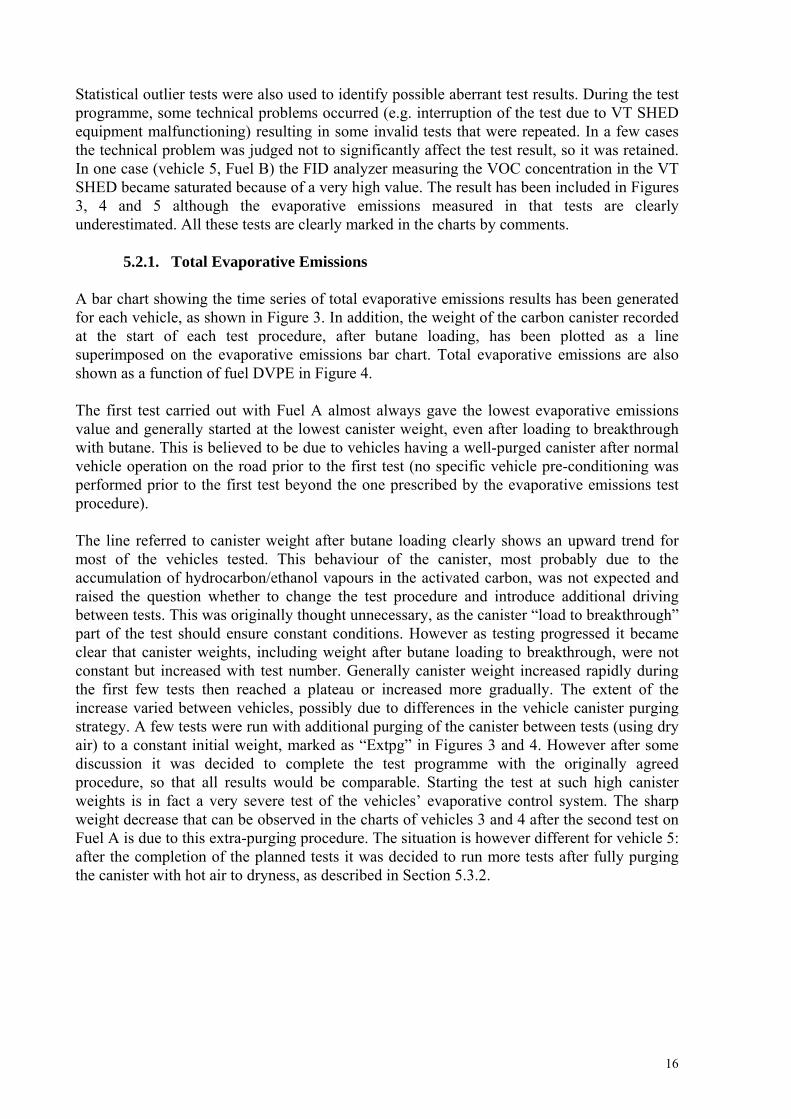
Statistical outlier tests were also used to identify possible aberrant test results. During the test programme, some technical problems occurred (e.g. interruption of the test due to VT SHED equipment malfunctioning) resulting in some invalid tests that were repeated. In a few cases the technical problem was judged not to significantly affect the test result, so it was retained. In one case (vehicle 5, Fuel B) the FID analyzer measuring the VOC concentration in the VT SHED became saturated because of a very high value. The result has been included in Figures 3, 4 and 5 although the evaporative emissions measured in that tests are clearly underestimated. All these tests are clearly marked in the charts by comments.
5.2.1. Total Evaporative Emissions A bar chart showing the time series of total evaporative emissions results has been generated for each vehicle, as shown in Figure 3. In addition, the weight of the carbon canister recorded at the start of each test procedure, after butane loading, has been plotted as a line superimposed on the evaporative emissions bar chart. Total evaporative emissions are also shown as a function of fuel DVPE in Figure 4. The first test carried out with Fuel A almost always gave the lowest evaporative emissions value and generally started at the lowest canister weight, even after loading to breakthrough with butane. This is believed to be due to vehicles having a well-purged canister after normal vehicle operation on the road prior to the first test (no specific vehicle pre-conditioning was performed prior to the first test beyond the one prescribed by the evaporative emissions test procedure). The line referred to canister weight after butane loading clearly shows an upward trend for most of the vehicles tested. This behaviour of the canister, most probably due to the accumulation of hydrocarbon/ethanol vapours in the activated carbon, was not expected and raised the question whether to change the test procedure and introduce additional driving between tests. This was originally thought unnecessary, as the canister “load to breakthrough” part of the test should ensure constant conditions. However as testing progressed it became clear that canister weights, including weight after butane loading to breakthrough, were not constant but increased with test number. Generally canister weight increased rapidly during the first few tests then reached a plateau or increased more gradually. The extent of the increase varied between vehicles, possibly due to differences in the vehicle canister purging strategy. A few tests were run with additional purging of the canister between tests (using dry air) to a constant initial weight, marked as “Extpg” in Figures 3 and 4. However after some discussion it was decided to complete the test programme with the originally agreed procedure, so that all results would be comparable. Starting the test at such high canister weights is in fact a very severe test of the vehicles’ evaporative control system. The sharp weight decrease that can be observed in the charts of vehicles 3 and 4 after the second test on Fuel A is due to this extra-purging procedure. The situation is however different for vehicle 5: after the completion of the planned tests it was decided to run more tests after fully purging the canister with hot air to dryness, as described in Section 5.3.2.

17
Figure 3: Time series of evaporative emissions and canister weights Bars: Total Evaporative Emissions (g/test; left-hand axis) Line: Canister weight at start of test after loading to breakthrough with butane (g; right-hand axis) Note: For clarity, different scales are used for each vehicle.
Vehicle 1
0.00.51.01.52.02.53.03.54.04.5
A B
A5S
B5S A
A10S
B10S A
A10E
B10E
B10E A
A5E
B5E B B
Fuel
g/te
st
860870880890900910920930940
g
Vehicle 2
0.00.20.4
0.60.81.01.2
1.41.6
A B B A5S B5S A A A10S B10S A A10S B10S A
Fuel
g/te
st
860
870
880
890
900
910
920
g
Vehicle 3
0.0
1.0
2.0
3.0
4.0
5.0
6.0
A B A5S B5S A A B5S B B5S A5E B5E A A5S B5S
Fuel
g/te
st
600
610
620
630
640
650
660
670
gVehicle 4
0.01.02.03.04.05.06.07.08.09.0
A B
A5S
B5S
A5S A
B5S
B5S
A5E
B5E
B10E
A10E A B
A10S
B10S
B5S
Fuel
g/te
st
580600620640660680700720740
g
Ext pgExt pg Ext pg Ext pg Ext pg
Vehicle 5
0.01.02.03.04.05.06.07.08.09.0
A B
A5S
B5S A
A5E
B5E A
B10S
B10E A
A5S
B5S B A
Fuel
g/te
st
620630640650660670680690700710720
g
Intruptd FID
Vehicle 6
0.0
0.20.4
0.60.8
1.0
1.21.4
1.6
A B A5S A5S B5S A A5S A10S A10S B10S A5E B5E A
Fuel
g/te
st
630640650660670680690700710720
gAborted Aborted
Vehicle 7
0.0
0.20.4
0.60.8
1.0
1.21.4
1.6
A A B B A5S B5S A5S B10S A
Fuel
g/te
st
2680
26852690
26952700
2705
27102715
2720
g
Key:
ExtPg: Extra purging carried out prior to test
Intruptd: Diurnal test interupted 30 mins before the scheduled end
FID: FID analyzer saturated, result invalid
Aborted: Test aborted due to technical problems

18
Figure 4: Total evaporative emissions vs fuel DVPE Note: For clarity, different scales are used for each vehicle
Vehicle 1
1st
0.00.51.01.52.02.53.03.54.04.5
55 60 65 70 75 80DVPE, kPa
g/te
st
AA5EA10EA5SA10SBB5EB10EB5SB10S
Vehicle 2
1st
0.00.20.40.60.81.01.21.41.6
55 60 65 70 75 80DVPE, kPa
g/te
st
AA5SA10SBB5SB10S
Vehicle 3
1stExtPg ExtPg
ExtPg
0.0
1.0
2.0
3.0
4.0
5.0
6.0
55 60 65 70 75 80DVPE, kPa
g/te
st
AA5EA5SBB5EB5S
Vehicle 4
1st
ExtPg
ExtPg
0.01.02.03.04.05.06.07.08.09.0
55 60 65 70 75 80DVPE, kPa
g/te
st
AA5EA10EA5SA10SBB5EB10EB5SB10S
Vehicle 5
1st
FID
Intrupt'd
0.01.02.03.04.05.06.07.08.09.0
55 60 65 70 75 80DVPE, kPa
g/te
st
AA5EA5SBB5EB10EB5SB10S
Vehicle 6
1st
0.00.20.40.60.81.01.21.41.6
55 60 65 70 75 80DVPE, kPa
g/te
st
AA5EA5SA10SBB5EB5SB10S
Vehicle 7
1st
0.00.20.40.60.81.01.21.41.6
55 60 65 70 75 80
DVPE, kPa
g/te
st
AA5SBB5SB10S
Key:
1st: First test on fuel A
ExtPg: Extra purging carried out prior to test
Intruptd: Diurnal test interupted 30 mins before the scheduled end
FID: FID analyzer saturated, result invalid

19
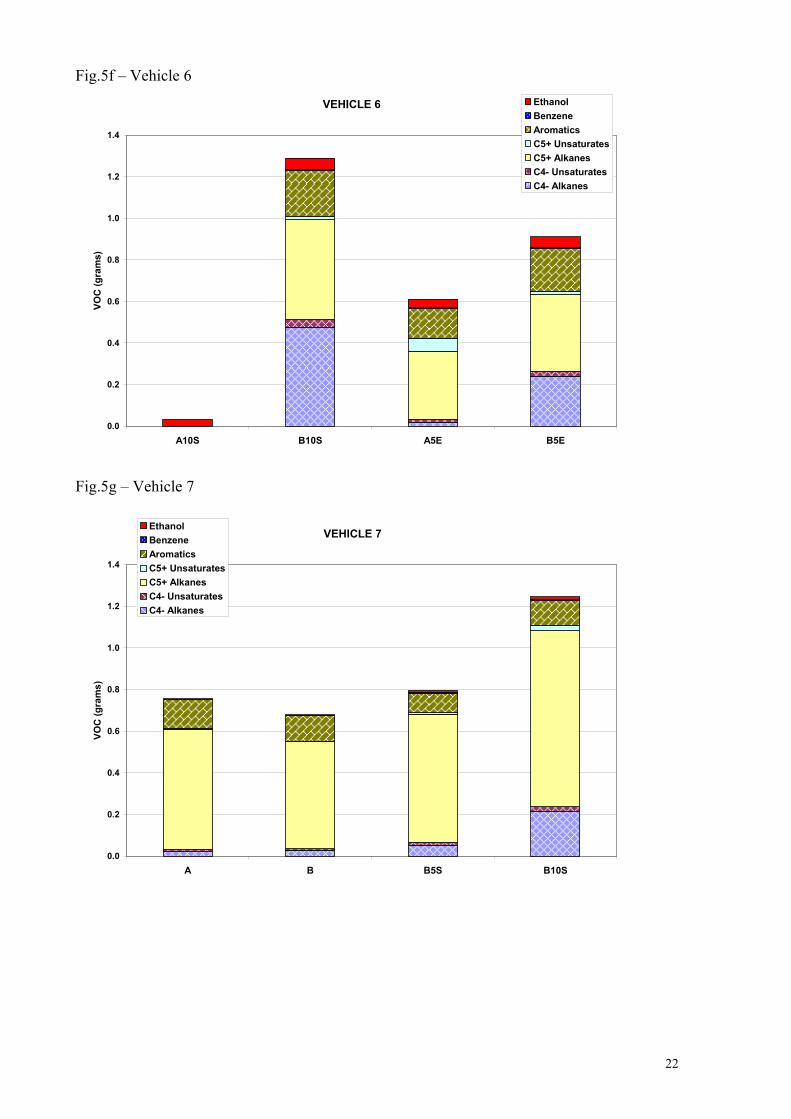
5.2.2. Evaporative VOCs Speciation and Ethanol Content Besides the measurement of the mass of evaporative emissions performed following the legislative procedure, the composition (speciation) of evaporative emissions was analysed via gas-chromatography. A sample of the internal atmosphere of the VT SHED was taken at the beginning and at the end of the diurnal test and then analysed by means of a suitable gas-chromatograph coupled with FID detectors (the detailed analytical method is described in Appendix 5). Evaporative emission speciation is not available for all the tests; in some cases it was not possible to perform the analysis due to failures or unavailability of the instrument. The results of the VOC speciation analyses from all test vehicles are shown in Fig. 5. In this plot the identified VOCs are aggregated in the following way:
- C4- Alkanes : all the saturated VOCs having 4 or less atoms of Carbon - C4- Unsaturates: includes olefins, dienes and alkynes having 4 or less atoms of Carbon - C5+ Alkanes: all the saturated VOCs having more than 4 atoms of Carbon - C5+ Unsaturates: includes olefins, dienes and alkynes having more than 4 atoms of Carbon - Benzene - Aromatics: all the higher aromatic VOCs, Benzene excluded. - Ethanol
Speciated hydrocarbon emissions from the VT SHED Diurnal tests generally show relatively high levels of light hydrocarbons (C3 – C5) and low levels of ethanol. Moreover, once ethanol has been used, it appears in the vapour of all subsequent tests. Fig. 5 – VOC speciation of evaporative emissions Fig.5a – Vehicle 1
VEHICLE 1
0.0
0.5
1.0
1.5
2.0
2.5
3.0
3.5
4.0
4.5
A B A5S A A10 S B10S A A10 E B10E B5E B
VOC
(gra
ms)
EthanolBenzeneAromaticsC5+ UnsaturatesC5+ AlkanesC4- UnsaturatesC4- Alkanes

20
Fig.5b – Vehicle 2
VEHICLE 2
0.0
0.2
0.4
0.6
0.8
1.0
1.2
1.4
A B A5S B5S A A A10S B10S A A10S A
VOC
(gra
ms)
EthanolBenzeneAromaticsC5+ UnsaturatesC5+ AlkanesC4- UnsaturatesC4- Alkanes
Fig.5c – Vehicle 3
VEHICLE 3
0.0
0.5
1.0
1.5
2.0
2.5
3.0
3.5
4.0
4.5
5.0
A B A5S A A B5S B B5S A5E B5E A A5S B5S
VOC
(gra
ms)
EthanolBenzeneAromaticsC5+ UnsaturatesC5+ AlkanesC4- UnsaturatesC4- Alkanes
Extp Extp
Extp

21
Fig.5d – Vehicle 4
VEHICLE 4
0.0
1.0
2.0
3.0
4.0
5.0
6.0
7.0
A B A5S A B5S B5S A5E B5E B10E A10E A B
VOC
(gra
ms)
EthanolBenzeneAromaticsC5+ UnsaturatesC5+ AlkanesC4- UnsaturatesC4- Alkanes
Extpg
Extpg
Fig.5e – Vehicle 5
VEHICLE 5
0.0
2.0
4.0
6.0
8.0
10.0
12.0
B10S A A5S B5S B A A A
VOC
(gra
ms)
EthanolBenzeneAromaticsC5+ UnsaturatesC5+ AlkanesC4- UnsaturatesC4- Alkanes
Extra test
FID
Extra test
22
Fig.5f – Vehicle 6
VEHICLE 6
0.0
0.2
0.4
0.6
0.8
1.0
1.2
1.4
A10S B10S A5E B5E
VOC
(gra
ms)
EthanolBenzeneAromaticsC5+ UnsaturatesC5+ AlkanesC4- UnsaturatesC4- Alkanes
Fig.5g – Vehicle 7
VEHICLE 7
0.0
0.2
0.4
0.6
0.8
1.0
1.2
1.4
A B B5S B10S
VOC
(gra
ms)
EthanolBenzeneAromaticsC5+ UnsaturatesC5+ AlkanesC4- UnsaturatesC4- Alkanes

23
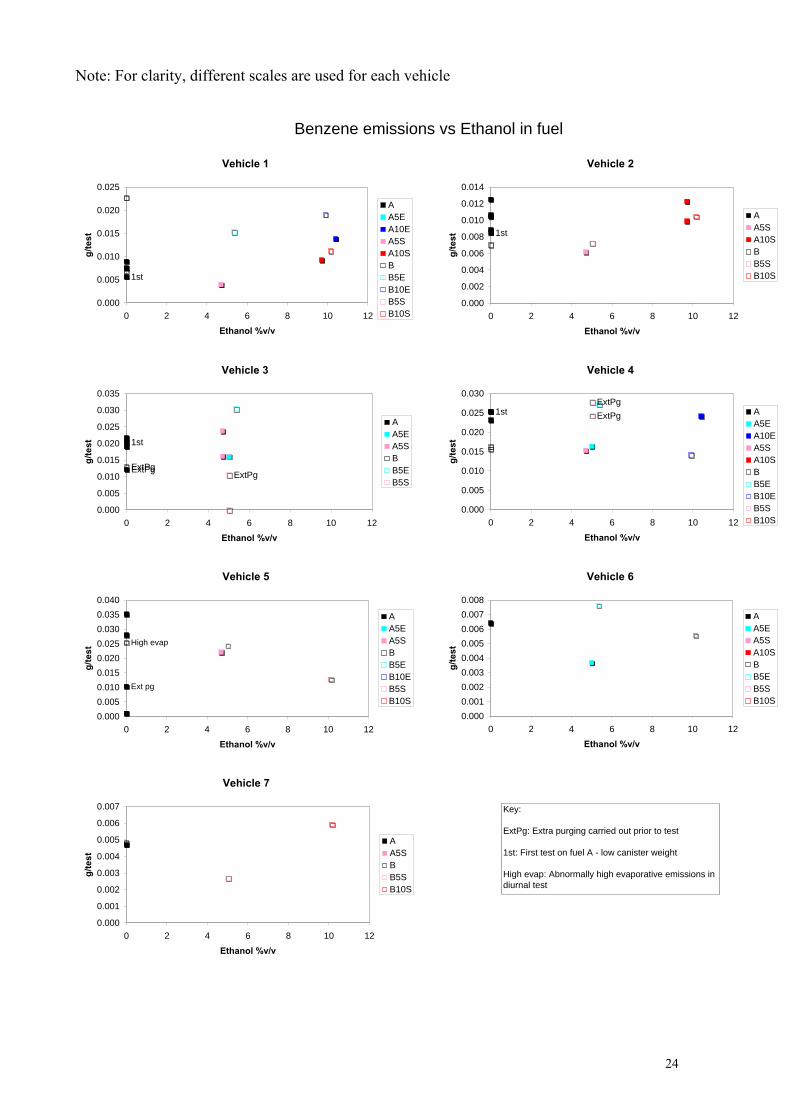
There is special concern over evaporative emissions of benzene, and whether ethanol could increase them by formation of azeotropes. Benzene emissions are plotted against ethanol content in Figure 6. Ethanol was found to have no noticeable nor statistically significant effect on benzene emissions in any vehicle considered in isolation, nor when the data were pooled and the vehicles considered together. The analysis was rerun omitting the abnormal results indicated in Figure 6 and again no significant effect was seen. Ethanol also has no effect on benzene emissions expressed as a percent of total evaporative emissions rather than as g/test. Figure 6: Benzene Evaporative Emissions from all cars
24
Note: For clarity, different scales are used for each vehicle
Benzene emissions vs Ethanol in fuel
Vehicle 1
1st
0.000
0.005
0.010
0.015
0.020
0.025
0 2 4 6 8 10 12
Ethanol %v/v
g/te
st
AA5EA10EA5SA10SBB5EB10EB5SB10S
Vehicle 2
1st
0.000
0.002
0.004
0.006
0.008
0.010
0.012
0.014
0 2 4 6 8 10 12
Ethanol %v/v
g/te
st
AA5SA10SBB5SB10S
Vehicle 3
1st
ExtPgExtPgExtPg
0.000
0.005
0.010
0.015
0.020
0.025
0.030
0.035
0 2 4 6 8 10 12
Ethanol %v/v
g/te
st
AA5EA5SBB5EB5S
Vehicle 4
1stExtPgExtPg
0.000
0.005
0.010
0.015
0.020
0.025
0.030
0 2 4 6 8 10 12
Ethanol %v/v
g/te
st
AA5EA10EA5SA10SBB5EB10EB5SB10S
Vehicle 5
Ext pg
High evap
0.0000.0050.0100.0150.0200.0250.0300.0350.040
0 2 4 6 8 10 12
Ethanol %v/v
g/te
st
AA5EA5SBB5EB10EB5SB10S
Vehicle 6
0.0000.0010.0020.0030.0040.0050.0060.0070.008
0 2 4 6 8 10 12
Ethanol %v/v
g/te
st
AA5EA5SA10SBB5EB5SB10S
Vehicle 7
0.000
0.001
0.002
0.003
0.004
0.005
0.006
0.007
0 2 4 6 8 10 12
Ethanol %v/v
g/te
st
AA5SBB5SB10S
Key:
ExtPg: Extra purging carried out prior to test
1st: First test on fuel A - low canister weight
High evap: Abnormally high evaporative emissions in diurnal test

25
5.2.3. Exhaust Emissions and Fuel Consumption Exhaust regulated and unregulated emissions were measured in addition to evaporative emissions, although the programme had not been designed to investigate this aspect. Exhaust emission measurement was performed over the legislative European driving cycle (NEDC) during the conditioning phase of the vehicle; this is carried out just prior to the start of the Hot Soak test (see Appendix 3). Vehicle conditioning consists of a complete NEDC cycle followed by an additional urban driving cycle. Investigating fuel quality effects on exhaust emissions requires a strict test protocol to ensure that any emission variation observed is really due to the different properties of test fuels. Normally an absolute minimum of 3 tests on each fuel in each vehicle is necessary to see significant fuel effects [25] [26] [27]. Furthermore the fuel change and vehicle conditioning procedure is critical. The tank and the fuel system must be thoroughly flushed with the new fuel in order to reduce the possibility of carry-over effects. Even the carbon canister could influence exhaust emissions as when engine is running part of the combustion air is drawn through the canister itself; hydrocarbons desorbed from activated carbon are then burnt in the cylinders and therefore, to avoid any carry-over effect, they should reflect the composition of the test fuel. Most importantly, the test vehicle needs to be conditioned to let the Engine Management System (EMS) adapt to the new fuel. This is particularly important in case of test fuels differing for oxygen content as it directly influences the air/fuel ratio. Finally, the test sequence must be designed to avoid as much as possible systematic errors and to minimize the risk of confusing emission variation due to the specific test order with fuel effects. The test protocol used in the EPEFE programme (Auto/Oil I) [27] is one of the most important examples as it was developed with the specific aim of investigating the effect of some fuel properties on exhaust emissions. Further improvements in the sequence of testing were made in later CONCAWE studies; see [26]. However, as the programme described in this report aimed to investigate fuel effects on evaporative emissions, the test protocol was bases on the relevant legislative test procedure. For this reason no additional vehicle conditioning procedure to minimize carry-over effects on exhaust emission was included in the protocol. Moreover, the long test duration imposed by the evaporative emissions test limited the opportunity for repeat tests. As a consequence, the exhaust emissions data is very variable and allows few conclusions to be drawn. For information, the regulated emissions results are illustrated in Appendix 6. Some statistical analysis was done but showed little, so is not reported. The effects of vehicle conditioning however are less critical for CO2 emissions, and fuel consumption that is calculated from it using the carbon balance method. Thus the results were analysed to see if any fuel effects could be seen on CO2 emissions, energy consumption and fuel consumption. The extra tests carried out on vehicle 5 (see section 5.3) are included in this analysis. While CO2 emissions are measured, energy and fuel consumption must be calculated from this data. This requires knowledge of the fuels carbon, hydrogen and oxygen content and heating value. This data was calculated for the test fuels from the detailed GC analysis carried out (see Appendix 2). Fuel consumption is often calculated using default values for C/H/O from a typical reference fuel, but this is not appropriate when different fuels are tested, especially oxygenated fuels.
26
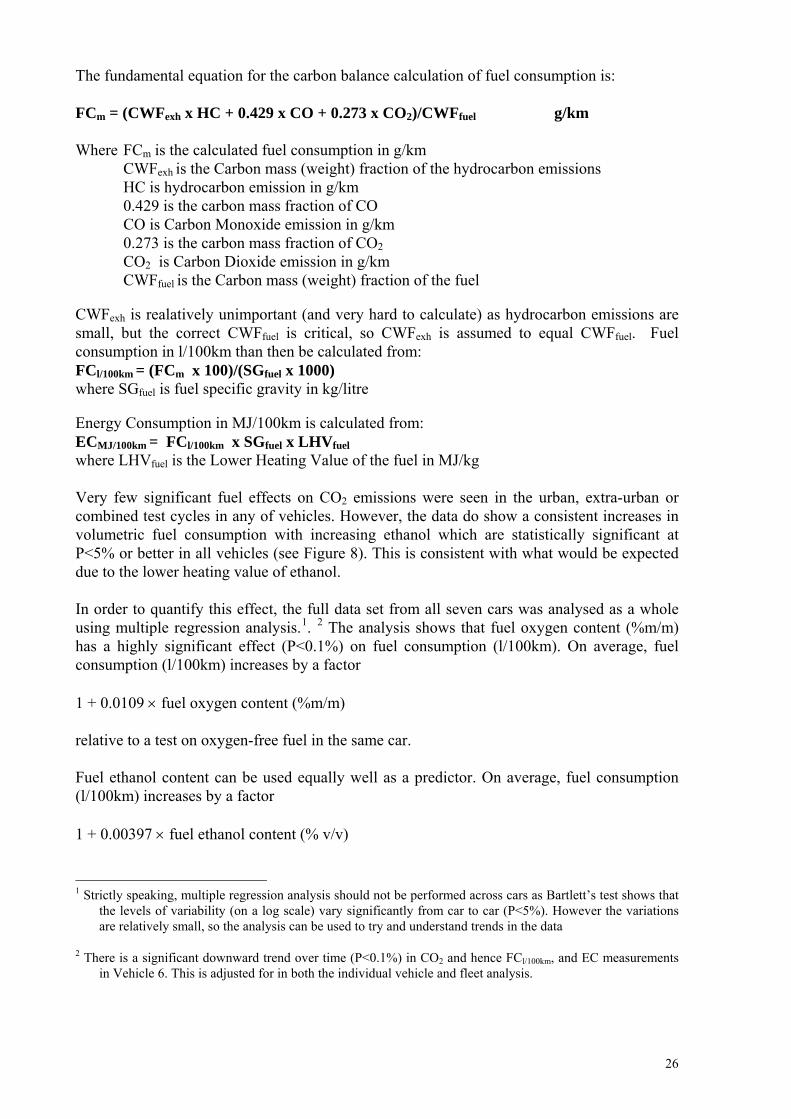
The fundamental equation for the carbon balance calculation of fuel consumption is: FCm = (CWFexh x HC + 0.429 x CO + 0.273 x CO2)/CWFfuel g/km Where FCm is the calculated fuel consumption in g/km CWFexh is the Carbon mass (weight) fraction of the hydrocarbon emissions HC is hydrocarbon emission in g/km
0.429 is the carbon mass fraction of CO CO is Carbon Monoxide emission in g/km 0.273 is the carbon mass fraction of CO2 CO2 is Carbon Dioxide emission in g/km CWFfuel is the Carbon mass (weight) fraction of the fuel
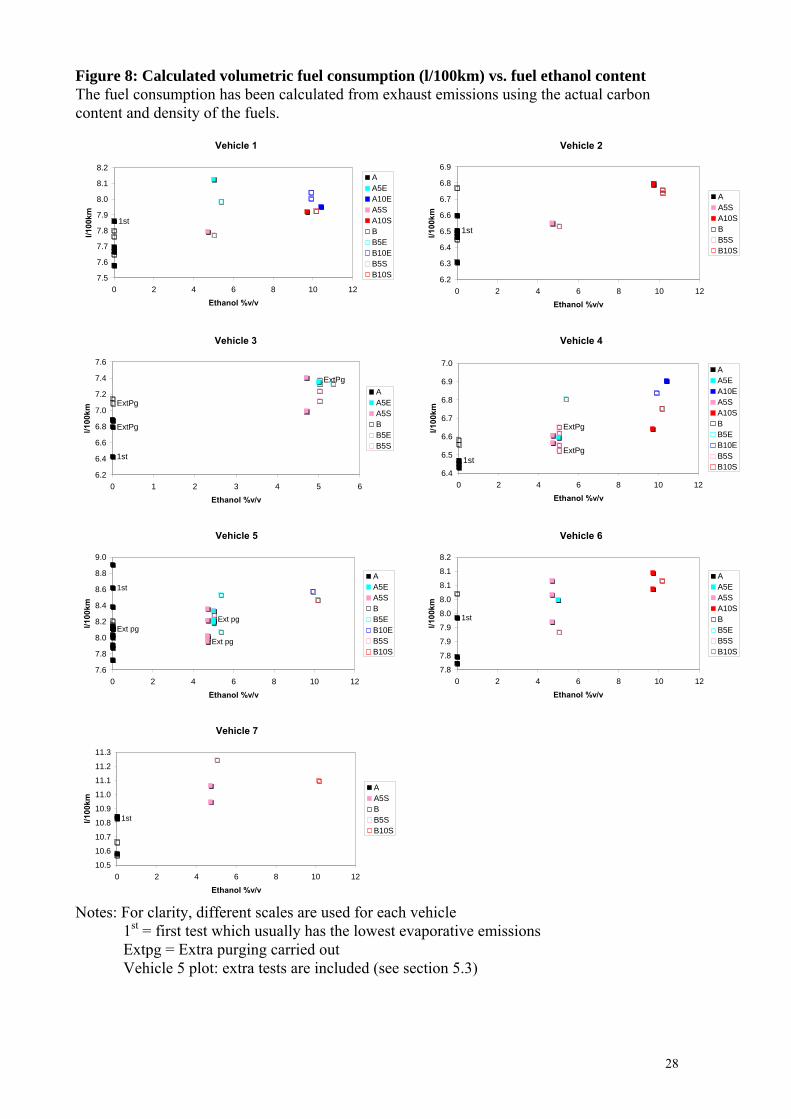
CWFexh is realatively unimportant (and very hard to calculate) as hydrocarbon emissions are small, but the correct CWFfuel is critical, so CWFexh is assumed to equal CWFfuel. Fuel consumption in l/100km than then be calculated from: FCl/100km = (FCm x 100)/(SGfuel x 1000) where SGfuel is fuel specific gravity in kg/litre Energy Consumption in MJ/100km is calculated from: ECMJ/100km = FCl/100km x SGfuel x LHVfuel where LHVfuel is the Lower Heating Value of the fuel in MJ/kg Very few significant fuel effects on CO2 emissions were seen in the urban, extra-urban or combined test cycles in any of vehicles. However, the data do show a consistent increases in volumetric fuel consumption with increasing ethanol which are statistically significant at P<5% or better in all vehicles (see Figure 8). This is consistent with what would be expected due to the lower heating value of ethanol. In order to quantify this effect, the full data set from all seven cars was analysed as a whole using multiple regression analysis.1. 2 The analysis shows that fuel oxygen content (%m/m) has a highly significant effect (P<0.1%) on fuel consumption (l/100km). On average, fuel consumption (l/100km) increases by a factor 1 + 0.0109 × fuel oxygen content (%m/m) relative to a test on oxygen-free fuel in the same car. Fuel ethanol content can be used equally well as a predictor. On average, fuel consumption (l/100km) increases by a factor 1 + 0.00397 × fuel ethanol content (% v/v) 1 Strictly speaking, multiple regression analysis should not be performed across cars as Bartlett’s test shows that
the levels of variability (on a log scale) vary significantly from car to car (P<5%). However the variations are relatively small, so the analysis can be used to try and understand trends in the data
2 There is a significant downward trend over time (P<0.1%) in CO2 and hence FCl/100km, and EC measurements in Vehicle 6. This is adjusted for in both the individual vehicle and fleet analysis.
27
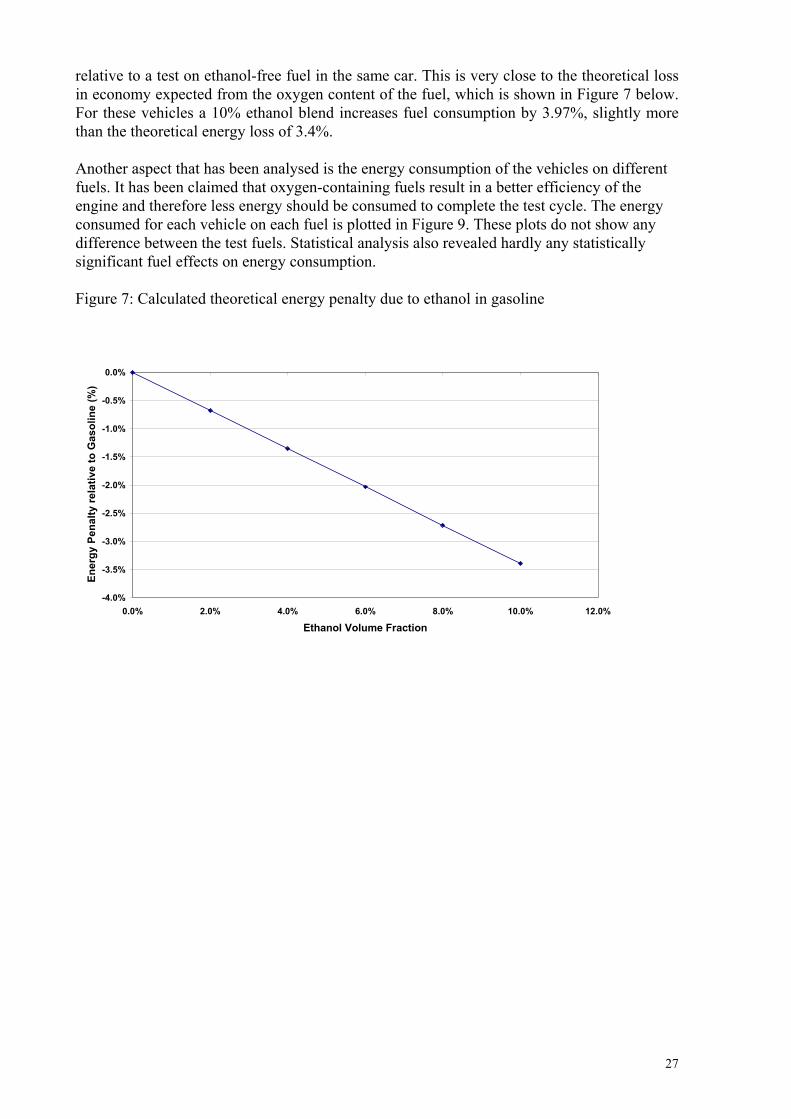
relative to a test on ethanol-free fuel in the same car. This is very close to the theoretical loss in economy expected from the oxygen content of the fuel, which is shown in Figure 7 below. For these vehicles a 10% ethanol blend increases fuel consumption by 3.97%, slightly more than the theoretical energy loss of 3.4%. Another aspect that has been analysed is the energy consumption of the vehicles on different fuels. It has been claimed that oxygen-containing fuels result in a better efficiency of the engine and therefore less energy should be consumed to complete the test cycle. The energy consumed for each vehicle on each fuel is plotted in Figure 9. These plots do not show any difference between the test fuels. Statistical analysis also revealed hardly any statistically significant fuel effects on energy consumption. Figure 7: Calculated theoretical energy penalty due to ethanol in gasoline
-4.0%
-3.5%
-3.0%
-2.5%
-2.0%
-1.5%
-1.0%
-0.5%
0.0%
0.0% 2.0% 4.0% 6.0% 8.0% 10.0% 12.0%
Ethanol Volume Fraction
Ener
gy P
enal
ty re
lativ
e to
Gas
olin
e (%
)
28
Figure 8: Calculated volumetric fuel consumption (l/100km) vs. fuel ethanol content The fuel consumption has been calculated from exhaust emissions using the actual carbon content and density of the fuels.
Vehicle 1
1st
7.5
7.6
7.7
7.8
7.9
8.0
8.1
8.2
0 2 4 6 8 10 12Ethanol %v/v
l/100
km
AA5EA10EA5SA10SBB5EB10EB5SB10S
Vehicle 2
1st
6.2
6.3
6.4
6.5
6.6
6.7
6.8
6.9
0 2 4 6 8 10 12Ethanol %v/v
l/100
km
AA5SA10SBB5SB10S
Vehicle 3
1st
ExtPg
ExtPg
ExtPg
6.2
6.4
6.6
6.8
7.0
7.2
7.4
7.6
0 1 2 3 4 5 6Ethanol %v/v
l/100
km
AA5EA5SBB5EB5S
Vehicle 4
1st
ExtPg
ExtPg
6.4
6.5
6.6
6.7
6.8
6.9
7.0
0 2 4 6 8 10 12Ethanol %v/v
l/100
km
AA5EA10EA5SA10SBB5EB10EB5SB10S
Vehicle 5
Ext pg
1st
Ext pg
Ext pg
7.6
7.8
8.0
8.2
8.4
8.6
8.8
9.0
0 2 4 6 8 10 12
Ethanol %v/v
l/100
km
AA5EA5SBB5EB10EB5SB10S
Vehicle 6
1st
7.8
7.8
7.9
7.9
8.0
8.0
8.1
8.1
8.2
0 2 4 6 8 10 12
Ethanol %v/v
l/100
km
AA5EA5SA10SBB5EB5SB10S
Vehicle 7
1st
10.5
10.6
10.7
10.8
10.9
11.0
11.1
11.2
11.3
0 2 4 6 8 10 12
Ethanol %v/v
l/100
km
AA5SBB5SB10S
Notes: For clarity, different scales are used for each vehicle 1st = first test which usually has the lowest evaporative emissions Extpg = Extra purging carried out Vehicle 5 plot: extra tests are included (see section 5.3)

29
Figure 9: Energy consumed (MJ/100km) vs. fuel ethanol content The energy consumption has been calculated from exhaust emissions using the actual carbon content and density of the fuels
Vehicle 1
1st
244
246
248
250
252
254
256
258
0 2 4 6 8 10 12
Ethanol %v/v
MJ/
100k
m
AA5EA10EA5SA10SBB5EB10EB5SB10S
Vehicle 2
1st
202204206208210212214216218220
0 2 4 6 8 10 12
Ethanol %v/v
MJ/
100k
m
AA5SA10SBB5SB10S
Vehicle 3
1st
ExtPg
ExtPg
ExtPg
205
210
215
220
225
230
235
240
0 1 2 3 4 5 6
Ethanol %v/v
MJ/
100k
m
AA5EA5SBB5EB5S
Vehicle 4
1st
ExtPg
ExtPg206207208209210211212213214215216
0 2 4 6 8 10 12
Ethanol %v/v
MJ/
100k
m
AA5EA10EA5SA10SBB5EB10EB5SB10S
Vehicle 5
Ext pg
1st
Ext pg
Ext pg
245250255260265270275280285290
0 2 4 6 8 10 12
Ethanol %v/v
MJ/
100k
m
AA5EA5SBB5EB10EB5SB10S
Vehicle 6
1st
249250251252253254255256257258259260
0 2 4 6 8 10 12
Ethanol %v/v
MJ/
100k
m
AA5EA5SA10SBB5EB5SB10S
Vehicle 7
1st
340342344346348350352354356358
0 2 4 6 8 10 12
Ethanol %v/v
MJ/
100k
m
AA5SBB5SB10S
Notes: Notes: For clarity, different scales are used for each vehicle
1st = first test which usually has the lowest evaporative emissions Extpg = Extra purging carried out
Vehicle 5 plot: extra tests are included (see section 5.3)

30
5.2.4. Aldehyde Emissions
As already described in the previous chapter, regulated and aldehyde exhaust emissions were measured over the NEDC cycle during the conditioning phase of the vehicle just prior to the start of the Hot Soak test. The results have been analysed using statistical techniques; in general they show a quite high degree of variability probably due to the test protocol not designed to investigate exhaust emissions. Fuel effects on formaldehyde and acetaldehyde emissions have been examined on a vehicle-by-vehicle basis for the five cars for which data was available (vehicles 3, 4, 5, 6, 7). Details on the analytical method and on the statistical analysis can be found in Appendix 7. Formaldehyde emissions There is little evidence of fuel effects on formaldehyde emissions. Ethanol has no significant effect in any of the five cars tested. A time trend, significant at P < 5%, was included in the model for the vehicle 4, but the ethanol effect remained insignificant. Noting that the regression coefficients b in the model
Formaldehyde = a + b x EtOH were positive for all five cars, the data was from the five cars was pooled and examined as a whole. However the effect of ethanol remained insignificant. (Note: it is difficult to compute fleet averages as not every fuel was tested in every vehicle and the tested-fuel subsets varied from car to car) Acetaldehyde emissions Ethanol effects on acetaldehyde emissions varied from car to car and were statistically significant at P < 5% for vehicles 5, 7 and also, after adjusting for the time trend, in vehicle 4. The regression models for the first two cars were
Acetaldehyde = 160 + 12.0 x EtOH (vehicle 5) Acetaldehyde = 184 + 30.1 x EtOH (vehicle 7)
where acetaldehyde is measured in μg/km and EtOH as %v/v. The EtOH term in the more complex trend-adjusted model for the vehicle 4 had a regression coefficient of 10.9. The coefficients were also positive, but not significant, for vehicles 3 and 6. A fleet analysis was inappropriate because of the differing response patterns and the different fuel subsets tested in the different vehicles.

31
5.3. Extra Tests Besides the tests carried out according to the test protocol based on the legislative procedure and described in chapter 4.4, additional tests were performed, when possible, to address specific issues. In particular, two series of extra-tests were carried out: - Diurnal tests with the vehicle canister vented out of the VT SHED with the objective of
estimating the fuel permeation contribution to total evaporative emissions. - Consecutive multiple tests on the same test fuel. The aim of these tests, performed
following the legislative procedure, was to try and understand the reason for the increase in emissions with time seen in the main programme. The plan was to explore whether pure hydrocarbon fuels exhibit a different behaviour than ethanol containing fuels.
5.3.1. Tests performed with the canister vented out of the VT SHED. In standard evaporative emission tests the whole vehicle is placed into the airtight measuring chamber (VT SHED) and all the hydrocarbons emitted by the vehicle itself are released into the VT SHED. Regardless of the source (tank, fuel hoses, construction materials,..), all the hydrocarbons emitted by the vehicle contribute to the total evaporative emissions and thus to the final result of the test. To try to estimate the contribution of fuel permeation through fuel hoses and tank walls a few diurnal tests were carried out on two vehicles (vehicle 5 and vehicle 6) with the canister vented out of the VT SHED via an opening in the VT SHED wall. Any breathing losses through the carbon canister are in this way released in the atmosphere outside the VT SHED and do not contribute to the VOC detected by FID in the VT SHED. Only hydrocarbons coming from fuel permeation or leaks and from other non-fuel related sources should therefore contribute to the test result. Each of these special tests was carried out after a full standard evaporative emission test, without changing fuel in the tank. The detailed procedure is described below:
• Completion of a full evaporative emission test (on one of the test fuels) comprising vehicle and canister conditioning, hot soak test and diurnal test.
• At the end of the standard diurnal test, the VT SHED door was opened and the measuring chamber purged with dry air.
• The vehicle canister was disconnected, weighed and then reconnected to the fuel system. The vent of the canister was connected to an opening on the VT SHED wall by means of a metallic tube.
• A new diurnal test was started (the vehicle was left in the VT SHED between the two consecutive diurnal tests, no conditioning of the vehicle was performed)
• At the end of this second diurnal test, after recording its weight, the canister was purged with dry air down to the weight recorded after the standard diurnal test.
The two consecutive diurnal tests differed not only because in the second test the canister was vented out of the VT SHED but also for the initial conditions of the canister and the fuel in the tank:
32
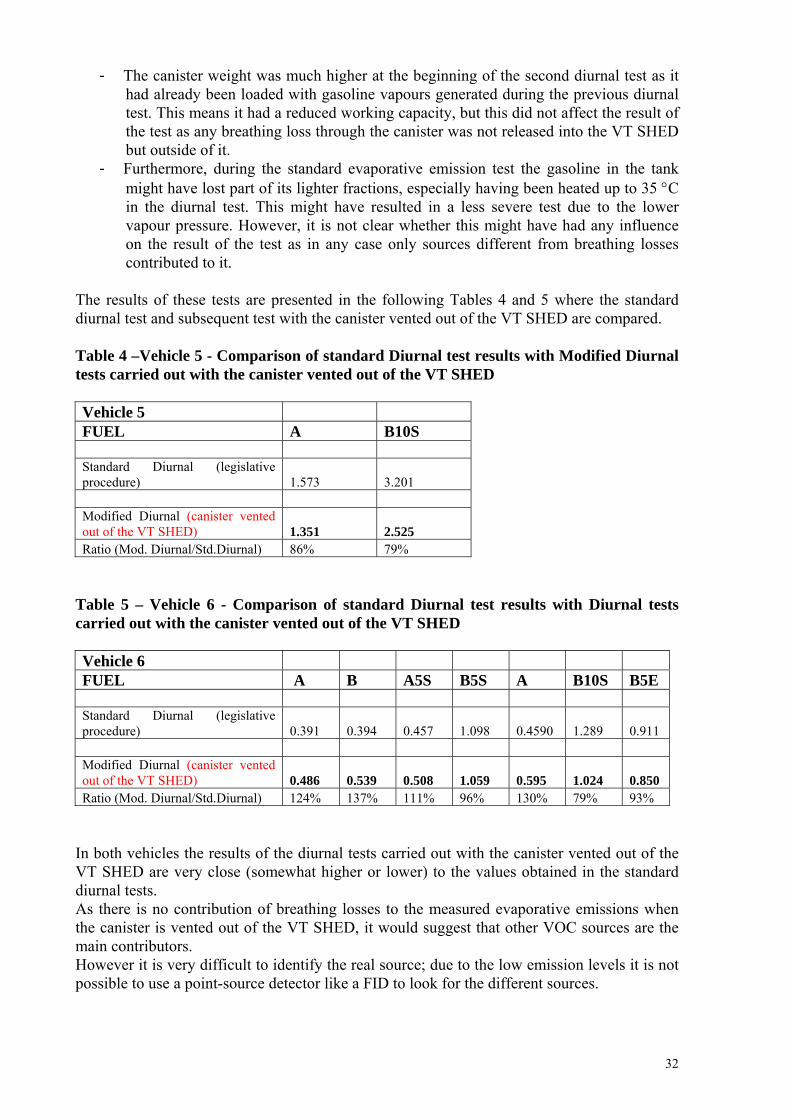
- The canister weight was much higher at the beginning of the second diurnal test as it had already been loaded with gasoline vapours generated during the previous diurnal test. This means it had a reduced working capacity, but this did not affect the result of the test as any breathing loss through the canister was not released into the VT SHED but outside of it.
- Furthermore, during the standard evaporative emission test the gasoline in the tank might have lost part of its lighter fractions, especially having been heated up to 35 °C in the diurnal test. This might have resulted in a less severe test due to the lower vapour pressure. However, it is not clear whether this might have had any influence on the result of the test as in any case only sources different from breathing losses contributed to it.
The results of these tests are presented in the following Tables 4 and 5 where the standard diurnal test and subsequent test with the canister vented out of the VT SHED are compared. Table 4 –Vehicle 5 - Comparison of standard Diurnal test results with Modified Diurnal tests carried out with the canister vented out of the VT SHED Vehicle 5 FUEL A B10S Standard Diurnal (legislative procedure) 1.573 3.201 Modified Diurnal (canister vented out of the VT SHED) 1.351 2.525 Ratio (Mod. Diurnal/Std.Diurnal) 86% 79%
Table 5 – Vehicle 6 - Comparison of standard Diurnal test results with Diurnal tests carried out with the canister vented out of the VT SHED Vehicle 6 FUEL A B A5S B5S A B10S B5E Standard Diurnal (legislative procedure) 0.391 0.394 0.457 1.098 0.4590 1.289 0.911 Modified Diurnal (canister vented out of the VT SHED) 0.486 0.539 0.508 1.059 0.595 1.024 0.850 Ratio (Mod. Diurnal/Std.Diurnal) 124% 137% 111% 96% 130% 79% 93%
In both vehicles the results of the diurnal tests carried out with the canister vented out of the VT SHED are very close (somewhat higher or lower) to the values obtained in the standard diurnal tests. As there is no contribution of breathing losses to the measured evaporative emissions when the canister is vented out of the VT SHED, it would suggest that other VOC sources are the main contributors. However it is very difficult to identify the real source; due to the low emission levels it is not possible to use a point-source detector like a FID to look for the different sources.

33
The results of vehicle 6 are even more difficult to understand, unless there was a very small leak somewhere. As vehicle 6 had a metallic tank that is not permeable to hydrocarbons, fuel permeation should be very limited as it can occur only through fuel hoses.
5.3.2. Consecutive multiple tests on the same fuel. Additional tests were carried out on vehicle 5 once the test series originally planned according to the test protocol had been completed. There is no technical or scientific reason why these additional tests were carried out only on vehicle 5; this choice was simply driven by the longer availability for testing of this vehicle. At the end of the main test series, three different blocks of tests were carried out. The main objective of these additional tests, as already described, was to try to understand the reason for the increase in emissions with time seen in the main programme. The aim was to explore whether pure hydrocarbon fuels exhibit a different behaviour than ethanol containing fuels and to investigate whether the observed increase in emissions is due to increased canister loading, to an ethanol “memory” build up in the canister or to other possible effects. From a theoretical point of view, ethanol is a polar molecule and is known to be harder to purge from the active carbon in the canister. This ethanol characteristic might result in a progressive reduction of carbon canister working capacity leading to an increase of emissions [19] [15]. However, the presence of ethanol in the fuel could also progressively increase the fuel permeation rate and, as a consequence, the total evaporative emissions. Each of these blocks was preceded by a thorough purging operation of the canister in order to eliminate any “memory” of fuels previously tested. The initial idea was to run multiple NEDC cycles with fuel A (at least 5 but preferably 10) with the aim to purge completely the ethanol from the canister. The amount of air flowing through the canister during the NEDC cycles was measured, as well as the weight of the canister after each cycle. However, after ten cycles it was decided to disconnect the canister from the vehicle and purge it to dryness with hot dry air (40 °C). This decision was taken as the weight reduction of the canister after each driving cycle was progressively becoming smaller and it was clear that ethanol and any other hydrocarbons would not have been completely removed from the canister without completing a huge number of driving cycles. The canister was therefore purged for 2 hours with dry air at 40 °C and then for 4 hours with air at 80 °C. Additionally the concentration of ethanol in the air exiting from the canister was measured to monitor the residual amount of ethanol still adsorbed on activated carbon. When the canister weight had stabilised, purging was stopped although a very small level of ethanol was still detectable in the airflow coming out of the canister. The canister was then reconnected and the first block of tests was started. The first block of tests comprised four consecutive tests on fuel A, followed by one test on fuel B and a final test on A, as shown in Table 6. The final test had to be repeated as the temperature profile of the diurnal test was not correct due to a malfunctioning of the thermocouple control module. At the end of the first block, the canister was purged again with dry air down to the same initial weight of the first block. Then three tests on fuel A5E and one test on B5E were performed to look at the effect of ethanol at constant vapour pressure. The result of the

34
diurnal test on fuel B5E is suspect as the temperature in the VT SHED dropped too quickly during the cooling down phase of the test due to a power supply failure. As a consequence the test resulted to be less severe than a standard one. However, the result of the test has been retained, as usually VOC concentration remains almost stable during the decreasing temperature phase of the diurnal test. After a third purging operation of the canister, a third block of tests, consisting of three tests on fuel A5S followed by two on fuel A, was carried out. The aim of the last two tests on fuel A was to check emission levels with the base fuel after the vehicle had been using ethanol containing fuels for a substantial period of time. The results of these tests are illustrated in Figure 10 and in table 6. Figure 10: Extra tests performed on Vehicle 5 (consecutive multiple tests on same fuel)
Vehicle 5 - Extra Tests After Purging the Canister to DrynessBars: total evaporative emissions - Line: canister weight before N2/butane saturation
0.00
0.50
1.00
1.50
2.00
2.50
3.00
A A A A B A A
Purging
A5E A5E A5E B5E
Purging
A5S A5S A5S A A
Fuel
Tota
l Eva
p. E
mis
s. (g
/test
)
500
520
540
560
580
600
620
640
660
680
700
Can
iste
r Wei
ght (
g)
Not valid test
Table 6 – Canister weights and evaporative emissions during consecutive multiple tests on Vehicle 5
35
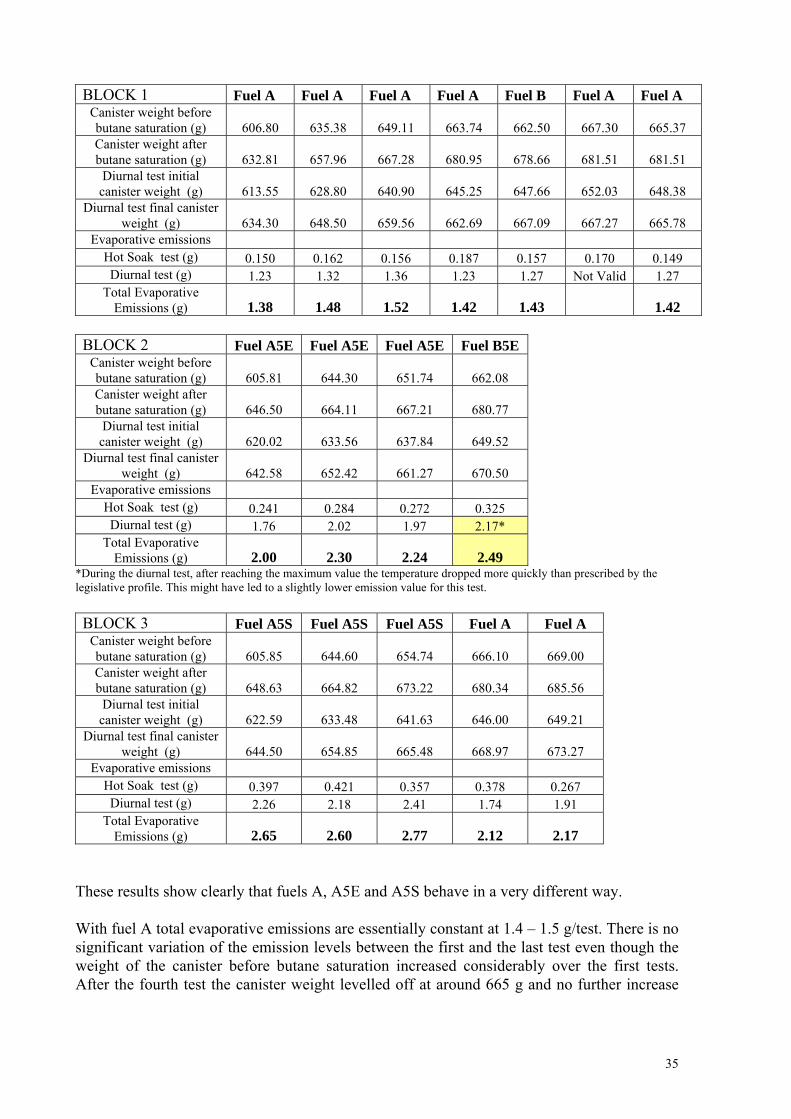
BLOCK 1 Fuel A Fuel A Fuel A Fuel A Fuel B Fuel A Fuel A
Canister weight before butane saturation (g) 606.80 635.38 649.11 663.74 662.50 667.30 665.37 Canister weight after butane saturation (g) 632.81 657.96 667.28 680.95 678.66 681.51 681.51
Diurnal test initial canister weight (g) 613.55 628.80 640.90 645.25 647.66 652.03 648.38
Diurnal test final canister weight (g) 634.30 648.50 659.56 662.69 667.09 667.27 665.78
Evaporative emissions Hot Soak test (g) 0.150 0.162 0.156 0.187 0.157 0.170 0.149 Diurnal test (g) 1.23 1.32 1.36 1.23 1.27 Not Valid 1.27
Total Evaporative Emissions (g) 1.38 1.48 1.52 1.42 1.43 1.42
BLOCK 2 Fuel A5E Fuel A5E Fuel A5E Fuel B5E
Canister weight before butane saturation (g) 605.81 644.30 651.74 662.08 Canister weight after butane saturation (g) 646.50 664.11 667.21 680.77
Diurnal test initial canister weight (g) 620.02 633.56 637.84 649.52
Diurnal test final canister weight (g) 642.58 652.42 661.27 670.50
Evaporative emissions Hot Soak test (g) 0.241 0.284 0.272 0.325 Diurnal test (g) 1.76 2.02 1.97 2.17*
Total Evaporative Emissions (g) 2.00 2.30 2.24 2.49
*During the diurnal test, after reaching the maximum value the temperature dropped more quickly than prescribed by the legislative profile. This might have led to a slightly lower emission value for this test. BLOCK 3 Fuel A5S Fuel A5S Fuel A5S Fuel A Fuel A
Canister weight before butane saturation (g) 605.85 644.60 654.74 666.10 669.00 Canister weight after butane saturation (g) 648.63 664.82 673.22 680.34 685.56
Diurnal test initial canister weight (g) 622.59 633.48 641.63 646.00 649.21
Diurnal test final canister weight (g) 644.50 654.85 665.48 668.97 673.27
Evaporative emissions Hot Soak test (g) 0.397 0.421 0.357 0.378 0.267 Diurnal test (g) 2.26 2.18 2.41 1.74 1.91
Total Evaporative Emissions (g) 2.65 2.60 2.77 2.12 2.17
These results show clearly that fuels A, A5E and A5S behave in a very different way. With fuel A total evaporative emissions are essentially constant at 1.4 – 1.5 g/test. There is no significant variation of the emission levels between the first and the last test even though the weight of the canister before butane saturation increased considerably over the first tests. After the fourth test the canister weight levelled off at around 665 g and no further increase

36
was observed. In this case it seems that the canister initial weight did not affect significantly the measured evaporative emissions. Fuel B, having a DVPE of 70 kPa gave emission levels very close to those obtained with fuel A. With fuels A5E and A5S total evaporative emissions were higher than on fuel A, and showed a clear increase with time. Fuel A5S gave the highest emissions. However the weight of the canister showed a very similar trend to that observed with fuel A: after a noticeable increase in the first tests, the weight stabilized around a value ~665 g. In absolute terms, only small differences for the canister weight were observed among the three test fuels. This seems to suggest that the different emission levels measured with fuel A, A5E and A5S are not due simply to a different canister loading, but to other factors including a change in working capacity. The final two tests on fuel A were substantially higher than the first block of tests, but lower than the tests on ethanol fuels. These results suggest that the influence of ethanol on evaporative emissions is not only linked to the increase of gasoline vapour pressure; in fact, with fuel A5E evaporative emissions increased even though its vapour pressure is identical to that of fuel A. However, vapour pressure seems to play a role as evaporative emissions increased further when fuel A5S, differing only for the vapour pressure from A5E, was tested. From these data it is difficult to identify the reason why fuel A5E behaves differently from fuel A; a possible explanation might be a greater role of fuel permeation in determining evaporative emissions than initially thought. This is discussed further in Section 6.1.2. Statistical analysis of fuel effects in Vehicle 5 (consecutive multiple tests) Statistical techniques can be applied to analyze the results of the repeated extra tests carried out on Vehicle 5 in order to investigate the relative performance of fuels A, A5E and A5S in terms of evaporative emissions. A significant upward trend in evaporative emissions (P<0.1%) was seen in these additional tests conducted after the end of the main programme using weighted regression analysis (this analysis is based on the extra test only and excludes the first test in each block where the initial canister weight was low). The trend corrected mean emission values for the three fuels were:
Fuel Mean g/test SE A 1.745 0.042 A5E 2.166 0.081 A5S 2.449 0.104
Significant differences are seen between the 3 fuels in an F-test (P<0.1%). Investigating these differences further using the Tukey-Kramer multiple comparison procedure, fuel A has lower emissions than A5E (P<1%) and A5S (P<0.1%) with no significant difference between A5E and A5S.

37
6. DISCUSSION OF RESULTS
6.1. Evaporative emissions The results clearly showed that evaporative emissions measured according to the legislative procedure are dominated by the contribution of the Diurnal test which accounts for 80 to 99% of the total value, depending on the vehicle and on the fuel (see Appendix 4 for more details on Hot Soak results). The Hot Soak contribution was not only small but also quite variable with no clear pattern and no correlation with fuel quality. Due to the low levels of Hot Soak emissions and despite their variability, total evaporative emissions reflect the trend observed for the diurnal test data; therefore there is no substantial difference in conclusions between considering the total evaporative emissions or only the diurnal test data. The key objective of the programme was to establish to what extent evaporative emissions were influenced by gasoline vapour pressure and ethanol content. However it emerged during the programme that the data presented a problem of comparability. As already discussed, an upward trend in emission levels was noticed for each vehicle, as clearly demonstrated by the multiple tests carried out on Fuel A. The first test with this fuel gave consistently lower emissions than subsequent tests on the same fuel. The only exceptions are the tests carried out after extra purging of the canister (vehicles 3 and 4). This is likely to be due to the increased loading of the canister, as the canister weight increased with test number, especially during the first few tests on each vehicle. Most probably the conditioning phase prescribed by the legislative procedure was not sufficient (for most of the vehicles) to return the canister to a constant condition before each test. It is not clear whether this behaviour of the canister during the test sequence is due to, or has been exacerbated by the presence of ethanol in the test fuels as, being a polar molecule, it is known to be harder to purge from activated carbon than light hydrocarbons. The conditions in which the tests have been carried out may not correspond to typical on-road vehicle usage and therefore cannot be considered fully representative of average real-world conditions. Nevertheless, the high canister loading due to the limited conditioning made the test conditions very severe and therefore more likely to accentuate any fuel effects. As a consequence, the tests carried out at the beginning of each vehicle test sequence might not be directly comparable with those carried out later. This is particularly true for fuel A and raised the question whether the first test on Fuel A should be excluded and not considered in evaluating the influence of the fuel properties on evaporative emissions. It is also clear that simply averaging repeat results on the various fuels in any particular vehicle would be misleading. In this study, time constraints together with the length of each evaporative emission test limited the number of repeat tests. Moreover, an adaptive test sequence was used that could not be randomised properly because of concerns about carry over effects (see section 5.2). As a consequence, once unexpected variations in canister weight appeared, it became difficult to disentangle fuel (ethanol, vapour pressure,…), canister weight and other time-related effects even using sophisticated multiple regression techniques. No consistent causal model(s) emerged which properly quantified the sizes of the various effects. In particular, it was not possible to determine from the main programme data whether ethanol had any effect over and

38
above its effect on fuel vapour pressure. Therefore it was decided not to report these analyses and to focus only on those conclusions that can be straightforwardly drawn from the data. Evaporative emissions clearly appear to be influenced by fuel vapour pressure as shown by Figures 3 and 4. However the effect of vapour pressure is not linear and only the fuels having a DVPE close to 75 kPa (B5S, B10S) gave clearly higher evaporative emissions than the base fuel A. This non-linearity of the vapour pressure influence on evaporative emissions was expected and can be easily explained. Carbon canisters are very efficient at trapping gasoline vapours until they become saturated (known as breakthrough). Once the breakthrough condition is reached, the canister can no longer adsorb all the vapour generated in the tank and some is emitted to atmosphere. In particular, if the breakthrough condition is reached during the heating up phase of the diurnal test, from the instant in which it occurs the vehicle acts like a vehicle without a canister and evaporative emissions can reach very high levels. The homologation test for evaporative emissions is carried out, as prescribed by the relevant legislation, with a reference fuel having a DVPE of 60 kPa at typical summer temperatures in central/south Europe. Evaporative emission control systems are therefore developed to cope with fuels having a vapour pressure close to 60 kPa, together with some engineering margin. However, such systems may be not able to efficiently control evaporative emissions in conditions different from those envisaged by the homologation procedure. Even if an engineering margin is built into the system, fuels with a significantly higher vapour pressure than 60 kPa may easily give higher evaporative emissions if canister breakthrough occurs. The results of this programme suggest that, for most of the vehicles tested, fuels having a DVPE around 75 kPa are beyond the capability of the carbon canister to effectively control evaporative emissions and in some cases lead to breakthrough at temperatures that may be encountered in summer. Regarding the test fuels having a DVPE in the range of 60-70 kPa, the picture is less clear. For all the vehicles tested, the differences in evaporative emissions between the various fuels were quite small, and not always in the same direction. This does not necessarily mean that there is no fuel effect on evaporative emissions for the fuels having a DVPE in the range of 60-70 kPa, only that the fuel effects are too small to be discerned in this particular series of experiments. As already mentioned, the increasing loading of the canister with successive test could have altered the test results either hiding or magnifying possible fuel effects. Furthermore each vehicle exhibited a different sensitivity to fuel quality and in particular to fuel vapour pressure changes making even more difficult to draw any reliable conclusions. n two vehicles (3 and 4), during the main programme, a few tests were carried out with a modified procedure, purging the carbon canister back to its initial weight on the first test on fuel A before each test. In these tests the evaporative emissions decreased substantially, making the differences among the fuels even smaller. This suggests that the canister conditioning and the initial canister loading is a key parameter that has a large influence on the test results. It seems likely, therefore, that breathing losses only contribute significantly to total evaporative emissions once canister breakthrough occurs, and are therefore more or less independent of vapour pressure up to this point. However it is clear that a higher vapour pressure speeds up breakthrough. Ethanol might influence evaporative emissions also via different mechanisms than the increased vapour pressure of ethanol/gasoline blends [19]. To explore this possibility
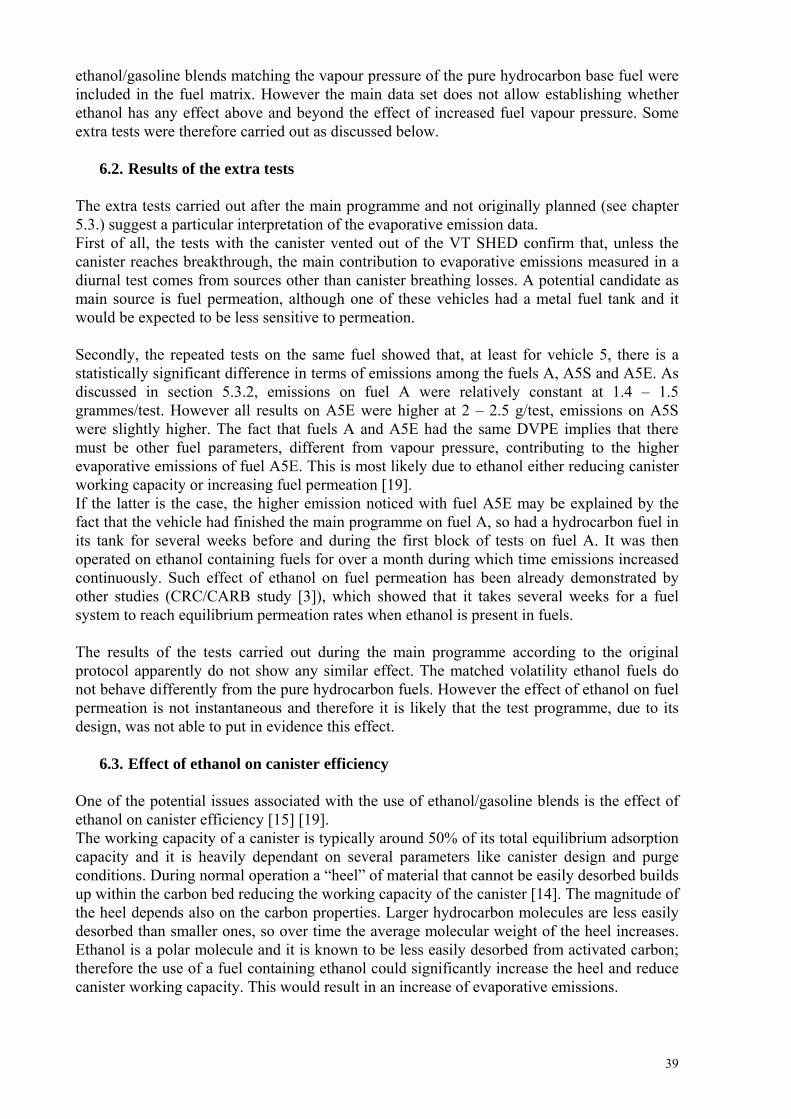
39
ethanol/gasoline blends matching the vapour pressure of the pure hydrocarbon base fuel were included in the fuel matrix. However the main data set does not allow establishing whether ethanol has any effect above and beyond the effect of increased fuel vapour pressure. Some extra tests were therefore carried out as discussed below.
6.2. Results of the extra tests The extra tests carried out after the main programme and not originally planned (see chapter 5.3.) suggest a particular interpretation of the evaporative emission data. First of all, the tests with the canister vented out of the VT SHED confirm that, unless the canister reaches breakthrough, the main contribution to evaporative emissions measured in a diurnal test comes from sources other than canister breathing losses. A potential candidate as main source is fuel permeation, although one of these vehicles had a metal fuel tank and it would be expected to be less sensitive to permeation. Secondly, the repeated tests on the same fuel showed that, at least for vehicle 5, there is a statistically significant difference in terms of emissions among the fuels A, A5S and A5E. As discussed in section 5.3.2, emissions on fuel A were relatively constant at 1.4 – 1.5 grammes/test. However all results on A5E were higher at 2 – 2.5 g/test, emissions on A5S were slightly higher. The fact that fuels A and A5E had the same DVPE implies that there must be other fuel parameters, different from vapour pressure, contributing to the higher evaporative emissions of fuel A5E. This is most likely due to ethanol either reducing canister working capacity or increasing fuel permeation [19]. If the latter is the case, the higher emission noticed with fuel A5E may be explained by the fact that the vehicle had finished the main programme on fuel A, so had a hydrocarbon fuel in its tank for several weeks before and during the first block of tests on fuel A. It was then operated on ethanol containing fuels for over a month during which time emissions increased continuously. Such effect of ethanol on fuel permeation has been already demonstrated by other studies (CRC/CARB study [3]), which showed that it takes several weeks for a fuel system to reach equilibrium permeation rates when ethanol is present in fuels. The results of the tests carried out during the main programme according to the original protocol apparently do not show any similar effect. The matched volatility ethanol fuels do not behave differently from the pure hydrocarbon fuels. However the effect of ethanol on fuel permeation is not instantaneous and therefore it is likely that the test programme, due to its design, was not able to put in evidence this effect.
6.3. Effect of ethanol on canister efficiency One of the potential issues associated with the use of ethanol/gasoline blends is the effect of ethanol on canister efficiency [15] [19]. The working capacity of a canister is typically around 50% of its total equilibrium adsorption capacity and it is heavily dependant on several parameters like canister design and purge conditions. During normal operation a “heel” of material that cannot be easily desorbed builds up within the carbon bed reducing the working capacity of the canister [14]. The magnitude of the heel depends also on the carbon properties. Larger hydrocarbon molecules are less easily desorbed than smaller ones, so over time the average molecular weight of the heel increases. Ethanol is a polar molecule and it is known to be less easily desorbed from activated carbon; therefore the use of a fuel containing ethanol could significantly increase the heel and reduce canister working capacity. This would result in an increase of evaporative emissions.

40
As already mentioned, this programme was not designed to specifically address the influence of ethanol on carbon canister performance. However, VOC speciation data showed that when evaporative emission tests with pure hydrocarbon fuels followed tests carried out with ethanol containing fuels, ethanol was found in the samples of the internal atmosphere of the VT SHED. The canister is the most likely source of ethanol in these cases and this means that the canister purging prescribed by the test procedure was not sufficient to remove all the ethanol from the activated carbon when going back to pure hydrocarbon fuels. Experience of purging the canister of vehicle 5 to dryness for the extra tests also showed that it was very difficult to remove all the ethanol. However from this programme it is not possible to establish if the residual ethanol does irreversibly reduce the working capacity of the canister. Literature data confirm that the presence of ethanol in the fuel leads to an increased heel in the canister but it is not clear whether this impairs the canister performance in the long term. According to data provided by activated carbon manufacturers the heel does increase as a result of ethanol use but the gasoline working capacity of the activated carbon is not significantly affected by that.
6.4. VOC Speciation data In order to have a better understanding of the influence of gasoline properties on evaporative emissions, VOC speciation analysis was performed on samples of the internal atmosphere of the VT SHED collected at the beginning and at the end of the diurnal test. Although evaporative emission composition varied noticeably depending on the vehicle, some consistent general trends can be identified from the data (see chapter 5.2.2). In all the cases ethanol was found to be present in low concentrations, always lower than its level in the test fuel. However ethanol was also found when pure hydrocarbon fuels were tested after tests carried out with the ethanol containing fuels. As already discussed, in these tests the most likely source of ethanol was the canister heel; most probably, ethanol was not completely desorbed during the purging operations carried out prior to the start of the test. The low levels of ethanol seem also to confirm that it is efficiently trapped by the canister and that the contribution of ethanol breathing losses to the total evaporative emission is quite low. Figure 5 shows that the major part of the evaporative emissions consisted of C4- and C5+ alkane hydrocarbons. Light hydrocarbons are expected to be the main contributors to evaporative emissions because of their low boiling point and their higher diffusion rate in the carbon bed. The main sources of these hydrocarbons are probably canister bleed emissions and breathing losses. Heavier hydrocarbons like aromatics were also found in significant concentrations; for example, aromatics contributed an average of 32% to total evaporative emissions of vehicle 2. These hydrocarbons are less likely to be emitted through the canister vent as their concentration in the gasoline vapours above the liquid surface in the tank is expected to be low due to the high boiling point. In this case the main source of emissions is likely to be fuel permeation. The ratio between aromatics and the other hydrocarbons is quite different from vehicle to vehicle; Table. 7 shows that even if the mass of aromatics emitted is similar (e.g. vehicle 2 and vehicle 3), their contribution to the total average emissions is different. This is due to the very different total emissions and probably to the different relative contribution of
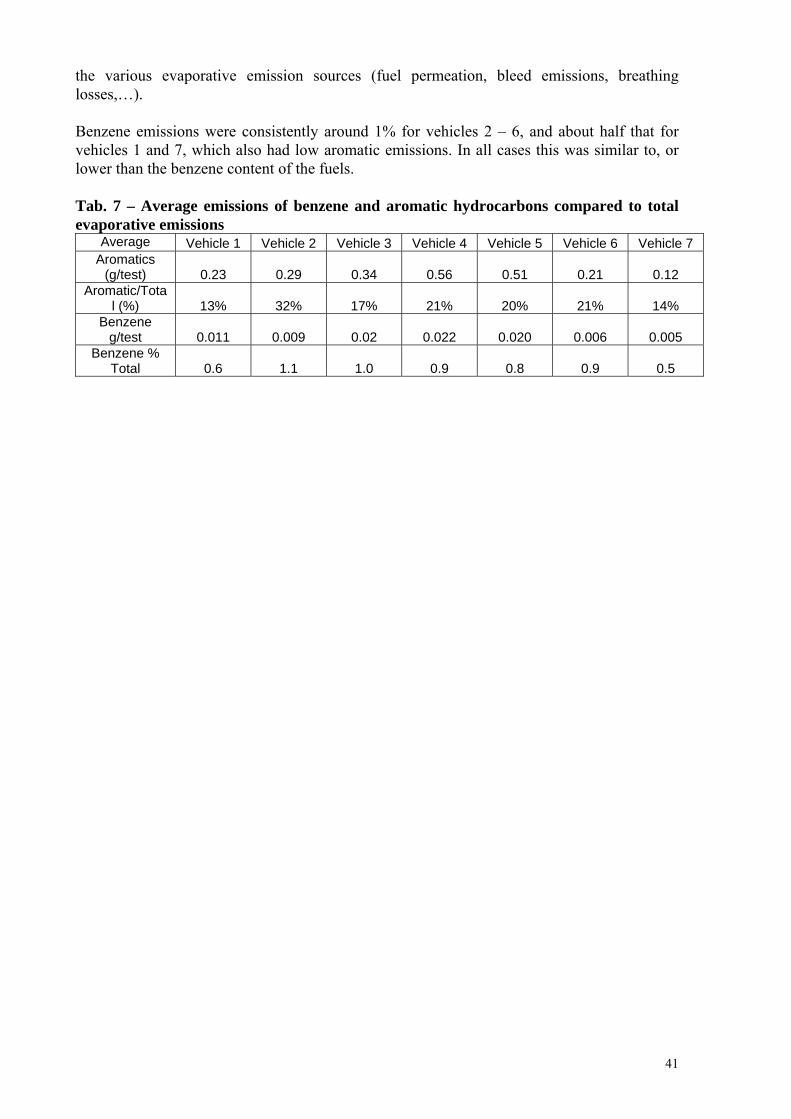
41
the various evaporative emission sources (fuel permeation, bleed emissions, breathing losses,…). Benzene emissions were consistently around 1% for vehicles 2 – 6, and about half that for vehicles 1 and 7, which also had low aromatic emissions. In all cases this was similar to, or lower than the benzene content of the fuels. Tab. 7 – Average emissions of benzene and aromatic hydrocarbons compared to total evaporative emissions
Average Vehicle 1 Vehicle 2 Vehicle 3 Vehicle 4 Vehicle 5 Vehicle 6 Vehicle 7 Aromatics
(g/test) 0.23 0.29 0.34 0.56 0.51 0.21 0.12 Aromatic/Tota
l (%) 13% 32% 17% 21% 20% 21% 14% Benzene
g/test 0.011 0.009 0.02 0.022 0.020 0.006 0.005 Benzene %
Total 0.6 1.1 1.0 0.9 0.8 0.9 0.5
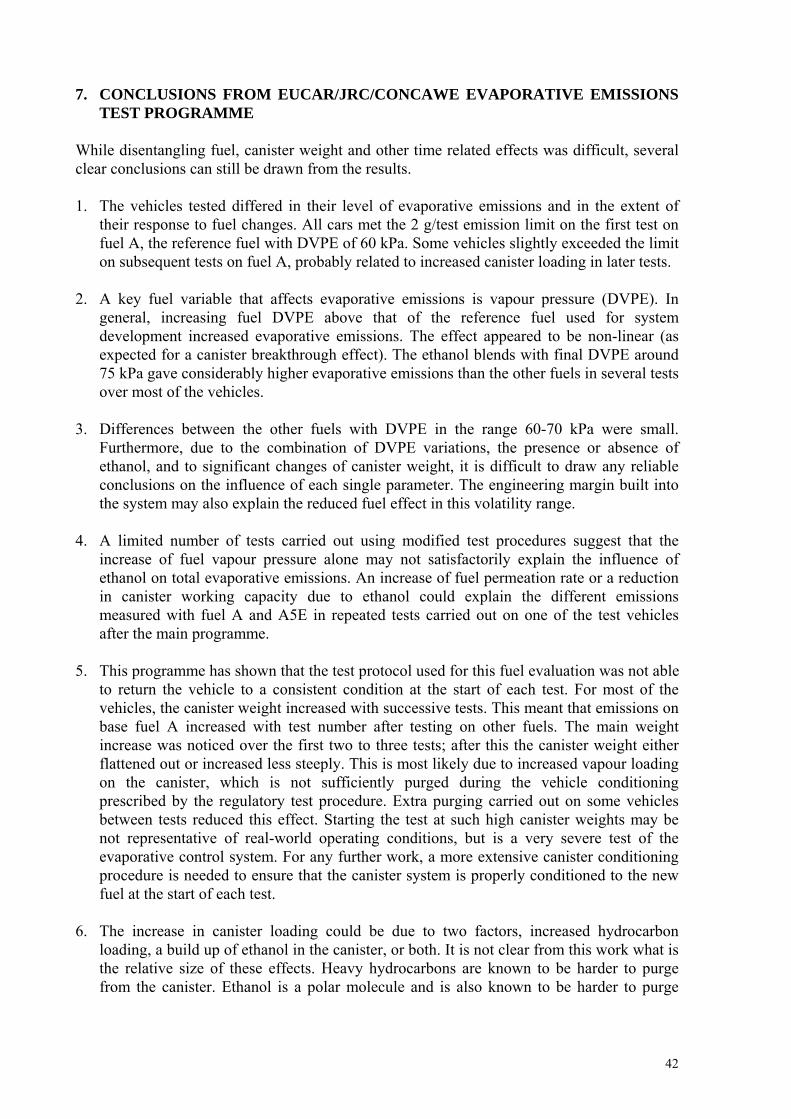
42
7. CONCLUSIONS FROM EUCAR/JRC/CONCAWE EVAPORATIVE EMISSIONS
TEST PROGRAMME While disentangling fuel, canister weight and other time related effects was difficult, several clear conclusions can still be drawn from the results. 1. The vehicles tested differed in their level of evaporative emissions and in the extent of
their response to fuel changes. All cars met the 2 g/test emission limit on the first test on fuel A, the reference fuel with DVPE of 60 kPa. Some vehicles slightly exceeded the limit on subsequent tests on fuel A, probably related to increased canister loading in later tests.
2. A key fuel variable that affects evaporative emissions is vapour pressure (DVPE). In
general, increasing fuel DVPE above that of the reference fuel used for system development increased evaporative emissions. The effect appeared to be non-linear (as expected for a canister breakthrough effect). The ethanol blends with final DVPE around 75 kPa gave considerably higher evaporative emissions than the other fuels in several tests over most of the vehicles.
3. Differences between the other fuels with DVPE in the range 60-70 kPa were small.
Furthermore, due to the combination of DVPE variations, the presence or absence of ethanol, and to significant changes of canister weight, it is difficult to draw any reliable conclusions on the influence of each single parameter. The engineering margin built into the system may also explain the reduced fuel effect in this volatility range.
4. A limited number of tests carried out using modified test procedures suggest that the
increase of fuel vapour pressure alone may not satisfactorily explain the influence of ethanol on total evaporative emissions. An increase of fuel permeation rate or a reduction in canister working capacity due to ethanol could explain the different emissions measured with fuel A and A5E in repeated tests carried out on one of the test vehicles after the main programme.
5. This programme has shown that the test protocol used for this fuel evaluation was not able
to return the vehicle to a consistent condition at the start of each test. For most of the vehicles, the canister weight increased with successive tests. This meant that emissions on base fuel A increased with test number after testing on other fuels. The main weight increase was noticed over the first two to three tests; after this the canister weight either flattened out or increased less steeply. This is most likely due to increased vapour loading on the canister, which is not sufficiently purged during the vehicle conditioning prescribed by the regulatory test procedure. Extra purging carried out on some vehicles between tests reduced this effect. Starting the test at such high canister weights may be not representative of real-world operating conditions, but is a very severe test of the evaporative control system. For any further work, a more extensive canister conditioning procedure is needed to ensure that the canister system is properly conditioned to the new fuel at the start of each test.
6. The increase in canister loading could be due to two factors, increased hydrocarbon
loading, a build up of ethanol in the canister, or both. It is not clear from this work what is the relative size of these effects. Heavy hydrocarbons are known to be harder to purge from the canister. Ethanol is a polar molecule and is also known to be harder to purge
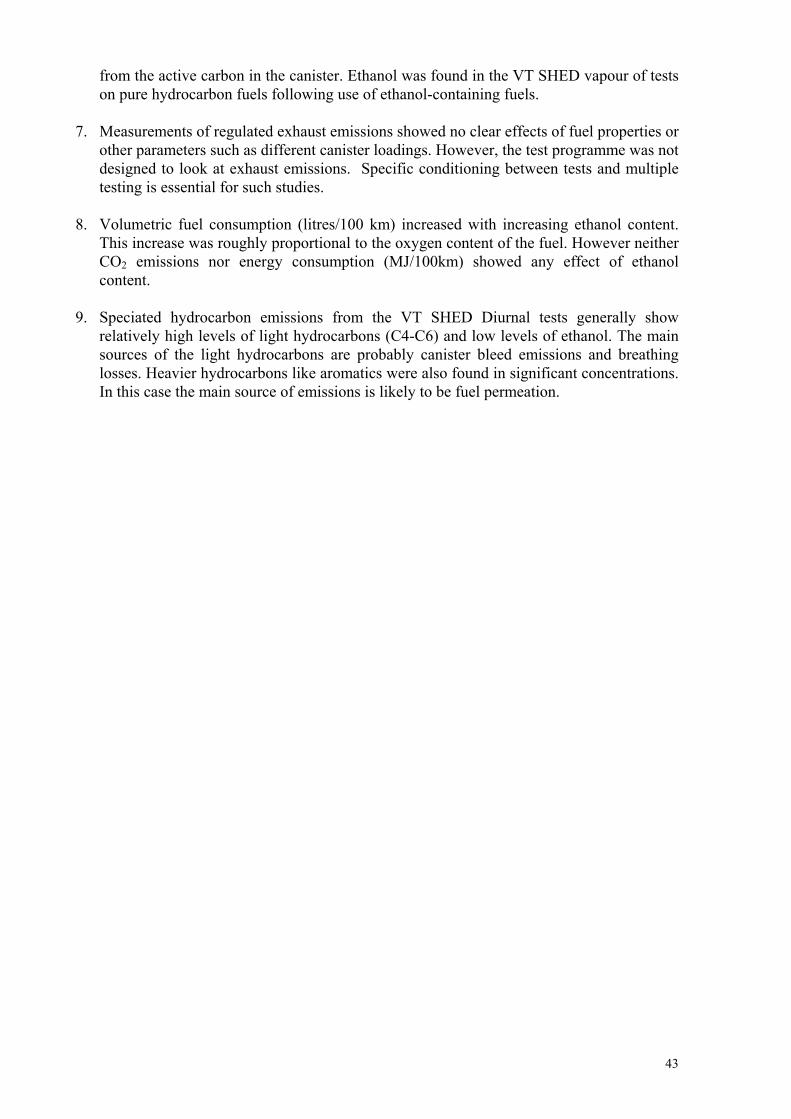
43
from the active carbon in the canister. Ethanol was found in the VT SHED vapour of tests on pure hydrocarbon fuels following use of ethanol-containing fuels.
7. Measurements of regulated exhaust emissions showed no clear effects of fuel properties or
other parameters such as different canister loadings. However, the test programme was not designed to look at exhaust emissions. Specific conditioning between tests and multiple testing is essential for such studies.
8. Volumetric fuel consumption (litres/100 km) increased with increasing ethanol content.
This increase was roughly proportional to the oxygen content of the fuel. However neither CO2 emissions nor energy consumption (MJ/100km) showed any effect of ethanol content.
9. Speciated hydrocarbon emissions from the VT SHED Diurnal tests generally show
relatively high levels of light hydrocarbons (C4-C6) and low levels of ethanol. The main sources of the light hydrocarbons are probably canister bleed emissions and breathing losses. Heavier hydrocarbons like aromatics were also found in significant concentrations. In this case the main source of emissions is likely to be fuel permeation.
44
8. REFERENCES
1. “A Technical Study on Fuels Technology related to the Auto/Oil II Programme – Volume II – Alternative Fuels”, December 2000 – Prepared for the European Commission Directorate General for Energy
2. Report No. SR00-01-01 “Potential Evaporative Emission Impacts Associated with the Introduction of Ethanol-Gasoline Blends in California”, Sierra Research, Inc., January 11, 2000
3. “Fuel Permeation from Automotive Systems” - Final Report, CRC Project No. E-65, September 2004
4. “Proposed Determination Pursuant to Health and Safety Code Section 43830(g) of the Ozone Forming Potential of Elevated RVP Gasoline Containing 10 Percent Ethanol”, November 1998, CEPA, CARB
5. “Issues Associated with the Use of Higher Ethanol Blends (E17-E24)”, National Renewable Energy Laboratory (NREL), October 2002
6. “Comparison of the Effects of a Fully-Complying Gasoline Blend and a High RVP Ethanol Gasoline Blend on Exhaust and Evaporative Emissions”, CARB, November 1998
7. Directive 98/69/EC of the European Parliament and of the Council of 13 October 1998 relating to measures to be taken against air pollution by emissions from motor vehicles and amending Council Directive 70/220/EEC
8. “Relative Importance of 22 Parameters to Evaporative Emissions – A Sensitivity Analysis of EVAP 2.0”, SAE Technical Paper No. 881594
9. “Studies on Carbon Canisters to Satisfy LEVII EVAP Regulations”, SAE Technical Paper No. 2000-01-0895
10. “Speciation of Evaporative Emissions from Plastic Fuel Tanks”, SAE Technical Paper No. 981376
11. “Impact and Control of Canister Bleed Emissions”, SAE Technical Paper No. 2001-01-0733
12. “Identifying Sources of Evaporative Emissions – Using Hydrocarbon Profiles to Identify Emission Sources”, SAE Technical Paper No. 2000-01-1139
13. “Activated Carbon Canister Performance During Diurnal Cycles: An Experimental and Modelling Evaluation”, SAE Technical Paper No. 971651
14. “Development of a Gasoline-Fueled Vehicle with Zero Evaporative Emissions”, SAE Technical Paper No. 2000-01-2926
15. “Gasoline Evaporative Emissions: Ethanol Effects on Vapor Control Canister Sorbent Performance”, SAE Technical Paper No. 952748
16. “Carbon Canister Modeling for Evaporative Emissions: Adsorption and Thermal Effects”, SAE Technical Paper No. 961210
17. “A Fuel Vapor Model (FVSMOD) for Evaporative Emissions System Design and Analysis”, SAE Technical Paper No. 982644
18. “VOC running losses from canister-equipped vehicles”, CONCAWE Report No. 92/53
19. “Air Quality Impacts of the Use of Ethanol in California Reformulated Gasoline” – Final Report to the California Environmental Policy Council - California Environmental Protection Agency –Air Resources Board – 1999
20. “Effects of Gasoline Ethanol Blends on Permeation Emissions Contribution to VOC Inventory From On-Road and Off-Road Sources” - The American Petroleum Institute -2005

45
21. Directive 2003/30/EC of the European Parliament and of the Council of 8 May 2003 on the promotion of the use of biofuels or other renewable fuels for transport
22. Council Directive 2003/96/EC of 27 October 2003 restructuring the Community framework for the taxation of energy products and electricity
23. Alcohols and Ethers, a Technical Assessment of Their Application as Fuels and Fuel Component; American Petroleum Institute (API); publication 4261, rev. 1, June 2001; p 23.
24. “The effects of temperature and fuel volatility on vehicle evaporative emissions”, CONCAWE Report No. 90/51
25. “Fuel effects on emissions from modern gasoline vehicles: Part 1 - sulphur effects”, CONCAWE Report No. 5/03
26. “Fuel effects on emissions from modern gasoline vehicles: Part 2 – aromatics, olefins and volatility effects”, CONCAWE Report No. 02/04
27. “European Programme on Emissions, Fuels, Engine Technologies - EPEFE Report”, ACEA, EUROPIA
28. “Fuel Permeation from Automotive Systems : E0, E6, E10 and E85”, Interim Report CRC Project No. E-65-3

46
APPENDIX 1: EVAPORATIVE EMISSIONS: OVERVIEW
Evaporative emissions: definition and sources Evaporative emissions from a vehicle can be defined, in a very generic way, as all the Volatile Organic Compounds (VOCs) emitted by the vehicle itself and not deriving from fuel combustion. For gasoline vehicles most of evaporative emissions are due to a loss of hydrocarbons from the fuel system; more specifically the major contributions to evaporative emissions come from fuel evaporation from the tank and fuel permeation through fuel hoses, fuel tank, connectors, etc. VOC compounds may also come from materials used for vehicle construction like plastics, interior trim or from other system fluids (e.g. windshield detergent); these emissions are usually very low in modern cars and in any case do not depend on fuel quality. Finally, an important source of VOC emissions is the refuelling operation when the tank is open and gasoline is pumped in. Refuelling emissions are regulated in the USA, and vehicles must control them using a larger carbon canister. In Europe refuelling emissions are controlled in the service station using so-called “Stage 2” systems to return vapour to the underground storage tank. Current European legislation sets a limit for evaporative emissions of 2.0 grammes/test and defines the procedure to measure them [7]. There is similar legislation in USA and Japan. In order to comply with the relevant emission standard, modern vehicles rely on an evaporative emission control system consisting of an activated carbon canister, which adsorbs fuel vapours and prevents their release to the air. Figure 11: Typical layout of an evaporative emission control system
C
Fuel to Injectors
Canister vent
Vapors to Canister Vapors to Engine
Fuel Pump
Fuel Tank
Fuel to InjectorsFuel to Injectors
Canister vent
Vapors to Canister Vapors to Engine
Fuel Pump
Fuel Tank
When the vehicle is parked and the engine is switched off, the carbon canister traps gasoline vapours produced in the tank by gasoline evaporation. When the vehicle is running, in certain operating conditions and under the control of the EMS (Engine Management System), part of the combustion air is drawn through the canister and into the engine; so that the activated carbon is purged and the fuel vapours burned in the engine. The amount of air drawn through the canister is managed by the Engine Management System (EMS) and controlled by means

47
of a valve (purge valve) located on the line connecting the canister with the air intake manifold. A typical layout of an evaporative emission control system is shown in Figure 11. In general, a carbon canister will trap hydrocarbons very efficiently, until it becomes saturated and canister breakthrough occurs. The “gasoline working capacity” (GWC) of a canister is defined as the amount of vapour it can absorb in normal use before breakthrough occurs. A standard “Butane Working Capacity” (BWC) is specified by ASTM D 2652 and used in the industry. In automotive application, breakthrough is usually defined as the point when 2.0 grams of hydrocarbons have been emitted by the canister or when the total hydrocarbon concentration reaches 5000 ppm. When breakthrough is reached, the canister can no longer trap all hydrocarbons, so some will pass through the canister via a diffusion based mechanism and be released into the air. Eventually the carbon will become saturated and can adsorb no more hydrocarbons. Usually there is a hydrocarbon concentration gradient within the carbon bed: higher concentration in the part closer to the tank, lower towards the vent of the canister. The adsorbed hydrocarbons, especially the lightest ones, tend to diffuse from the high concentration areas to the low concentration ones. In this way light hydrocarbons can reach the canister exit port and escape from it. These emissions are called “bleed emissions” [11]. In the case of a modern carbon canister equipped vehicle in good general condition, three main sources of fuel related evaporative emissions can be identified [3]: “Breathing losses” Breathing losses are due to fuel vapours escaping from the tank through its vent. The fuel tank, by design, is vented to the atmosphere through a pressure relief valve, so that tank pressure is maintained slightly above atmospheric. In modern vehicles the tank is vented to atmosphere through an activated carbon canister which adsorbs and stores the hydrocarbons preventing emissions to atmosphere, as shown in Figure 11. Breathing losses are influenced by a number of factors [8] [9] [14], mainly fuel volatility, temperature and fuel system design in addition, of course, to the size and design of the canister. The most important fuel property is the vapour pressure, a property measured according to the EN 13016-1 method. This method measures the Dry Vapour Pressure Equivalent (DVPE) of the older Reid Vapour Pressure (RVP) method. The difference between RVP and DVPE is the measuring method. DVPE is measured “dry” after removing all moisture from the test chamber prior to injection of the sample. This overcomes the unpredictability of results experienced when testing samples containing oxygenates by the conventional Reid method. The DVPE is measured at a temperature of 37.8° C. The CEN standard EN 228:2004 sets out the gasoline volatility classes applied in Europe. Class A (max. 60 kPa DVPE) is required by the EU fuels Directive during summer in Europe (1 May to 30 September). Class B (max. 70 kPa DVPE) is required for countries “with arctic conditions” from 1 June to 31 August. It is exactly the influence of fuel volatility on evaporative emissions that is the main subject of the CONCAWE/EUCAR/JRC joint study described in this report. Residual HC concentration in the canister after purging has a certain influence as well. Canister breakthrough will occur more easily when the residual HC concentration increases, because this reduces the working capacity of the canister. Polar molecules like ethanol (or water) or heavier hydrocarbons are usually harder to purge from the carbon. It has been
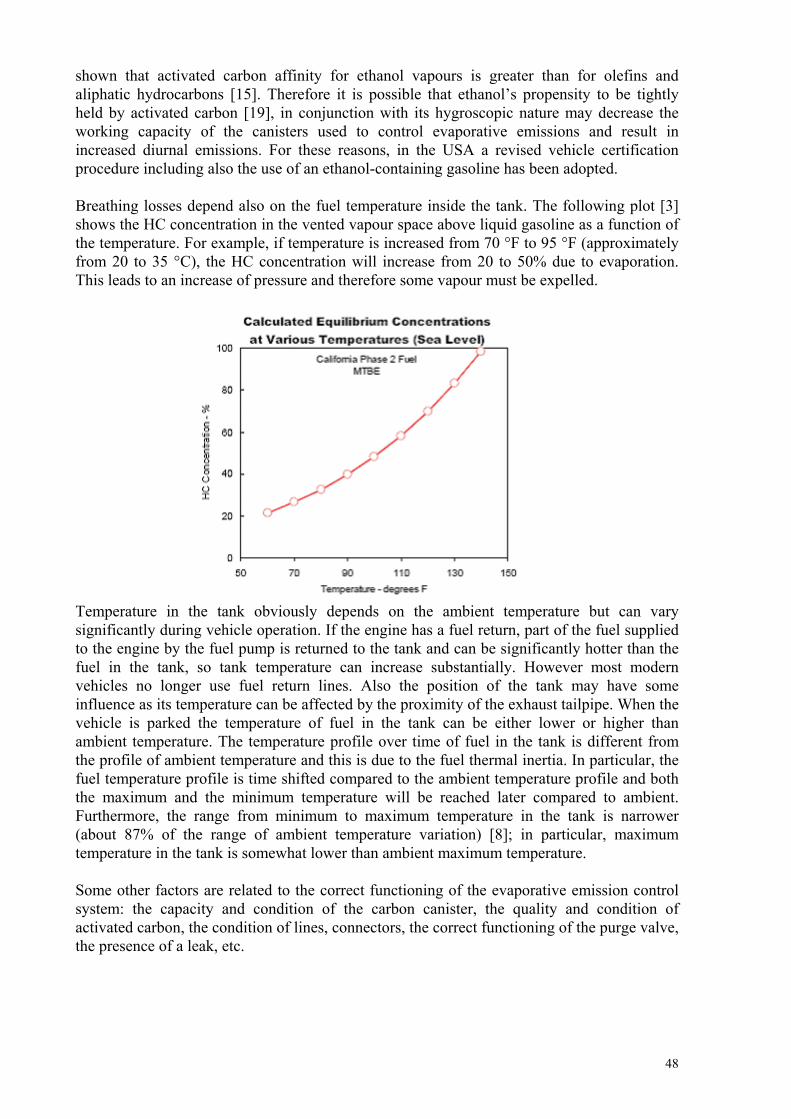
48
shown that activated carbon affinity for ethanol vapours is greater than for olefins and aliphatic hydrocarbons [15]. Therefore it is possible that ethanol’s propensity to be tightly held by activated carbon [19], in conjunction with its hygroscopic nature may decrease the working capacity of the canisters used to control evaporative emissions and result in increased diurnal emissions. For these reasons, in the USA a revised vehicle certification procedure including also the use of an ethanol-containing gasoline has been adopted. Breathing losses depend also on the fuel temperature inside the tank. The following plot [3] shows the HC concentration in the vented vapour space above liquid gasoline as a function of the temperature. For example, if temperature is increased from 70 °F to 95 °F (approximately from 20 to 35 °C), the HC concentration will increase from 20 to 50% due to evaporation. This leads to an increase of pressure and therefore some vapour must be expelled.
Temperature in the tank obviously depends on the ambient temperature but can vary significantly during vehicle operation. If the engine has a fuel return, part of the fuel supplied to the engine by the fuel pump is returned to the tank and can be significantly hotter than the fuel in the tank, so tank temperature can increase substantially. However most modern vehicles no longer use fuel return lines. Also the position of the tank may have some influence as its temperature can be affected by the proximity of the exhaust tailpipe. When the vehicle is parked the temperature of fuel in the tank can be either lower or higher than ambient temperature. The temperature profile over time of fuel in the tank is different from the profile of ambient temperature and this is due to the fuel thermal inertia. In particular, the fuel temperature profile is time shifted compared to the ambient temperature profile and both the maximum and the minimum temperature will be reached later compared to ambient. Furthermore, the range from minimum to maximum temperature in the tank is narrower (about 87% of the range of ambient temperature variation) [8]; in particular, maximum temperature in the tank is somewhat lower than ambient maximum temperature. Some other factors are related to the correct functioning of the evaporative emission control system: the capacity and condition of the carbon canister, the quality and condition of activated carbon, the condition of lines, connectors, the correct functioning of the purge valve, the presence of a leak, etc.

49
- “Fuel permeation” Hydrocarbons also escapes the vehicle’s fuel system by permeation through the plastic and rubber components; e.g., hoses, seals, and in vehicles with a non-metallic tank, the fuel tank itself. Permeation does not occur through an identifiable opening; instead individual fuel molecules penetrate (i.e. they effectively mix with) the walls of the various components and eventually find their way to the outside. Fuel permeation is significant only for plastic or elastomeric materials. Fuel permeation rate depends on the material used for the fuel system and on the chemical species contained in the gasoline; in particular, alcohols like methanol and ethanol can increase significantly the permeation rate. A study co-sponsored by the California Air Resources Board (CARB) and Georgia (US)-based Coordinating Research Council was recently carried out with the objective of investigating the effect of gasoline/ethanol blends on permeation [3]. This study has demonstrated that in many cases the permeation rate of ethanol/gasoline blends is higher compared both to non oxygenated gasoline and to MTBE containing gasoline. As follow-up of this work, the CRC began a new testing programme to investigate the influence on permeation rate of several factors and in particular of the ethanol content in the gasoline [28]. The interim report recently published has confirmed the higher permeation rates of the low-level ethanol blends (E6, E10) compared to the base gasoline (E0); however it seems that the permeation rate dose not increase between E6 and E10. - “Running losses” Running losses are those evaporative emissions that occur during normal driving of the vehicle and include both fuel permeation and any breathing loss from the carbon canister. These emissions are not currently regulated in Europe. - Other sources An unintended source of HC emissions may occur from leaks in the system. Leaks may occur in the vapour and/or the liquid system as a result of deterioration and/or faulty service techniques. Examples of deterioration are corrosion of metallic components (e.g., fuel lines, tanks), cracking of rubber hoses, hardening of seals, and mechanical failures. - Refuelling emissions Another important source of evaporative emissions is the refuelling operation. These emissions depend mainly on the fuel vapour pressure and on the design of the nozzle of the fuel dispenser. They can be controlled in two ways. One way is with a so-called “Stage 2” vapour recovery system that recycles emitted fuel vapours to the underground storage tank. This system is used in Europe and was used in some US states. The alternative is an “Onboard Vapour Recovery System” (ORVR), which is essentially a larger carbon canister that can adsorb refuelling vapour. These systems are required in USA.
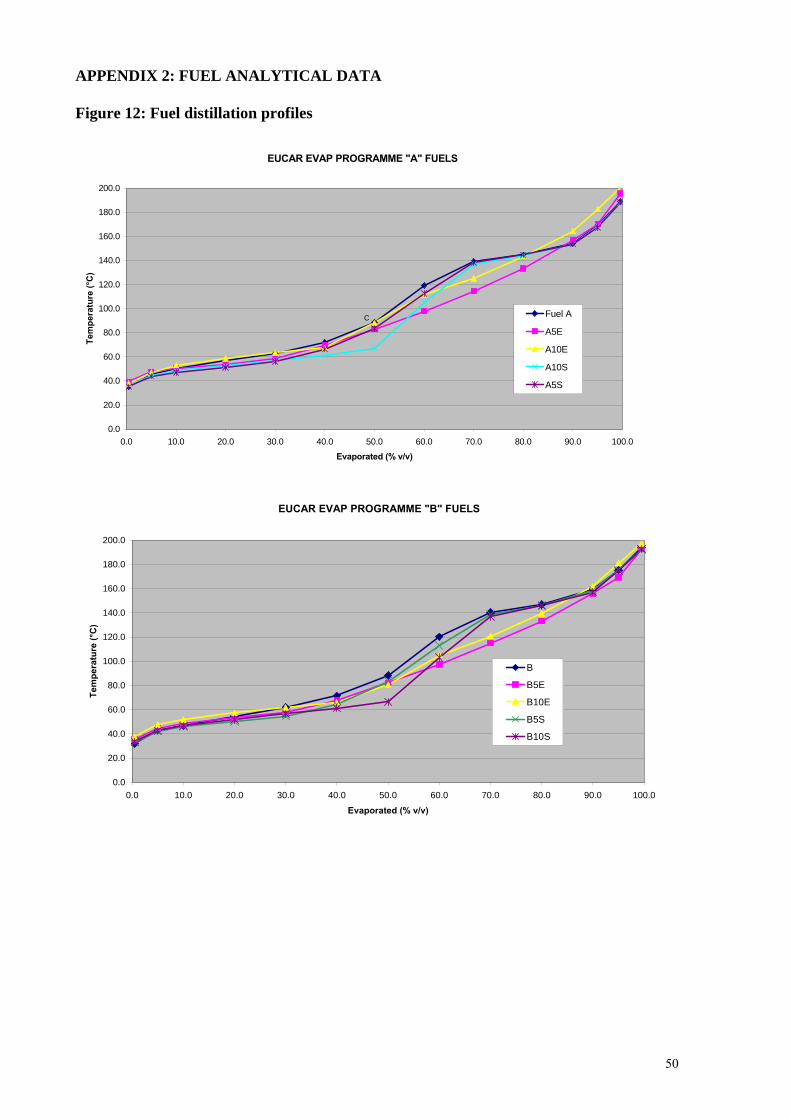
50
APPENDIX 2: FUEL ANALYTICAL DATA Figure 12: Fuel distillation profiles
EUCAR EVAP PROGRAMME "A" FUELS
0.0
20.0
40.0
60.0
80.0
100.0
120.0
140.0
160.0
180.0
200.0
0.0 10.0 20.0 30.0 40.0 50.0 60.0 70.0 80.0 90.0 100.0
Evaporated (% v/v)
Tem
pera
ture
(°C
)
Fuel A
A5E
A10E
A10S
A5S
C
EUCAR EVAP PROGRAMME "B" FUELS
0.0
20.0
40.0
60.0
80.0
100.0
120.0
140.0
160.0
180.0
200.0
0.0 10.0 20.0 30.0 40.0 50.0 60.0 70.0 80.0 90.0 100.0
Evaporated (% v/v)
Tem
pera
ture
(°C
)
B
B5E
B10E
B5S
B10S

51
Table A2.1 Detailed Fuel Properties All distillation properties are mean of three different labs. Aromatics, olefins and ethanol mean of two labs, octane and sulfur one lab only. Fuel name A A5E A10E A5S A10S B B5E B10E B5S B10S
DVPE kPa 60.1 59.7 59.9 67.1 66.8 69.0 69.9 66.5 75.4 75.6E70 % v/v 38.3 40.2 44.6 42.7 51.8 38.9 42.0 46.3 44.0 53.1E100 %v/v 54.7 61.3 54.8 56.6 59.4 54.8 61.8 58.0 56.8 60.0E150 %v/v 87.3 87.2 84.1 87.7 88.5 84.6 87.9 85.5 84.8 85.8IBP (0.5 % v/v) (°C) 35.1 39.2 37.8 35.1 36.4 31.9 35.4 38.1 33.0 33.55 % v/v (°C) 45.5 47.6 46.8 43.9 44.9 43.1 44.6 47.8 42.2 42.510 % v/v (°C) 50.1 50.4 52.9 47.0 48.3 46.9 48.3 51.9 45.8 46.720 % v/v (°C) 56.6 53.8 58.7 51.2 52.5 54.7 53.2 57.3 50.4 52.030 % v/v (°C) 63.1 58.7 63.5 56.1 56.8 62.1 57.9 62.0 54.6 56.740 % v/v (°C) 72.2 69.7 67.5 66.3 61.2 71.6 67.5 66.0 64.5 61.550 % v/v (°C) 88.5 83.0 88.2 83.6 67.1 88.3 82.1 80.8 83.5 66.460 % v/v (°C) 119.3 97.9 111.4 112.6 104.9 120.3 97.5 105.1 113.0 103.170 % v/v (°C) 139.1 114.5 125.1 138.2 136.6 140.3 115.1 120.8 138.9 136.780 % v/v (°C) 144.7 133.5 143.6 144.6 144.0 146.8 133.2 139.5 146.4 145.890 % v/v (°C) 154.0 156.8 164.3 153.6 153.5 159.0 155.6 162.0 158.8 157.195 % v/v (°C) 168.7 170.2 182.7 167.4 168.3 175.3 169.4 181.2 175.7 174.8FBP (99.5 % v/v) °C 189.0 195.6 200.9 188.4 187.9 193.7 192.7 197.3 192.3 192.6Density g/l @15 °C 755.5 747.1 756.0 757.2 758.7 753.3 747.1 750.0 754.3 756.0RON 98.4 97.6 98.4 99.0 100.0 97.8 99.2 98.4 99.0 99.9MON 86.1 85.8 86.0 86.5 86.7 86.1 86.9 86.4 86.3 86.7Sulfur mg/kg 13.0 10.0 12.0 10.0 10.0 11.0 11.0 12.0 10.0 10.0Aromatics %v/v 36.3 29.5 33.8 34.5 32.3 35.2 30.7 31.2 34.0 32.8Olefins %v/v 8.7 9.3 10.8 8.5 8.3 9.1 7.8 10.4 8.7 7.9Ethanol %v/v 0.0 5.0 10.4 4.7 9.7 0.0 5.4 9.9 5.0 10.2Oxygen %m/m 0.00 1.84 3.79 1.71 3.52 0.00 1.97 3.64 1.83 3.70
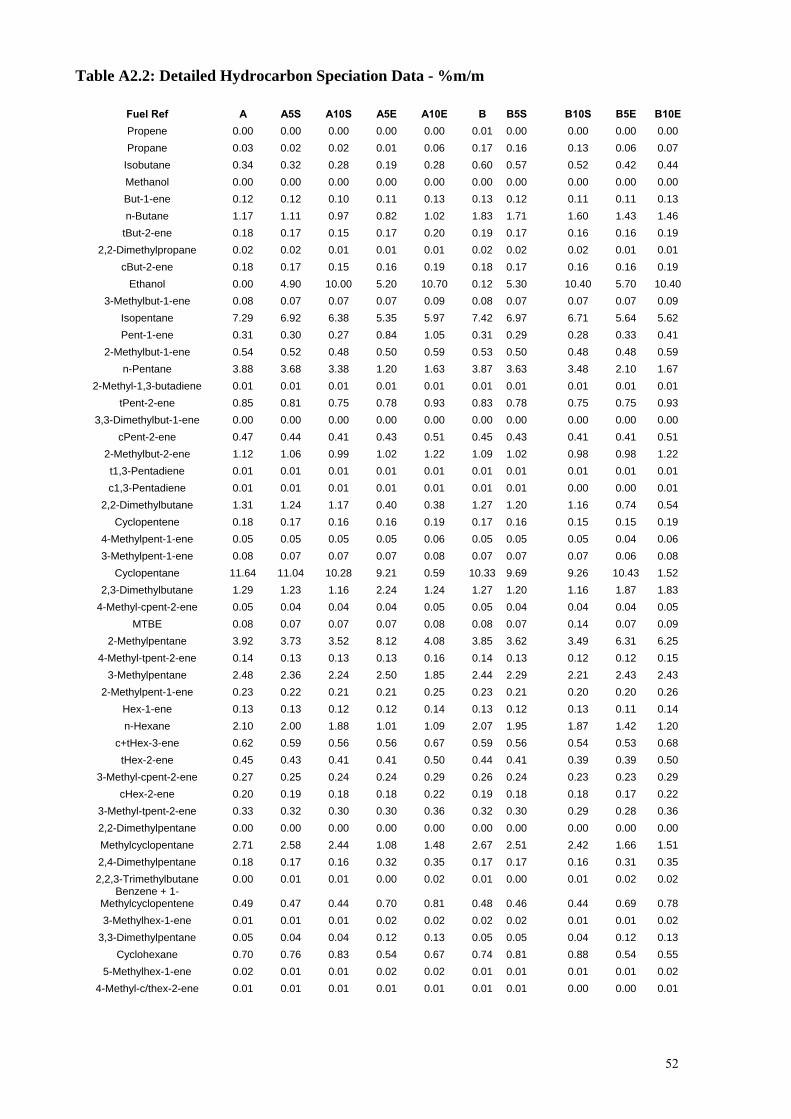
52
Table A2.2: Detailed Hydrocarbon Speciation Data - %m/m
Fuel Ref A A5S A10S A5E A10E B B5S B10S B5E B10EPropene 0.00 0.00 0.00 0.00 0.00 0.01 0.00 0.00 0.00 0.00 Propane 0.03 0.02 0.02 0.01 0.06 0.17 0.16 0.13 0.06 0.07
Isobutane 0.34 0.32 0.28 0.19 0.28 0.60 0.57 0.52 0.42 0.44 Methanol 0.00 0.00 0.00 0.00 0.00 0.00 0.00 0.00 0.00 0.00 But-1-ene 0.12 0.12 0.10 0.11 0.13 0.13 0.12 0.11 0.11 0.13 n-Butane 1.17 1.11 0.97 0.82 1.02 1.83 1.71 1.60 1.43 1.46
tBut-2-ene 0.18 0.17 0.15 0.17 0.20 0.19 0.17 0.16 0.16 0.19 2,2-Dimethylpropane 0.02 0.02 0.01 0.01 0.01 0.02 0.02 0.02 0.01 0.01
cBut-2-ene 0.18 0.17 0.15 0.16 0.19 0.18 0.17 0.16 0.16 0.19 Ethanol 0.00 4.90 10.00 5.20 10.70 0.12 5.30 10.40 5.70 10.40
3-Methylbut-1-ene 0.08 0.07 0.07 0.07 0.09 0.08 0.07 0.07 0.07 0.09 Isopentane 7.29 6.92 6.38 5.35 5.97 7.42 6.97 6.71 5.64 5.62 Pent-1-ene 0.31 0.30 0.27 0.84 1.05 0.31 0.29 0.28 0.33 0.41
2-Methylbut-1-ene 0.54 0.52 0.48 0.50 0.59 0.53 0.50 0.48 0.48 0.59 n-Pentane 3.88 3.68 3.38 1.20 1.63 3.87 3.63 3.48 2.10 1.67
2-Methyl-1,3-butadiene 0.01 0.01 0.01 0.01 0.01 0.01 0.01 0.01 0.01 0.01 tPent-2-ene 0.85 0.81 0.75 0.78 0.93 0.83 0.78 0.75 0.75 0.93
3,3-Dimethylbut-1-ene 0.00 0.00 0.00 0.00 0.00 0.00 0.00 0.00 0.00 0.00 cPent-2-ene 0.47 0.44 0.41 0.43 0.51 0.45 0.43 0.41 0.41 0.51
2-Methylbut-2-ene 1.12 1.06 0.99 1.02 1.22 1.09 1.02 0.98 0.98 1.22 t1,3-Pentadiene 0.01 0.01 0.01 0.01 0.01 0.01 0.01 0.01 0.01 0.01 c1,3-Pentadiene 0.01 0.01 0.01 0.01 0.01 0.01 0.01 0.00 0.00 0.01
2,2-Dimethylbutane 1.31 1.24 1.17 0.40 0.38 1.27 1.20 1.16 0.74 0.54 Cyclopentene 0.18 0.17 0.16 0.16 0.19 0.17 0.16 0.15 0.15 0.19
4-Methylpent-1-ene 0.05 0.05 0.05 0.05 0.06 0.05 0.05 0.05 0.04 0.06 3-Methylpent-1-ene 0.08 0.07 0.07 0.07 0.08 0.07 0.07 0.07 0.06 0.08
Cyclopentane 11.64 11.04 10.28 9.21 0.59 10.33 9.69 9.26 10.43 1.52 2,3-Dimethylbutane 1.29 1.23 1.16 2.24 1.24 1.27 1.20 1.16 1.87 1.83
4-Methyl-cpent-2-ene 0.05 0.04 0.04 0.04 0.05 0.05 0.04 0.04 0.04 0.05 MTBE 0.08 0.07 0.07 0.07 0.08 0.08 0.07 0.14 0.07 0.09
2-Methylpentane 3.92 3.73 3.52 8.12 4.08 3.85 3.62 3.49 6.31 6.25 4-Methyl-tpent-2-ene 0.14 0.13 0.13 0.13 0.16 0.14 0.13 0.12 0.12 0.15
3-Methylpentane 2.48 2.36 2.24 2.50 1.85 2.44 2.29 2.21 2.43 2.43 2-Methylpent-1-ene 0.23 0.22 0.21 0.21 0.25 0.23 0.21 0.20 0.20 0.26
Hex-1-ene 0.13 0.13 0.12 0.12 0.14 0.13 0.12 0.13 0.11 0.14 n-Hexane 2.10 2.00 1.88 1.01 1.09 2.07 1.95 1.87 1.42 1.20
c+tHex-3-ene 0.62 0.59 0.56 0.56 0.67 0.59 0.56 0.54 0.53 0.68 tHex-2-ene 0.45 0.43 0.41 0.41 0.50 0.44 0.41 0.39 0.39 0.50
3-Methyl-cpent-2-ene 0.27 0.25 0.24 0.24 0.29 0.26 0.24 0.23 0.23 0.29 cHex-2-ene 0.20 0.19 0.18 0.18 0.22 0.19 0.18 0.18 0.17 0.22
3-Methyl-tpent-2-ene 0.33 0.32 0.30 0.30 0.36 0.32 0.30 0.29 0.28 0.36 2,2-Dimethylpentane 0.00 0.00 0.00 0.00 0.00 0.00 0.00 0.00 0.00 0.00 Methylcyclopentane 2.71 2.58 2.44 1.08 1.48 2.67 2.51 2.42 1.66 1.51 2,4-Dimethylpentane 0.18 0.17 0.16 0.32 0.35 0.17 0.17 0.16 0.31 0.35 2,2,3-Trimethylbutane 0.00 0.01 0.01 0.00 0.02 0.01 0.00 0.01 0.02 0.02
Benzene + 1-Methylcyclopentene 0.49 0.47 0.44 0.70 0.81 0.48 0.46 0.44 0.69 0.78 3-Methylhex-1-ene 0.01 0.01 0.01 0.02 0.02 0.02 0.02 0.01 0.01 0.02
3,3-Dimethylpentane 0.05 0.04 0.04 0.12 0.13 0.05 0.05 0.04 0.12 0.13 Cyclohexane 0.70 0.76 0.83 0.54 0.67 0.74 0.81 0.88 0.54 0.55
5-Methylhex-1-ene 0.02 0.01 0.01 0.02 0.02 0.01 0.01 0.01 0.01 0.02 4-Methyl-c/thex-2-ene 0.01 0.01 0.01 0.01 0.01 0.01 0.01 0.00 0.00 0.01
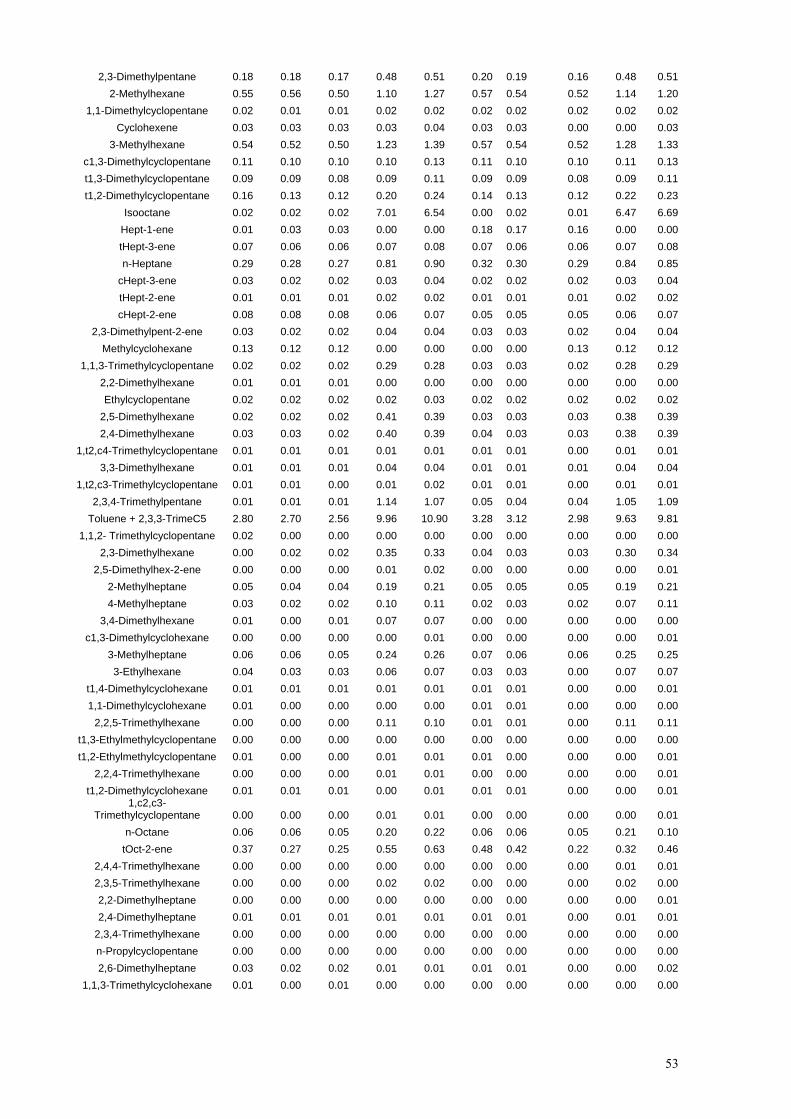
53
2,3-Dimethylpentane 0.18 0.18 0.17 0.48 0.51 0.20 0.19 0.16 0.48 0.51 2-Methylhexane 0.55 0.56 0.50 1.10 1.27 0.57 0.54 0.52 1.14 1.20
1,1-Dimethylcyclopentane 0.02 0.01 0.01 0.02 0.02 0.02 0.02 0.02 0.02 0.02 Cyclohexene 0.03 0.03 0.03 0.03 0.04 0.03 0.03 0.00 0.00 0.03
3-Methylhexane 0.54 0.52 0.50 1.23 1.39 0.57 0.54 0.52 1.28 1.33 c1,3-Dimethylcyclopentane 0.11 0.10 0.10 0.10 0.13 0.11 0.10 0.10 0.11 0.13 t1,3-Dimethylcyclopentane 0.09 0.09 0.08 0.09 0.11 0.09 0.09 0.08 0.09 0.11 t1,2-Dimethylcyclopentane 0.16 0.13 0.12 0.20 0.24 0.14 0.13 0.12 0.22 0.23
Isooctane 0.02 0.02 0.02 7.01 6.54 0.00 0.02 0.01 6.47 6.69 Hept-1-ene 0.01 0.03 0.03 0.00 0.00 0.18 0.17 0.16 0.00 0.00 tHept-3-ene 0.07 0.06 0.06 0.07 0.08 0.07 0.06 0.06 0.07 0.08 n-Heptane 0.29 0.28 0.27 0.81 0.90 0.32 0.30 0.29 0.84 0.85
cHept-3-ene 0.03 0.02 0.02 0.03 0.04 0.02 0.02 0.02 0.03 0.04 tHept-2-ene 0.01 0.01 0.01 0.02 0.02 0.01 0.01 0.01 0.02 0.02 cHept-2-ene 0.08 0.08 0.08 0.06 0.07 0.05 0.05 0.05 0.06 0.07
2,3-Dimethylpent-2-ene 0.03 0.02 0.02 0.04 0.04 0.03 0.03 0.02 0.04 0.04 Methylcyclohexane 0.13 0.12 0.12 0.00 0.00 0.00 0.00 0.13 0.12 0.12
1,1,3-Trimethylcyclopentane 0.02 0.02 0.02 0.29 0.28 0.03 0.03 0.02 0.28 0.29 2,2-Dimethylhexane 0.01 0.01 0.01 0.00 0.00 0.00 0.00 0.00 0.00 0.00 Ethylcyclopentane 0.02 0.02 0.02 0.02 0.03 0.02 0.02 0.02 0.02 0.02
2,5-Dimethylhexane 0.02 0.02 0.02 0.41 0.39 0.03 0.03 0.03 0.38 0.39 2,4-Dimethylhexane 0.03 0.03 0.02 0.40 0.39 0.04 0.03 0.03 0.38 0.39
1,t2,c4-Trimethylcyclopentane 0.01 0.01 0.01 0.01 0.01 0.01 0.01 0.00 0.01 0.01 3,3-Dimethylhexane 0.01 0.01 0.01 0.04 0.04 0.01 0.01 0.01 0.04 0.04
1,t2,c3-Trimethylcyclopentane 0.01 0.01 0.00 0.01 0.02 0.01 0.01 0.00 0.01 0.01 2,3,4-Trimethylpentane 0.01 0.01 0.01 1.14 1.07 0.05 0.04 0.04 1.05 1.09
Toluene + 2,3,3-TrimeC5 2.80 2.70 2.56 9.96 10.90 3.28 3.12 2.98 9.63 9.81 1,1,2- Trimethylcyclopentane 0.02 0.00 0.00 0.00 0.00 0.00 0.00 0.00 0.00 0.00
2,3-Dimethylhexane 0.00 0.02 0.02 0.35 0.33 0.04 0.03 0.03 0.30 0.34 2,5-Dimethylhex-2-ene 0.00 0.00 0.00 0.01 0.02 0.00 0.00 0.00 0.00 0.01
2-Methylheptane 0.05 0.04 0.04 0.19 0.21 0.05 0.05 0.05 0.19 0.21 4-Methylheptane 0.03 0.02 0.02 0.10 0.11 0.02 0.03 0.02 0.07 0.11
3,4-Dimethylhexane 0.01 0.00 0.01 0.07 0.07 0.00 0.00 0.00 0.00 0.00 c1,3-Dimethylcyclohexane 0.00 0.00 0.00 0.00 0.01 0.00 0.00 0.00 0.00 0.01
3-Methylheptane 0.06 0.06 0.05 0.24 0.26 0.07 0.06 0.06 0.25 0.25 3-Ethylhexane 0.04 0.03 0.03 0.06 0.07 0.03 0.03 0.00 0.07 0.07
t1,4-Dimethylcyclohexane 0.01 0.01 0.01 0.01 0.01 0.01 0.01 0.00 0.00 0.01 1,1-Dimethylcyclohexane 0.01 0.00 0.00 0.00 0.00 0.01 0.01 0.00 0.00 0.00
2,2,5-Trimethylhexane 0.00 0.00 0.00 0.11 0.10 0.01 0.01 0.00 0.11 0.11 t1,3-Ethylmethylcyclopentane 0.00 0.00 0.00 0.00 0.00 0.00 0.00 0.00 0.00 0.00 t1,2-Ethylmethylcyclopentane 0.01 0.00 0.00 0.01 0.01 0.01 0.00 0.00 0.00 0.01
2,2,4-Trimethylhexane 0.00 0.00 0.00 0.01 0.01 0.00 0.00 0.00 0.00 0.01 t1,2-Dimethylcyclohexane 0.01 0.01 0.01 0.00 0.01 0.01 0.01 0.00 0.00 0.01
1,c2,c3-Trimethylcyclopentane 0.00 0.00 0.00 0.01 0.01 0.00 0.00 0.00 0.00 0.01
n-Octane 0.06 0.06 0.05 0.20 0.22 0.06 0.06 0.05 0.21 0.10 tOct-2-ene 0.37 0.27 0.25 0.55 0.63 0.48 0.42 0.22 0.32 0.46
2,4,4-Trimethylhexane 0.00 0.00 0.00 0.00 0.00 0.00 0.00 0.00 0.01 0.01 2,3,5-Trimethylhexane 0.00 0.00 0.00 0.02 0.02 0.00 0.00 0.00 0.02 0.00 2,2-Dimethylheptane 0.00 0.00 0.00 0.00 0.00 0.00 0.00 0.00 0.00 0.01 2,4-Dimethylheptane 0.01 0.01 0.01 0.01 0.01 0.01 0.01 0.00 0.01 0.01
2,3,4-Trimethylhexane 0.00 0.00 0.00 0.00 0.00 0.00 0.00 0.00 0.00 0.00 n-Propylcyclopentane 0.00 0.00 0.00 0.00 0.00 0.00 0.00 0.00 0.00 0.00 2,6-Dimethylheptane 0.03 0.02 0.02 0.01 0.01 0.01 0.01 0.00 0.00 0.02
1,1,3-Trimethylcyclohexane 0.01 0.00 0.01 0.00 0.00 0.00 0.00 0.00 0.00 0.00

54
2,5-Dimethylheptane 0.00 0.00 0.00 0.00 0.00 0.00 0.00 0.00 0.00 0.00 3,3-Dimethylheptane 0.01 0.01 0.01 0.02 0.03 0.01 0.01 0.00 0.02 0.03
Ethylbenzene 5.71 5.47 5.23 2.06 2.24 5.23 4.99 4.68 2.06 2.10 1,t2,t4-Trimethylcyclohexane 0.02 0.02 0.02 0.01 0.01 0.01 0.01 0.00 0.00 0.01
m-Xylene 15.71 14.93 14.12 5.10 5.47 14.21 13.60 12.64 5.03 5.14 p-Xylene 5.48 5.26 5.15 1.93 2.15 5.26 4.97 4.76 1.94 2.00
2,3-Dimethylheptane 0.00 0.00 0.00 0.01 0.00 0.00 0.00 0.00 0.00 0.01 3,4-Dimethylheptane 0.00 0.00 0.00 0.01 0.01 0.00 0.00 0.00 0.01 0.01
4-Methyloctane 0.01 0.01 0.02 0.03 0.03 0.01 0.01 0.01 0.03 0.03 2-Methyloctane 0.00 0.00 0.00 0.00 0.00 0.00 0.00 0.00 0.00 0.00
1,t2,c4-Trimethylcyclohexane 0.00 0.00 0.00 0.01 0.01 0.00 0.00 0.00 0.01 0.01 3-Methyloctane 0.03 0.00 0.02 0.04 0.04 0.01 0.01 0.01 0.04 0.04
o-Xylene 5.59 5.34 5.12 2.98 3.27 5.18 4.94 4.64 3.01 3.08 Isobutylcyclopentane 0.01 0.00 0.01 0.01 0.01 0.00 0.00 0.00 0.00 0.01
n-Nonane 0.09 0.09 0.09 0.04 0.05 0.01 0.01 0.01 0.04 0.05 Isopropylbenzene 0.08 0.08 0.07 0.25 0.27 0.09 0.08 0.08 0.25 0.26
3,3-Dimethyloctane 0.01 0.01 0.01 0.01 0.01 0.00 0.00 0.00 0.00 0.00 n-Propylbenzene 0.25 0.25 0.24 0.78 0.86 0.26 0.24 0.23 0.80 0.82 m-Ethyltoluene 0.61 0.58 0.56 1.86 2.07 0.68 0.66 0.62 1.92 1.97 p-Ethyltoluene 0.28 0.27 0.26 0.83 0.93 0.31 0.30 0.28 0.86 0.88
1,3,5-Trimethylbenzene 0.29 0.28 0.27 0.75 0.84 0.32 0.30 0.29 0.77 0.79 o-Ethyltoluene 0.27 0.25 0.24 0.79 0.88 0.31 0.30 0.28 0.82 0.84
1,2,4-Trimethylbenzene 1.29 1.23 1.20 3.01 3.35 1.47 1.40 1.33 3.09 3.18 n-Decane 0.28 0.27 0.26 0.10 0.24 0.08 0.08 0.08 0.10 0.18
1,2,3-Trimethylbenzene 0.46 0.44 0.43 0.89 0.99 0.55 0.52 0.49 0.91 0.94 Indane 0.15 0.14 0.14 0.22 0.25 0.17 0.17 0.15 0.23 0.24
o-Isopropyltoluene 0.03 0.03 0.02 0.09 0.09 0.03 0.03 0.03 0.08 0.09 1,3-Diethylbenzene 0.11 0.10 0.10 0.16 0.17 0.13 0.12 0.11 0.16 0.16 m-n-Propyltoluene 7.48 7.00 6.74 2.18 2.34 8.20 7.86 7.22 1.94 2.17
n-Butylbenzene 0.35 0.33 0.32 0.50 0.56 0.40 0.38 0.36 0.51 0.53 1,3-Dimethyl-5-ethylbenzene 0.32 0.30 0.29 0.37 0.42 0.38 0.36 0.34 0.38 0.39
o-n-Propyltoluene 0.26 0.25 0.24 0.31 0.34 0.32 0.30 0.28 0.31 0.32 1,3-Dimethyl-4-ethylbenzene 0.25 0.23 0.23 0.27 0.30 0.30 0.29 0.27 0.28 0.29 1,2-Dimethyl-4-ethylbenzene 0.48 0.45 0.44 0.49 0.55 0.58 0.54 0.52 0.50 0.51
n-Undecane 0.07 0.07 0.07 0.38 0.93 0.36 0.33 0.31 0.04 0.68 1,2,4,5-Tetramethylbenzene 0.31 0.29 0.29 0.25 0.29 0.38 0.36 0.34 0.26 0.27 1,2,3,5-Tetramethylbenzene 0.45 0.43 0.41 0.37 0.41 0.55 0.52 0.49 0.37 0.39
1,3-Di-isopropylbenzene 0.01 0.01 0.02 0.01 0.01 0.01 0.01 0.02 0.01 0.01 1,2-Di-isopropylbenzene 0.60 0.57 0.54 0.85 1.21 0.79 0.76 0.70 0.65 1.03
Naphthalene 0.29 0.28 0.27 0.25 0.28 0.36 0.35 0.33 0.26 0.27 n-Dodecane 0.04 0.04 0.04 0.38 0.88 0.33 0.32 0.30 0.03 0.66
2-Methylnaphthalene 0.05 0.05 0.04 0.11 0.12 0.06 0.05 0.05 0.11 0.11 1-Methylnaphthalene 0.02 0.02 0.02 0.06 0.07 0.03 0.03 0.02 0.06 0.06
TOTAL 99.99 99.99 99.99 99.99 99.99 99.99 99.99 99.99 99.99 99.99Density 755.5 757.2 758.7 747.1 756.0 753.3 754.3 756.0 747.1 750.0
% m/m Carbon 87.48 85.75 83.99 85.09 83.50 87.39 85.58 83.74 84.90 83.38% m/m Hydrogen 12.50 12.52 12.51 13.08 12.75 12.55 12.56 12.61 13.10 12.98
%m/m Oxygen 0.01 1.72 3.49 1.82 3.74 0.06 1.86 3.64 2.00 3.63 LHV MJ/kg (calc from HC) 42.80 42.05 41.24 42.29 41.25 42.81 42.00 41.22 42.23 41.41
LHV MJ/litre 32.34 31.83 31.29 31.60 31.18 32.24 31.68 31.16 31.55 31.06Fuel Ref A A5S A10S A5E A10E B B5S B10S B5E B10E
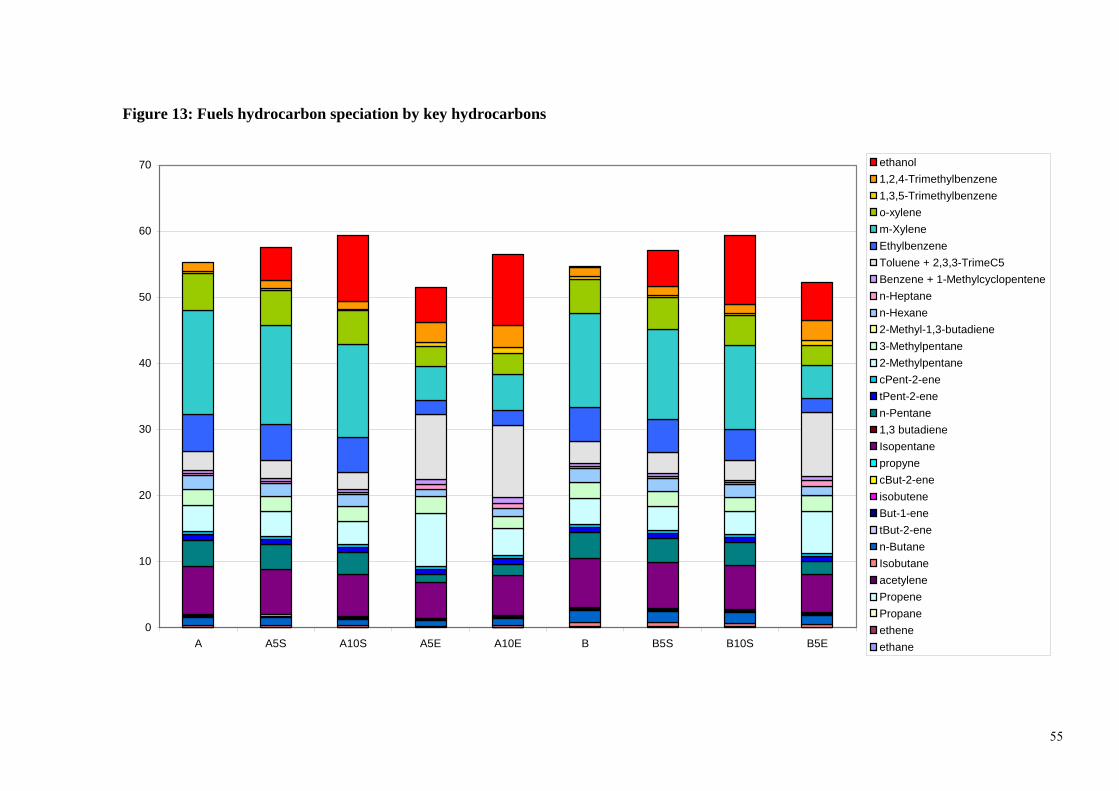
55
Figure 13: Fuels hydrocarbon speciation by key hydrocarbons
0
10
20
30
40
50
60
70
A A5S A10S A5E A10E B B5S B10S B5E
ethanol1,2,4-Trimethylbenzene1,3,5-Trimethylbenzeneo-xylenem-XyleneEthylbenzeneToluene + 2,3,3-TrimeC5Benzene + 1-Methylcyclopentenen-Heptanen-Hexane2-Methyl-1,3-butadiene3-Methylpentane2-MethylpentanecPent-2-enetPent-2-enen-Pentane1,3 butadieneIsopentanepropynecBut-2-eneisobuteneBut-1-enetBut-2-enen-ButaneIsobutaneacetylenePropenePropaneetheneethane

56
APPENDIX 3: DETAILS OF TEST PROCEDURE. Both the limit and the detailed measurement procedure for evaporative emissions are laid down in the Directive of the European Parliament and the Council no. 98/69/EC. The evaporative emission test (Type IV) is designed to determine hydrocarbon evaporative emissions as a consequence of diurnal temperatures fluctuation and hot soaks during parking after urban driving. The test consists of these phases (see Fig. 14):
— test preparation (canister and vehicle conditioning) — hot soak loss determination (Hot Soak test). — diurnal loss determination (Diurnal test).
Evaporative emissions are measured using a gas-tight chamber (VT SHED) able to contain the vehicle under test. The VOC concentration inside the chamber is monitored by means of a FID analyzer. The mass emissions of hydrocarbons from the hot soak and the diurnal loss phases are added up to provide an overall result for the test. The Hot Soak test simulates the condition of a vehicle parked after having been driven for a certain distance. At the end of the conditioning drive (one NEDC driving cycle + one urban driving cycle) the vehicle is then pushed into the measuring chamber. The engine must be turned off before any part of the vehicle enters the measuring chamber. The test lasts 60 minutes and the temperature must not be less than 296 °K (23 °C) and more than 304 °K (31 °C) during the 60-minute hot soak period. The Diurnal test lasts instead 24 hours and simulates the situation of a vehicle parked for one day and one night in the summer period; the temperature in the VT SHED is varied according to a profile defined by the Directive to ideally reflect the fluctuations occurring during day and night time. The starting temperature is 20 °C while the maximum value is 35 °C, reached after 12 hours. Then, during the subsequent 12 hours the temperature decreases slowly and goes back to 20 °C again. The final result of the test is given by the sum of the emissions measured during the Hot Soak and the Diurnal tests. The European limit for evaporative emissions (Hot Soak + Diurnal) is currently 2 grammes/test (Directive 70/220/EC and subsequent amendments).

57
Figure 14 : Standard EU Evaporative Emissions Test Procedure (EU Directive 98-69-EC)
58
Detailed Test Procedure for this Programme The whole programme was carried out in the VELA laboratory of the Joint Research Centre located in Ispra (Italy). The JRC’s VT SHED used for this programme complies with the 98/69/EC and EPA requirements. The measuring chamber is a fixed-volume type one. Volume compensation is achieved by continuous withdrawal of internal atmosphere and re-filling with ambient air. Outgoing and incoming flows are controlled by means of mass flow controllers. Vehicle preparation The vehicle was mechanically prepared before the test as follows:
— The exhaust system of the vehicle was checked for any leaks — The engine was checked for any leaks of the gasoline/lubricant circuit. — The ageing (minimum 3 000 km) of the canister was verified. When the mileage
accumulated by the canister was less than 3000 km, the vehicle was driven on the road to reach this target value.
— When necessary, the vehicle was cleaned before the test. — When necessary, additional fittings, adapters or devices were fitted to the fuel system
in order to allow a complete draining of the fuel tank. In general, the draining of the tank was accomplished by means of the vehicle fuel pump.
— When possible, the engine was equipped with suitable thermocouples to monitor the lubricant and coolant temperature.
— When possible, a thermocouple was fitted to the tank in order to monitor gasoline (liquid) temperature. In some case, an additional thermocouple was used to monitor vapour temperature in the volume of the tank above the liquid surface.
Canister load to breakthrough According to the legislation, canister load to breakthrough can be accomplished using normal fuel by means of repeated heat builds or using butane. The second option was chosen. The canister was loaded with a mixture composed of 50 % butane and 50 % nitrogen by volume at a rate of 40 grams butane per hour. Two flow-meters, calibrated with a special equipment (rotameter), were used to accurately set the required flow. Breakthrough was determined using an auxiliary carbon canister connected downstream of the vehicle’s canister. In the legislative procedure the breakthrough is defined as the point corresponding to an increase of 2.0 grams of the auxiliary canister. The auxiliary canister was purged with dry air prior to start the butane loading of the main canister. As soon as the canister reached breakthrough, the nitrogen and butane lines were immediately shut off. The evaporative emission canister was then reconnected to the fuel system of the vehicle.

59
In order to accomplish the butane loading of the canister and to simplify the disconnection and connection of the canister itself, this was removed from the vehicle and equipped with special quick release connectors incorporating automatic shut-off valves. Special care was taken during this step to avoid damage to the components and the integrity of the fuel system. Canister weight The weight of the vehicle carbon canister was measured and recorded before and after the main steps prescribed by the legislative test procedure. In particular, the following weights were recorded:
1 Initial weight of vehicle canister before saturation with N2/Butane
2 Final weight of vehicle canister after saturation with N2/Butane (at breakthrough)
3 Final weight of vehicle canister after the preconditioning cycle UDC+2EUDC
4 Weight of vehicle canister before conditioning drive (after pause > 12 hours)
5 Final weight of vehicle canister after conditioning drive (emissions cycle UDC+EUDC+UDC)
6 Weight of vehicle canister before the UDC-Diurnal 24h test
7 Weight of vehicle canister after the Diurnal 24h test
The automatic shut-off valves fitted to the lines connecting the carbon canister to the fuel system allowed to perform weighing operation without significant loss of vapour from the fuel system itself. The complete set of canister weights mentioned above is not available for all the tests performed on the first two vehicles as the automatic shut-off valves were adopted only after a few tests had been already carried out. Vehicle conditioning (Roller bench)
Fuel drain and refill The tank of the vehicle was emptied using the fuel pump located in the tank. This was done taking care not to abnormally purge or abnormally load the evaporative control canister fitted to the tank. Removal of the fuel cap is normally sufficient to achieve this. After the butane loading of the canister and after it had been reconnected to the fuel system, the tank was refilled with test fuel at a temperature of about 287 °K (14 °C) to 40 ± 2 % of the tank’s normal volumetric capacity. The fuel cap of the vehicle was fitted at this point. Preconditioning drive

60
Within one hour from the completing of canister loading the vehicle was placed on the chassis dynamometer and driven through one Part One and two Part Two driving cycles of Type I test (NEDC cycle). Exhaust emissions were not sampled during this operation. Soak (before Hot Soak test) Within five minutes of completing the preconditioning drive, the vehicle was driven off the chassis dynamometer and parked in the soak area. The vehicle was left parked for a minimum of 12 hours and a maximum of 36 hours. In most of the cases the soak period lasted about 14-16 hours. Emission test After conclusion of the soak period the vehicle was driven through a complete Type I test drive (cold start urban and extra urban test). Then the engine was shut off. Exhaust emissions were measured during this operation. In addition to the regulated emissions, a sample of the diluted exhaust gas was taken to determine the speciation of unburned HC and aldehydes. Conditioning drive Within two minutes of completing the Type I test, the vehicle was driven a further conditioning drive consisting of one urban test cycle (hot start) of a Type I test. Then the engine was shut off again. Exhaust emissions were not sampled during this operation.
Hot soak evaporative emissions test
— VT SHED conditioning The ambient temperature of the VT SHED was set at a temperature of 300 ± 1 °K Before the completion of the conditioning drive the measuring chamber was purged for several minutes with ambient air. The hydrocarbon analyzer was zeroed and spanned immediately prior to the test. — Hot soak test At the end of the conditioning drive the vehicle was pushed out from the chassis dynamometer cell with the engine idling. The vehicle was then pushed into the measuring chamber with the engine switched off. The enclosure door had to be closed and gas-tight sealed within two minutes of the engine being switched off and within seven minutes of the end of the conditioning drive. The vehicle’s windows and luggage compartments were opened just before this stage, if not already opened. The start of a 60 ± 0.5 minute hot soak period began when the chamber was sealed. The hydrocarbon concentration, temperature and barometric pressure were measured to give the initial readings for the hot soak test. These figures are used in the evaporative emission calculation. The ambient SHED temperature was kept constant at a temperature of about 300 °K during the 60-minute hot soak period. Hydrocarbon concentration was measured and recorded every minute. The hydrocarbon analyzer was zeroed and spanned immediately before the end of the 60 ± 0.5 minute test period and then the final hydrocarbon concentration in the chamber was measured.

61
Soak (after Hot Soak test) At the end of the Hot Soak test, the VT SHED was opened and purged in order to reach equilibrium with the ambient air. The temperature of the VT SHED was then set to 293 °K ± 2 °K (20 °C ± 2 °C) and the vehicle left into the VT SHED itself for not less than 6 hours and not more than 36. In this programme, in all the cases except when explicitly said, the soak period lasted about 6-7 hours.
Diurnal test The test vehicle was exposed to one cycle of ambient temperature according to the profile specified in Appendix 2 of the Directive 98/69/EC with a maximum deviation of ± 2 °K at any time.
— VT SHED conditioning The measuring chamber was purged for several minutes immediately prior to the star of the Diurnal test.
— Diurnal test The mixing fans of the VT SHED were adjusted in such a way as to maintain a minimum air circulation of 8 km/h under the fuel tank of the test vehicle. The hydrocarbon analyser was zeroed and spanned immediately before the test. The enclosure doors were then closed and gas-tight sealed. Within 10 minutes of closing and sealing the doors, the hydrocarbon concentration, temperature and barometric pressure were measured to give the initial readings for the diurnal test. Hydrocarbon concentration was measured and recorded every minute during the whole test. The hydrocarbon analyser was zeroed and spanned immediately before the end of the test and the final hydrocarbon concentration measured after 24 hours ± 6 minutes after the beginning of the initial reading.
HC Speciation A Tedlar bag was filled with a sample of the internal atmosphere of the chamber at the start and at the end of each Diurnal test. The sample was taken by means of a sample probe located very close to the one used to measure, with the FID, the hydrocarbon concentration in the chamber. The sample was then analyzed using a GC.
62
APPENDIX 4: EVAPORATIVE EMISSIONS AND TEST PROTOCOL RELATED EFFECTS
Canister Conditioning and Canister Weights As laid down in the legislated test procedure (see Appendix 3), the carbon canister of each test vehicle was conditioned before each evaporative emission test following the butane loading procedure, one of the two alternative procedures permitted. Canisters were loaded to breakthrough with a mixture of butane (50%) and nitrogen (50%). The weight of the canister was recorded before and after the butane loading operation to monitor the behaviour of the canister itself. An unexpected result of this test programme was the fact that, for a given canister, the breakthrough condition did not correspond to a constant canister weight. The initial weight of the canister at the beginning of the butane loading operation is very close to the weight recorded at the end of the previous test, as nothing was done to the vehicle or canister between these two steps. Thus the initial weight progressively increased, reflecting the same pattern as the canister weight recorded at the end of each evaporative test. As expected, the amount of butane loaded into the canister generally decreased with increasing initial weight, as illustrated in Figure 15, due to a reduced working capacity of the canister caused by the higher mass of residual HC vapour in the carbon. However canister weight recorded after reaching breakthrough also increased noticeably, especially after the first test, and stabilized only after a certain number of tests as shown in Fig. 3. In other words, low initial canister weights resulted, once breakthrough had been reached, in low final canister weights. The reason that breakthrough weight was not constant could be due to a combination of factors. The progressively increasing canister hydrocarbon loading having a high molecular weight could be one reason. This will have a higher mass than an equivalent amount of butane in the canister pores. Furthermore, adsorption is an exothermic process as demonstrated by the fact that during butane loading the canister surface becomes warm. The temperature increase of the activated carbon bed depends on the amount of butane adsorbed and therefore, when more butane is adsorbed the temperature will be higher. The adsorption capacity of active carbon is known to be lower at higher temperatures.
Hot Soak Test The hot Soak test is meant to measure evaporative emissions from a vehicle in a condition simulating the situation in which the vehicle is driven for a certain distance and then parked on a warm day. For this reason, before starting the Hot Soak test the vehicle is conditioned by driving it over a complete New European Driving Cycle (NEDC) followed by an additional urban driving cycle. As a result of this conditioning drive, the engine is still hot when the test vehicle is pushed into the VT SHED as shown in Figure 16 where, as an example, a lubricant temperature profile recorded during Hot Soak test is plotted for each vehicle.

63
Figure 15: Gain in canister weight (mass of butane loaded) during N2/Butane saturation
VEHICLE 1
0
5
10
15
20
25
30
Fuel A Fuel B FuelA5S
FuelB5S
Fuel A FuelA10S
FuelB10S
Fuel A FuelA10E
FuelB10E
FuelB10E
Fuel A FuelA5E
FuelB5E
Fuel B Fuel B
Wei
ght g
ain,
g
820
840
860
880
900
920
940
Can
iste
r wei
ght,
g
Gain in canister weightInitial canister weightFinal canister weight
VEHICLE 2
0
5
10
15
20
25
30
Fuel A Fuel B Fuel B FuelA5S
FuelB5S
Fuel A Fuel A FuelA10S
FuelB10S
Fuel A FuelA10S
FuelB10S
Fuel A
Wei
ght g
ain,
g
820
830
840
850
860
870
880
890
900
910
920
Can
iste
r wei
ght,
g
Gain in canister weightInitial canister weightFinal canister weigth
VEHICLE 3
0
10
20
30
40
50
60
70
Fuel A Fuel B FuelA5S
FuelB5S
Fuel A Fuel A FuelB5S
Fuel B FuelB5S
FuelA5E
FuelB5E
Fuel A FuelA5S
FuelB5S
Wei
ght g
ain,
g
520
540
560
580
600
620
640
660
680
Can
iste
r wei
ght,
g
Gain in canister weightInitial canister weightFinal canister weight
ExtPg ExtPg ExtPg
VEHICLE 4
0
10
20
30
40
50
60
Fuel A Fuel B FuelA5S
FuelB5S
FuelA5S
Fuel A FuelB5S
FuelB5S
FuelA5E
FuelB5E
FuelB10E
FuelA10E
Fuel A Fuel B FuelA10S
FuelB10S
FuelB5S
Wei
ght g
ain,
g
450
500
550
600
650
700
750
Can
iste
r wei
ght,
g
Gain in canister weightInitial canister weightFinal canister weightExtPg ExtPg
VEHICLE 5
0
5
10
15
20
25
Fuel A Fuel B FuelA5S
FuelB5S
Fuel A FuelA5E
FuelB5E
Fuel A FuelB10S
FuelB10E
Fuel A FuelA5S
FuelB5S
Fuel B Fuel A
Wei
ght g
ain,
g
580
600
620
640
660
680
700
720
Can
iste
r wei
ght,
g
Gain in canister weightInitial canister weightFinal canister weight
VEHICLE 6
0
5
10
15
20
25
30
35
40
45
Fuel A Fuel B Fuel A5S Fuel A5S Fuel B5S Fuel A Fuel A5S FuelA10S
FuelA10S
FuelB10S
Fuel A5E Fuel B5E Fuel A
Wei
ght g
ain,
g
560
580
600
620
640
660
680
700
720
740
Can
iste
r wei
ght,
g
Gain in canister weightInitial canister weightFinal canister weight
VEHICLE 7
0
10
20
30
40
50
60
Fuel A Fuel A Fuel B Fuel B Fuel A5S Fuel B5S Fuel A5S Fuel B10S Fuel A
Wei
ght g
ain,
g
2600
2620
2640
2660
2680
2700
2720
2740
Can
iste
r wei
ght,
g
Gain in canister weightInitial canister weightFinal canister weight

64
In case of a vehicle equipped with a fuel system featuring fuel return, the temperature of gasoline in the tank could be well higher than the ambient temperature due to heated gasoline returning to the tank. Two vehicles of the test fleet used in this programme had a fuel return (vehicles 1 and 7). It was possible to monitor the fuel temperature only in the case of vehicle 1; as shown in Fig. 16, in this case the fuel return did not influence significantly the temperature of the gasoline in the tank. Figure 16: Typical gasoline and engine lubricant temperature profiles during the Hot Soak test (not available for vehicle 7)
HOT SOAK TESTGasoline in Tank: Temperature Profile
0
5
10
15
20
25
30
35
0 10 20 30 40 50 60 70Time (min)
Tem
pera
ture
(C) Vehicle 1
Vehicle 2Vehicle 3Vehicle 4Vehicle 5Vehicle 6
HOT SOAK TESTLubricant Temperature Profile
0
20
40
60
80
100
120
0 10 20 30 40 50 60 70Time (min)
Tem
pera
ture
(C) Vehicle 1
Vehicle 2Vehicle 3Vehicle 4Vehicle 5Vehicle 6
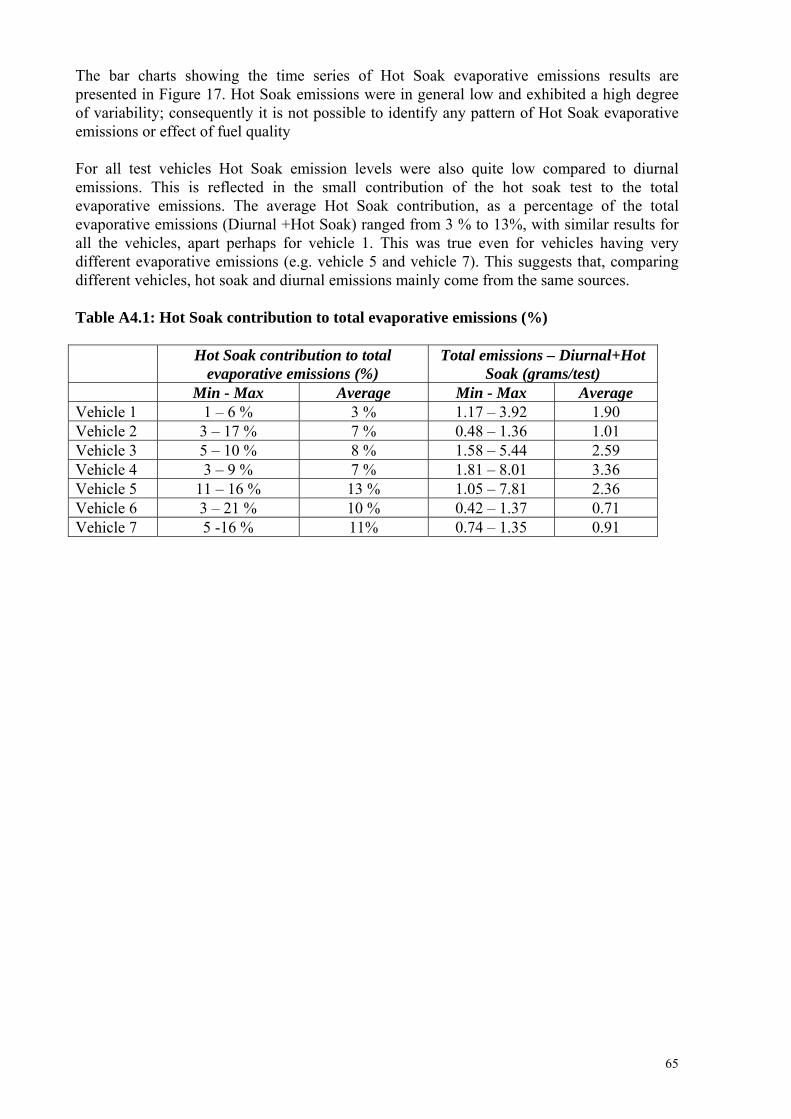
65
The bar charts showing the time series of Hot Soak evaporative emissions results are presented in Figure 17. Hot Soak emissions were in general low and exhibited a high degree of variability; consequently it is not possible to identify any pattern of Hot Soak evaporative emissions or effect of fuel quality For all test vehicles Hot Soak emission levels were also quite low compared to diurnal emissions. This is reflected in the small contribution of the hot soak test to the total evaporative emissions. The average Hot Soak contribution, as a percentage of the total evaporative emissions (Diurnal +Hot Soak) ranged from 3 % to 13%, with similar results for all the vehicles, apart perhaps for vehicle 1. This was true even for vehicles having very different evaporative emissions (e.g. vehicle 5 and vehicle 7). This suggests that, comparing different vehicles, hot soak and diurnal emissions mainly come from the same sources. Table A4.1: Hot Soak contribution to total evaporative emissions (%) Hot Soak contribution to total
evaporative emissions (%) Total emissions – Diurnal+Hot
Soak (grams/test) Min - Max Average Min - Max Average Vehicle 1 1 – 6 % 3 % 1.17 – 3.92 1.90 Vehicle 2 3 – 17 % 7 % 0.48 – 1.36 1.01 Vehicle 3 5 – 10 % 8 % 1.58 – 5.44 2.59 Vehicle 4 3 – 9 % 7 % 1.81 – 8.01 3.36 Vehicle 5 11 – 16 % 13 % 1.05 – 7.81 2.36 Vehicle 6 3 – 21 % 10 % 0.42 – 1.37 0.71 Vehicle 7 5 -16 % 11% 0.74 – 1.35 0.91
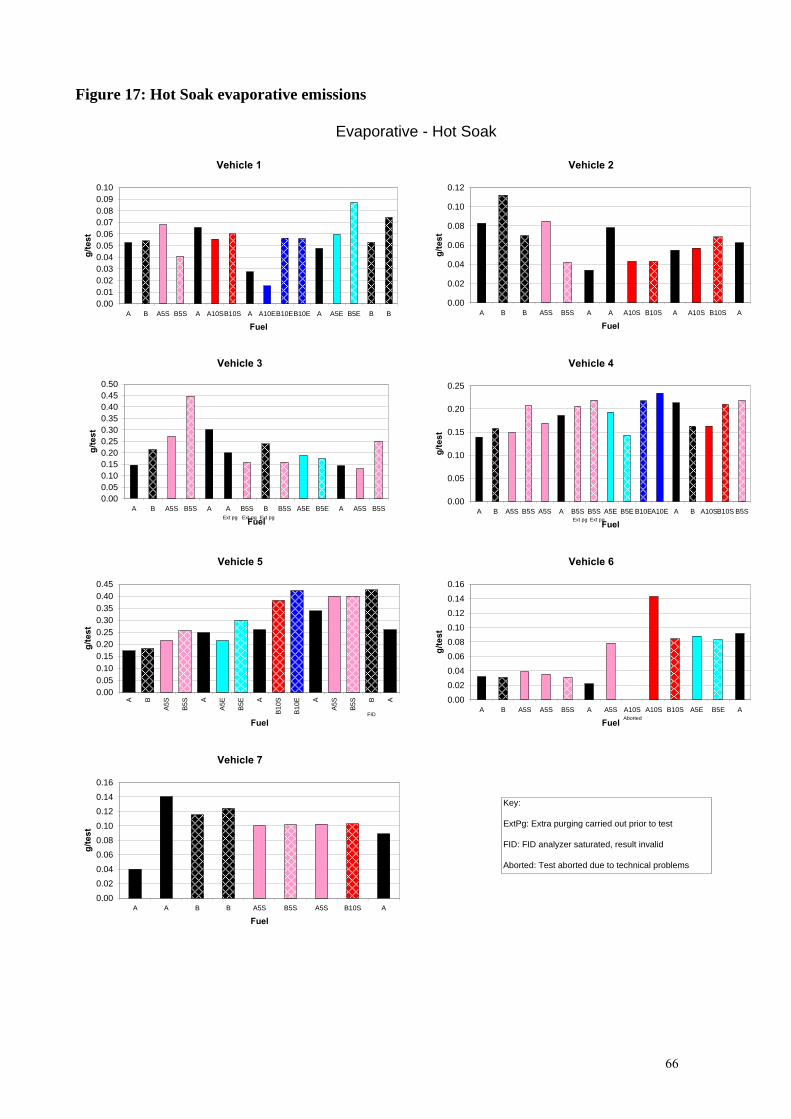
66
Figure 17: Hot Soak evaporative emissions
Evaporative - Hot Soak
Vehicle 1
0.000.010.020.030.040.050.060.070.080.090.10
A B A5S B5S A A10SB10S A A10EB10EB10E A A5E B5E B B
Fuel
g/te
st
Vehicle 2
0.00
0.02
0.04
0.06
0.08
0.10
0.12
A B B A5S B5S A A A10S B10S A A10S B10S A
Fuel
g/te
st
Vehicle 3
0.000.050.100.150.200.250.300.350.400.450.50
A B A5S B5S A A B5S B B5S A5E B5E A A5S B5S
Fuel
g/te
st
Vehicle 4
0.00
0.05
0.10
0.15
0.20
0.25
A B A5S B5S A5S A B5S B5S A5E B5E B10EA10E A B A10SB10S B5S
Fuel
g/te
st
Ext pgExt pg Ext pg Ext pg Ext pg
Vehicle 5
0.000.050.100.150.200.250.300.350.400.45
A B
A5S
B5S A
A5E
B5E A
B10
S
B10
E A
A5S
B5S B A
Fuel
g/te
st
FID
Vehicle 6
0.00
0.020.04
0.060.080.10
0.120.14
0.16
A B A5S A5S B5S A A5S A10S A10S B10S A5E B5E A
Fuel
g/te
st
Aborted
Vehicle 7
0.00
0.020.04
0.060.080.10
0.120.14
0.16
A A B B A5S B5S A5S B10S A
Fuel
g/te
st
Key:
ExtPg: Extra purging carried out prior to test
FID: FID analyzer saturated, result invalid
Aborted: Test aborted due to technical problems

67
Diurnal Test During Diurnal tests VT SHED temperature is varied between 20 and 35 °C to simulate ambient temperature fluctuations occurring during a typical summer day. The Diurnal test has to be started at least 6 hours and maximum 36 hours after the end of Hot Soak test to allow cooling down of test vehicle. In this programme, after the Hot Soak test the vehicles were left inside the VT SHED at a temperature of 20 °C for 6-7 hours. This period of time was always sufficient to cool the vehicles down to 20 °C that was, in all cases, the initial temperature of the lubricant and of the gasoline in the tank at the start of the Diurnal test. The temperature profile of the Diurnal test is specified in the Directive 98/69/EC; the maximum temperature of 35 °C is reached after 12 hours, then the temperature starts decreasing. The temperature profile of Diurnal test is plotted in Figure 18. Gasoline temperature does not follow the same temperature profile of the air contained in the VT SHED. In fact, the tank is filled with a volume of gasoline corresponding to 40% of the tank capacity that means typically about 20-30 litres of gasoline. Gasoline in the tank has a certain thermal inertia and therefore its temperature increases more slowly compared to ambient temperature. This also means that the maximum temperature reached by gasoline is lower than 35 °C (usually 1-2 °C lower). This behaviour is shown in Fig. 18 where the temperature profile of the air in the VT SHED and of the gasoline in the vehicle tank is plotted over the Diurnal test duration. The gasoline temperature profile over the diurnal test resulted very similar for all the vehicles. Figure 18: Typical temperature profiles of gasoline vs. Diurnal test temperature profile (not available for vehicle 7)
Diurnal TestGasoline Temperature vs Shed Temperature
0
5
10
15
20
25
30
35
40
0 200 400 600 800 1000 1200 1400Time (min)
Tem
pera
ture
(C)
Vehicle 1Vehicle 2Vehicle 3Vehicle 4Vehicle 5Vehicle 6Temperature Profile
The VOC concentration profiles over time for all the test vehicles and for the extreme fuels in terms of DVPE (fuel A and Fuel B5S) are shown in Fig. 19. The plots show that the Diurnal
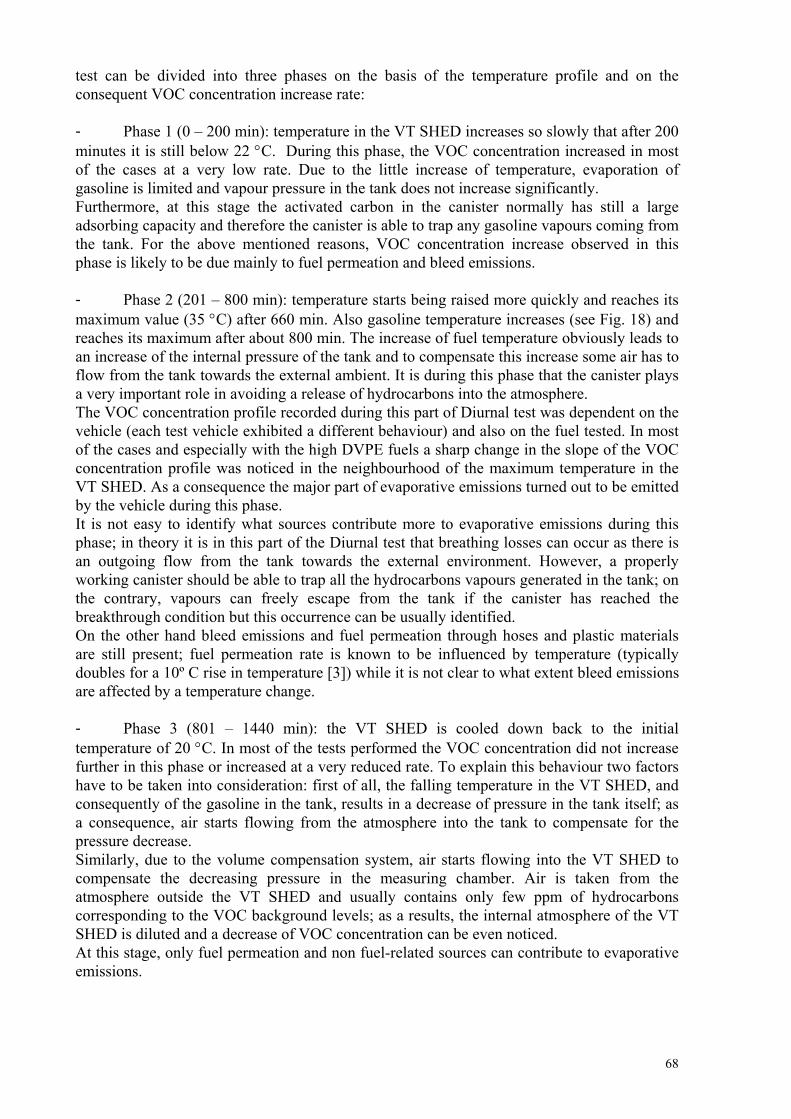
68
test can be divided into three phases on the basis of the temperature profile and on the consequent VOC concentration increase rate: - Phase 1 (0 – 200 min): temperature in the VT SHED increases so slowly that after 200 minutes it is still below 22 °C. During this phase, the VOC concentration increased in most of the cases at a very low rate. Due to the little increase of temperature, evaporation of gasoline is limited and vapour pressure in the tank does not increase significantly. Furthermore, at this stage the activated carbon in the canister normally has still a large adsorbing capacity and therefore the canister is able to trap any gasoline vapours coming from the tank. For the above mentioned reasons, VOC concentration increase observed in this phase is likely to be due mainly to fuel permeation and bleed emissions. - Phase 2 (201 – 800 min): temperature starts being raised more quickly and reaches its maximum value (35 °C) after 660 min. Also gasoline temperature increases (see Fig. 18) and reaches its maximum after about 800 min. The increase of fuel temperature obviously leads to an increase of the internal pressure of the tank and to compensate this increase some air has to flow from the tank towards the external ambient. It is during this phase that the canister plays a very important role in avoiding a release of hydrocarbons into the atmosphere. The VOC concentration profile recorded during this part of Diurnal test was dependent on the vehicle (each test vehicle exhibited a different behaviour) and also on the fuel tested. In most of the cases and especially with the high DVPE fuels a sharp change in the slope of the VOC concentration profile was noticed in the neighbourhood of the maximum temperature in the VT SHED. As a consequence the major part of evaporative emissions turned out to be emitted by the vehicle during this phase. It is not easy to identify what sources contribute more to evaporative emissions during this phase; in theory it is in this part of the Diurnal test that breathing losses can occur as there is an outgoing flow from the tank towards the external environment. However, a properly working canister should be able to trap all the hydrocarbons vapours generated in the tank; on the contrary, vapours can freely escape from the tank if the canister has reached the breakthrough condition but this occurrence can be usually identified. On the other hand bleed emissions and fuel permeation through hoses and plastic materials are still present; fuel permeation rate is known to be influenced by temperature (typically doubles for a 10º C rise in temperature [3]) while it is not clear to what extent bleed emissions are affected by a temperature change. - Phase 3 (801 – 1440 min): the VT SHED is cooled down back to the initial temperature of 20 °C. In most of the tests performed the VOC concentration did not increase further in this phase or increased at a very reduced rate. To explain this behaviour two factors have to be taken into consideration: first of all, the falling temperature in the VT SHED, and consequently of the gasoline in the tank, results in a decrease of pressure in the tank itself; as a consequence, air starts flowing from the atmosphere into the tank to compensate for the pressure decrease. Similarly, due to the volume compensation system, air starts flowing into the VT SHED to compensate the decreasing pressure in the measuring chamber. Air is taken from the atmosphere outside the VT SHED and usually contains only few ppm of hydrocarbons corresponding to the VOC background levels; as a results, the internal atmosphere of the VT SHED is diluted and a decrease of VOC concentration can be even noticed. At this stage, only fuel permeation and non fuel-related sources can contribute to evaporative emissions.
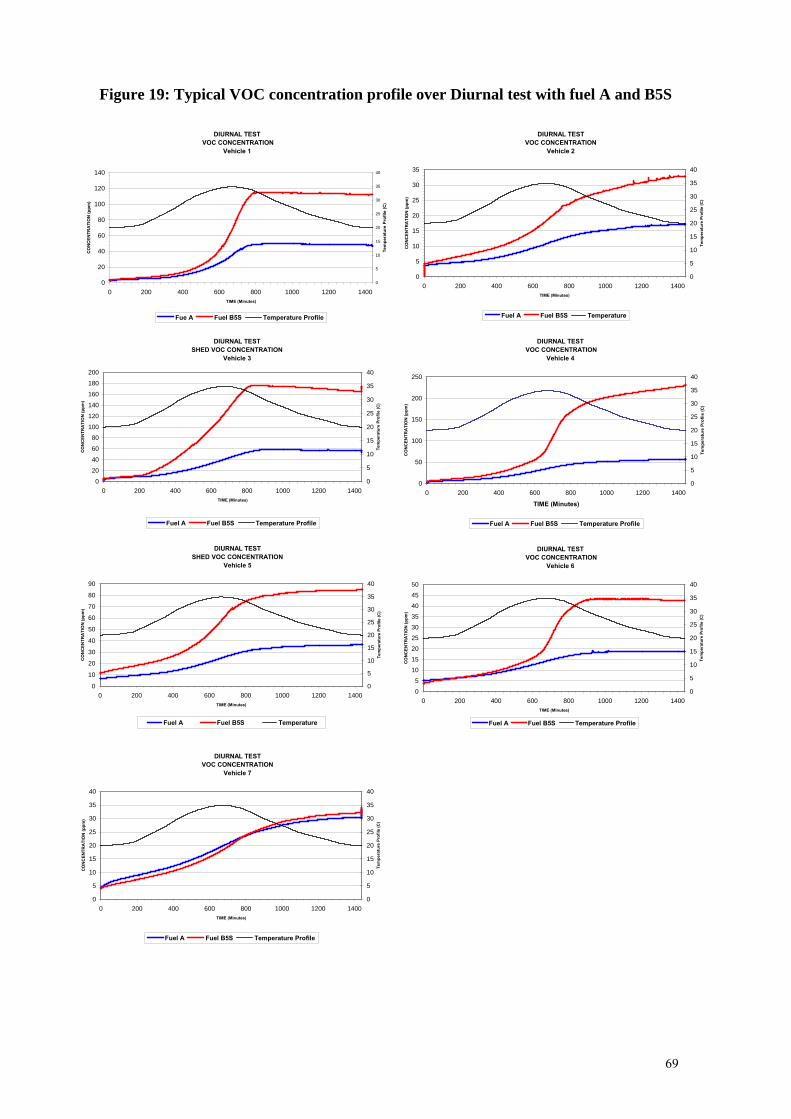
69
Figure 19: Typical VOC concentration profile over Diurnal test with fuel A and B5S
DIURNAL TEST
VOC CONCENTRATIONVehicle 1
0
20
40
60
80
100
120
140
0 200 400 600 800 1000 1200 1400TIME (Minutes)
CO
NC
ENTR
ATI
ON
(ppm
)
0
5
10
15
20
25
30
35
40
Tem
pera
ture
Pro
file
(C)
Fue A Fuel B5S Temperature Profile
DIURNAL TEST VOC CONCENTRATION
Vehicle 2
0
5
10
15
20
25
30
35
0 200 400 600 800 1000 1200 1400TIME (Minutes)
CO
NC
ENTR
ATI
ON
(ppm
)
0
5
10
15
20
25
30
35
40
Tem
pera
ture
Pro
file
(C)
Fuel A Fuel B5S Temperature
DIURNAL TEST SHED VOC CONCENTRATION
Vehicle 3
0
20
40
60
80
100
120
140
160
180
200
0 200 400 600 800 1000 1200 1400TIME (Minutes)
CO
NC
ENTR
ATI
ON
(ppm
)
0
5
10
15
20
25
30
35
40Te
mpe
ratu
re P
rofil
e (C
)
Fuel A Fuel B5S Temperature Profile
DIURNAL TEST VOC CONCENTRATION
Vehicle 4
0
50
100
150
200
250
0 200 400 600 800 1000 1200 1400
TIME (Minutes)
CO
NC
ENTR
ATI
ON
(ppm
)
0
5
10
15
20
25
30
35
40
Tem
pera
ture
Pro
file
(C)
Fuel A Fuel B5S Temperature Profile
DIURNAL TEST SHED VOC CONCENTRATION
Vehicle 5
0
10
20
30
40
50
60
70
80
90
0 200 400 600 800 1000 1200 1400TIME (Minutes)
CO
NC
ENTR
ATI
ON
(ppm
)
0
5
10
15
20
25
30
35
40
Tem
pera
ture
Pro
file
(C)
Fuel A Fuel B5S Temperature
DIURNAL TEST VOC CONCENTRATION
Vehicle 6
0
5
1015
20
25
30
35
40
45
50
0 200 400 600 800 1000 1200 1400TIME (Minutes)
CO
NC
ENTR
ATI
ON
(ppm
)
0
5
10
15
20
25
30
35
40
Tem
pera
ture
Pro
file
(C)
Fuel A Fuel B5S Temperature Profile
DIURNAL TEST VOC CONCENTRATION
Vehicle 7
0
5
10
15
20
25
30
35
40
0 200 400 600 800 1000 1200 1400TIME (Minutes)
CO
NC
ENTR
ATI
ON
(ppm
)
0
5
10
15
20
25
30
35
40
Tem
pera
ture
Pro
file
(C)
Fuel A Fuel B5S Temperature Profile
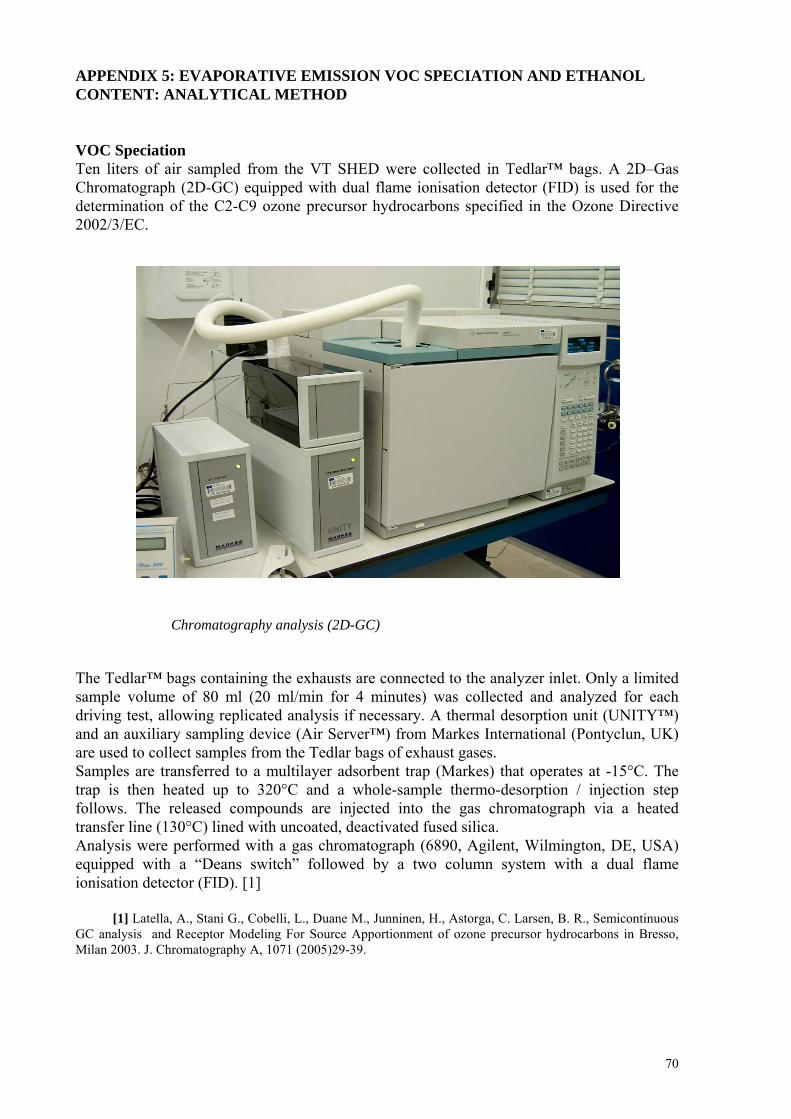
70
APPENDIX 5: EVAPORATIVE EMISSION VOC SPECIATION AND ETHANOL CONTENT: ANALYTICAL METHOD VOC Speciation Ten liters of air sampled from the VT SHED were collected in Tedlar™ bags. A 2D–Gas Chromatograph (2D-GC) equipped with dual flame ionisation detector (FID) is used for the determination of the C2-C9 ozone precursor hydrocarbons specified in the Ozone Directive 2002/3/EC.
Figura – thermal desorption gas chromatograph
Chromatography analysis (2D-GC)
The Tedlar™ bags containing the exhausts are connected to the analyzer inlet. Only a limited sample volume of 80 ml (20 ml/min for 4 minutes) was collected and analyzed for each driving test, allowing replicated analysis if necessary. A thermal desorption unit (UNITY™) and an auxiliary sampling device (Air Server™) from Markes International (Pontyclun, UK) are used to collect samples from the Tedlar bags of exhaust gases. Samples are transferred to a multilayer adsorbent trap (Markes) that operates at -15°C. The trap is then heated up to 320°C and a whole-sample thermo-desorption / injection step follows. The released compounds are injected into the gas chromatograph via a heated transfer line (130°C) lined with uncoated, deactivated fused silica. Analysis were performed with a gas chromatograph (6890, Agilent, Wilmington, DE, USA) equipped with a “Deans switch” followed by a two column system with a dual flame ionisation detector (FID). [1]
[1] Latella, A., Stani G., Cobelli, L., Duane M., Junninen, H., Astorga, C. Larsen, B. R., Semicontinuous GC analysis and Receptor Modeling For Source Apportionment of ozone precursor hydrocarbons in Bresso, Milan 2003. J. Chromatography A, 1071 (2005)29-39.

71
LT: connection tube 1-4 : solenoid valves P : pressure transducer MFC : mass flow controller NV : needle valve
Thermal desorption unit All the effluent, transferred to the gas chromatograph, is directed into the first column (“PLOT” 50m×0.32mm, coated with Al2O3 / KCl, 8μm). For the first 15 minutes the C2-C5 compounds elute from this column and are sent, via the “Deans switch”, towards FID 2. Afterwards the “Deans switch” activates directing the C6-C9 fraction into the second column (“WCOT” 50m×0.32mm, coated with polidimethyl-siloxane, 1.2 μm) and then to FID 1. From this point on two chromatograms are produced in parallel, one on each FID. The two columns work with the same program of temperatures: isotherm at 40°C for 2 minutes, ramp at 7 °C/min, isotherm at 120°C for 3 minutes, ramp at 7 °C/min, isotherm at 200°C for 35 minutes. The carrier gas is Helium.
Pump
UNITYAir Server™ module
UNITY™ Thermal Desorber

72
Figure – 2D gas chromatograph configuration
Finally, the VOCs emissions (g/km) are calculated as follows:
1000⋅⋅⋅⋅
=dD
VtotPMiCviMvi
Mvi = mass of VOCi emitted expressed as g/Km Cvi = concentration of VOCi expressed as ppm Pmi = molecular weight of VOCi (g/mol) Vtot = Vmix + VPM + VLPI (m3 ) D = 24 mol/l d = distance in km
ETHANOL Analysis
The polarity of ethanol is too high for chromatography with polar column/adsorbent material, such as the ones necessary for the VOC analysis. Hence, a method is used by which ethanol is sample-enriched from the Tedlar bags containing the evaporative emissions onto a mild adsorbent (Tenax TA) and successively thermally desorbed and analysed by GC-MS. This method has been adapted from a previously described method for analysis of polar organic compounds (49). The procedure for analysis is as follows: 1000 mL of air is sampling onto a Tenax TA cartridge with a sampling rate 200 mL/min. The adsorption trap is thermally desorbed using

73
an automatic desorption system (Perkin Elmer ATD 400) at 200 °C for 20 min and re-trapped on a Tenax-packed cold trap maintained at -20 °C. The trapped compound is transferred by ballistic heating of the trap to 200 °C (1 min hold time) into a HP 5890 GC with a MEGA OV-1, 30 m x 0.32 I.D., 0.1-0.15 μm film thickness. The GC is interfaced to a HP 5970 MSD (Mass Selective Detector) operating in EI (70 eV) scan mode, scanning from 30 to 200 m/z. The column temperature is held at 30 °C for 4 min, raised from 30 to 240 °C at 8 °C/min, with a final holding time of 6 min. This produces a complete run time of 20 min. The carrier gas for thermal desorption as well as gas chromatography is helium. Ethanol is quantified from the integrated signal of the single ion extraction chromatogram (m/z 46) in comparison with external standards produced by spiking blank Tenax TA cartridges with known amounts of ethanol.

74
VOC speciation detailed results All emissions g/test Vehicle 1 A B A5S A A10S B10S A A10S B10E B5E A5S C4- Alkanes 0.371 1.13 0.698 0.228 0.357 1.50 0.285 0.310 0.565 0.443 0.973 C4- Unsaturates 0.158 0.135 0.101 0.0583 0.079 0.225 0.048 0.058 0.103 0.064 0.116 C5+ Alkanes 0.677 1.012 0.585 0.548 0.833 1.63 0.710 0.901 0.825 0.636 0.502 C5+ Unsaturates 0.0607 0.0286 0.0000 0.0552 0.0736 0.1177 0.0635 0.0843 0.0876 0.0583 0.184 Aromatics 0.00657 0.225 0.134 0.304 0.247 0.338 0.232 0.317 0.263 0.227 0.196 Benzene 0.00563 0.00675 0.00394 0.00896 0.00926 0.01121 0.00754 0.0138 0.0190 0.0153 0.0227 Ethanol 0 0 0 0.0171 0.0208 0.0375 0.0143 0.0254 0.0263 0.0230 0.0131 Total 1.28 2.54 1.52 1.22 1.62 3.86 1.36 1.71 1.89 1.47 2.01
Vehicle 2 Fuel A B A5S B5S A A A10S B10S A A10S A C4- Alkanes 0.0252 0.137 0.0631 0.0817 0.0557 0.0400 0.0457 0.0897 0.0467 0.0565 0.0501 C4- Unsaturates 0.00325 0.0253 0.0137 0.0386 0.0216 0.0223 0.0348 0.0319 0.0285 0.0279 0.0377 C5+ Alkanes 0.305 0.574 0.275 0.337 0.511 0.382 0.480 0.388 0.526 0.729 0.502 C5+ Unsaturates 0 0 0.0274 0.0332 0.0429 0.0460 0.0196 0.0471 0.0523 0.0275 0.0480 Aromatics 0.0569 0.217 0.272 0.215 0.293 0.235 0.372 0.416 0.461 0.258 0.439 Benzene 0.00848 0.00700 0.00617 0.00722 0.01252 0.00886 0.00989 0.0104 0.0106 0.0123 0.0104 Ethanol 0 0 0.00656 0.0256 0.0223 0.0161 0.0320 0.0643 0.0349 0.0472 0.0354 Total 0.40 0.96 0.66 0.74 0.96 0.75 0.99 1.05 1.16 1.16 1.12
Vehicle 3 Fuel A B A5S A A B5S B B5S A5E B5E A A5S B5S C4- Alkanes 0.176 0.239 0.355 0.273 0.119 0.091 0.133 0.293 0.114 0.218 0.0794 0.0716 0.783 C4- Unsaturates 0.0372 0.0612 0.118 0.125 0.0581 0.0343 0.0458 0.0721 0.0498 0.0572 0.0453 0.0460 0.227 C5+ Alkanes 0.962 1.19 1.50 2.24 1.39 1.10 1.12 1.30 1.39 1.04 1.11 1.13 3.62 C5+ Unsaturates 0.0370 0.0634 0.0715 0.0443 0.0367 0.0264 0.0133 0.0194 0.0163 0.0412 0.0309 0.0241 0 Aromatics 0.197 0.255 0.283 0.417 0.285 0.244 0.463 0.401 0.396 0.555 0.303 0.338 0.267 Benzene 0.0204 0.0206 0.0237 0.0217 0.0122 0.0105 0.0129 0.0160 0.0160 0.0304 0.0190 0.0161 0 Ethanol 0 0 0 0.03 0.01 0.01 0.02 0.04 0.03 0.05 0.02 0.02 0 Total 1.43 1.83 2.35 3.15 1.91 1.51 1.81 2.14 2.01 1.99 1.61 1.65 4.90
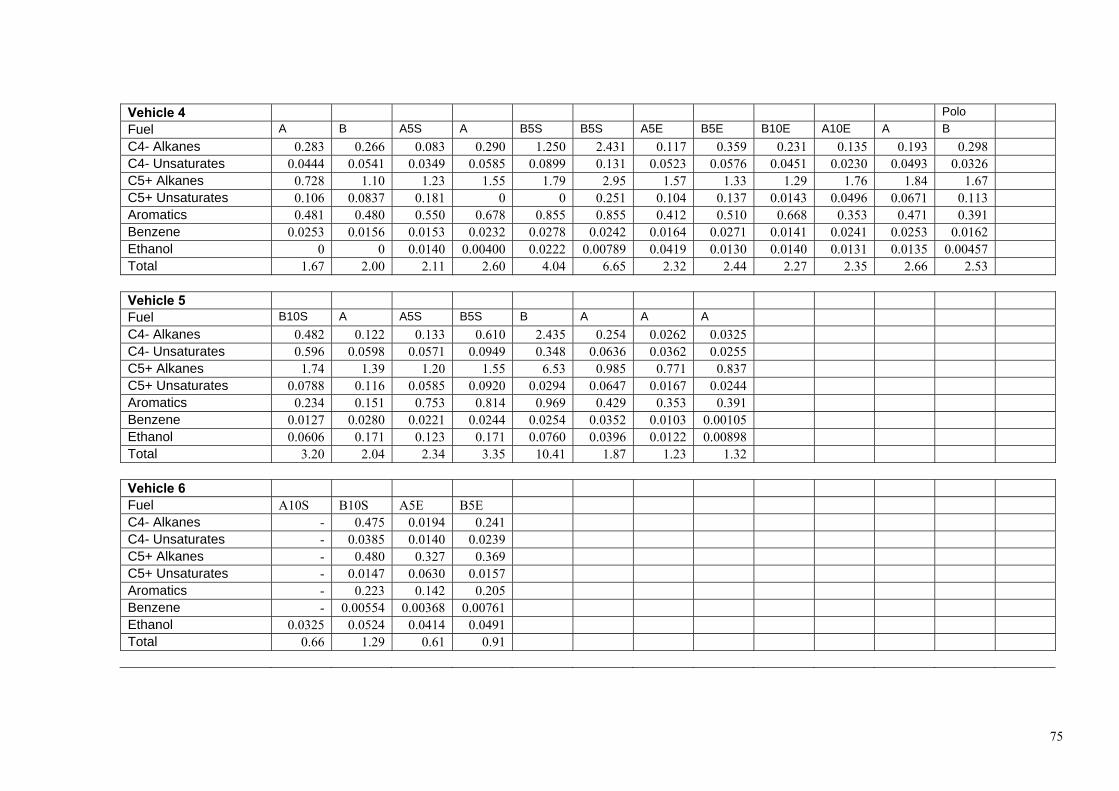
75
Vehicle 4 Polo Fuel A B A5S A B5S B5S A5E B5E B10E A10E A B C4- Alkanes 0.283 0.266 0.083 0.290 1.250 2.431 0.117 0.359 0.231 0.135 0.193 0.298 C4- Unsaturates 0.0444 0.0541 0.0349 0.0585 0.0899 0.131 0.0523 0.0576 0.0451 0.0230 0.0493 0.0326 C5+ Alkanes 0.728 1.10 1.23 1.55 1.79 2.95 1.57 1.33 1.29 1.76 1.84 1.67 C5+ Unsaturates 0.106 0.0837 0.181 0 0 0.251 0.104 0.137 0.0143 0.0496 0.0671 0.113 Aromatics 0.481 0.480 0.550 0.678 0.855 0.855 0.412 0.510 0.668 0.353 0.471 0.391 Benzene 0.0253 0.0156 0.0153 0.0232 0.0278 0.0242 0.0164 0.0271 0.0141 0.0241 0.0253 0.0162 Ethanol 0 0 0.0140 0.00400 0.0222 0.00789 0.0419 0.0130 0.0140 0.0131 0.0135 0.00457 Total 1.67 2.00 2.11 2.60 4.04 6.65 2.32 2.44 2.27 2.35 2.66 2.53
Vehicle 5 Fuel B10S A A5S B5S B A A A C4- Alkanes 0.482 0.122 0.133 0.610 2.435 0.254 0.0262 0.0325 C4- Unsaturates 0.596 0.0598 0.0571 0.0949 0.348 0.0636 0.0362 0.0255 C5+ Alkanes 1.74 1.39 1.20 1.55 6.53 0.985 0.771 0.837 C5+ Unsaturates 0.0788 0.116 0.0585 0.0920 0.0294 0.0647 0.0167 0.0244 Aromatics 0.234 0.151 0.753 0.814 0.969 0.429 0.353 0.391 Benzene 0.0127 0.0280 0.0221 0.0244 0.0254 0.0352 0.0103 0.00105 Ethanol 0.0606 0.171 0.123 0.171 0.0760 0.0396 0.0122 0.00898 Total 3.20 2.04 2.34 3.35 10.41 1.87 1.23 1.32
Vehicle 6 Fuel A10S B10S A5E B5E C4- Alkanes - 0.475 0.0194 0.241 C4- Unsaturates - 0.0385 0.0140 0.0239 C5+ Alkanes - 0.480 0.327 0.369 C5+ Unsaturates - 0.0147 0.0630 0.0157 Aromatics - 0.223 0.142 0.205 Benzene - 0.00554 0.00368 0.00761 Ethanol 0.0325 0.0524 0.0414 0.0491 Total 0.66 1.29 0.61 0.91

76
Vehicle 7 Fuel A B B5S B10S C4- Alkanes 0.0216 0.0285 0.0523 0.212 C4- Unsaturates 0.0111 0.0069 0.0136 0.0249 C5+ Alkanes 0.577 0.514 0.616 0.846 C5+ Unsaturates 0.00452 0.00294 0.00623 0.0258 Aromatics 0.136 0.121 0.0950 0.119 Benzene 0.00470 0.00484 0.00268 0.00592 Ethanol 0 0 0.00819 0.0113 Total 0.76 0.68 0.79 1.25

77
APPENDIX 6: EXHAUST EMISSION RESULTS (Where blanks appears, no valid measurement was taken on that test)
NEDC - HC
Vehicle 1
0.000
0.010
0.020
0.030
0.040
0.050
0.060
0.070
A B A5S B5S A A10SB10S A A10EB10EB10E A A5E B5E B B
Fuel
g/km
Vehicle 2
0.0000.0050.0100.0150.0200.0250.0300.0350.0400.0450.050
A B B A5S B5S A A A10S B10S A A10S B10S A
Fuel
g/km
Vehicle 3
0.0000.0100.0200.0300.0400.0500.0600.0700.0800.090
A B A5S B5S A A B5S B B5S A5E B5E A A5S B5S
Fuel
g/km
Vehicle 4
0.000
0.010
0.020
0.030
0.040
0.050
0.060
0.070
A B A5S B5S A5S A B5S B5S A5E B5EB10EA10E A B A10SB10SB5S
Fuel
g/km
Vehicle 5
0.0000.0100.0200.0300.0400.0500.0600.0700.080
A BA
5SB
5S AA
5EB
5E AB
10S
B10
E AA
5SB
5S B A A A A A B A AA
5EA
5EA
5EB
5EA
5SA
5SA
5S A A
Fuel
g/km
Vehicle 6
0.0000.0050.0100.0150.0200.0250.0300.0350.040
A B A5S A5S B5S A A5S A10S A10S B10S A5E B5E A
Fuel
g/km
Vehicle 7
0.000
0.010
0.020
0.030
0.040
0.050
0.060
0.070
0.080
A A B B A5S B5S A5S B10S A
Fuel
g/km

78
NEDC - CO
Vehicle 1
0.00
0.05
0.10
0.15
0.20
0.25
0.30
0.35
0.40
A B A5S B5S A A10S B10S A A10E B10E B10E A A5E B5E B B
Fuel
g/km
Vehicle 2
0.00
0.05
0.10
0.15
0.20
0.25
0.30
0.35
A B B A5S B5S A A A10S B10S A A10S B10S A
Fuel
g/km
Vehicle 3
0.000.050.100.150.200.250.300.350.40
A B A5S B5S A A B5S B B5S A5E B5E A A5S B5S
Fuel
g/km
Vehicle 4
0.00
0.100.200.300.40
0.50
0.600.70
0.80
A B A5S B5S A5S A B5S B5S A5E B5E B10EA10E A B A10SB10S B5S
Fuel
g/km
Ext pgExt pg Ext pg Ext pg Ext pg
Vehicle 5
0.00
0.10
0.20
0.30
0.40
0.50
0.60
A BA
5SB
5S AA
5EB
5E AB
10S
B10
E AA
5SB
5S B A A A A A B A AA
5EA
5EA
5EB
5EA
5SA
5SA
5S A A
Fuel
g/km
Vehicle 6
0.00
0.10
0.20
0.30
0.40
0.50
0.60
A B A5S A5S B5S A A5S A10S A10S B10S A5E B5E A
Fuel
g/km
Vehicle 7
0.00
0.05
0.10
0.15
0.20
0.25
A A B B A5S B5S A5S B10S A
Fuel
g/km
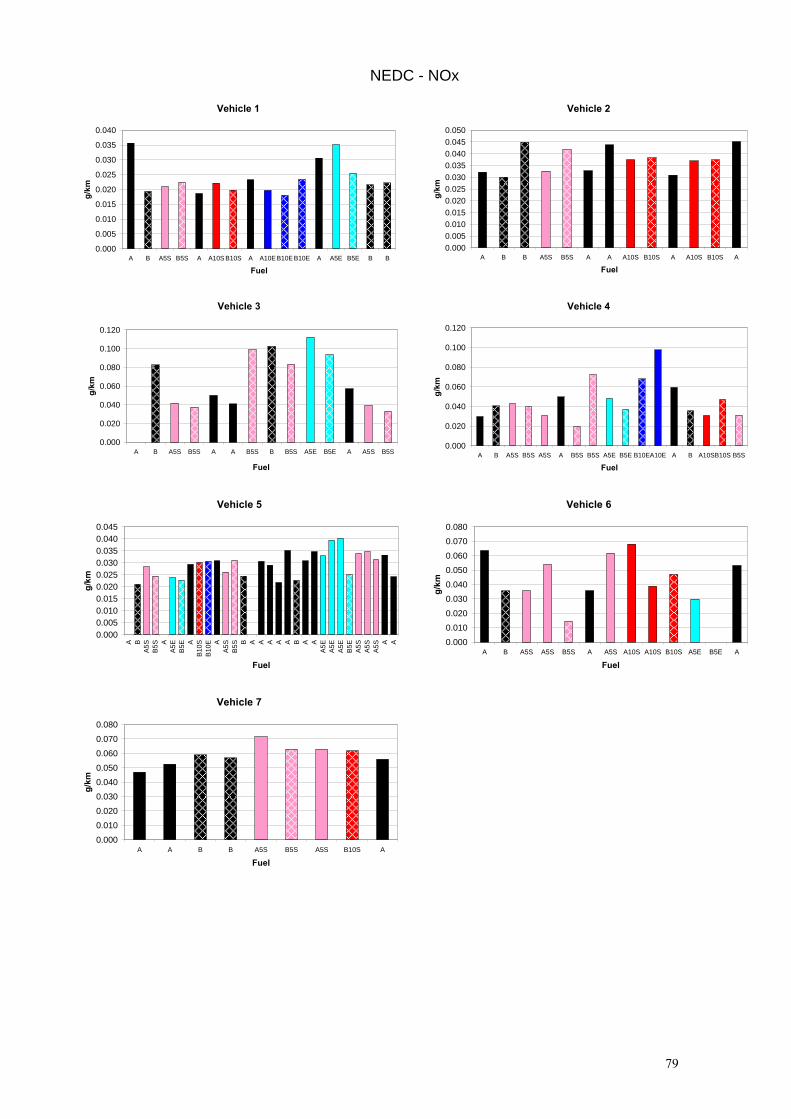
79
NEDC - NOx
Vehicle 1
0.000
0.005
0.010
0.015
0.020
0.025
0.030
0.035
0.040
A B A5S B5S A A10S B10S A A10EB10E B10E A A5E B5E B B
Fuel
g/km
Vehicle 2
0.0000.0050.0100.0150.0200.0250.0300.0350.0400.0450.050
A B B A5S B5S A A A10S B10S A A10S B10S A
Fuel
g/km
Vehicle 3
0.000
0.020
0.040
0.060
0.080
0.100
0.120
A B A5S B5S A A B5S B B5S A5E B5E A A5S B5S
Fuel
g/km
Vehicle 4
0.000
0.020
0.040
0.060
0.080
0.100
0.120
A B A5S B5S A5S A B5S B5S A5E B5E B10EA10E A B A10SB10S B5S
Fuel
g/km
Vehicle 5
0.0000.0050.0100.0150.0200.0250.0300.0350.0400.045
A BA
5SB
5S AA
5EB
5E AB
10S
B10
E AA
5SB
5S B A A A A A B A AA
5EA
5EA
5EB
5EA
5SA
5SA
5S A A
Fuel
g/km
Vehicle 6
0.000
0.0100.020
0.0300.040
0.0500.060
0.0700.080
A B A5S A5S B5S A A5S A10S A10S B10S A5E B5E A
Fuel
g/km
Vehicle 7
0.000
0.0100.020
0.0300.0400.050
0.0600.070
0.080
A A B B A5S B5S A5S B10S A
Fuel
g/km

80
NEDC - CO2
Vehicle 1
020406080
100120140160180200
A B A5S B5S A A10S B10S A A10E B10E B10E A A5E B5E B B
Fuel
g/km
Vehicle 2
020406080
100120140160180
A B B A5S B5S A A A10S B10S A A10S B10S A
Fuel
g/km
Vehicle 3
020406080
100120140160180200
A B A5S B5S A A B5S B B5S A5E B5E A A5S B5S
Fuel
g/km
Vehicle 4
020406080
100120140160180
A B A5S B5S A5S A B5S B5S A5E B5E B10EA10E A B A10SB10S B5S
Fuel
g/km
Vehicle 5
0
50
100
150
200
250
A BA
5SB
5S AA
5EB
5E AB
10S
B10
E AA
5SB
5S B A A A A A B A AA
5EA
5EA
5EB
5EA
5SA
5SA
5S A A
Fuel
g/km
Vehicle 6
0
50
100
150
200
250
A B A5S A5S B5S A A5S A10S A10S B10S A5E B5E A
Fuel
g/km
Vehicle 7
0
50
100
150
200
250
300
A A B B A5S B5S A5S B10S A
Fuel
g/km
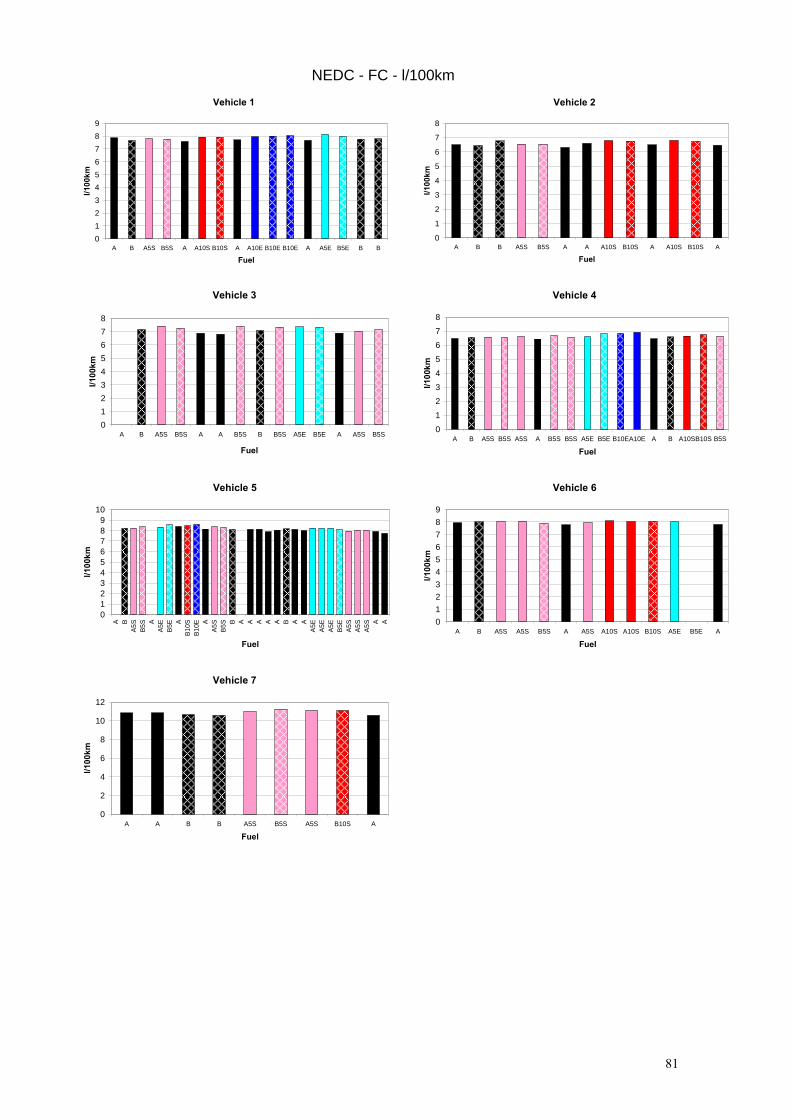
81
NEDC - FC - l/100km
Vehicle 1
0123456789
A B A5S B5S A A10S B10S A A10E B10E B10E A A5E B5E B B
Fuel
l/100
km
Vehicle 2
0
1
2
3
4
5
6
7
8
A B B A5S B5S A A A10S B10S A A10S B10S A
Fuel
l/100
km
Vehicle 3
012345678
A B A5S B5S A A B5S B B5S A5E B5E A A5S B5S
Fuel
l/100
km
Vehicle 4
0
1
23
4
5
67
8
A B A5S B5S A5S A B5S B5S A5E B5E B10EA10E A B A10SB10S B5S
Fuel
l/100
km
Vehicle 5
0123456789
10
A BA
5SB
5S AA
5EB
5E AB
10S
B10
E AA
5SB
5S B A A A A A B A AA
5EA
5EA
5EB
5EA
5SA
5SA
5S A A
Fuel
l/100
km
Vehicle 6
0123456789
A B A5S A5S B5S A A5S A10S A10S B10S A5E B5E A
Fuel
l/100
km
Vehicle 7
0
2
4
6
8
10
12
A A B B A5S B5S A5S B10S A
Fuel
l/100
km

82
NEDC - Energy Consumed
Vehicle 1
0
50
100
150
200
250
300
A B A5S B5S A A10S B10S A A10E B10E B10E A A5E B5E B B
Fuel
MJ/
100k
m
Vehicle 2
0
50
100
150
200
250
A B B A5S B5S A A A10S B10S A A10S B10S A
Fuel
MJ/
100k
m
Vehicle 3
0
50
100
150
200
250
A B A5S B5S A A B5S B B5S A5E B5E A A5S B5S
Fuel
MJ/
100k
m
Vehicle 4
0
50
100
150
200
250
A B A5S B5S A5S A B5S B5S A5E B5E B10EA10E A B A10SB10S B5S
Fuel
MJ/
100k
m
Vehicle 5
0
50
100
150
200
250
300
A BA
5SB
5S AA
5EB
5E AB
10S
B10
E AA
5SB
5S B A A A A A B A AA
5EA
5EA
5EB
5EA
5SA
5SA
5S A A
Fuel
MJ/
100k
m
Vehicle 6
0
50
100
150
200
250
300
A B A5S A5S B5S A A5S A10S A10S B10S A5E B5E A
Fuel
MJ/
100k
m
Vehicle 7
0
50
100
150200
250
300350
400
A A B B A5S B5S A5S B10S A
Fuel
MJ/
100k
m
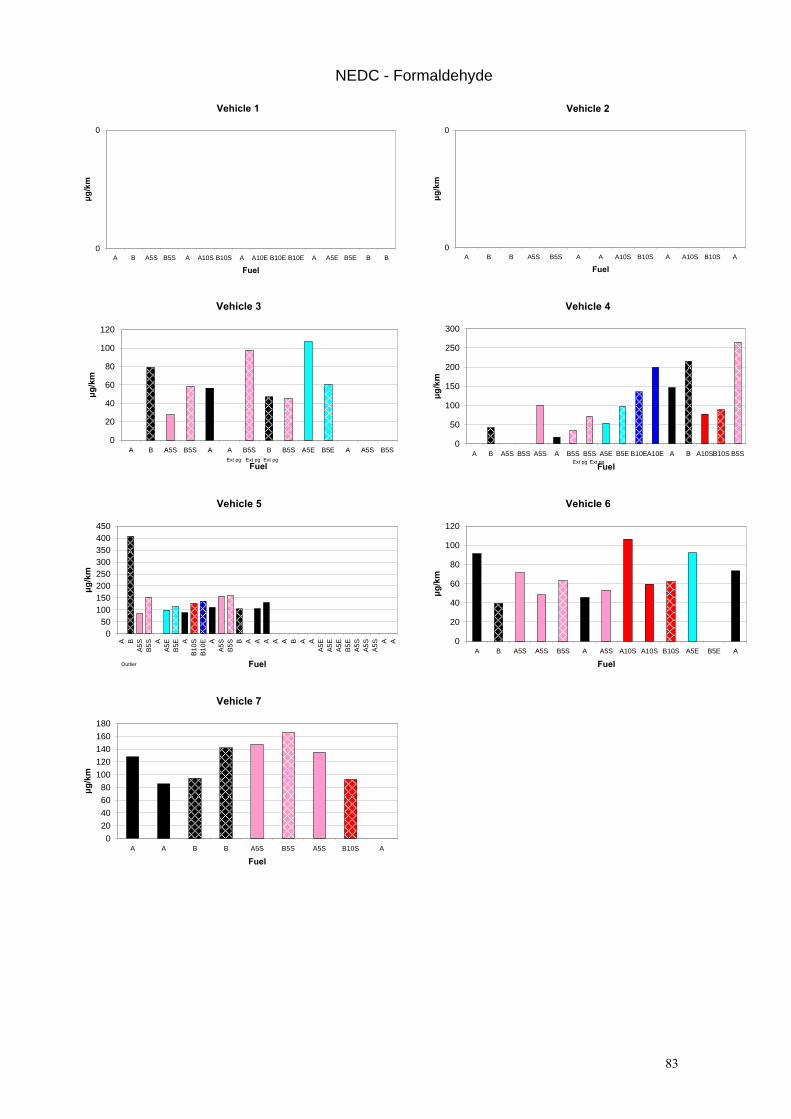
83
NEDC - Formaldehyde
Vehicle 1
0
0
A B A5S B5S A A10S B10S A A10E B10E B10E A A5E B5E B B
Fuel
μg/k
m
Vehicle 2
0
0
A B B A5S B5S A A A10S B10S A A10S B10S A
Fuel
μg/k
m
Vehicle 3
0
20
40
60
80
100
120
A B A5S B5S A A B5S B B5S A5E B5E A A5S B5S
Fuel
μg/k
m
Vehicle 4
0
50
100
150
200
250
300
A B A5S B5S A5S A B5S B5S A5E B5E B10EA10E A B A10SB10S B5S
Fuel
μg/k
m
Ext pgExt pg Ext pg Ext pg Ext pg
Vehicle 5
050
100150200250300350400450
A BA5
SB5
S AA5
EB5
E AB1
0SB1
0E AA5
SB5
S B A A A A A B A AA5
EA5
EA5
EB5
EA5
SA5
SA5
S A A
Fuel
μg/k
m
Outlier
Vehicle 6
0
20
40
60
80
100
120
A B A5S A5S B5S A A5S A10S A10S B10S A5E B5E A
Fuel
μg/k
m
Vehicle 7
020406080
100120140160180
A A B B A5S B5S A5S B10S A
Fuel
μg/k
m

84
NEDC - Acetaldehyde
Vehicle 1
0
0
A B A5S B5S A A10S B10S A A10E B10E B10E A A5E B5E B B
Fuel
μg/k
m
Vehicle 2
0
0
A B B A5S B5S A A A10S B10S A A10S B10S A
Fuel
μg/k
m
Vehicle 3
0
20
40
60
80
100
120
140
160
A B A5S B5S A A B5S B B5S A5E B5E A A5S B5S
Fuel
μg/k
m
Vehicle 4
050
100150200250300350400450
A B A5S B5S A5S A B5S B5S A5E B5E B10EA10E A B A10SB10S B5S
Fuel
μg/k
m
Vehicle 5
050
100150200250300350400
A BA
5SB
5S AA
5EB
5E AB
10S
B10
E AA
5SB
5S B A A A A A B A AA
5EA
5EA
5EB
5EA
5SA
5SA
5S A A
Fuel
μg/k
m
Vehicle 6
0
50
100
150
200
250
300
A B A5S A5S B5S A A5S A10S A10S B10S A5E B5E A
Fuel
μg/k
m
Vehicle 7
050
100150200250300350400450500
A A B B A5S B5S A5S B10S A
Fuel
μg/k
m

85
APPENDIX 7 – Aldehyde Emissions: analitycal method and statistical analysis details Tab. A7.1, - Aldehyde emissions: table of means
Car Fuel Aldehydes (mg/km) Car Fuel Aldehydes (mg/km)
Formald. Acetald
.
Formald. Acetald
.
Vehicle 3 A 56.63 106.74 Vehicle 6 A 70.08 109.36 Vehicle 3 A5E 106.81 134.95 Vehicle 6 A5E 92.28 138.78 Vehicle 3 A5S 27.62 36.44 Vehicle 6 A5S 57.55 90.86 Vehicle 3 B 63.13 58.00 Vehicle 6 A10S 83.01 211.54 Vehicle 3 B5E 60.54 83.24 Vehicle 6 B 39.65 94.40 Vehicle 3 B5S 66.81 94.57 Vehicle 6 B5E . .
Vehicle 6 B5S 62.85 98.98 Vehicle 4 A 81.88 93.70 Vehicle 6 B10S 62.15 84.04 Vehicle 4 A5E 53.38 30.91 Vehicle 4 A10E 199.60 313.10 Vehicle 7 A 106.65 186.01 Vehicle 4 A5S 99.37 85.89 Vehicle 7 A5S 140.81 378.64 Vehicle 4 A10S 77.56 89.74 Vehicle 7 B 118.08 167.67 Vehicle 4 B 128.77 117.43 Vehicle 7 B5S 165.55 404.05 Vehicle 4 B5E 98.06 131.18 Vehicle 7 B10S 92.48 305.02 Vehicle 4 B10E 135.33 418.68 Vehicle 4 B5S 123.48 162.13 Vehicle 4 B10S 88.96 113.26
Vehicle 5 A 109.29 135.97 Vehicle 5 A5E 99.28 202.81 Vehicle 5 A5S 119.75 210.98 Vehicle 5 B 104.14 221.47 Vehicle 5 B5E 113.89 214.29 Vehicle 5 B10E 136.55 359.54 Vehicle 5 B5S 155.20 229.96 Vehicle 5 B10S 127.03 214.09
Analytical method Carbonyl compounds are measured taking a sample of the diluted exhaust gas from the dilution tunnel. The diluted exhaust sample was drawn through 2,4-dinitrophenyl-hydrazine coated silica cartridges (WatersTM Sep-Pak® DNPH-cartridges). Aldehydes and ketones present in the exhaust flow are collected as their non-volatile 2,4-dinitrophenylhydrazone derivatives. The cartridges are then eluted with 2.5mL acetonitrile and 2.5 mL water and analyzed by HPLC-UV (λ=365nm). The cartridges are then eluted with 2.5mL of acetonitrile, diluted with 2.5 mL of water and stored at 5oC until analysis. The samples were analyzed by HPLC-UV (λ=365nm)

86
Statistical analysis details Fuel effects on formaldehyde and acetaldehyde emissions were analysed on a vehicle-by-vehicle basis for the five cars for which data was available (vehicles 3, 4, 5, 6 and 7). Arithmetic mean values for each vehicle × fuel combination may be found in Table A7.1. (Note: the mean aldehyde values in this table have not been adjusted for the significant time trend seen in the vehicle 4) Outliers A formaldehyde emission result (vehicle 5, fuel B, 407.7μg/km) was excluded as a statistical outlier as it was over 2.5 times higher than emissions in any other test. Statistical techniques for evaluating fuel effects (In the EPEFE gasoline project [27] and recent CONCAWE emission studies [25] [26], the variability in emission measurements has typically been found to follow the lognormal distribution with the degree of scatter increasing as the emission level increases. Variations between repeat measurements are a combination of measurement error and genuine variations between tests. The aldehyde emissions data behave similarly and therefore the data need to be analysed using weighted analysis of variance and/or weighted regression techniques (see [27], annex 5). Unfortunately, due to the lack of repeats, the arithmetic mean emissions for each vehicle and fuel are too inaccurate to calculate weights reliably via the usual equation
21/( )weight meanemission for that vehicle and and fuel= . This problem has been overcome by using iteratively reweighted least squares. The first step in IRLS regression is to perform an unweighted regression analysis and calculate the predicted value for each observation. A second regression is then performed with each observation given a weight of
21/( )weight predicted value= The predicted values and weights are then recomputed and a subsequent weighted regression is conducted. This process is continued until the regression coefficients have converged.


European Commission EUR 22713 EN – DG Joint Research Centre, Institute for the Environment and Sustainability Title: Effects of gasoline vapour pressure and ethanol content on evaporative emissions from modern cars Authors: Edited by G. Martini Luxembourg: Office for Official Publications of the European Communities 2007 – 87 pp. – 21x 29.7 cm EUR - Scientific and Technical Research series; ISSN 1018-5593 ISBN 978-92-79-05249-1 Abstract A test programme designed to investigate the influence of gasoline vapour pressure and ethanol content on evaporative emissions from modern passenger cars has been carried out by the Joint Research Centre of the European Commission jointly with CONCAWE and EUCAR. Seven gasoline passenger cars representative of current EURO 3/4 emissions technology were tested for evaporative emissions with ten different test fuels. The test fuel matrix comprised 60 and 70 kPa hydrocarbon base fuels with 5 and 10% ethanol splash blends and 5 and 10% ethanol matched volatility blends. The evaporative emission tests were carried out according to a test protocol based on the European homologation test procedure, with no additional vehicle conditioning. Although this test protocol turned out to have a considerable influence on the results, the programme has provided valuable information and several clear conclusions can be drawn. The programme confirmed that vapour pressure (DVPE) is a key fuel variable for evaporative emissions. However the effect of vapour pressure is strongly non-linear; the ethanol blends with final DVPE around 75 kPa gave considerably higher evaporative emissions than the lower volatility fuels in most of the vehicles. Differences between fuels with DVPE in the range 60-70 kPa were small. Additional tests on two vehicles performed after the main programme have raised some questions about possible effects of ethanol on carbon canister working capacity and on the role of permeation in determining evaporative emissions.

2
The mission of the JRC is to provide customer-driven scientific and technical support for the conception, development, implementation and monitoring of EU policies. As a service of the European Commission, the JRC functions as a reference centre of science and technology for the Union. Close to the policy-making process, it serves the common interest of the Member States, while being independent of special interests, whether private or national.
LB-N
A-22713-EN
-C