journal esthetic dentistry 2000
TRANSCRIPT

Official Publication of the American Academy of Esthetic Dentistry,
Scandinavian Academy of Esthetic Dentistry, Japan Academy of Esthetic Dentistry,
International Federation of Esthetic Dentistry, American Academy of Cosmetic and
Adhesive Dentistry, Australian Society of Aesthetic Dentistry and
the Belgian Academy of Esthetic Dentistry
2000 •aa Volume 12 aa Number 62000 •aa Volume 12 aa Number 6
Official Publication of the American Academy of Esthetic Dentistry,
Scandinavian Academy of Esthetic Dentistry, Japan Academy of Esthetic Dentistry,
International Federation of Esthetic Dentistry, American Academy of Cosmetic and
Adhesive Dentistry, Australian Society of Aesthetic Dentistry and
the Belgian Academy of Esthetic Dentistry
The JOURNAL OF ESTHETIC DENTISTRY (ISSN 1040-1466) is published bimonthly in January, March, May, July, September, and November by BCDecker Inc, 20 Hughson St. South, 10th Floor, P.O. Box 620, L.C.D. 1, Hamilton, Ontario L8N 3K7. The annual subscription rate for the U.S. is $175.00U.S. for individuals and $269.00 U.S. for libraries and institutions. The foreign rate is $225.00 U.S. for individuals and $299.00 U.S. for libraries and insti-tutions. Single issues are available in the U.S. and Canada for $52.00 U.S.; foreign, $58.00 U.S. Claims for missing issues can be honored only up to 3 months for domestic addresses, 6 months for foreign addresses. Duplicate copies will not be sent to replace ones undelivered through failure to notify BC Decker Inc of change of address. Advertising inquiries should be addressed to John Birkby, BC Decker Inc, 20 Hughson St. South, P.O. Box 620, L.C.D. 1,Hamilton, Ontario, Canada L8N 3K7. Tel: (905) 522-7017; Fax: (905) 522-7839; in Canada and U.S.: 1-800-568-7281. Address subscription inquiries toBC Decker Inc, P.O. Box 620, L.C.D. 1, Hamilton, Ontario L8N 3K7, Tel: (905) 522-7017. Customer Service Tel: 1-800-568-7281.
No responsibility is assumed by the Publisher for any injury and/or damage to persons or property as a matter of product liability, negligence or otherwise,or from any use or operation of any methods, products, instructions, or ideas contained in the material herein. No suggested test or procedure should becarried out unless, in the reader’s judgment, its risk is justified. Because of rapid advances in the medical sciences, we recommend that the independent veri-fication of diagnoses and drug dosages should be made. Discussions, views, and recommendations for medical procedures, choice of drugs, and drugdosages are the responsibility of the authors.
The appearance of advertising in the JOURNAL OF ESTHETIC DENTISTRY does not constitute a guarantee or endorsement of the quality or value ofsuch product or of the claims made for it by its manufacturer. The fact that a product, service, or company is advertised in the JOURNAL OF ESTHETICDENTISTRY shall not be referred to by the manufacturer in collateral advertising.
© 2000 BC Decker Inc. All rights reserved.
ADMINISTRATIVE BOARD
ED I T O R-IN-CH I E F
Harald O. Heymann, DDS, MEd
AS S O C I A T E ED I T O R
Edward J. Swift Jr., DMD, MS
ED I T O R I A L AS S I S T A N T
Betty T. Cates
SECTION EDITORS
Edward P. Allen, DDS, PhD
Stephen C. Bayne, MS, PhD
Terence Donovan, DDS, MS
Vincent G. Kokich, DDS, MSD
Jorge Perdigão, DMD, MS, PhD
Louis F. Rose, DDS, MD
Edwin S. Rosenberg, BDS,
H.Dip.Dent, DMD
Henri Rotsaert, RDT
Richard E. Walton, DDS, MS
EDITORIAL ADVISORY BOARD
Leonard Abrams (USA)
Steve Acquilino (USA)
Pinhas Adar (USA)
Ken Anusavice (USA)
Donald Arens (USA)
Luiz Narciso Baratieri (Brazil)
William Becker (USA)
Urs Belser (Switzerland)
Gunnar Bergenholtz (Sweden)
Robert Berger (USA)
Joe Camp (USA)
Gerard J. Chiche (USA)
Noah Chivian (USA)
Gordon J. Christensen (USA)
E. Steven Duke (USA)
Jim Dunn (USA)
Jack Ferracane (USA)
Mauro Fradeani (Italy)
Mark J. Friedman (USA)
David A. Garber (USA)
Jaime A. Gil (Spain)
Ronald E. Goldstein (USA)
Ueli Grunder (Switzerland)
Van B. Haywood (USA)
Abraham Ingber (USA)
John Kanca (USA)
Ivo Krejci (Switzerland)
Masahiro Kuwata (Japan)
Paul Lambrechts (Belgium)
Karl F. Leinfelder (USA)
William Liebenberg (Canada)
Felix Lutz (Switzerland)
Pascal Magne (Switzerland)
Ronald I. Maitland (USA)
Lloyd Miller (USA)
Preston D. Miller (USA)
Ivar A. Mjör (Norway/USA)
Dan Nathanson (USA)
Linda C. Niessen (USA)
Patrick Palacci (France)
Nicola Pietrobon (Switzerland)
William R. Proffit (USA)
François Roulet (Germany)
Cliff Ruddle (USA)
Frederick A. Rueggeberg (USA)
Fortunato Santos (Brazil)
Peter Schärer (Switzerland)
Cherilyn G. Sheets (USA)
Richard Simonsen (USA)
Dan Sneed (USA)
Frank Spear (USA)
Howard F. Strassler (USA)
Jörg Strub (Germany)
Daniel Sullivan (USA)
Asami Tanaka (USA)
Dennis P. Tarnow (USA)
Martin Trope (USA)
Arnold S. Weisgold (USA)
John West (USA)
Ray Williams (USA)
David C. Winkler (Denmark)
Robert Winter (USA)
OFFICIAL PUBLICATION OF THE AMERICAN ACADEMY OF ESTHETIC DENTISTRY
JAPAN ACADEMY OF ESTHETIC DENTISTRYSCANDINAVIAN ACADEMY OF ESTHETIC DENTISTRY
INTERNATIONAL FEDERATION OF ESTHETIC DENTISTRYAMERICAN ACADEMY OF COSMETIC AND ADHESIVE DENTISTRY
AUSTRALIAN SOCIETY OF AESTHETIC DENTISTRYBELGIAN ACADEMY OF ESTHETIC DENTISTRY
Journal of Esthetic Dentistry
Journal ofEstheticDentistryB
C D
EC
KE
R I
NC
287 PERSPECTIVES
Title???Fred Rueggeberg, Murray Bouschlicher
CLINICAL ARTICLES ??
RESEARCH ARTICLES ??
291 Developments in Shrinkage Control of Adhesive RestorativesBibi S. Dauvillier, MSc, Maxim P. Aarnts, PhD, Albert J. Feilzer, DDS, PhD
300 Curing Dental Resins and Composites by PhotopolymerizationJeffrey W. Stansbury, PhD
309 Polymerization Contraction Stress of Resin Composite Restorations in a Model Class I Cavity Configuration Using Photoelastic AnalysisYoshifumi Kinomoto, DDS, PhD, Mitsuo Torii, DDS, PhD,
Fumio Takeshige, DDS, PhD, Shigeyuki Ebisu, DDS, PhD
320 Effect of Distance on the Power Density from Two Light GuidesRichard B. Price, DDS, MS, FDS RCS (Edin), Tore Dérand, DDS, PhD,
Mary Sedarous, BSc, Pantelis Andreou, PhD, Robert W. Loney, DMD, MS
328 Effect of Ramped Light Intensity on Polymerization Force andConversion in a Photoactivated CompositeMurray R. Bouschlicher, DDS, MS, Frederick A. Rueggeberg, DDS, MS
340 Polymerization Depth of Contemporary Light-Curing Units Using MicrohardnessFrederick A. Rueggeberg, DDS, MS, Janet W. Ergle, Donald J. Mettenburg
350 INDEX
Journal of Esthetic Dentistry
Owned and published by BC Decker Inc
20 Hughson Street SouthP.O. Box 620, LCD 1
Hamilton, ON L8N 3K7Tel: 905-522-7017; Fax: 905-522-7839
E-mail: [email protected]: http://www.bcdecker.com
Editor-in-ChiefHarald O. Heymann, DDS, MEd
Chapel Hill, North CarolinaTel: 919-966-2770; Fax: 919-966-5660
E-mail: [email protected]
Editorial AssistantBetty T. Cates
Chapel Hill, North CarolinaTel: 919-843-9744; Fax: 919-966-5660E-mail: [email protected]
PUBLISHER
BC Decker Inc
President,Brian C. Decker
Vice President, Finance,Doug M. Fleming
Director, Sales and Marketing,David LeGallais
Production Editor,Paula Presutti
Rights and Permissions,Paula Presutti
Customer Service Manager,Cathy Calvin
Distribution and Postal Affairs,Deborah J. Maraldo
ADVERTISING
John BirkbyBC Decker Inc
20 Hughson Street SouthP.O. Box 620, LCD 1
Hamilton, ON L8N 3K7Tel: 905-628-4309; Fax: 905-628-6847
E-mail: [email protected]
SUBSCRIPTION RATES
The 2000 annual subscription rates are: UnitedStates and Canada (U.S.$): individual, $175.00;institution, $269.00; single issue, $52.00. Else-where (U.S.$): individual, $225.00; institution,$299.00; single issue, $58.00. For subscriptionsoutside the USA or Canada, payment must bein U.S. funds drawn on a U.S. bank free of bankcharges, or a U.S. dollar International MoneyOrder free of service fees. VISA, MasterCard, andAmerican Express are also accepted. Airmailrates for delivery overseas are available onrequest. Remit payments and correspondenceto: BC Decker Inc, Customer Service Depart-ment, P.O. Box 620, LCD 1, Hamilton, ONL8N 3K7 Canada, or P.O. Box 785, Lewiston,NY 14092-0785 USA. Tel: 1-800-568-7281(USA and Canada), 905-522-7017 (elsewhere),Fax: 905-522-7839, E-mail: [email protected] include a mailing label from a recentissue for renewal orders. In Japan, contactIshiyaku Publishers, Inc., 7-10 Honkomagome,I-Chome, Bunkyo-Ku, Tokyo 113, Japan. Tel:03-5395-7631; Fax: 03-5395-7633; Telex:2723298 MDP.
CLAIMS
Claims for issues not received or for damagedissues must be made within three months ofpublication for subscriptions mailing withinNorth America, six months for destinationselsewhere. Issues claimed beyond these limitsmust be prepaid at the single issue rates listedbelow. Duplicate copies will not be supplied toreplace those undelivered through failure tonotify the Publisher of a change of address.Please let us know of address changes as soonas possible. Send us your current mailing label(with the old address), your new address, andthe date the change becomes effective.
BACK ISSUES
Back issues are available at the single issue priceof U.S. $52.00 in the USA and Canada, U.S.$58.00 elsewhere, or the complete volume at cur-rent volume prices. All prices are in U.S. dollars.Orders must be prepaid by one of the methodslisted in the subscription information. Pleasecheck with Customer Service for availability at 1-800-568-7281 (USA and Canada), 905-522-7017 (elsewhere), 905-522-7839 (Fax), orE-mail: [email protected].
BULK REPRINTS
Reprints of Journal articles are available in min-imum quantities of 100. To order, please con-tact the Sales Department, BC Decker Inc, at theaddress or phone number listed above.
INDEXING
The Journal is included in MEDLINE on theMEDLARS.
DISPLAY ADVERTISING
The appearance of advertisements in the Journalis not a warranty, endorsement, or approval ofthe products or services advertised, or of theireffectiveness, quality, or safety. The Publisher,the American Academy of Esthetic Dentistry,the Japan Academy of Esthetic Dentistry, Scandinavian Academy of Esthetic Dentistry,International Federation of Esthetic Dentistry,American Academy of Cosmetic and AdhesiveDentistry, Australian Society of Aesthetic Den-tistry, and the Belgian Academy of EstheticDentistry disclaim any responsibility for anyinjury to persons or property resulting from anyideas or products referred to in the articles oradvertisements.
CLASSIFIED ADVERTISING
Rates are $735.00 for a 1/8 page ad, $945.00for a 1/4 page ad, $1,155.00 for a 1/3 page ad,$1,610.00 for a 1/2 page ad, and $2,310.00 fora 1 page ad. For further information, contactthe Sales Department at BC Decker Inc at theaddress or phone number listed above.
DISCLAIMER
The statements and opinions in the articles ofthis Journal are solely those of the individualauthors and contributors and not of the Pub-lisher or the Societies that list the Journal as theirofficial publication.
COPYRIGHT
Material printed in the Journal is covered bycopyright. All rights reserved. Except undercircumstances within “fair use” as defined bycopyright law, no part of this publication maybe reproduced, displayed, or transmitted inany form or by any means, electronic ormechanical, including photocopying or by anyinformation storage and retrieval system, with-out the prior written permission of the copy-right owner, BC Decker Inc. Requests shouldbe made to Paula Presutti, Rights and Permis-sions, BC Decker Inc, 20 Hughson Street South,P.O. Box 620, LCD 1, Hamilton, ON L8N3K7; Fax: 905-522-7839.
MICROFORM
The Journal is available on Microfilm fromBell and Howell Information and Learning,300 N. Zeeb Road, Ann Arbor, MI 48106; 415-433-5500.
Business Information for Readers
V O L U M E 1 2 , N U M B E R 6 , 2 0 0 0 287
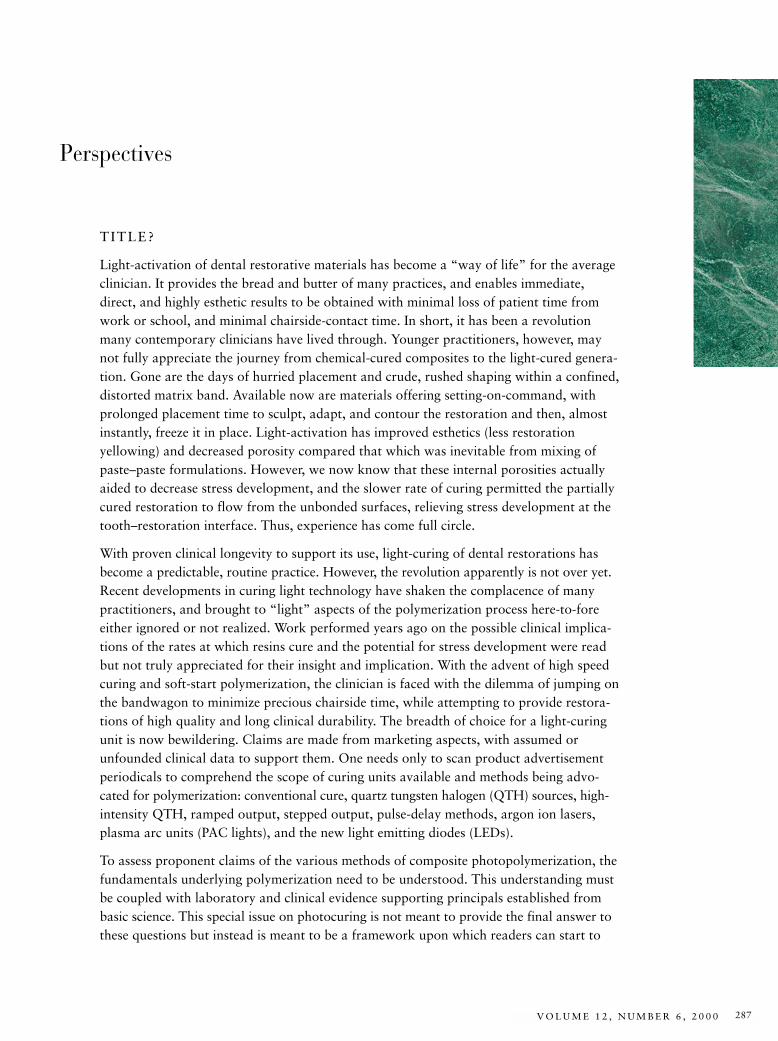
Perspectives
TITLE?
Light-activation of dental restorative materials has become a “way of life” for the averageclinician. It provides the bread and butter of many practices, and enables immediate,direct, and highly esthetic results to be obtained with minimal loss of patient time fromwork or school, and minimal chairside-contact time. In short, it has been a revolutionmany contemporary clinicians have lived through. Younger practitioners, however, maynot fully appreciate the journey from chemical-cured composites to the light-cured genera-tion. Gone are the days of hurried placement and crude, rushed shaping within a confined,distorted matrix band. Available now are materials offering setting-on-command, withprolonged placement time to sculpt, adapt, and contour the restoration and then, almostinstantly, freeze it in place. Light-activation has improved esthetics (less restoration yellowing) and decreased porosity compared that which was inevitable from mixing ofpaste–paste formulations. However, we now know that these internal porosities actuallyaided to decrease stress development, and the slower rate of curing permitted the partiallycured restoration to flow from the unbonded surfaces, relieving stress development at thetooth–restoration interface. Thus, experience has come full circle.
With proven clinical longevity to support its use, light-curing of dental restorations hasbecome a predictable, routine practice. However, the revolution apparently is not over yet.Recent developments in curing light technology have shaken the complacence of manypractitioners, and brought to “light” aspects of the polymerization process here-to-foreeither ignored or not realized. Work performed years ago on the possible clinical implica-tions of the rates at which resins cure and the potential for stress development were readbut not truly appreciated for their insight and implication. With the advent of high speedcuring and soft-start polymerization, the clinician is faced with the dilemma of jumping onthe bandwagon to minimize precious chairside time, while attempting to provide restora-tions of high quality and long clinical durability. The breadth of choice for a light-curingunit is now bewildering. Claims are made from marketing aspects, with assumed orunfounded clinical data to support them. One needs only to scan product advertisementperiodicals to comprehend the scope of curing units available and methods being advo-cated for polymerization: conventional cure, quartz tungsten halogen (QTH) sources, high-intensity QTH, ramped output, stepped output, pulse-delay methods, argon ion lasers,plasma arc units (PAC lights), and the new light emitting diodes (LEDs).
To assess proponent claims of the various methods of composite photopolymerization, thefundamentals underlying polymerization need to be understood. This understanding mustbe coupled with laboratory and clinical evidence supporting principals established frombasic science. This special issue on photocuring is not meant to provide the final answer tothese questions but instead is meant to be a framework upon which readers can start to
J O U R N A L O F E S T H E T I C D E N T I S T R Y288
comprehend the complexities underlying what can so easily be taken for granted: “shinethe light, and it will cure.” The articles contained in this issue represent a compilation ofhistoric perspectives, basic science, and clinical realities of only a small sampling of thetotality of issues related to this topic. As co-editors, we take pride in the assemblage of thiswork, because it represents the input of many talented and dedicated individuals who areexperts in their own right.
This issue has been developed with the clinician in mind. To enhance the profession, theclinician must become aware of issues. Awareness itself does not lead to change; it is onlythrough understanding that change can arise. Thus, each author was specifically asked topresent his or her work with the clinician in mind and, whenever possible, to emphasizethe clinical relevance of the findings. Again, this issue is not THE answer, but is designedto take a few steps toward educating the practitioner so that well-informed, knowledge-able decisions can be made with respect to use of photocuring in an individual’s practice.We are indebted to Dr. Harald Heymann for the encouragement, support, and motivationto provide this accumulation of works for the reader’s consideration.
Fred Rueggeberg and Murray BouschlicherGuest Editors
ARTICLES IN THIS ISSUE
Dauvillier, Aarnts, and Feilzer review the underlying causes of contraction of polymericrestorative materials, and the various factors that influence them. Some factors affectingstress development are out of the clinician’s control (e.g., composite monomeric and fillerformulation); however, the methods used for placement and light-curing are directly underthe clinicians control. This article stresses the importance of knowing the relation of thesemanipulative factors to the development of stresses from polymerization. The problems ofbalancing a low polymerization reaction rate with obtaining a high, final conversion valueto provide clinically adequate properties to the restoration are addressed. Allowing a com-posite to flow prior to reaching high moduli values (the gel point) permits a relief of thesestresses instead of allowing them to build up within the material and at the material–toothinterface. Building up a composite in increments helps to reduce the configuration factor(C-factor) and minimizes stress development. The true benefits and mechanisms of stressalteration from placing low modulus resin liners is still not definitive, and the effects ofvariation in light intensity (the soft-start techniques and the new high output intensitymodels) still have not been proved. The influence of water sorption on stress relaxation ofcomposites is also addressed.
Clinicians may take the mechanisms underlying photocuring of light-activated dentalrestorations for granted. However, this process is complex, and knowledge of the compo-nents, the mechanisms underlying the reaction, and factors affecting the efficiency of the
P E R S P E C T I V E S
R U E G G E B E R G A N D B O U S C H L I C H E R
V O L U M E 1 2 , N U M B E R 6 , 2 0 0 0 289
potential for cure all have clinical significance. The fundamentals of this reaction as well asmany other aspects of this topic are addressed by Stansbury in his work entitled “CuringDental Resins and Composites by Photopolymerization.” The reasons underlying themechanisms of oxygen inhibition, the difficulty in adequately curing some composite sys-tems containing the new alternative photoinitiator systems, the influence of fillers in com-posites, the level of heat generated during composite cure, and the rationale underlyingpost-cure heating of composites are clearly addressed.
Using a simulated Class I situation, Kinomoto and colleagues have developed a sophisti-cated but visual method of comprehending the magnitude and direction of stresses devel-oped in a light-cured composite material, as well as in the material to which it is bonded.Interestingly, when the light-cured material was exposed in preparations made in extractedbovine teeth, gap formation was present. When this gap formed, low stresses showed inthe cured composite, because the composite was not bonded to an interface. The distribu-tion of stress patterns in model composite preparations was similar for both the self-curedand light-cured composites. However, the light-cured material demonstrated significantlyhigher stress values. Stresses also develop in the substrate that is being restored, as isclearly demonstrated in this work. This article demonstrates the location and variation ofstress development along the lateral restoration walls as well as across the pulpal floor of a restoration. Clinicians can easily understand how and where stresses develop in resin-based restorations, and can then refine their techniques to minimize the deleterious effectsof these forces.
The influence of light-curing tip design on the power density delivered to the restorativematerial surface affects the overall potential for curing of the restoration, and its clinicaldurability. Thus, Price and colleagues, evaluated the effect of tip distance and power den-sity between a standard 8-mm diameter curved light guide and an intensifying tip (theTurbo tip) in “Effect of Distance on the Power Density from Two Light Guides.” Eventhough the absolute intensity delivered when using the Turbo tip is greater than with theconventional tip at the distal tip end, the rate at which the power density declines as the tip distance increases occurred at a significantly higher rate with the Turbo tip than theconventional guide. Interestingly, at tip-to-target distances greater than 5 mm, the conven-tional light guide provided significantly greater power density than did the Turbo tip.Thus, clinicians need to be familiar with any “focusing” effect of light guides to use themto their greatest clinical potential.
The rate at which composite polymerizes to bonded substrates may significantly affect thedevelopment of stresses between these materials, and thus affect the potential for success-ful bonding. Bouschlicher and Rueggeberg address these issues in their article “Effect ofRamped Light Intensity on Polymerization Force and Conversion in a PhotoactivatedComposite.” Using bonded surfaces attached to a force measuring device, the real-timeforce development between a commercially available composite and the bonded substrateswas determined when using a light-curing unit in a variety of exposure modes: standard,
P E R S P E C T I V E S
J O U R N A L O F E S T H E T I C D E N T I S T R Y290
continuous output; an exponential increase in light intensity; a two-step method; and athalf intensity of the continuous exposure. The results indicate that use of the exponentialramp significantly reduces stress development during curing and also results in equivalenttotal cure values to those achieved when the composite was exposed using standard tech-niques. Thus, laboratory data indicate that use of this type of soft-start cure method doesverify theoretic concepts of stress reduction when a low rate of light intensity is used dur-ing the initial phases of exposure.
The potential for a wide variety of commercially available light-curing units and tech-niques to polymerize a photoactivated composite was evaluated by Rueggeberg, Ergle, and Mettenburg in “Polymerization Depths of Contemporary Light-Curing Units UsingMicrohardness.” The same shade and lot of composite was exposed to conventionalquartz tungsten halogen units, high-intensity QTH lights, soft-start techniques (step andpulse-delay modes), plasma arc (PAC) lights, and various exposure durations of an argonion laser. The claims of curing light manufacturers and advocates of certain curing methodswere evaluated on their ability to provide hardness of composite similar to that obtainedwith the standard technique: a 40-second exposure from a conventional QTH light source.Clinical usefulness of the results focuses on evaluating the ability of newer light-curingunits to shorten exposure duration or to provide enhanced depth of cure compared withthe conventional curing methods. In most instances, cure depths, using manufacturer’s recommended exposure durations, did not exceed the 2-mm depth traditionally accepted.Some high-intensity units (high-intensity QTH, the PAC light, and the laser) did providefor lowered exposure duration while presenting similar hardness values. However,extremely short exposure durations advocated by some manufacturers did not providehardness values equivalent to those achieved with conventional treatment.
V O L U M E 1 2 , N U M B E R 6 , 2 0 0 0 291
Resin composite restorativematerials have gained a perma-
nent position on the dental market.Their superior esthetics and consec-utive preparation requirements (lessdestructive than amalgam) havebeen instrumental in this commer-cial success.
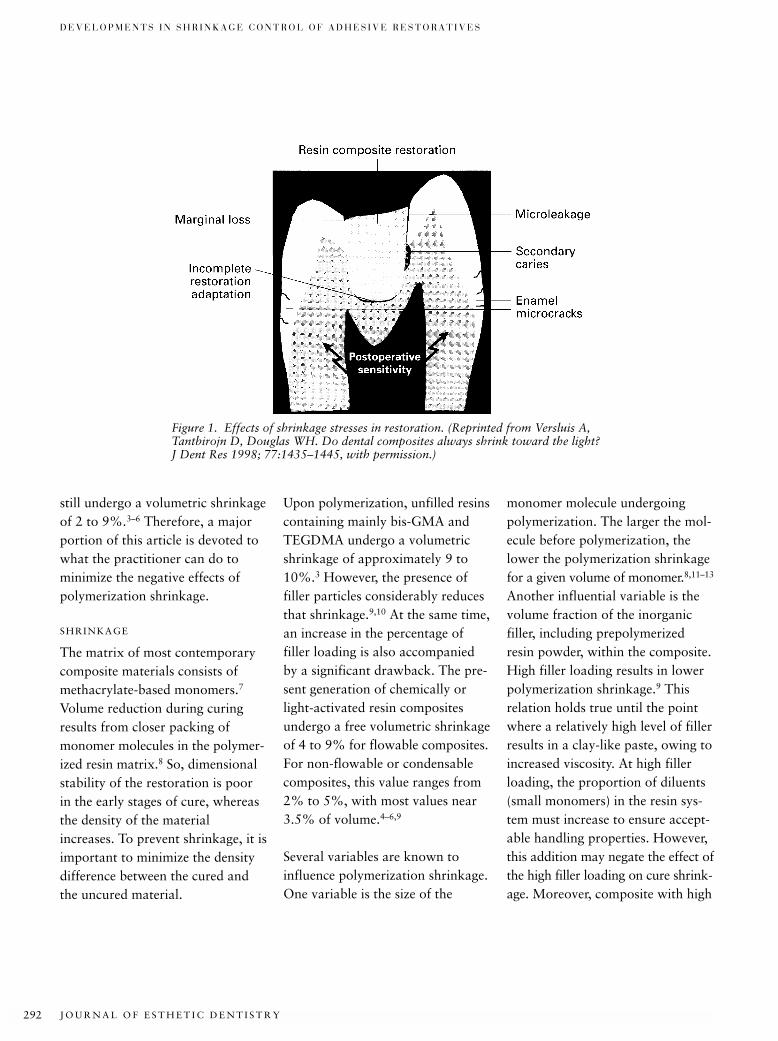
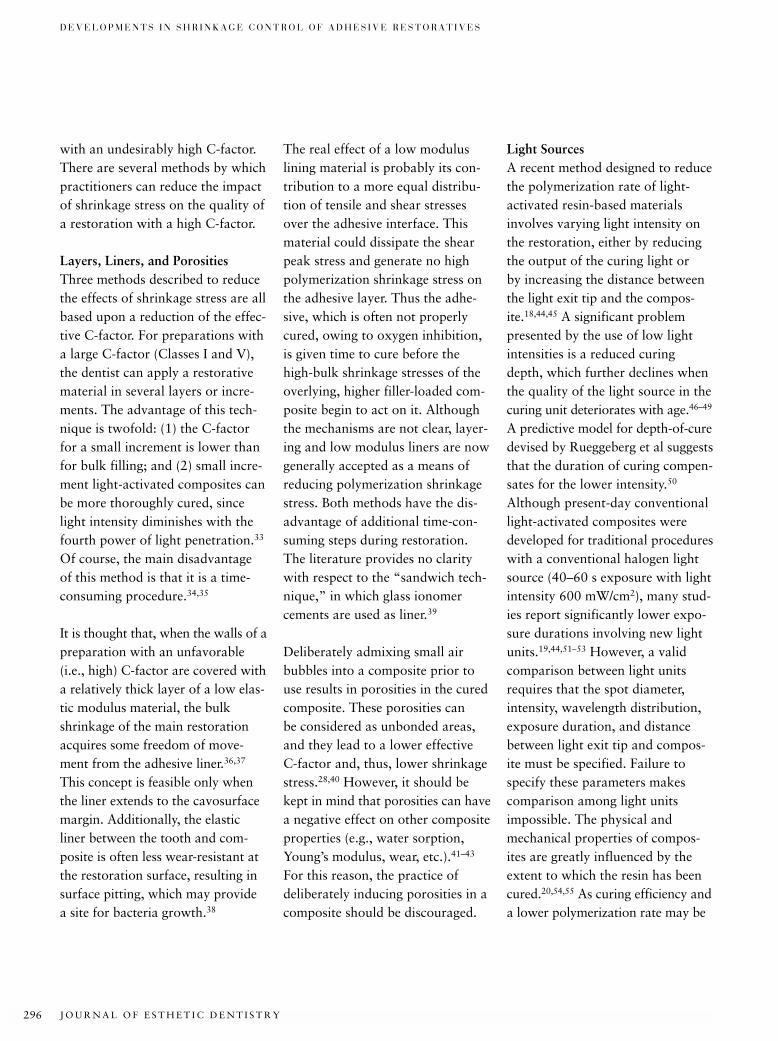
The ideal restoration has a tightseal with remaining tooth structure,since otherwise, bacteria and toxins
produced by bacteria can invadeand grow in the gap formed, result-ing in pulp irritation and even sec-ondary caries (Figure 1).1,2 Thisperfect adaptation must beobtained during curing and thenmaintained during thermal andmechanical cycling for the lifetimeof the restoration or of the patient.Currently no commercially avail-able resin composite guarantees anintact seal. Because the resin has no
anti-microbiologic activity, it isimportant that a restoration beplaced in such a way that the bestpossible marginal seal is obtained.
There are, however, many sideeffects that frustrate the goal of aperfectly sealed restoration. Mostof these effects are related to poly-merization shrinkage of the restora-tion during the curing process.Commercially available composites
*Department of Dental Materials Science, Academic Centre for Dentistry, Amsterdam, The Netherlands
Developments in Shrinkage Control of Adhesive Restoratives
BIBI S . DAUVILLIER, MSc*
MAXIM P. AARNTS, PhD*
ALBERT J . FEILZER, DDS, PhD*
ABSTRACT
Purpose: This article reviews material properties and application techniques important in mini-mizing effects of polymerization shrinkage during the curing reaction of resin composite restora-tive materials used in adhesive dentistry.
Materials and Methods: Relevant scientific publications were critically reviewed.
Results: Since it was recognized that shrinkage, which takes place during the curing reaction ofresin composite restorative materials, may cause severe problems in adhesive dentistry, consider-able effort has been put into reducing the negative effects. The most important problem is thedebonding of the restoration–tooth interface, resulting in increased microleakage and, ultimately,in secondary caries. Despite all efforts, there is still no material or general application methodthat guarantees a leak-proof and durable restoration.
CLINICAL SIGNIFICANCE
It is of the utmost importance that dental practitioners know how to deal with the problems relatedto resin composite shrinkage, so that they can choose the material and procedure most likely toproduce a leak-proof and durable restoration, maximizing the potential for clinical success.
(J Esthet Dent 12:291–299, 2000)
J O U R N A L O F E S T H E T I C D E N T I S T R Y292
D E V E L O P M E N T S I N S H R I N K A G E C O N T R O L O F A D H E S I V E R E S T O R A T I V E S
still undergo a volumetric shrinkageof 2 to 9%.3–6 Therefore, a majorportion of this article is devoted towhat the practitioner can do tominimize the negative effects ofpolymerization shrinkage.
SHRINKAGE
The matrix of most contemporarycomposite materials consists ofmethacrylate-based monomers.7
Volume reduction during curingresults from closer packing ofmonomer molecules in the polymer-ized resin matrix.8 So, dimensionalstability of the restoration is poorin the early stages of cure, whereasthe density of the materialincreases. To prevent shrinkage, it isimportant to minimize the densitydifference between the cured andthe uncured material.
Upon polymerization, unfilled resinscontaining mainly bis-GMA andTEGDMA undergo a volumetricshrinkage of approximately 9 to10%.3 However, the presence offiller particles considerably reducesthat shrinkage.9,10 At the same time,an increase in the percentage offiller loading is also accompaniedby a significant drawback. The pre-sent generation of chemically orlight-activated resin compositesundergo a free volumetric shrinkageof 4 to 9% for flowable composites.For non-flowable or condensablecomposites, this value ranges from2% to 5%, with most values near3.5% of volume.4–6,9
Several variables are known toinfluence polymerization shrinkage.One variable is the size of the
monomer molecule undergoingpolymerization. The larger the mol-ecule before polymerization, thelower the polymerization shrinkagefor a given volume of monomer.8,11–13
Another influential variable is thevolume fraction of the inorganicfiller, including prepolymerizedresin powder, within the composite.High filler loading results in lowerpolymerization shrinkage.9 Thisrelation holds true until the pointwhere a relatively high level of fillerresults in a clay-like paste, owing toincreased viscosity. At high fillerloading, the proportion of diluents(small monomers) in the resin sys-tem must increase to ensure accept-able handling properties. However,this addition may negate the effect ofthe high filler loading on cure shrink-age. Moreover, composite with high
Figure 1. Effects of shrinkage stresses in restoration. (Reprinted from Versluis A,Tantbirojn D, Douglas WH. Do dental composites always shrink toward the light?J Dent Res 1998; 77:1435–1445, with permission.)
D A U V I L L I E R E T A L
V O L U M E 1 2 , N U M B E R 6 , 2 0 0 0 293
filler loading results in a high degreeof stiffness, which ultimately causeshigh shrinkage stress. Finally, thenature of the resin undergoing poly-merization plays an important rolein shrinkage. Several research groupsare currently attempting to developnew resins that undergo less poly-merization shrinkage.14,15 Commer-cial development of these resinsmay be many years away, as theprocess of gaining acceptance bythe Food and Drug Administration(FDA) is time-consuming andexpensive. However, if such resinsultimately are developed, they willlargely eliminate the clinical conse-quences of polymerization shrink-age and will allow simple bulkplacement of the material.
STRESS
It should now be clear that shrink-age of resin composites, which upto now has been regarded asinevitable, must be controlled anddirected toward the preparationwalls, to prevent gap formation.However, as a result of adhesion to preparation walls, volumetricshrinkage is constrained. This con-straint, in combination with anincreasing modulus of elasticity,inevitably leads to development ofstress. Although loss of adhesionfrom the tooth structure can occur at any time, the most likelymoment is when the magnitude ofshrinkage stress exceeds the strengthof the developing restoration–tooth bond.
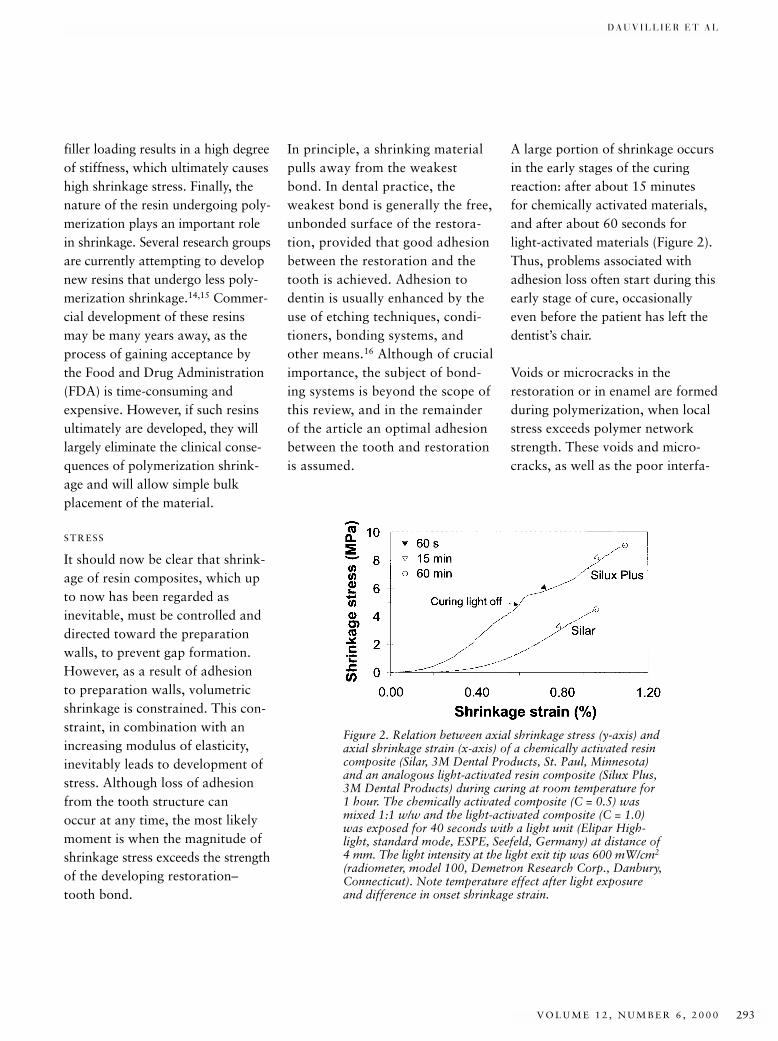
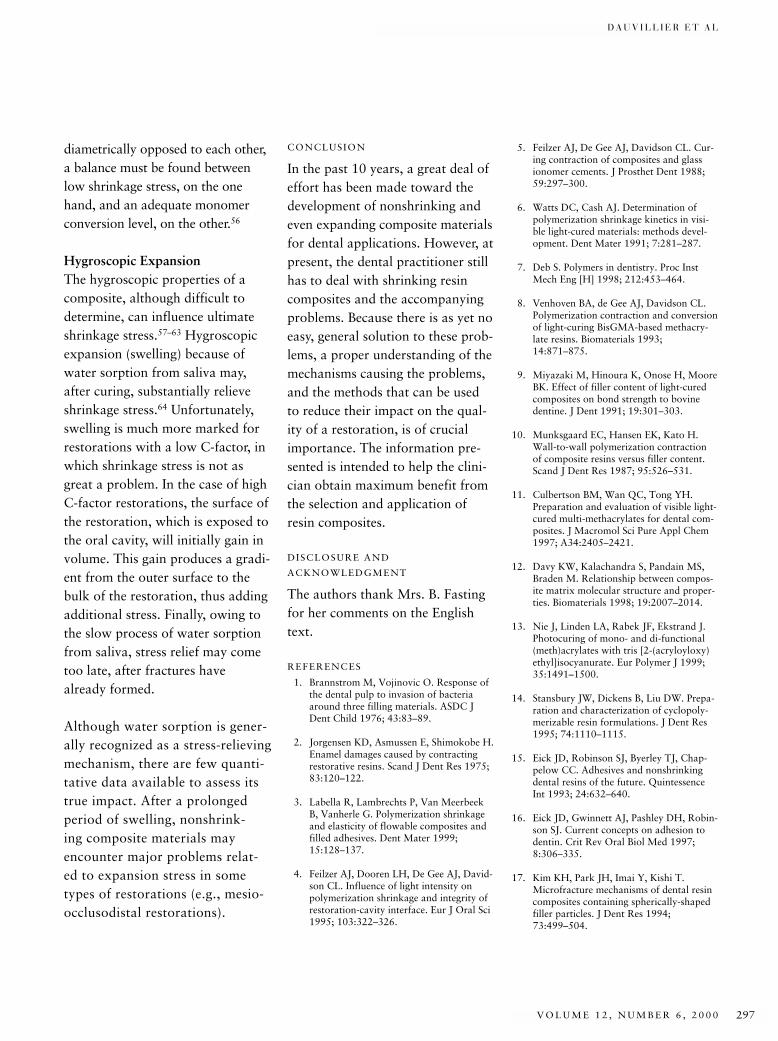
A large portion of shrinkage occursin the early stages of the curingreaction: after about 15 minutes for chemically activated materials,and after about 60 seconds forlight-activated materials (Figure 2).Thus, problems associated withadhesion loss often start during thisearly stage of cure, occasionallyeven before the patient has left thedentist’s chair.
Voids or microcracks in therestoration or in enamel are formedduring polymerization, when localstress exceeds polymer networkstrength. These voids and micro-cracks, as well as the poor interfa-
In principle, a shrinking materialpulls away from the weakest bond. In dental practice, the weakest bond is generally the free,unbonded surface of the restora-tion, provided that good adhesionbetween the restoration and thetooth is achieved. Adhesion todentin is usually enhanced by theuse of etching techniques, condi-tioners, bonding systems, andother means.16 Although of crucialimportance, the subject of bond-ing systems is beyond the scope ofthis review, and in the remainderof the article an optimal adhesionbetween the tooth and restorationis assumed.
Figure 2. Relation between axial shrinkage stress (y-axis) andaxial shrinkage strain (x-axis) of a chemically activated resincomposite (Silar, 3M Dental Products, St. Paul, Minnesota)and an analogous light-activated resin composite (Silux Plus,3M Dental Products) during curing at room temperature for1 hour. The chemically activated composite (C = 0.5) wasmixed 1:1 w/w and the light-activated composite (C = 1.0)was exposed for 40 seconds with a light unit (Elipar High-light, standard mode, ESPE, Seefeld, Germany) at distance of4 mm. The light intensity at the light exit tip was 600 mW/cm2
(radiometer, model 100, Demetron Research Corp., Danbury,Connecticut). Note temperature effect after light exposureand difference in onset shrinkage strain.
J O U R N A L O F E S T H E T I C D E N T I S T R Y294
D E V E L O P M E N T S I N S H R I N K A G E C O N T R O L O F A D H E S I V E R E S T O R A T I V E S
cial adhesion between filler andmatrix, can encourage cohesiverestoration fractures.17
STRESS RELIEF
Two factors have a major impacton the ultimate stress level of therestoration: the chemical and physi-cal properties of a material and theway a material is handled during itsapplication. The properties of ma-terials are largely determined by themanufacturer, although a practi-tioner can influence those proper-ties to some extent. For example, adentist can alter the ratio of a two-paste system or use special curinglights and light-curing proceduresthat affect polymerization rate anddegree of conversion.18–20 Obvi-ously, this manipulation will alsoinfluence the final material proper-ties. The choice of a specific mater-ial, application method, or type ofrestoration can also have an impacton the ultimate quality of therestoration. This statement impliesthat practitioners must have consid-erable material expertise if they areto make a well-informed decision infavor of a particular material orapplication method.
Chemical and Physical PropertiesFor minimal impact on the integrityof a restored tooth, stress develop-ment must be minimized. One pos-sible solution would be a reductionin the amount of polymerizationshrinkage. Changing the chemicaland physical properties of compos-
ite materials in such a way thatshrinkage stress is no longer a prob-lem is primarily the concern ofthose developing new resin compos-ite materials. The development ofnonshrinking materials (shrinkagelower than 0.4% of volume) mightbe a solution, but unfortunatelythere is no nonshrinking materialon the market that can compete onall levels with conventional com-posite materials.15,21–23 Moreover,the solution of one problem mightvery well create a new one (e.g.,water sorption after curing mightfrustrate the high expectations of anonshrinking material).
Another approach to reduce shrink-age stress is to modify the resincomposition so that the polymeriza-tion rate is lowered without influ-encing the degree of conversion. Aslow polymerization rate may beexpected to increase the ability ofthe material to flow without dam-aging its internal structure. In arestorative material with increasedflow capacity, the volume changeattributable to shrinkage is com-pensated by material flow from theunbonded, outer surface, ultimatelyresulting in lower stress. Resin com-posites can be chemically modifiedto reduce the polymerization rate invarious ways. Use of less reactiveresins is one possibility,24 but thismethod may have a negative effecton degree of conversion, resultingin more residual, unreactedmonomer remaining in the cured
composite. Addition of retardativeagents requires a careful choice ofbiocompatible chemicals.25 Reduc-ing the amount of initiator systemcomponents requires no otherchemicals than those already usedin current systems.26,27 However, abalance must be found between alow reaction rate, on the one hand,and adequate conversion of themonomers, on the other hand. Inall probability, the best way toobtain a lower polymerization ratein light-activated resin composites,together with a sufficiently highconversion, is by developing newinitiator systems.
Flow or Viscoelastic BehaviorThe solutions to stress reductionpreviously mentioned are mainly ofinterest to researchers and manu-facturers of composites. However,the dentist has to deal with a widevariety of commercial products.Although materials differ inmonomer composition, concentra-tion of initiating system and fillertype, size, loading, coating, resincomposites can be divided into twogeneral groups on the basis of poly-merization rate: light-activated andchemically activated composites.Light-activated resin composites arepopular among dentists becausethey can be cured on command.However, it has been demonstratedthat, under the same conditions,light-activated composites generatehigher polymerization shrinkagestress and more exothermic heat than
D A U V I L L I E R E T A L
V O L U M E 1 2 , N U M B E R 6 , 2 0 0 0 295
the analogous chemically activatedcomposites.28,29 The dental literaturehas given considerable attention toa variety of methods designedspecifically for light-activated resincomposites, to reduce internalstresses in the restored tooth.30
During the early stages of polymer-ization, monomers are mainly con-verted into polymeric chains. Aftera certain degree of conversion hasbeen attained, the predominantreaction is the cross-linking of thepolymeric chains, resulting in astrong polymeric network.31
Although during the chain-growingperiod material viscosity rapidlyincreases, the polymeric chains canstill slide along one another torelieve stress. This polymer chainmovement is referred to as viscousflow behavior. When the cross-link-ing reaction becomes predominant,
there is no longer the ability of indi-vidual polymer chains to slide. Atthis stage, usually denoted as thepost-gel phase, the polymeric chainsreach sufficient modulus of elastic-ity to develop a strong, rigid visco-elastic material. Any further com-posite shrinkage will generatemechanical stress in the restoration.When adhesion survives the stress,microcracks or, in severe cases,voids can be generated in the visco-elastic material.
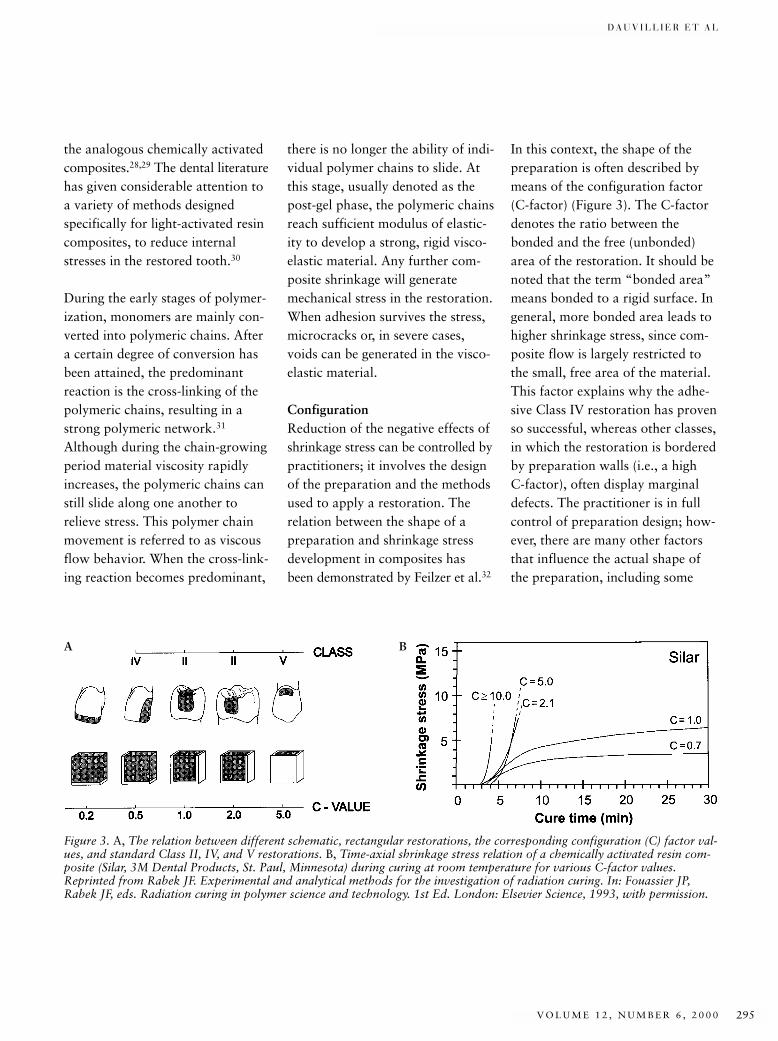
ConfigurationReduction of the negative effects ofshrinkage stress can be controlled bypractitioners; it involves the designof the preparation and the methodsused to apply a restoration. Therelation between the shape of apreparation and shrinkage stressdevelopment in composites hasbeen demonstrated by Feilzer et al.32
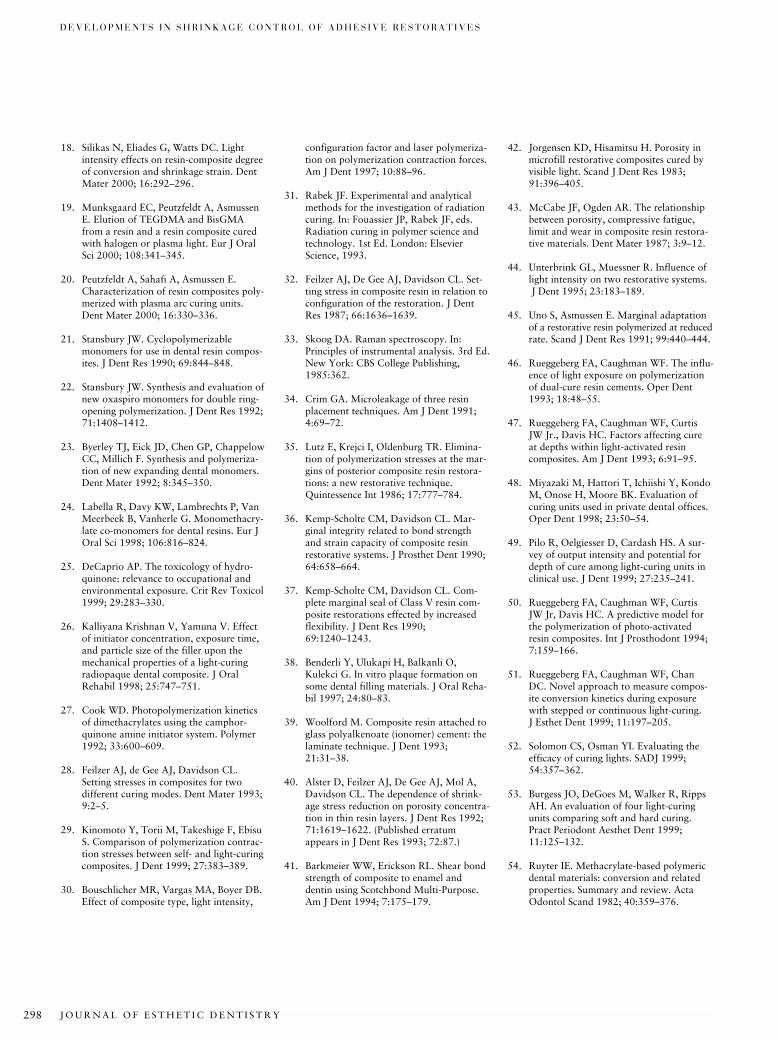
In this context, the shape of thepreparation is often described bymeans of the configuration factor(C-factor) (Figure 3). The C-factordenotes the ratio between thebonded and the free (unbonded)area of the restoration. It should benoted that the term “bonded area”means bonded to a rigid surface. Ingeneral, more bonded area leads tohigher shrinkage stress, since com-posite flow is largely restricted tothe small, free area of the material.This factor explains why the adhe-sive Class IV restoration has provenso successful, whereas other classes,in which the restoration is borderedby preparation walls (i.e., a highC-factor), often display marginaldefects. The practitioner is in fullcontrol of preparation design; how-ever, there are many other factorsthat influence the actual shape ofthe preparation, including some
Figure 3. A, The relation between different schematic, rectangular restorations, the corresponding configuration (C) factor val-ues, and standard Class II, IV, and V restorations. B, Time-axial shrinkage stress relation of a chemically activated resin com-posite (Silar, 3M Dental Products, St. Paul, Minnesota) during curing at room temperature for various C-factor values.Reprinted from Rabek JF. Experimental and analytical methods for the investigation of radiation curing. In: Fouassier JP,Rabek JF, eds. Radiation curing in polymer science and technology. 1st Ed. London: Elsevier Science, 1993, with permission.
A B
J O U R N A L O F E S T H E T I C D E N T I S T R Y296
D E V E L O P M E N T S I N S H R I N K A G E C O N T R O L O F A D H E S I V E R E S T O R A T I V E S
with an undesirably high C-factor.There are several methods by whichpractitioners can reduce the impactof shrinkage stress on the quality ofa restoration with a high C-factor.
Layers, Liners, and PorositiesThree methods described to reducethe effects of shrinkage stress are allbased upon a reduction of the effec-tive C-factor. For preparations witha large C-factor (Classes I and V),the dentist can apply a restorativematerial in several layers or incre-ments. The advantage of this tech-nique is twofold: (1) the C-factorfor a small increment is lower thanfor bulk filling; and (2) small incre-ment light-activated composites canbe more thoroughly cured, sincelight intensity diminishes with thefourth power of light penetration.33
Of course, the main disadvantageof this method is that it is a time-consuming procedure.34,35
It is thought that, when the walls of apreparation with an unfavorable(i.e., high) C-factor are covered witha relatively thick layer of a low elas-tic modulus material, the bulkshrinkage of the main restorationacquires some freedom of move-ment from the adhesive liner.36,37
This concept is feasible only whenthe liner extends to the cavosurfacemargin. Additionally, the elasticliner between the tooth and com-posite is often less wear-resistant atthe restoration surface, resulting insurface pitting, which may provide a site for bacteria growth.38
The real effect of a low moduluslining material is probably its con-tribution to a more equal distribu-tion of tensile and shear stressesover the adhesive interface. Thismaterial could dissipate the shearpeak stress and generate no highpolymerization shrinkage stress onthe adhesive layer. Thus the adhe-sive, which is often not properlycured, owing to oxygen inhibition,is given time to cure before thehigh-bulk shrinkage stresses of theoverlying, higher filler-loaded com-posite begin to act on it. Althoughthe mechanisms are not clear, layer-ing and low modulus liners are nowgenerally accepted as a means ofreducing polymerization shrinkagestress. Both methods have the dis-advantage of additional time-con-suming steps during restoration.The literature provides no claritywith respect to the “sandwich tech-nique,” in which glass ionomercements are used as liner.39
Deliberately admixing small airbubbles into a composite prior touse results in porosities in the curedcomposite. These porosities can be considered as unbonded areas,and they lead to a lower effectiveC-factor and, thus, lower shrinkagestress.28,40 However, it should bekept in mind that porosities can havea negative effect on other compositeproperties (e.g., water sorption,Young’s modulus, wear, etc.).41–43
For this reason, the practice ofdeliberately inducing porosities in acomposite should be discouraged.
Light SourcesA recent method designed to reducethe polymerization rate of light-activated resin-based materialsinvolves varying light intensity onthe restoration, either by reducingthe output of the curing light or by increasing the distance between the light exit tip and the compos-ite.18,44,45 A significant problem presented by the use of low lightintensities is a reduced curingdepth, which further declines whenthe quality of the light source in thecuring unit deteriorates with age.46–49
A predictive model for depth-of-curedevised by Rueggeberg et al suggeststhat the duration of curing compen-sates for the lower intensity.50
Although present-day conventionallight-activated composites weredeveloped for traditional procedureswith a conventional halogen lightsource (40–60 s exposure with lightintensity 600 mW/cm2), many stud-ies report significantly lower expo-sure durations involving new lightunits.19,44,51–53 However, a validcomparison between light unitsrequires that the spot diameter,intensity, wavelength distribution,exposure duration, and distancebetween light exit tip and compos-ite must be specified. Failure tospecify these parameters makescomparison among light unitsimpossible. The physical andmechanical properties of compos-ites are greatly influenced by theextent to which the resin has beencured.20,54,55 As curing efficiency anda lower polymerization rate may be
D A U V I L L I E R E T A L
V O L U M E 1 2 , N U M B E R 6 , 2 0 0 0 297
diametrically opposed to each other,a balance must be found betweenlow shrinkage stress, on the onehand, and an adequate monomerconversion level, on the other.56
Hygroscopic ExpansionThe hygroscopic properties of acomposite, although difficult todetermine, can influence ultimateshrinkage stress.57–63 Hygroscopicexpansion (swelling) because ofwater sorption from saliva may,after curing, substantially relieveshrinkage stress.64 Unfortunately,swelling is much more marked forrestorations with a low C-factor, inwhich shrinkage stress is not asgreat a problem. In the case of highC-factor restorations, the surface ofthe restoration, which is exposed tothe oral cavity, will initially gain involume. This gain produces a gradi-ent from the outer surface to thebulk of the restoration, thus addingadditional stress. Finally, owing tothe slow process of water sorptionfrom saliva, stress relief may cometoo late, after fractures havealready formed.
Although water sorption is gener-ally recognized as a stress-relievingmechanism, there are few quanti-tative data available to assess itstrue impact. After a prolongedperiod of swelling, nonshrink-ing composite materials mayencounter major problems relat-ed to expansion stress in some types of restorations (e.g., mesio-occlusodistal restorations).
CONCLUSION
In the past 10 years, a great deal ofeffort has been made toward thedevelopment of nonshrinking andeven expanding composite materialsfor dental applications. However, atpresent, the dental practitioner stillhas to deal with shrinking resincomposites and the accompanyingproblems. Because there is as yet noeasy, general solution to these prob-lems, a proper understanding of themechanisms causing the problems,and the methods that can be usedto reduce their impact on the qual-ity of a restoration, is of crucialimportance. The information pre-sented is intended to help the clini-cian obtain maximum benefit fromthe selection and application ofresin composites.
DISCLOSURE AND
ACKNOWLEDGMENT
The authors thank Mrs. B. Fastingfor her comments on the Englishtext.
REFERENCES
1. Brannstrom M, Vojinovic O. Response ofthe dental pulp to invasion of bacteriaaround three filling materials. ASDC JDent Child 1976; 43:83–89.
2. Jorgensen KD, Asmussen E, Shimokobe H.Enamel damages caused by contractingrestorative resins. Scand J Dent Res 1975;83:120–122.
3. Labella R, Lambrechts P, Van MeerbeekB, Vanherle G. Polymerization shrinkageand elasticity of flowable composites andfilled adhesives. Dent Mater 1999;15:128–137.
4. Feilzer AJ, Dooren LH, De Gee AJ, David-son CL. Influence of light intensity onpolymerization shrinkage and integrity ofrestoration-cavity interface. Eur J Oral Sci1995; 103:322–326.
5. Feilzer AJ, De Gee AJ, Davidson CL. Cur-ing contraction of composites and glassionomer cements. J Prosthet Dent 1988;59:297–300.
6. Watts DC, Cash AJ. Determination ofpolymerization shrinkage kinetics in visi-ble light-cured materials: methods devel-opment. Dent Mater 1991; 7:281–287.
7. Deb S. Polymers in dentistry. Proc InstMech Eng [H] 1998; 212:453–464.
8. Venhoven BA, de Gee AJ, Davidson CL.Polymerization contraction and conversionof light-curing BisGMA-based methacry-late resins. Biomaterials 1993;14:871–875.
9. Miyazaki M, Hinoura K, Onose H, MooreBK. Effect of filler content of light-curedcomposites on bond strength to bovinedentine. J Dent 1991; 19:301–303.
10. Munksgaard EC, Hansen EK, Kato H.Wall-to-wall polymerization contractionof composite resins versus filler content.Scand J Dent Res 1987; 95:526–531.
11. Culbertson BM, Wan QC, Tong YH.Preparation and evaluation of visible light-cured multi-methacrylates for dental com-posites. J Macromol Sci Pure Appl Chem1997; A34:2405–2421.
12. Davy KW, Kalachandra S, Pandain MS,Braden M. Relationship between compos-ite matrix molecular structure and proper-ties. Biomaterials 1998; 19:2007–2014.
13. Nie J, Linden LA, Rabek JF, Ekstrand J.Photocuring of mono- and di-functional(meth)acrylates with tris [2-(acryloyloxy)ethyl]isocyanurate. Eur Polymer J 1999;35:1491–1500.
14. Stansbury JW, Dickens B, Liu DW. Prepa-ration and characterization of cyclopoly-merizable resin formulations. J Dent Res1995; 74:1110–1115.
15. Eick JD, Robinson SJ, Byerley TJ, Chap-pelow CC. Adhesives and nonshrinkingdental resins of the future. QuintessenceInt 1993; 24:632–640.
16. Eick JD, Gwinnett AJ, Pashley DH, Robin-son SJ. Current concepts on adhesion todentin. Crit Rev Oral Biol Med 1997;8:306–335.
17. Kim KH, Park JH, Imai Y, Kishi T.Microfracture mechanisms of dental resincomposites containing spherically-shapedfiller particles. J Dent Res 1994;73:499–504.
J O U R N A L O F E S T H E T I C D E N T I S T R Y298
D E V E L O P M E N T S I N S H R I N K A G E C O N T R O L O F A D H E S I V E R E S T O R A T I V E S
18. Silikas N, Eliades G, Watts DC. Lightintensity effects on resin-composite degreeof conversion and shrinkage strain. DentMater 2000; 16:292–296.
19. Munksgaard EC, Peutzfeldt A, AsmussenE. Elution of TEGDMA and BisGMAfrom a resin and a resin composite curedwith halogen or plasma light. Eur J OralSci 2000; 108:341–345.
20. Peutzfeldt A, Sahafi A, Asmussen E. Characterization of resin composites poly-merized with plasma arc curing units.Dent Mater 2000; 16:330–336.
21. Stansbury JW. Cyclopolymerizablemonomers for use in dental resin compos-ites. J Dent Res 1990; 69:844–848.
22. Stansbury JW. Synthesis and evaluation ofnew oxaspiro monomers for double ring-opening polymerization. J Dent Res 1992;71:1408–1412.
23. Byerley TJ, Eick JD, Chen GP, ChappelowCC, Millich F. Synthesis and polymeriza-tion of new expanding dental monomers.Dent Mater 1992; 8:345–350.
24. Labella R, Davy KW, Lambrechts P, VanMeerbeek B, Vanherle G. Monomethacry-late co-monomers for dental resins. Eur JOral Sci 1998; 106:816–824.
25. DeCaprio AP. The toxicology of hydro-quinone: relevance to occupational andenvironmental exposure. Crit Rev Toxicol1999; 29:283–330.
26. Kalliyana Krishnan V, Yamuna V. Effectof initiator concentration, exposure time,and particle size of the filler upon themechanical properties of a light-curingradiopaque dental composite. J Oral Rehabil 1998; 25:747–751.
27. Cook WD. Photopolymerization kineticsof dimethacrylates using the camphor-quinone amine initiator system. Polymer1992; 33:600–609.
28. Feilzer AJ, de Gee AJ, Davidson CL. Setting stresses in composites for two different curing modes. Dent Mater 1993;9:2–5.
29. Kinomoto Y, Torii M, Takeshige F, EbisuS. Comparison of polymerization contrac-tion stresses between self- and light-curingcomposites. J Dent 1999; 27:383–389.
30. Bouschlicher MR, Vargas MA, Boyer DB.Effect of composite type, light intensity,
configuration factor and laser polymeriza-tion on polymerization contraction forces.Am J Dent 1997; 10:88–96.
31. Rabek JF. Experimental and analyticalmethods for the investigation of radiationcuring. In: Fouassier JP, Rabek JF, eds.Radiation curing in polymer science andtechnology. 1st Ed. London: Elsevier Science, 1993.
32. Feilzer AJ, De Gee AJ, Davidson CL. Set-ting stress in composite resin in relation toconfiguration of the restoration. J DentRes 1987; 66:1636–1639.
33. Skoog DA. Raman spectroscopy. In: Principles of instrumental analysis. 3rd Ed.New York: CBS College Publishing,1985:362.
34. Crim GA. Microleakage of three resinplacement techniques. Am J Dent 1991;4:69–72.
35. Lutz E, Krejci I, Oldenburg TR. Elimina-tion of polymerization stresses at the mar-gins of posterior composite resin restora-tions: a new restorative technique.Quintessence Int 1986; 17:777–784.
36. Kemp-Scholte CM, Davidson CL. Mar-ginal integrity related to bond strength and strain capacity of composite resinrestorative systems. J Prosthet Dent 1990;64:658–664.
37. Kemp-Scholte CM, Davidson CL. Com-plete marginal seal of Class V resin com-posite restorations effected by increasedflexibility. J Dent Res 1990;69:1240–1243.
38. Benderli Y, Ulukapi H, Balkanli O,Kulekci G. In vitro plaque formation onsome dental filling materials. J Oral Reha-bil 1997; 24:80–83.
39. Woolford M. Composite resin attached toglass polyalkenoate (ionomer) cement: thelaminate technique. J Dent 1993;21:31–38.
40. Alster D, Feilzer AJ, De Gee AJ, Mol A,Davidson CL. The dependence of shrink-age stress reduction on porosity concentra-tion in thin resin layers. J Dent Res 1992;71:1619–1622. (Published erratumappears in J Dent Res 1993; 72:87.)
41. Barkmeier WW, Erickson RL. Shear bondstrength of composite to enamel anddentin using Scotchbond Multi-Purpose.Am J Dent 1994; 7:175–179.
42. Jorgensen KD, Hisamitsu H. Porosity inmicrofill restorative composites cured byvisible light. Scand J Dent Res 1983;91:396–405.
43. McCabe JF, Ogden AR. The relationshipbetween porosity, compressive fatigue,limit and wear in composite resin restora-tive materials. Dent Mater 1987; 3:9–12.
44. Unterbrink GL, Muessner R. Influence oflight intensity on two restorative systems.J Dent 1995; 23:183–189.
45. Uno S, Asmussen E. Marginal adaptationof a restorative resin polymerized at reducedrate. Scand J Dent Res 1991; 99:440–444.
46. Rueggeberg FA, Caughman WF. The influ-ence of light exposure on polymerizationof dual-cure resin cements. Oper Dent1993; 18:48–55.
47. Rueggeberg FA, Caughman WF, CurtisJW Jr., Davis HC. Factors affecting cure at depths within light-activated resin composites. Am J Dent 1993; 6:91–95.
48. Miyazaki M, Hattori T, Ichiishi Y, KondoM, Onose H, Moore BK. Evaluation ofcuring units used in private dental offices.Oper Dent 1998; 23:50–54.
49. Pilo R, Oelgiesser D, Cardash HS. A sur-vey of output intensity and potential fordepth of cure among light-curing units inclinical use. J Dent 1999; 27:235–241.
50. Rueggeberg FA, Caughman WF, CurtisJW Jr, Davis HC. A predictive model forthe polymerization of photo-activatedresin composites. Int J Prosthodont 1994;7:159–166.
51. Rueggeberg FA, Caughman WF, ChanDC. Novel approach to measure compos-ite conversion kinetics during exposurewith stepped or continuous light-curing. J Esthet Dent 1999; 11:197–205.
52. Solomon CS, Osman YI. Evaluating theefficacy of curing lights. SADJ 1999;54:357–362.
53. Burgess JO, DeGoes M, Walker R, RippsAH. An evaluation of four light-curingunits comparing soft and hard curing.Pract Periodont Aesthet Dent 1999;11:125–132.
54. Ruyter IE. Methacrylate-based polymericdental materials: conversion and relatedproperties. Summary and review. ActaOdontol Scand 1982; 40:359–376.
D A U V I L L I E R E T A L
V O L U M E 1 2 , N U M B E R 6 , 2 0 0 0 299
55. Asmussen E. Factors affecting the quantityof remaining double bonds in restorativeresin polymers. Scand J Dent Res 1982;90:490–496.
56. Ferracane JL, Greener EH. The effect ofresin formulation on the degree of conver-sion and mechanical properties of dentalrestorative resins. J Biomed Mater Res1986; 20:121–131.
57. Pearson GJ. Long-term water sorption and solubility of composite filling materials.J Dent 1979; 7:64–68.
58. Hansen EK. Visible light-cured compositeresins: polymerization contraction, con-traction pattern and hygroscopic expan-sion. Scand J Dent Res 1982; 90:329–335.
59. Bowen RL, Rapson JE, Dickson G. Hard-ening shrinkage and hygroscopic expan-sion of composite resins. J Dent Res 1982;61:654–658.
60. Feilzer AJ, Kakaboura AI, de Gee AJ,Davidson CL. The influence of water sorp-tion on the development of setting shrink-age stress in traditional and resin-modifiedglass ionomer cements. Dent Mater 1995;11:186–190.
61. Fan PL, Edahl A, Leung RL, Stanford JW.Alternative interpretations of water sorp-tion values of composite resins. J Dent Res 1985; 64:78–80.
62. Hirasawa T, Hirano S, Hirabayashi S,Harashima I, Aizawa M. Initial dimen-sional change of composites in dry and wetconditions. J Dent Res 1983; 62:28–31.
63. Soderholm KJ. Water sorption in abis(GMA)/TEGDMA resin. J BiomedMater Res 1984; 18:271–279.
64. Feilzer AJ, de Gee AJ, Davidson CL.Relaxation of polymerization contractionshear stress by hygroscopic expansion. J Dent Res 1990; 69:36–39.
65. Versluis A, Tantbirojn D, Douglas WH.Do dental composites always shrinktoward the light? J Dent Res 1998;77:1435–1445. (Comments)
Reprint address: Albert J. Feilzer, Department of Dental Material Science, Academic Centre for Dentistry Amsterdam,Louwesweg 1, NL-1066 EA Amsterdam,The Netherlands; e-mail: [email protected]©2000 BC Decker Inc
J O U R N A L O F E S T H E T I C D E N T I S T R Y300
The introduction of photopoly-merization to dentistry began
nearly coincident with the commer-cialization of this technology in thelate 1960s. Initially, ultraviolet(UV)-cured pit and fissure sealantswere put into clinical practice,1
and soon thereafter, adhesive andrestorative applications of light-cured materials followed.2 Sincethat time, photoactivated dentalmaterials have stayed current withand contributed to state-of-the-artadvancements in photopolymeriza-tion technology. A variety of photo-curable dental products, such as
sealants, adhesives, dentures, andimpression materials, have beendeveloped. However, the primaryapplication of this technique is seenin composite restoratives. Nuva Fil(Dentsply, York, Pennsylvania) wasintroduced in 1972. It did not takelong for dental practitioners toaccept the modification to chemicallycured composites that were based ona two-paste benzoyl peroxide-amineinitiator system. This new technol-ogy offered significant advantages:(1) a single-paste system requiringno mixing and (2) complete opera-tor control over working time with
a rapid cure commencing on com-mand. Along with these benefitscame the need to develop newrestorative placement techniques,mainly the use of multiple (incre-mental) layers to place largerestorations, since the photopoly-merization of early generation com-posites had serious limitations withrespect to depth of cure.3 Alsorelated to curing efficiency, theshade of composite material beingplaced as well as the day-to-dayvariation in output intensity of thecuring lamp were other clinicallyrelevant concerns raised with the
*University of Colorado Health Sciences Center, School of Dentistry, Aurora, Colorado
Curing Dental Resins and Composites by Photopolymerization
JEFFREY W. STANSBURY, PHD*
ABSTRACT
The development and continued evolution of photopolymerizable dental materials, particularlydental composite restoratives, represent a significant, practical advance for dentistry. The highlysuccessful integration of the light-activated curing process for dental applications is described inthis review. The basic mechanisms by which the photoinitiators efficiently convert monomers intopolymers are discussed along with the variety of factors that influence the photopolymerizationprocess. The conventional camphorquinone-amine visible light photoinitiator system used inmost dental restorative materials is illustrated in addition to some alternative initiator systemsthat have been studied for dental materials applications.
CLINICAL SIGNIFICANCE
Photopolymerization has become an integral component of the practice of dentistry. A betterappreciation of the photopolymerization process as well as its potential and limitations may aidthe dentist in the delivery of both esthetic and restorative dental care.
( J Esthet Dent 12:300–308, 2000)
S T A N S B U R Y
V O L U M E 1 2 , N U M B E R 6 , 2 0 0 0 301
advent of photopolymerization indental practice. By the 1980s, theoriginal UV-curable materials,based on benzoin methyl ether orother UV active photoinitiators,were reformulated to incorporatenew visible light wavelength initia-tors. The uniform change to visiblelight initiation within the dentalmaterials industry avoided prob-lems of UV-promoted tissue dam-age, as well as concerns of ophthal-mologic damage to practitioners.4,5
PHOTOINITIATION
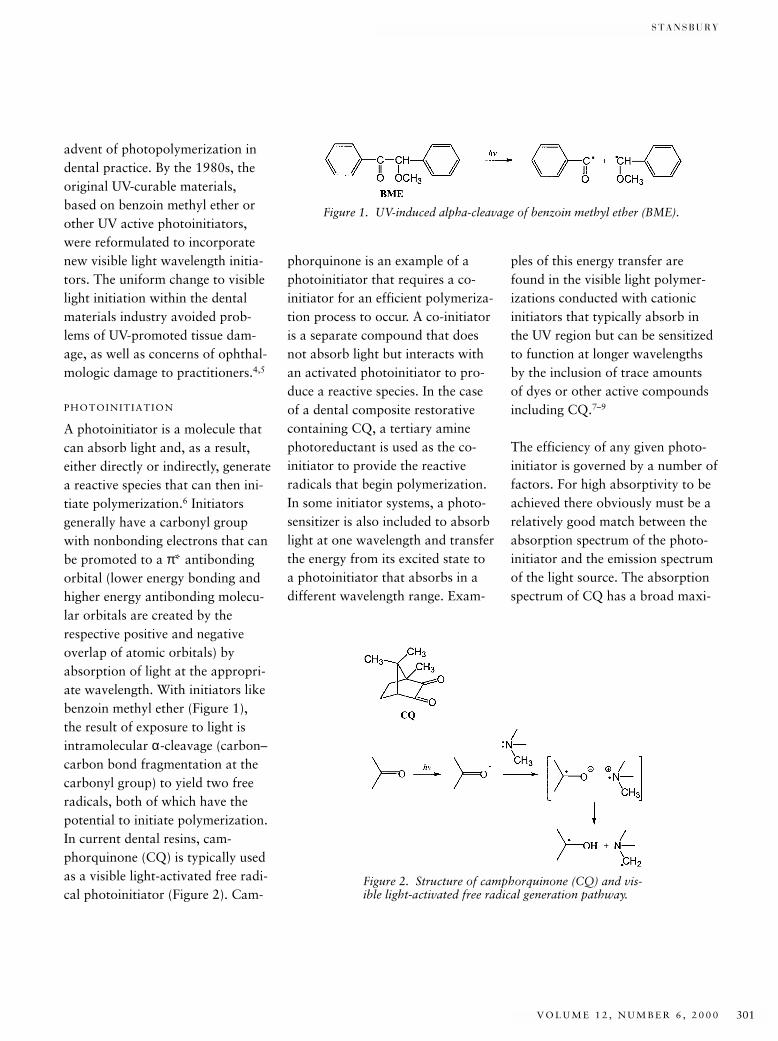
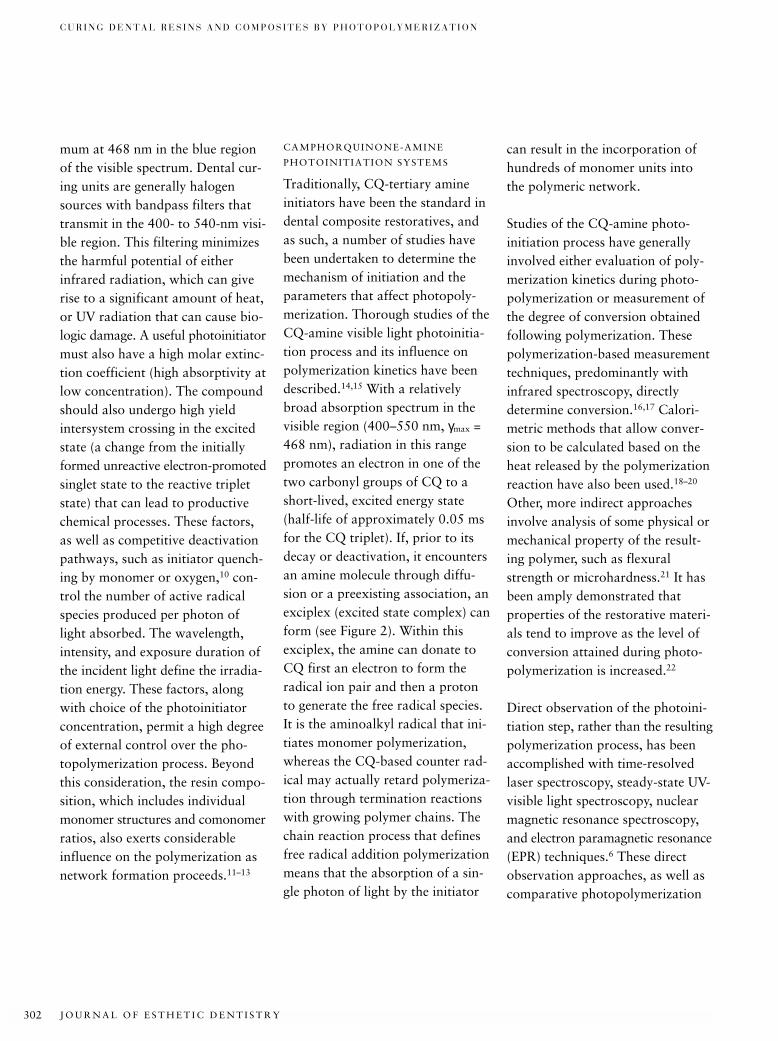
A photoinitiator is a molecule thatcan absorb light and, as a result,either directly or indirectly, generatea reactive species that can then ini-tiate polymerization.6 Initiatorsgenerally have a carbonyl groupwith nonbonding electrons that canbe promoted to a π* antibondingorbital (lower energy bonding andhigher energy antibonding molecu-lar orbitals are created by therespective positive and negativeoverlap of atomic orbitals) byabsorption of light at the appropri-ate wavelength. With initiators likebenzoin methyl ether (Figure 1), the result of exposure to light isintramolecular α-cleavage (carbon–carbon bond fragmentation at thecarbonyl group) to yield two freeradicals, both of which have thepotential to initiate polymerization.In current dental resins, cam-phorquinone (CQ) is typically usedas a visible light-activated free radi-cal photoinitiator (Figure 2). Cam-
phorquinone is an example of aphotoinitiator that requires a co-initiator for an efficient polymeriza-tion process to occur. A co-initiatoris a separate compound that doesnot absorb light but interacts withan activated photoinitiator to pro-duce a reactive species. In the caseof a dental composite restorativecontaining CQ, a tertiary aminephotoreductant is used as the co-initiator to provide the reactive radicals that begin polymerization.In some initiator systems, a photo-sensitizer is also included to absorblight at one wavelength and transferthe energy from its excited state toa photoinitiator that absorbs in adifferent wavelength range. Exam-
ples of this energy transfer arefound in the visible light polymer-izations conducted with cationicinitiators that typically absorb inthe UV region but can be sensitizedto function at longer wavelengthsby the inclusion of trace amounts of dyes or other active compoundsincluding CQ.7–9
The efficiency of any given photo-initiator is governed by a number offactors. For high absorptivity to beachieved there obviously must be arelatively good match between theabsorption spectrum of the photo-initiator and the emission spectrumof the light source. The absorptionspectrum of CQ has a broad maxi-
Figure 1. UV-induced alpha-cleavage of benzoin methyl ether (BME).
Figure 2. Structure of camphorquinone (CQ) and vis-ible light-activated free radical generation pathway.
J O U R N A L O F E S T H E T I C D E N T I S T R Y302
C U R I N G D E N T A L R E S I N S A N D C O M P O S I T E S B Y P H O T O P O L Y M E R I Z A T I O N
mum at 468 nm in the blue regionof the visible spectrum. Dental cur-ing units are generally halogensources with bandpass filters thattransmit in the 400- to 540-nm visi-ble region. This filtering minimizesthe harmful potential of eitherinfrared radiation, which can giverise to a significant amount of heat,or UV radiation that can cause bio-logic damage. A useful photoinitiatormust also have a high molar extinc-tion coefficient (high absorptivity atlow concentration). The compoundshould also undergo high yieldintersystem crossing in the excitedstate (a change from the initiallyformed unreactive electron-promotedsinglet state to the reactive tripletstate) that can lead to productivechemical processes. These factors,as well as competitive deactivationpathways, such as initiator quench-ing by monomer or oxygen,10 con-trol the number of active radicalspecies produced per photon oflight absorbed. The wavelength,intensity, and exposure duration ofthe incident light define the irradia-tion energy. These factors, alongwith choice of the photoinitiatorconcentration, permit a high degreeof external control over the pho-topolymerization process. Beyondthis consideration, the resin compo-sition, which includes individualmonomer structures and comonomerratios, also exerts considerableinfluence on the polymerization asnetwork formation proceeds.11–13
CAMPHORQUINONE-AMINE
PHOTOINITIATION SYSTEMS
Traditionally, CQ-tertiary amineinitiators have been the standard indental composite restoratives, andas such, a number of studies havebeen undertaken to determine themechanism of initiation and theparameters that affect photopoly-merization. Thorough studies of theCQ-amine visible light photoinitia-tion process and its influence onpolymerization kinetics have beendescribed.14,15 With a relativelybroad absorption spectrum in thevisible region (400–550 nm, γmax =468 nm), radiation in this rangepromotes an electron in one of thetwo carbonyl groups of CQ to ashort-lived, excited energy state(half-life of approximately 0.05 msfor the CQ triplet). If, prior to itsdecay or deactivation, it encountersan amine molecule through diffu-sion or a preexisting association, anexciplex (excited state complex) canform (see Figure 2). Within thisexciplex, the amine can donate toCQ first an electron to form theradical ion pair and then a protonto generate the free radical species.It is the aminoalkyl radical that ini-tiates monomer polymerization,whereas the CQ-based counter rad-ical may actually retard polymeriza-tion through termination reactionswith growing polymer chains. Thechain reaction process that definesfree radical addition polymerizationmeans that the absorption of a sin-gle photon of light by the initiator
can result in the incorporation ofhundreds of monomer units intothe polymeric network.
Studies of the CQ-amine photo-initiation process have generallyinvolved either evaluation of poly-merization kinetics during photo-polymerization or measurement ofthe degree of conversion obtainedfollowing polymerization. Thesepolymerization-based measurementtechniques, predominantly withinfrared spectroscopy, directlydetermine conversion.16,17 Calori-metric methods that allow conver-sion to be calculated based on theheat released by the polymerizationreaction have also been used.18–20
Other, more indirect approachesinvolve analysis of some physical ormechanical property of the result-ing polymer, such as flexuralstrength or microhardness.21 It hasbeen amply demonstrated thatproperties of the restorative materi-als tend to improve as the level ofconversion attained during photo-polymerization is increased.22
Direct observation of the photoini-tiation step, rather than the resultingpolymerization process, has beenaccomplished with time-resolvedlaser spectroscopy, steady-state UV-visible light spectroscopy, nuclearmagnetic resonance spectroscopy,and electron paramagnetic resonance(EPR) techniques.6 These directobservation approaches, as well ascomparative photopolymerization
S T A N S B U R Y
V O L U M E 1 2 , N U M B E R 6 , 2 0 0 0 303
studies, show that the structure ofthe amine photoreductant usedwith CQ has a dramatic effect onthe efficacy of the initiating system.A wide variety of aromatic andaliphatic amines have been com-pared for their initiating potentialwith CQ.14,23 Aromatic tertiaryamines were found to be somewhatmore reactive co-initiators than thealiphatic counterparts.15 Work withchemically cured initiator systems(benzoyl peroxide-amine) demon-strated that aromatic amines wereclearly more effective than aliphaticamines.24 However, tertiary aliphaticamines, predominantly the copoly-merizable N,N-dimethylaminoethylmethacrylate, are widely used in thephotoinitiator systems of commer-cial dental restorative materials.Conversely, primary amines, whichbear active hydrogens, function asinhibitors of the photopolymeriza-tion process. The effect of theCQ:amine ratio on initiator effi-ciency has been examined by themeasurement of conversion inunfilled resins. At a fixed CQ con-centration, it was found that con-version increased monotonically toapproximately a 1:2 or 1:3 molarratio of CQ to amine and thenplateaued with additional amine.25
A separate study showed that CQlevels at mole fractions betweenapproximately 0.5% and 1.0%provided full conversion, whereashigher CQ concentrations gave noadditional improvements and yieldeddiscolored polymer specimens.26,27
PHOTOPOLYMERIZATION IN
DENTISTRY
The use of EPR techniques to studyphotopolymerization is particularlyappropriate since they providemethods to directly monitor freeradical population throughout thepolymerization process.28 Duringthe initial stages, radical concentra-tion increases rapidly and reachesan essentially steady-state conditionwhere new radical production isbalanced by radical terminationprocesses. In one such investigation,the irradiation time necessary toachieve maximum radical forma-tion was determined as a functionof specimen thickness.29 An expo-nential increase in irradiation timewas necessary to ensure maximalconversion as composite thicknessincreased. Using a standard dentalcuring unit, a 2-mm-thick compos-ite specimen required approxi-mately 100 seconds to reach a max-imum radical concentration. OtherEPR-based studies, which also con-cluded that typically used exposuredurations are not sufficient toachieve maximum radical produc-tion, demonstrated the long-termpersistence of radicals that becometrapped in the glassy polymericmatrix.30,31 Lifetimes of thesetrapped radicals are directly relatedto the stiffness of the polymeric net-work and can vary from hours tomonths. The fillers used in compos-ite restoratives appear to signifi-cantly enhance the decay of trappedradicals. Diffusion of oxygen
through the polymer can result inconversion of the highly reactivecarbon-based radicals to relativelystable hydroperoxides, which insufficient concentrations can alterbulk properties of the polymer.12
Diffusion of oxygen into theexposed resin or composite surfaceas polymerization proceeds resultsin quenching of both initiator andpolymer-based radical species and isresponsible for the poorly polymer-ized, air-inhibited surface layer.32
Another consequence of radicalstrapped within polymers is the pro-tracted post-cure, or additionalconversion, that continues afterirradiation is ended. The majorityof potential conversion that can beattained with a given resin compo-sition is achieved during the firstfew minutes after irradiation; how-ever, significant increases in bothconversion and, particularly, theevolution of polymer properties are observed up to and beyond 24 hours.21 This post-cure processcan be greatly facilitated by theapplication of heat, which increasesmobility within the polymeric net-work and allows free monomer andpendant chains to encounterremaining radical sites and reactfurther.22 Thus, resin-based materialsfor indirect restorative applicationsare typically photocured at elevatedtemperatures or are given a postir-radiation heat treatment to achievemaximum conversion and physicalproperties. The effect of delaying
J O U R N A L O F E S T H E T I C D E N T I S T R Y304
C U R I N G D E N T A L R E S I N S A N D C O M P O S I T E S B Y P H O T O P O L Y M E R I Z A T I O N
the time between the irradiationstep and the post-cure heating hasbeen studied as a demonstration ofthe effect of trapped radicals on thecontinuation of the curingprocess.33,34 It has also been shownthat resins with higher concentra-tions of low viscosity diluentmonomers, such as triethylene glycol dimethacrylate (TEGDMA),reach higher immediate degrees ofconversion, but have less additionalconversion during the post-cureinterval than do resins that containless diluent co-monomer.35,36
For direct filling materials, the temperature differential generatedduring photopolymerization canbecome a clinical concern. Factors,including the wavelength, intensity,and exposure duration as well asrestoration composition and geom-etry, affect the temperature rise thatcan be expected. The vinyl additionpolymerization reaction is exother-mic by approximately 55 kJ/mol,based on the methacrylate func-tional groups.19 Compounding thiseffect, certain curing lights canimpart a significant thermal rise,owing simply to the absorbed pho-ton energy. Inclusion of substantialamounts of inert filler in compos-ites essentially mitigates the poten-tial exothermic response by dilutingthe reactive group density of theresin and serving as a heat sink. Arecent study involving conventionaldental curing lights has demon-strated temperature deviations atthe cavity floor between 3°C and
7°C during photocuring of 2-mmthick commercial composite speci-mens.37 It appeared that a majorityof the temperature elevationobserved was attributable to directenergy input from the light sourcesused and not from the exothermicheat of the polymerization reaction.
The photopolymerization process in dental composites is complicatedby the presence of inorganic fillersof various particle sizes, which canrange in from approximately 0.04 µmto 10 µm depending on the mater-ial.38 A reasonably close refractiveindex match between the resinmatrix and the filler is an importantfactor to achieve efficient lightthroughput as well as yielding esthet-ically pleasing translucent polymer-ized composites.39,40 Since refractiveindex of the resin shifts to a signifi-cantly higher value as the polymer-ization occurs, light transmission isaffected.41 Light interacts with fillerparticles, resulting in absorption andscattering that significantly attenu-ates the irradiation intensity reachingdeeper portions of the composite.Microfilled resins allow less lightpenetration than hybrid and smallparticle-filled products.42
The effects of variation in irradia-tion wavelength and exposure dura-tion on the polymerization effi-ciency of CQ-amine-activated resincomposites have been investigated.43
Over the range of intensities associ-ated with conventional dental cur-ing lamps, a spectral output that
overlaps a significant portion of theCQ absorption range was found tobe more efficient than a narrowirradiation band focused at the wave-length of the CQ absorption maxi-mum. Comparisons of photopoly-merization conversion achieved withequal light flux but varied intensities(short-duration exposure at highintensity compared with long-duration exposure at low intensity)demonstrated that modest to mod-erate increases in conversion wereassociated with higher light intensi-ties.44 Other studies have focused onthe depth of cure of composites oron the significant differences inphysical properties noted as a func-tion of depth.45 In nearly everyinstance, even with extended irradi-ation intervals, a discrepancy isobserved between properties, suchas microhardness, measured at theupper and lower surfaces of typicallaboratory specimens. In addition,absorption of light of the effectivewavelength by the initiator in theupper region of the composite actsas a filter for the light being trans-mitted to the lower boundary of thematerial. Therefore, delays of greaterthan 40 seconds have been observedbetween the onset of irradiation andthe transmission of light of the activewavelength from a 2-mm-thick com-posite specimen.46
ALTERNATIVE PHOTOINITIATOR
SYSTEMS
Variations in visible light photoini-tiator formulations for use in dentalmaterials have been introduced in
S T A N S B U R Y
V O L U M E 1 2 , N U M B E R 6 , 2 0 0 0 305
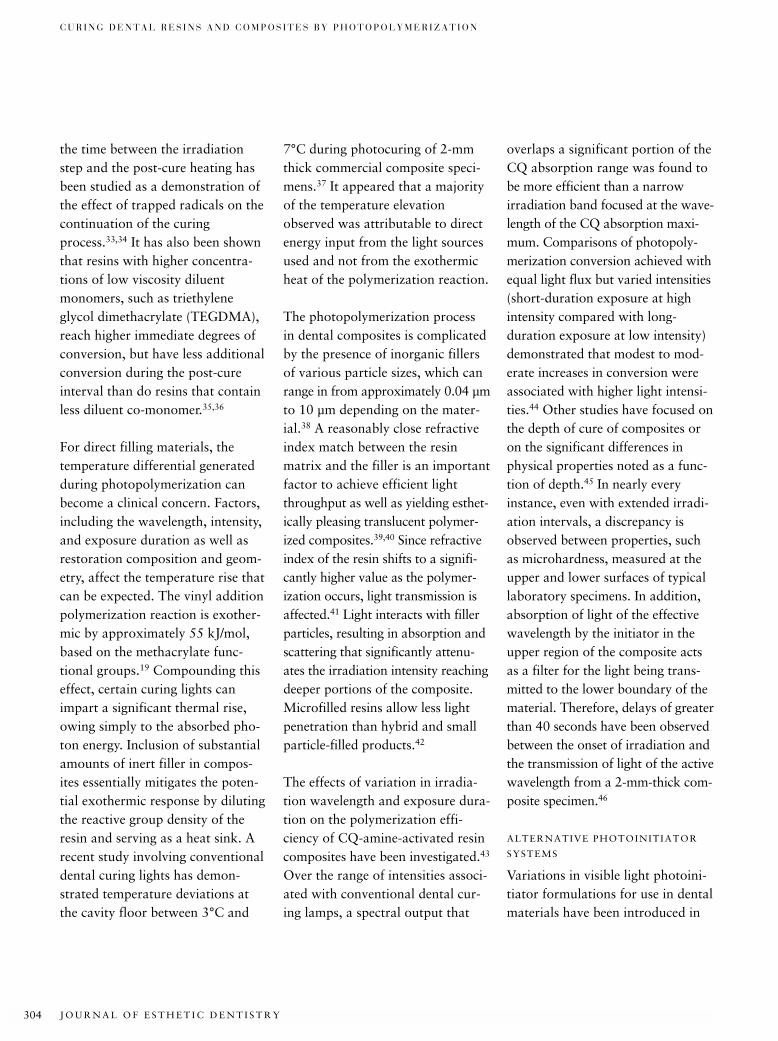
efforts to enhance photopolymer-ization efficiency. New initiatorsmay potentially provide higherdegrees of conversion or faster curerates with minimal light exposureand reduced initiator concentration.A simple alteration that can be madeis addition of peroxide co-initiatorsto the CQ photoinitiator.47 In con-trast to the increased cure rates notedwith additives such as di-t-butylperoxide, addition of more stablehydroperoxide components in theexperimental photoinitiator systemdecreased polymerization rates. Asanother modification to the conven-tional CQ-amine initiator system,addition of 1-phenyl-1,2-propane-dione (PPD) has been examined(Figure 3).48 Because the absorptionmaximum of PPD occurs at 410 nm,the polymers produced were lessyellow than those prepared withonly CQ as the initiator. A decreasein initiator-related discolorationafter photocuring is clinicallyimportant in obtaining and main-taining an acceptable match of arestoration with adjacent toothstructure. The synergistic combina-tion of PPD with CQ allows higherdegrees of conversion to beachieved compared with only theCQ-amine initiator. The observedbenefits may be attributable to thegeneration of free radicals from twodistinctly different initiation mecha-nisms: proton abstraction with CQ-amine and direct intramolecularcleavage with PPD. Extensive studieswere conducted on the use of alde-hydes or diketones as reactive
ingredients in photoinitiated dentalresins.49 Thus, substantial propor-tions of propionaldehyde (PA) and2,3-butanedione (BD) additivesenhanced conversion and improvedmechanical properties with respect tothe baseline materials with a chain-transfer mechanism proposed toaccount for the results (see Figure 3).
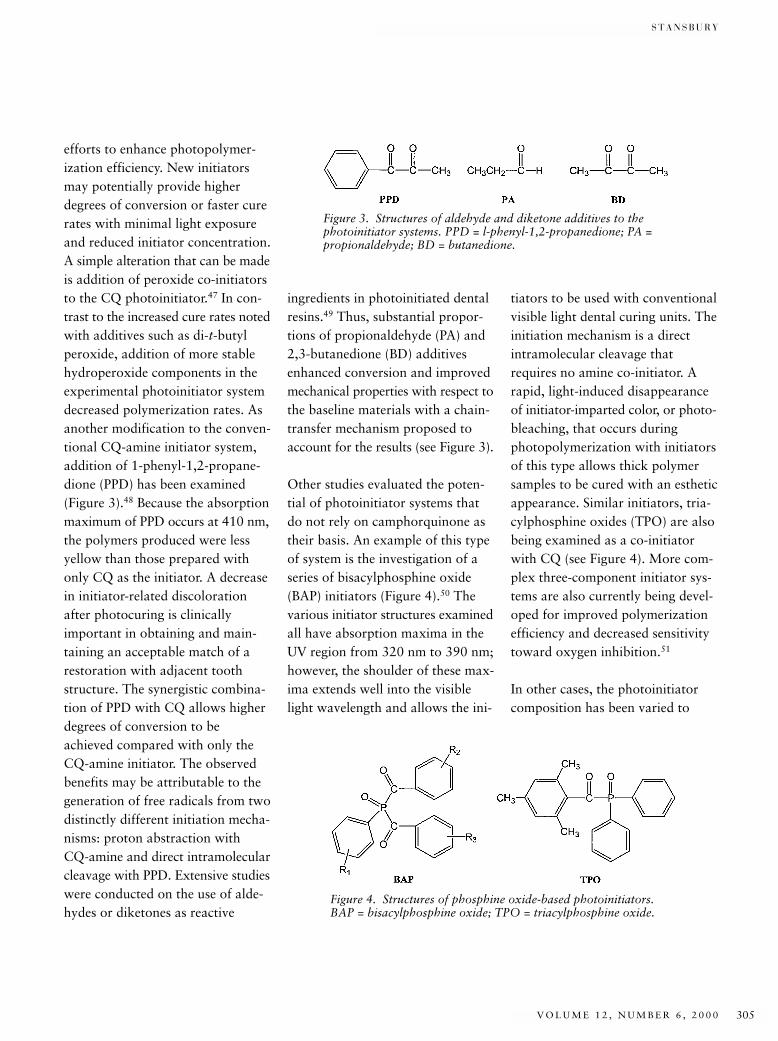
Other studies evaluated the poten-tial of photoinitiator systems thatdo not rely on camphorquinone astheir basis. An example of this typeof system is the investigation of aseries of bisacylphosphine oxide(BAP) initiators (Figure 4).50 Thevarious initiator structures examinedall have absorption maxima in theUV region from 320 nm to 390 nm;however, the shoulder of these max-ima extends well into the visiblelight wavelength and allows the ini-
tiators to be used with conventionalvisible light dental curing units. Theinitiation mechanism is a directintramolecular cleavage thatrequires no amine co-initiator. Arapid, light-induced disappearanceof initiator-imparted color, or photo-bleaching, that occurs duringphotopolymerization with initiatorsof this type allows thick polymersamples to be cured with an estheticappearance. Similar initiators, tria-cylphosphine oxides (TPO) are alsobeing examined as a co-initiatorwith CQ (see Figure 4). More com-plex three-component initiator sys-tems are also currently being devel-oped for improved polymerizationefficiency and decreased sensitivitytoward oxygen inhibition.51
In other cases, the photoinitiatorcomposition has been varied to
Figure 3. Structures of aldehyde and diketone additives to thephotoinitiator systems. PPD = l-phenyl-1,2-propanedione; PA =propionaldehyde; BD = butanedione.
Figure 4. Structures of phosphine oxide-based photoinitiators.BAP = bisacylphosphine oxide; TPO = triacylphosphine oxide.
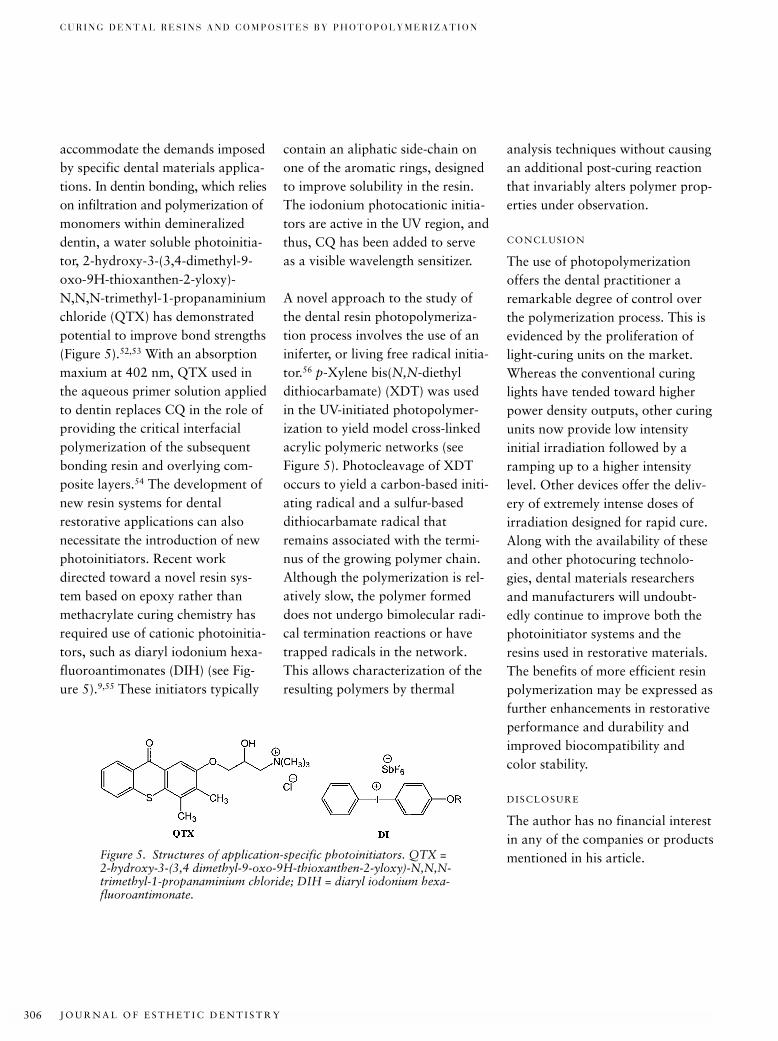
J O U R N A L O F E S T H E T I C D E N T I S T R Y306
C U R I N G D E N T A L R E S I N S A N D C O M P O S I T E S B Y P H O T O P O L Y M E R I Z A T I O N
accommodate the demands imposedby specific dental materials applica-tions. In dentin bonding, which relieson infiltration and polymerization ofmonomers within demineralizeddentin, a water soluble photoinitia-tor, 2-hydroxy-3-(3,4-dimethyl-9-oxo-9H-thioxanthen-2-yloxy)-N,N,N-trimethyl-1-propanaminiumchloride (QTX) has demonstratedpotential to improve bond strengths(Figure 5).52,53 With an absorptionmaxium at 402 nm, QTX used inthe aqueous primer solution appliedto dentin replaces CQ in the role ofproviding the critical interfacialpolymerization of the subsequentbonding resin and overlying com-posite layers.54 The development ofnew resin systems for dentalrestorative applications can alsonecessitate the introduction of newphotoinitiators. Recent workdirected toward a novel resin sys-tem based on epoxy rather thanmethacrylate curing chemistry hasrequired use of cationic photoinitia-tors, such as diaryl iodonium hexa-fluoroantimonates (DIH) (see Fig-ure 5).9,55 These initiators typically
contain an aliphatic side-chain onone of the aromatic rings, designedto improve solubility in the resin.The iodonium photocationic initia-tors are active in the UV region, andthus, CQ has been added to serveas a visible wavelength sensitizer.
A novel approach to the study ofthe dental resin photopolymeriza-tion process involves the use of aniniferter, or living free radical initia-tor.56 p-Xylene bis(N,N-diethyldithiocarbamate) (XDT) was usedin the UV-initiated photopolymer-ization to yield model cross-linkedacrylic polymeric networks (see Figure 5). Photocleavage of XDToccurs to yield a carbon-based initi-ating radical and a sulfur-baseddithiocarbamate radical thatremains associated with the termi-nus of the growing polymer chain.Although the polymerization is rel-atively slow, the polymer formeddoes not undergo bimolecular radi-cal termination reactions or havetrapped radicals in the network.This allows characterization of theresulting polymers by thermal
analysis techniques without causingan additional post-curing reactionthat invariably alters polymer prop-erties under observation.
CONCLUSION
The use of photopolymerizationoffers the dental practitioner aremarkable degree of control overthe polymerization process. This isevidenced by the proliferation oflight-curing units on the market.Whereas the conventional curinglights have tended toward higherpower density outputs, other curingunits now provide low intensity initial irradiation followed by aramping up to a higher intensitylevel. Other devices offer the deliv-ery of extremely intense doses ofirradiation designed for rapid cure.Along with the availability of theseand other photocuring technolo-gies, dental materials researchersand manufacturers will undoubt-edly continue to improve both thephotoinitiator systems and theresins used in restorative materials.The benefits of more efficient resinpolymerization may be expressed asfurther enhancements in restorativeperformance and durability andimproved biocompatibility andcolor stability.
DISCLOSURE
The author has no financial interestin any of the companies or productsmentioned in his article.Figure 5. Structures of application-specific photoinitiators. QTX =
2-hydroxy-3-(3,4 dimethyl-9-oxo-9H-thioxanthen-2-yloxy)-N,N,N-trimethyl-1-propanaminium chloride; DIH = diaryl iodonium hexa-fluoroantimonate.
S T A N S B U R Y
V O L U M E 1 2 , N U M B E R 6 , 2 0 0 0 307
REFERENCES
1. Buonocore MG. Adhesive sealing of pitsand fissures for carries prevention, withuse of ultraviolet light. J Am Dent Assoc1970; 80:324–328.
2. Rock WP. The use of UV radiation in den-tistry. Br Dent J 1974; 136:455–458.
3. Cook WD. Factors affecting the depth ofcure of UV-polymerized composites. J DentRes 1980; 59:800–808.
4. Gange RW, Rosen CF. UVA effects onmammalian skin and cells. PhotochemPhotobiol 1986; 43:701–705.
5. Ham WT, Mueller HA, Sliney DH. Retinalsensitivity to damage from short wave-length light. Nature 1976; 260:153–155.
6. Fouassier JP. Photoinitiation, photopoly-merization and photocuring: fundamentalsand applications. Munich: Carl HanserVerlag, 1995.
7. Crivello JV, Lam JHW. Dye-sensitizedphotoinitiated cationic polymerization. J Polym Sci Polym Chem Ed 1978;16:2441–2451.
8. Bi Y, Neckers DC. A visible light initiatingsystem for free radical promoted cationicpolymerization. Macromolecules 1994;27:3683–3693.
9. Chappelow CC, Pinzino CS, Jeang L, Har-ris CD, Holder AJ, Eick JD. Photoreactiv-ity of expanding monomers and epoxy-based matrix resin systems. J Appl PolymSci 2000; 76:1715–1724.
10. Rueggeberg FA, Margeson DH. The effectof oxygen inhibition on an unfilled/filledcomposite system. J Dent Res 1990;69:1652–1658.
11. Reed BB, Choi KM, Dickens SH, Stans-bury JW. Effect of resin composition onkinetics of dimethacrylate photopolymer-ization. Polym Prepr (Am Chem Soc)1997; 38:108–109.
12. Lovell LG, Berchtold KA, Elliott JE, Lu H,Bowman CN. Understanding the kineticsand network formation of dimethacrylatedental resins. Polym Adv Technol. (Accepted).
13. Stansbury JW, Dickens SH. Network forma-tion and compositional drift during photo-initiated copolymerization of dimethacrylatemonomers. Polymer. (Submitted)
14. Cook WD. Photopolymerization kineticsof dimethacrylates using the camphor-quinone amine initiator system. Polymer1992; 33:600–609.
15. Mateo JL, Bosch P, Lozano AE. Reactivityof radicals derived from dimethylanilinesin acrylic photopolymerization. Macro-molecules 1994; 27:7794–7799.
16. Ruyter IE, Gyorosi PP. Infrared spectro-scopic study of sealants. Scand J Dent Res1976; 84:396–400.
17. Ruyter IE, Svendsen SA. Remainingmethacrylate groups in composite restora-tive materials. Acta Odontol Scand 1978;36:75–82.
18. Antonucci JM, Toth EE. Extent of poly-merization of dental resins by differentialscanning calorimetry. J Dent Res 1983;23:704–707.
19. Miyazaki K, Horibe T. Polymerization ofmultifunctional methacrylates and acry-lates. J Biomed Mater Res 1988;22:1011–1022.
20. Urabe H, Wakasa K, Yamaki M. Cureperformance of multifunctional monomersto photo-initiators: a thermoanalyticalstudy on bis-GMA-based resins. J MaterSci 1991; 26:3185–3190.
21. Leung RL, Fan PL, Johnston WM. Post-irradiation polymerization of visible-lightactivated composite resin. J Dent Res1983; 62:363–365.
22. Ferracane JL, Condon JR. Postcure heat-treatments for composites: properties andfractography. Dent Mater 1992;8:290–295.
23. Kerby RE, Tiba A, Culbertson BM,Schricker S, Knobloch L. Evaluation oftertiary amine co-intiators using differen-tial scanning photocalorimetry. J Macro-mol Sci, Pure Appl Chem 1999;36:1227–1239.
24. Antonucci JM, Peckoo RJ, Schruhl C,Toth EE. Slow-acting amine polymeriza-tion accelerators: para-dimethylaminoben-zoic acid and its ethyl ester. J Dent Res1981; 60:1325–1331.
25. Yoshida K, Greener EH. Effects of twoamine reducing agents on the degree ofconversion and physical properties of anunfilled light-cured resin. Dent Mater1993; 9:246–251.
26. Venhoven BAM, de Gee AJ, Davidson CL.Light initiation of dental resins: dynamicsof the polymerization. Biomaterials 1996;17:2313–2318.
27. Yoshida K, Greener EH. Effect of photo-initiator on degree of conversion ofunfilled light-cured resin. J Dent 1994;22:296–299.
28. Lapcik L, Jancar J, Stasko A, Saha P. Electron paramagnetic resonance study of free-radical kinetics in ultaviolet light-cured dimethacrylate copolymers. J MaterSci, Mater Med 1998; 9:257–262.
29. Sustercic D, Cevc P, Funduk N, Pintar MM.Determination of curing time in visible light-cured composite resins of different thicknessby electron paramagnetic resonance. JMater Sci, Mater Med 1997; 8:507–510.
30. Burtscher P. Stability of radicals in curedcomposite materials. Dent Mater 1993;9:218–221.
31. Ottaviani MF, Fiorini A, Mason PN, Corvaja C. Electron spin-resonance studiesof dental composites: effects of irradiationtime, decay over time, pulverization, andtemperature variations. Dent Mater 1992;8:118–124.
32. Finger WJ, Lee KS, Podszun W. Monomerswith low oxygen inhibition as enamel/dentin adhesives. Dent Mater 1996;12:256–261.
33. Loza-Herrero MA, Rueggeberg FA,Caughman WF, Schuster GS, Lefebvre CA,Gardner FM. Effect of heating delay onconversion and strength of a post-curedresin composite. J Dent Res 1988;77:426–431.
34. Eliades GC, Vougioklakis CG, CaputoAA. Degree of double bond conversion inlight-cured composites. Dent Mater 1987;3:19–25.
35. Kildal KK, Ruyter IE. How different cur-ing methods affect the degree of conver-sion of resin-based inlay/onlay materials.Acta Odontol Scand 1994; 52:315–322.
36. Tarumi H, Imazato S, Ehara A, Kato S, EbiN, Ebisu S. Post-irradiation polymerizationof composites containing bis-GMA andTEGDMA. Dent Mater 1999; 15:238–242.
37. Shortall AC, Harrington E. Temperaturerise during polymerization of light-activatedresin composites. J Oral Rehabil 1998;25:908–913.
J O U R N A L O F E S T H E T I C D E N T I S T R Y308
C U R I N G D E N T A L R E S I N S A N D C O M P O S I T E S B Y P H O T O P O L Y M E R I Z A T I O N
38. Vanherle G, Lambrechts P, Bream M.Overview of the clinical requirements forposterior composites. In: Vanherle G,Smith DC, eds. Posterior composite resinrestorative materials. Minneapolis: Minnesota Mining and Mfg. Co., 1985.
39. Ferracane JL. Current trends in dentalcomposites. Crit Rev Oral Biol Med 1995;6:302–318.
40. Stansbury JW, Antonucci JM. Dimethacry-late monomers with varied fluorine con-tents and distributions. Dent Mater 1999;15:166–173.
41. Patel MP, Davy KWM, Braden M. Refrac-tive-index and molar refraction ofmethacrylate monomers and polymers.Biomaterials 1992; 13:643–645.
42. Kawaguchi M, Fukushima T, Miyazaki K.The relationship between cure depth andtransmission coefficient of visible light-activated resin composites. J Dent Res1994; 73:516–521.
43. Nomoto R. Effect of light wavelength onpolymerization of light-cured resins. DentMater J 1997; 16:60–73.
44. Kloosterboer JG, Lijten GFCM, BootsHMJ. Network formation by chaincrosslinking photopolymerization andsome applications in electronics. Makro-mol Chem, Macromol Symp 1989;24:223–230.
45. Swartz ML, Phillips RW, Rhodes B. Visi-ble light-activated resins: depth of cure. J Am Dent Assoc 1983; 106:634–637.
46. Harrington E, Wilson HJ, Shortall AC.Light-activated restorative materials: amethod of determining effective radiationtimes. J Oral Rehabil 1996; 23:210–218.
47. Nie J, Andrzejewska E, Rabek JF, et al.Effect of peroxides and hydroperoxides onthe camphorquinone-initiated photopoly-merization. Macromol Chem Phys 1999;200:1692–1701.
48. Park YJ, Chae KH, Rawls HR. Develop-ment of a new photoinitiation system fordental light-cure composite resins. DentMater 1999; 15:120–127.
49. Peutzfeldt A, Asmussen E. Effect ofpropanal and diacetyl on quantity ofremaining double bonds of chemicallycured BisGMA/TEGDMA resins. Eur JOral Sci 1996; 104:309–312.
50. Guggenberger R, Lechner G, WeinmannW. Bisacylphosphine oxides as photoini-tiators in dental materials. Polym Prepr(Am Chem Soc) 1997; 38:105–106.
51. Padon KS, Scranton AB. The effect of oxygen on the three-component radicalphotoinitiator system: methylene blue, N-methyldiethanolamine, anddiphenyliodonium chloride. J Polym Sci,Polym Chem Ed 2000; 38:3336–3346.
52. Hayakawa T, Horie K. Effect of water-soluble photoinitiator on the adhesionbetween composite and tooth substrate.Dent Mater 1992; 8:351–353.
53. Hayakawa T, Kikutake K, Nemoto K.Effectiveness of the addition of water-
soluble photoinitiator into the self-etchingprimers on the adhesion of a resin com-posite to polished dentin and enamel. Dent Mater J 1999; 18:324–333.
54. Imai Y, Kadoma Y, Kojima K, Akimoto T,Ikakura K, Otha T. Importance of poly-merization initiator systems and interfacialinitiation of polymerization in adhesivebonding of resin to dentin. J Dent Res1991; 70:1088–1091.
55. Tilbrook DA, Clarke RL, Howle NE,Braden M. Photocurable epoxy-polyolmatrices for use in dental composite I. Bio-materials 2000; 21:1743–1753.
56. Kannurpatti AR, Anseth JW, BowmanCN. A study of the evolution of mechani-cal properties and structural heterogeneityof polymer networks formed by photo-polymerizations of multifunctional(meth)acrylates. Polymer 1998;39:2507–2513.
Reprint requests: Jeffrey W. Stansbury, PhD,University of Colorado Health Sciences Center, Biomaterials Research Center, P.O. Box 6508/Mail stop F436, Aurora, CO 80045-0508; e-mail: [email protected]© 2000 BC Decker Inc
V O L U M E 1 2 , N U M B E R 6 , 2 0 0 0 309
*Department of Restorative Dentistry and Endodontology, Osaka University Graduate School of Dentistry,Osaka, Japan†Department of Operative Dentistry and Endodontology, Kagoshima University Dental School, Kagoshima,Japan
Polymerization Contraction Stress of Resin Composite Restorations in a Model Class I CavityConfiguration Using Photoelastic Analysis
YOSHIFUMI KINOMOTO, DDS, PHD*
MITSUO TORII , DDS, PHD †
FUMIO TAKESHIGE, DDS, PHD*
SHIGEYUKI EBISU, DDS, PHD*
ABSTRACT
Purpose: An important factor that contributes to deterioration of resin composite restorations iscontraction stress that occurs during polymerization. The purpose of this article is to familiarizethe clinician with the characteristics of contraction stress by visualizing the stresses associatedwith this invisible and complex phenomenon.
Materials and Methods: Internal residual stresses generated during polymerization of resin com-posite restorations were determined using micro-photoelastic analysis. Butt-joint preparationssimulating Class I restorations (2.0 mm × 5.0 mm, 2.0 mm in depth) were prepared in three typesof substrates (bovine teeth, posterior composite resin, and transparent composite resin) and wereused to examine contraction stress in and around the preparations. Three types of compositematerials (a posterior composite, a self-cured transparent composite, and a light-cured transpar-ent composite) were used as the restorative materials. The self-cured composite is an experimen-tal material, and the others are commercial products. After treatment of the preparation wallswith a bonding system, the preparations were bulk filled with composite. Specimens for photoe-lastic analysis were prepared by cutting sections perpendicular to the long axis of the prepara-tion. Fringe patterns for directions and magnitudes of stresses were obtained using transmittedand reflected polarized light with polarizing microscopes. Then, the photoelastic analysis wasperformed to examine stresses in and around the preparations.
Results: When cavity preparations in bovine teeth were filled with light-cured composite, a gapwas formed between the dentinal wall and the composite restorative material, resulting in verylow stress within the restoration. When cavity preparations in the posterior composite modelswere filled with either self-cured or light-cured composite, the stress distribution in the two com-posites was similar, but the magnitude of the stress was greater in the light-cured material. Whenpreparations in the transparent composite models were filled with posterior composite and light-cured transparent composite material, significant stress was generated in the preparation modelssimulating tooth structure, owing to the contraction of both restorative materials.
CLINICAL SIGNIFICANCE
Polymerization contraction stress is an undesirable and inevitable characteristic of adhesiverestorations encountered in clinical dentistry that may compromise restoration success. Cliniciansmust understand the concept of polymerization contraction stress and realize that the quality ofcomposite resin restorations depends on successful management of these stresses.
(J Esthet Dent 12:309–319, 2000)
J O U R N A L O F E S T H E T I C D E N T I S T R Y310
P O L Y M E R I Z A T I O N C O N T R A C T I O N S T R E S S O F R E S I N C O M P O S I T E R E S T O R A T I O N S I N
A M O D E L C L A S S I C A V I T Y C O N F I G U R A T I O N U S I N G P H O T O E L A S T I C A N A L Y S I S
Resin composite restorativessolidify by means of the chemi-
cal process termed polymerization.Polymerization is a repetitive inter-molecular reaction whereby resinmonomer molecules are convertedinto a network by covalent bondingto each other along polymer chains.1
Contraction shrinkage occurs whenthe distance between monomermolecules associated with van derWaals forces is decreased as a resultof the formation of covalent bondsduring monomer conversion. More-over, the distance change betweenmolecules in fluid state and solidstate induces contraction shrinkage.Thus, shrinkage occurs during polymerization of resin compositerestorations as a function of thechemistry of the synthetic resins.
Shrinkage is not a problem whenthe resin composite shrinks on flatdentin surfaces. However, if theshrinkage occurs when the resincomposite is confined within a toothcavity preparation, contractionstress occurs as a result of competi-tion between strength of the bondwith tooth structure and the con-traction forces.2–5 In clinical dentistry,contraction stress is one of theproblems encountered with adhesiverestorations and an important fac-tor in the quality of marginal adap-tation in resin composite restora-tions.6 Poor marginal adaptation of a composite restoration results in microleakage and its possiblesequelae: thermal sensitivity, pulpalirritation, and secondary caries.
There have been many studies eval-uating the quality of marginaladaptation and associated micro-leakage.7–12 However, because themethods for determining contrac-tion stress are complex, relativelyfew studies have examined poly-merization contraction stress ofresin composite restoration directly.Studies examining contractionstress have been carried out usingstrain gauge,13 finite elementalanalysis (FEA),14–16 tensiometer,17,18
and photoelastic methods.19,20
Photoelastic analysis is a techniquefor transforming internal stressesproduced in materials into visiblelight patterns that indicate the loca-tions and magnitudes of stresses.21,22
In the dental literature, stresses gen-erated within inlays, crowns, posts,and abutments have been examinedusing photoelastic analysis.23–26
Modifications of traditional photo-elastic methods using transparentresin composites and microscopeshave been made, to visualize con-traction stress within resin compos-ite restorations.19,20
The goal of this article is to famil-iarize the clinician with the charac-teristics of contraction stress associ-ated with polymerization shrinkageby visualizing the stresses associ-ated with this invisible and complexphenomenon.
MATERIALS AND METHODS
Extracted bovine incisors werestored in sterile water and frozen at–20°C for less than 1 month after
removal of the pulpal soft tissue.After tooth thawing, flat enamelsurfaces were prepared by grindingthe teeth with wet No. 600-grit SiCpaper. Two different types of trans-parent resin composite materialswere used in this study: Palfiqueclear (Tokuyama Co., Tokuyama,Japan) and an experimental paste-paste self-cured resin composite.Palfique clear is a commercial visi-ble light-activated composite mater-ial, which is used for splinting ofteeth and glazing of compositerestorations. The monomer consistsof a mixture of 40% Bis-GMA and60% by weight of triethylene glycoldimethacrylate (TEGDMA). Theinorganic filler is 0.8-µm sphericalsilicon dioxide that constitutes 60%of the weight of the composite. Palfique clear becomes almost trans-parent after polymerization, becausethe refraction indices of monomerand filler are adjusted to be equiva-lent. The volumetric polymerizationshrinkage of Palfique clear, mea-sured using a dilatometer with amercury-filled capillary, was 5.86%,and its bending elastic modulus was3.3 ± 0.4 GPa.27 The experimentalpaste-paste self-cured resin compos-ite was prepared using the samefiller and monomer as light-curedPalfique clear. This experimentalself-cured composite was mixedusing the bubbleless mixing tech-nique.28 The bending elastic modu-lus was 3.1 ± 0.6 GPa. The bendingmoduli of each curing type (n = 6)were determined 30 minutes after thecomposite materials were packed
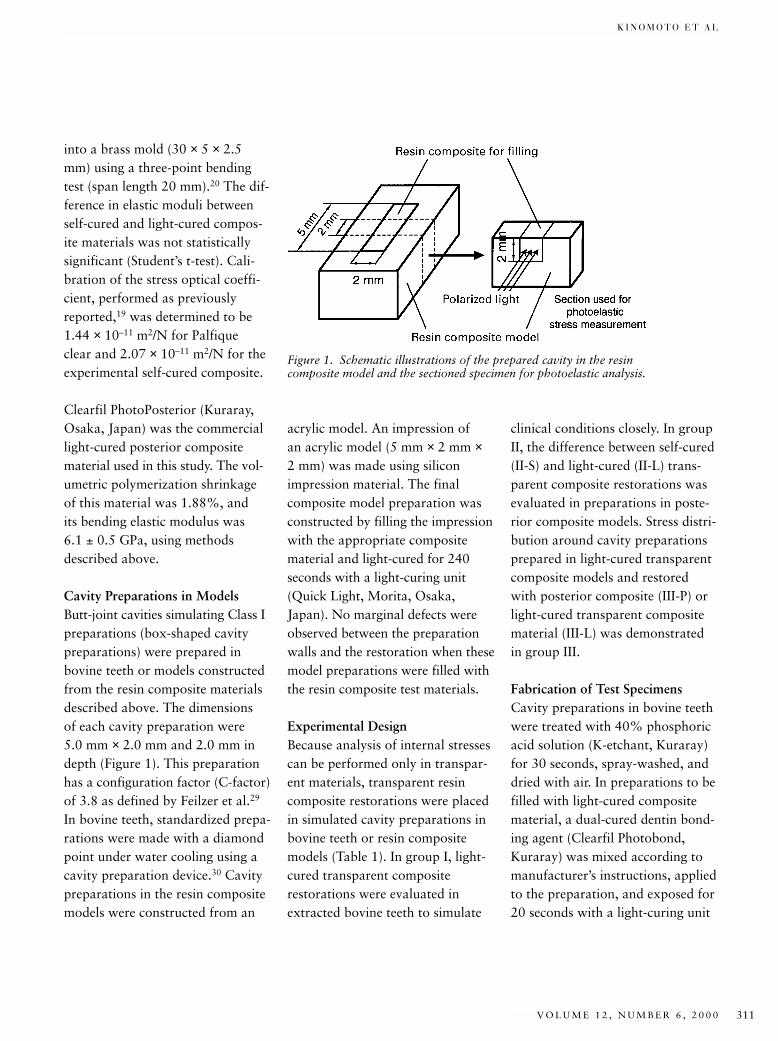
K I N O M O T O E T A L
V O L U M E 1 2 , N U M B E R 6 , 2 0 0 0 311
into a brass mold (30 × 5 × 2.5mm) using a three-point bendingtest (span length 20 mm).20 The dif-ference in elastic moduli betweenself-cured and light-cured compos-ite materials was not statisticallysignificant (Student’s t-test). Cali-bration of the stress optical coeffi-cient, performed as previouslyreported,19 was determined to be1.44 × 10–11 m2/N for Palfique clear and 2.07 × 10⁻¹¹ m2/N for theexperimental self-cured composite.
Clearfil PhotoPosterior (Kuraray,Osaka, Japan) was the commerciallight-cured posterior compositematerial used in this study. The vol-umetric polymerization shrinkageof this material was 1.88%, and its bending elastic modulus was 6.1 ± 0.5 GPa, using methodsdescribed above.
Cavity Preparations in ModelsButt-joint cavities simulating Class Ipreparations (box-shaped cavitypreparations) were prepared inbovine teeth or models constructedfrom the resin composite materialsdescribed above. The dimensions of each cavity preparation were 5.0 mm × 2.0 mm and 2.0 mm indepth (Figure 1). This preparationhas a configuration factor (C-factor)of 3.8 as defined by Feilzer et al.29
In bovine teeth, standardized prepa-rations were made with a diamondpoint under water cooling using acavity preparation device.30 Cavitypreparations in the resin compositemodels were constructed from an
clinical conditions closely. In groupII, the difference between self-cured(II-S) and light-cured (II-L) trans-parent composite restorations wasevaluated in preparations in poste-rior composite models. Stress distri-bution around cavity preparationsprepared in light-cured transparentcomposite models and restoredwith posterior composite (III-P) orlight-cured transparent compositematerial (III-L) was demonstratedin group III.
Fabrication of Test SpecimensCavity preparations in bovine teethwere treated with 40% phosphoricacid solution (K-etchant, Kuraray)for 30 seconds, spray-washed, anddried with air. In preparations to befilled with light-cured compositematerial, a dual-cured dentin bond-ing agent (Clearfil Photobond,Kuraray) was mixed according tomanufacturer’s instructions, appliedto the preparation, and exposed for20 seconds with a light-curing unit
acrylic model. An impression of an acrylic model (5 mm × 2 mm ×2 mm) was made using siliconimpression material. The final composite model preparation wasconstructed by filling the impressionwith the appropriate compositematerial and light-cured for 240 seconds with a light-curing unit(Quick Light, Morita, Osaka,Japan). No marginal defects wereobserved between the preparationwalls and the restoration when thesemodel preparations were filled withthe resin composite test materials.
Experimental DesignBecause analysis of internal stressescan be performed only in transpar-ent materials, transparent resincomposite restorations were placedin simulated cavity preparations inbovine teeth or resin compositemodels (Table 1). In group I, light-cured transparent compositerestorations were evaluated inextracted bovine teeth to simulate
Figure 1. Schematic illustrations of the prepared cavity in the resincomposite model and the sectioned specimen for photoelastic analysis.
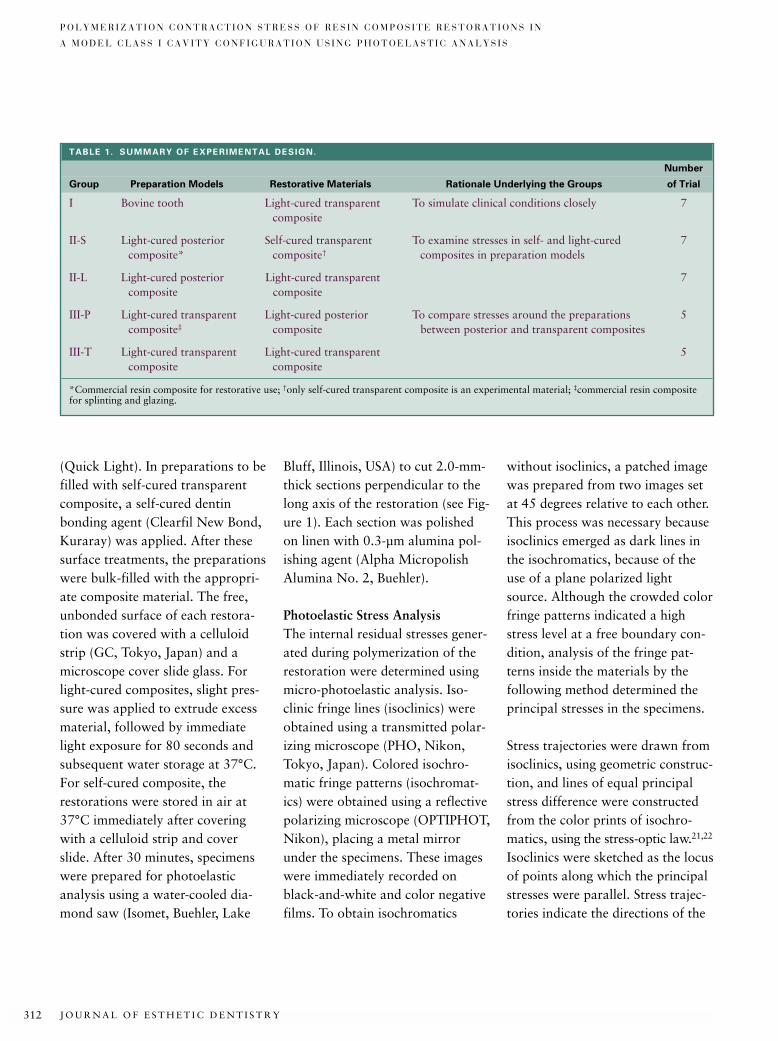
J O U R N A L O F E S T H E T I C D E N T I S T R Y312
P O L Y M E R I Z A T I O N C O N T R A C T I O N S T R E S S O F R E S I N C O M P O S I T E R E S T O R A T I O N S I N
A M O D E L C L A S S I C A V I T Y C O N F I G U R A T I O N U S I N G P H O T O E L A S T I C A N A L Y S I S
(Quick Light). In preparations to befilled with self-cured transparentcomposite, a self-cured dentinbonding agent (Clearfil New Bond,Kuraray) was applied. After thesesurface treatments, the preparationswere bulk-filled with the appropri-ate composite material. The free,unbonded surface of each restora-tion was covered with a celluloidstrip (GC, Tokyo, Japan) and amicroscope cover slide glass. Forlight-cured composites, slight pres-sure was applied to extrude excessmaterial, followed by immediatelight exposure for 80 seconds andsubsequent water storage at 37°C.For self-cured composite, therestorations were stored in air at37°C immediately after coveringwith a celluloid strip and coverslide. After 30 minutes, specimenswere prepared for photoelasticanalysis using a water-cooled dia-mond saw (Isomet, Buehler, Lake
Bluff, Illinois, USA) to cut 2.0-mm-thick sections perpendicular to thelong axis of the restoration (see Fig-ure 1). Each section was polishedon linen with 0.3-µm alumina pol-ishing agent (Alpha MicropolishAlumina No. 2, Buehler).
Photoelastic Stress AnalysisThe internal residual stresses gener-ated during polymerization of therestoration were determined usingmicro-photoelastic analysis. Iso-clinic fringe lines (isoclinics) wereobtained using a transmitted polar-izing microscope (PHO, Nikon,Tokyo, Japan). Colored isochro-matic fringe patterns (isochromat-ics) were obtained using a reflectivepolarizing microscope (OPTIPHOT,Nikon), placing a metal mirrorunder the specimens. These imageswere immediately recorded onblack-and-white and color negativefilms. To obtain isochromatics
without isoclinics, a patched imagewas prepared from two images setat 45 degrees relative to each other.This process was necessary becauseisoclinics emerged as dark lines inthe isochromatics, because of theuse of a plane polarized lightsource. Although the crowded colorfringe patterns indicated a highstress level at a free boundary con-dition, analysis of the fringe pat-terns inside the materials by the following method determined theprincipal stresses in the specimens.
Stress trajectories were drawn fromisoclinics, using geometric construc-tion, and lines of equal principalstress difference were constructedfrom the color prints of isochro-matics, using the stress-optic law.21,22
Isoclinics were sketched as the locusof points along which the principalstresses were parallel. Stress trajec-tories indicate the directions of the
TABLE 1. SUMMARY OF EXPERIMENTAL DESIGN.
Number
Group Preparation Models Restorative Materials Rationale Underlying the Groups of Trial
I Bovine tooth Light-cured transparent To simulate clinical conditions closely 7composite
II-S Light-cured posterior Self-cured transparent To examine stresses in self- and light-cured 7composite* composite† composites in preparation models
II-L Light-cured posterior Light-cured transparent 7composite composite
III-P Light-cured transparent Light-cured posterior To compare stresses around the preparations 5composite‡ composite between posterior and transparent composites
III-T Light-cured transparent Light-cured transparent 5composite composite
*Commercial resin composite for restorative use; †only self-cured transparent composite is an experimental material; ‡commercial resin compositefor splinting and glazing.
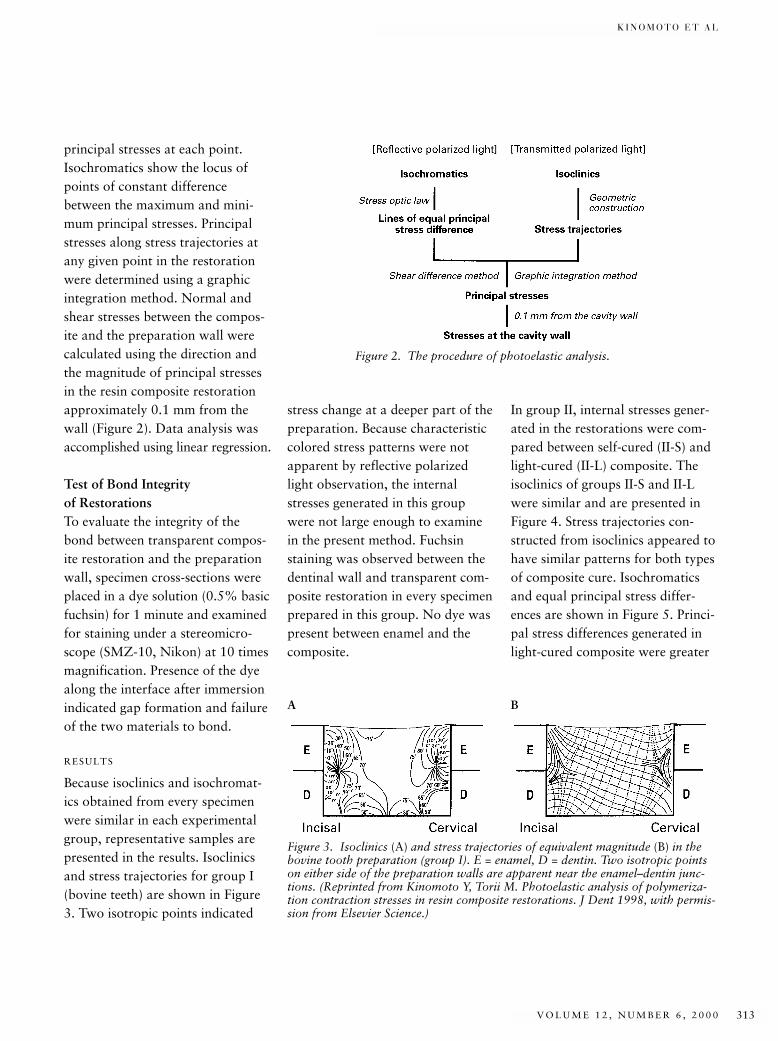
K I N O M O T O E T A L
V O L U M E 1 2 , N U M B E R 6 , 2 0 0 0 313
principal stresses at each point.Isochromatics show the locus ofpoints of constant differencebetween the maximum and mini-mum principal stresses. Principalstresses along stress trajectories atany given point in the restorationwere determined using a graphicintegration method. Normal andshear stresses between the compos-ite and the preparation wall werecalculated using the direction andthe magnitude of principal stressesin the resin composite restorationapproximately 0.1 mm from thewall (Figure 2). Data analysis wasaccomplished using linear regression.
Test of Bond Integrity of RestorationsTo evaluate the integrity of thebond between transparent compos-ite restoration and the preparationwall, specimen cross-sections wereplaced in a dye solution (0.5% basicfuchsin) for 1 minute and examinedfor staining under a stereomicro-scope (SMZ-10, Nikon) at 10 timesmagnification. Presence of the dyealong the interface after immersionindicated gap formation and failureof the two materials to bond.
RESULTS
Because isoclinics and isochromat-ics obtained from every specimenwere similar in each experimentalgroup, representative samples arepresented in the results. Isoclinicsand stress trajectories for group I(bovine teeth) are shown in Figure3. Two isotropic points indicated
stress change at a deeper part of thepreparation. Because characteristiccolored stress patterns were notapparent by reflective polarizedlight observation, the internalstresses generated in this groupwere not large enough to examinein the present method. Fuchsinstaining was observed between thedentinal wall and transparent com-posite restoration in every specimenprepared in this group. No dye waspresent between enamel and thecomposite.
In group II, internal stresses gener-ated in the restorations were com-pared between self-cured (II-S) andlight-cured (II-L) composite. Theisoclinics of groups II-S and II-Lwere similar and are presented inFigure 4. Stress trajectories con-structed from isoclinics appeared tohave similar patterns for both typesof composite cure. Isochromaticsand equal principal stress differ-ences are shown in Figure 5. Princi-pal stress differences generated inlight-cured composite were greater
Figure 2. The procedure of photoelastic analysis.
Figure 3. Isoclinics (A) and stress trajectories of equivalent magnitude (B) in thebovine tooth preparation (group I). E = enamel, D = dentin. Two isotropic pointson either side of the preparation walls are apparent near the enamel–dentin junc-tions. (Reprinted from Kinomoto Y, Torii M. Photoelastic analysis of polymeriza-tion contraction stresses in resin composite restorations. J Dent 1998, with permis-sion from Elsevier Science.)
A B
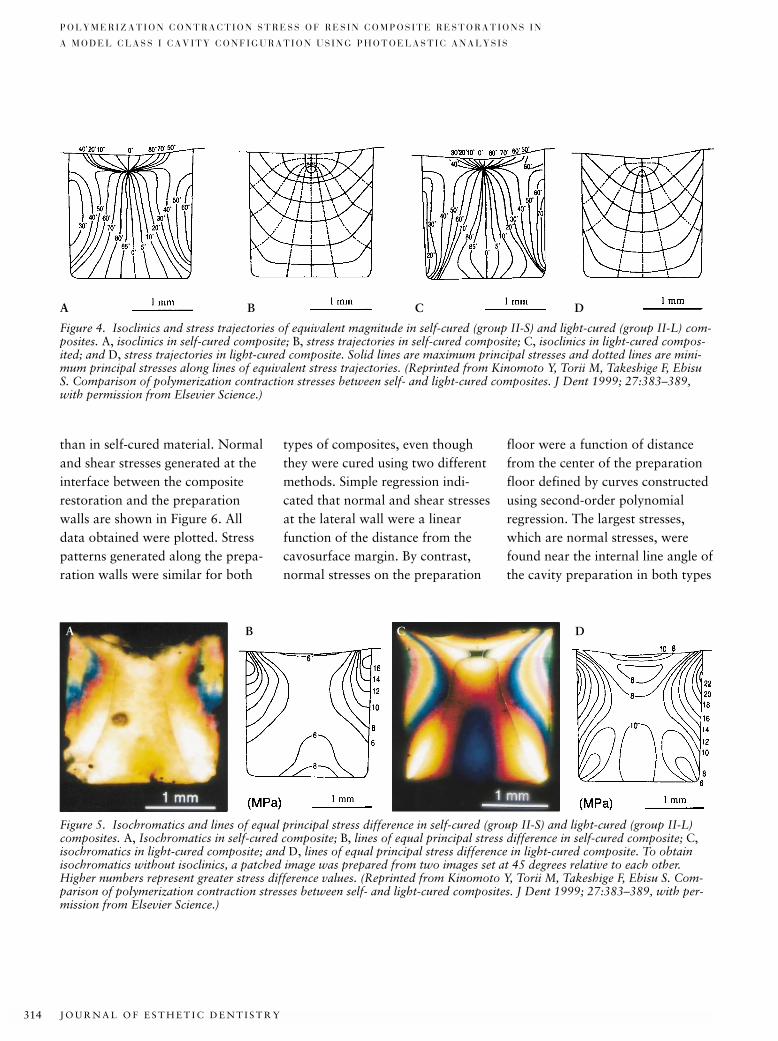
J O U R N A L O F E S T H E T I C D E N T I S T R Y314
P O L Y M E R I Z A T I O N C O N T R A C T I O N S T R E S S O F R E S I N C O M P O S I T E R E S T O R A T I O N S I N
A M O D E L C L A S S I C A V I T Y C O N F I G U R A T I O N U S I N G P H O T O E L A S T I C A N A L Y S I S
than in self-cured material. Normaland shear stresses generated at theinterface between the compositerestoration and the preparationwalls are shown in Figure 6. Alldata obtained were plotted. Stresspatterns generated along the prepa-ration walls were similar for both
types of composites, even thoughthey were cured using two differentmethods. Simple regression indi-cated that normal and shear stressesat the lateral wall were a linearfunction of the distance from thecavosurface margin. By contrast,normal stresses on the preparation
floor were a function of distancefrom the center of the preparationfloor defined by curves constructedusing second-order polynomialregression. The largest stresses,which are normal stresses, werefound near the internal line angle ofthe cavity preparation in both types
Figure 4. Isoclinics and stress trajectories of equivalent magnitude in self-cured (group II-S) and light-cured (group II-L) com-posites. A, isoclinics in self-cured composite; B, stress trajectories in self-cured composite; C, isoclinics in light-cured compos-ited; and D, stress trajectories in light-cured composite. Solid lines are maximum principal stresses and dotted lines are mini-mum principal stresses along lines of equivalent stress trajectories. (Reprinted from Kinomoto Y, Torii M, Takeshige F, EbisuS. Comparison of polymerization contraction stresses between self- and light-cured composites. J Dent 1999; 27:383–389,with permission from Elsevier Science.)
Figure 5. Isochromatics and lines of equal principal stress difference in self-cured (group II-S) and light-cured (group II-L)composites. A, Isochromatics in self-cured composite; B, lines of equal principal stress difference in self-cured composite; C,isochromatics in light-cured composite; and D, lines of equal principal stress difference in light-cured composite. To obtainisochromatics without isoclinics, a patched image was prepared from two images set at 45 degrees relative to each other.Higher numbers represent greater stress difference values. (Reprinted from Kinomoto Y, Torii M, Takeshige F, Ebisu S. Com-parison of polymerization contraction stresses between self- and light-cured composites. J Dent 1999; 27:383–389, with per-mission from Elsevier Science.)
A B C D
A CB D
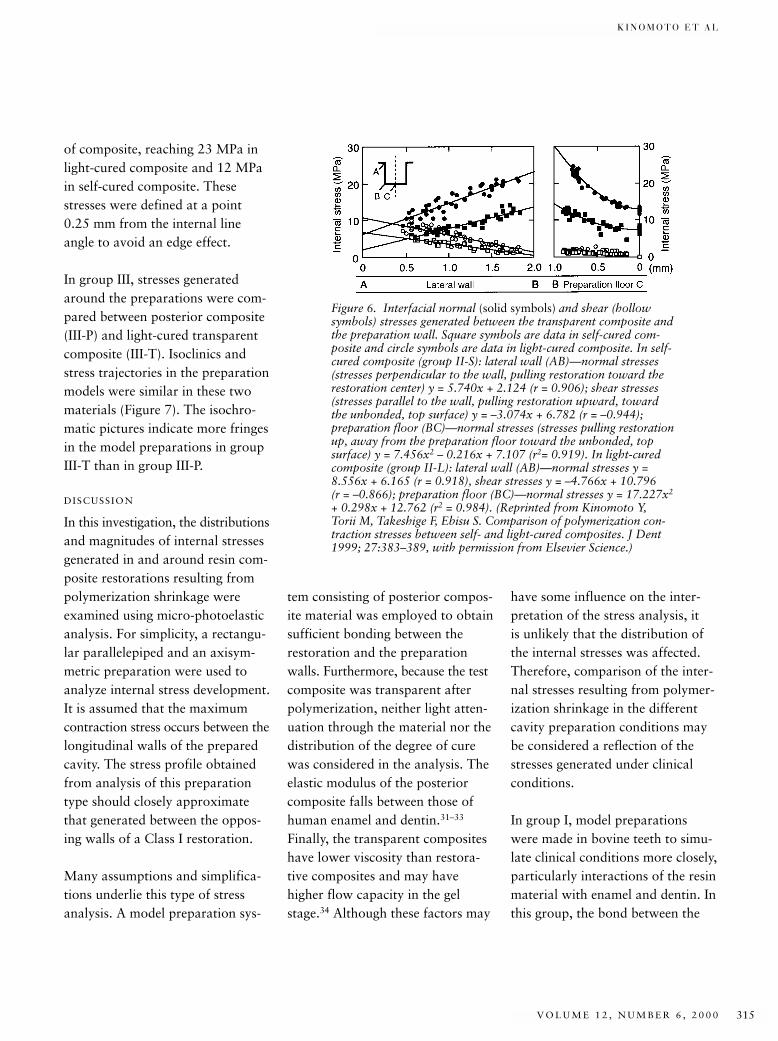
K I N O M O T O E T A L
V O L U M E 1 2 , N U M B E R 6 , 2 0 0 0 315
of composite, reaching 23 MPa inlight-cured composite and 12 MPain self-cured composite. Thesestresses were defined at a point0.25 mm from the internal lineangle to avoid an edge effect.
In group III, stresses generatedaround the preparations were com-pared between posterior composite(III-P) and light-cured transparentcomposite (III-T). Isoclinics andstress trajectories in the preparationmodels were similar in these twomaterials (Figure 7). The isochro-matic pictures indicate more fringesin the model preparations in groupIII-T than in group III-P.
DISCUSSION
In this investigation, the distributionsand magnitudes of internal stressesgenerated in and around resin com-posite restorations resulting frompolymerization shrinkage wereexamined using micro-photoelasticanalysis. For simplicity, a rectangu-lar parallelepiped and an axisym-metric preparation were used toanalyze internal stress development.It is assumed that the maximumcontraction stress occurs between thelongitudinal walls of the preparedcavity. The stress profile obtainedfrom analysis of this preparationtype should closely approximatethat generated between the oppos-ing walls of a Class I restoration.
Many assumptions and simplifica-tions underlie this type of stressanalysis. A model preparation sys-
tem consisting of posterior compos-ite material was employed to obtainsufficient bonding between therestoration and the preparationwalls. Furthermore, because the testcomposite was transparent afterpolymerization, neither light atten-uation through the material nor thedistribution of the degree of curewas considered in the analysis. Theelastic modulus of the posteriorcomposite falls between those ofhuman enamel and dentin.31–33
Finally, the transparent compositeshave lower viscosity than restora-tive composites and may havehigher flow capacity in the gelstage.34 Although these factors may
have some influence on the inter-pretation of the stress analysis, it is unlikely that the distribution ofthe internal stresses was affected.Therefore, comparison of the inter-nal stresses resulting from polymer-ization shrinkage in the differentcavity preparation conditions maybe considered a reflection of thestresses generated under clinicalconditions.
In group I, model preparationswere made in bovine teeth to simu-late clinical conditions more closely,particularly interactions of the resinmaterial with enamel and dentin. Inthis group, the bond between the
Figure 6. Interfacial normal (solid symbols) and shear (hollowsymbols) stresses generated between the transparent composite andthe preparation wall. Square symbols are data in self-cured com-posite and circle symbols are data in light-cured composite. In self-cured composite (group II-S): lateral wall (AB)—normal stresses(stresses perpendicular to the wall, pulling restoration toward therestoration center) y = 5.740x + 2.124 (r = 0.906); shear stresses(stresses parallel to the wall, pulling restoration upward, towardthe unbonded, top surface) y = –3.074x + 6.782 (r = –0.944);preparation floor (BC)—normal stresses (stresses pulling restorationup, away from the preparation floor toward the unbonded, topsurface) y = 7.456x2 – 0.216x + 7.107 (r2= 0.919). In light-curedcomposite (group II-L): lateral wall (AB)—normal stresses y =8.556x + 6.165 (r = 0.918), shear stresses y = –4.766x + 10.796 (r = –0.866); preparation floor (BC)—normal stresses y = 17.227x2
+ 0.298x + 12.762 (r2 = 0.984). (Reprinted from Kinomoto Y,Torii M, Takeshige F, Ebisu S. Comparison of polymerization con-traction stresses between self- and light-cured composites. J Dent1999; 27:383–389, with permission from Elsevier Science.)
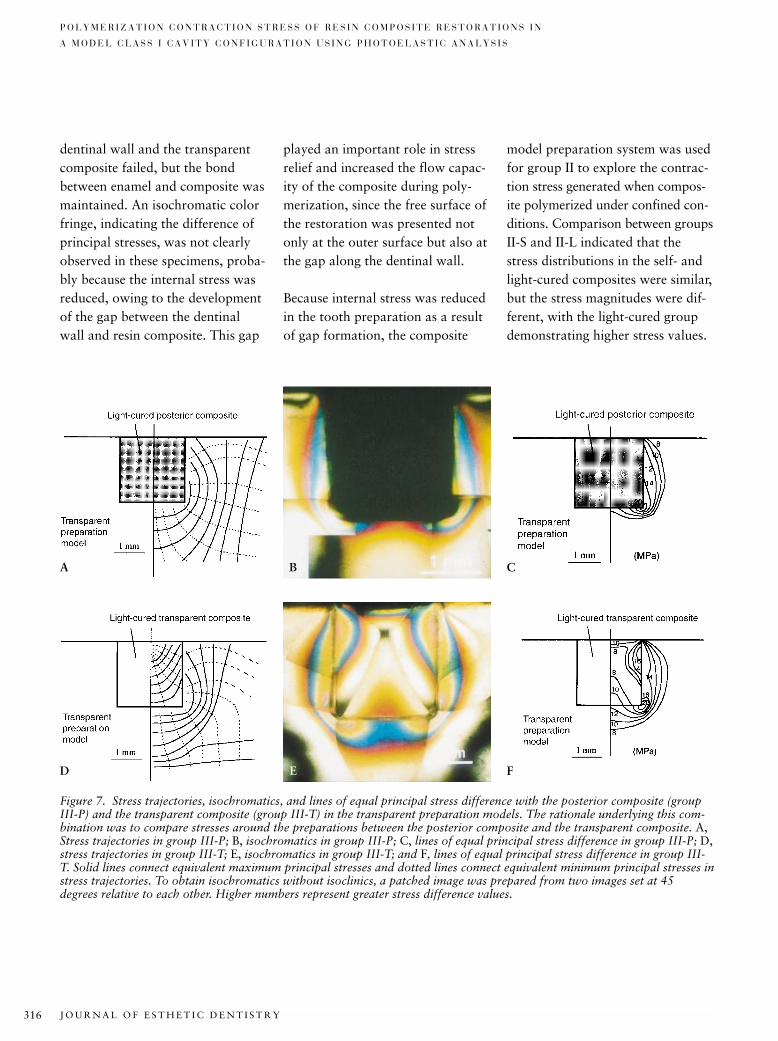
J O U R N A L O F E S T H E T I C D E N T I S T R Y316
P O L Y M E R I Z A T I O N C O N T R A C T I O N S T R E S S O F R E S I N C O M P O S I T E R E S T O R A T I O N S I N
A M O D E L C L A S S I C A V I T Y C O N F I G U R A T I O N U S I N G P H O T O E L A S T I C A N A L Y S I S
dentinal wall and the transparentcomposite failed, but the bondbetween enamel and composite wasmaintained. An isochromatic colorfringe, indicating the difference ofprincipal stresses, was not clearlyobserved in these specimens, proba-bly because the internal stress wasreduced, owing to the developmentof the gap between the dentinalwall and resin composite. This gap
played an important role in stressrelief and increased the flow capac-ity of the composite during poly-merization, since the free surface ofthe restoration was presented notonly at the outer surface but also atthe gap along the dentinal wall.
Because internal stress was reducedin the tooth preparation as a resultof gap formation, the composite
model preparation system was usedfor group II to explore the contrac-tion stress generated when compos-ite polymerized under confined con-ditions. Comparison between groupsII-S and II-L indicated that thestress distributions in the self- andlight-cured composites were similar,but the stress magnitudes were dif-ferent, with the light-cured groupdemonstrating higher stress values.
Figure 7. Stress trajectories, isochromatics, and lines of equal principal stress difference with the posterior composite (groupIII-P) and the transparent composite (group III-T) in the transparent preparation models. The rationale underlying this com-bination was to compare stresses around the preparations between the posterior composite and the transparent composite. A,Stress trajectories in group III-P; B, isochromatics in group III-P; C, lines of equal principal stress difference in group III-P; D,stress trajectories in group III-T; E, isochromatics in group III-T; and F, lines of equal principal stress difference in group III-T. Solid lines connect equivalent maximum principal stresses and dotted lines connect equivalent minimum principal stresses instress trajectories. To obtain isochromatics without isoclinics, a patched image was prepared from two images set at 45degrees relative to each other. Higher numbers represent greater stress difference values.
A CB
D FE
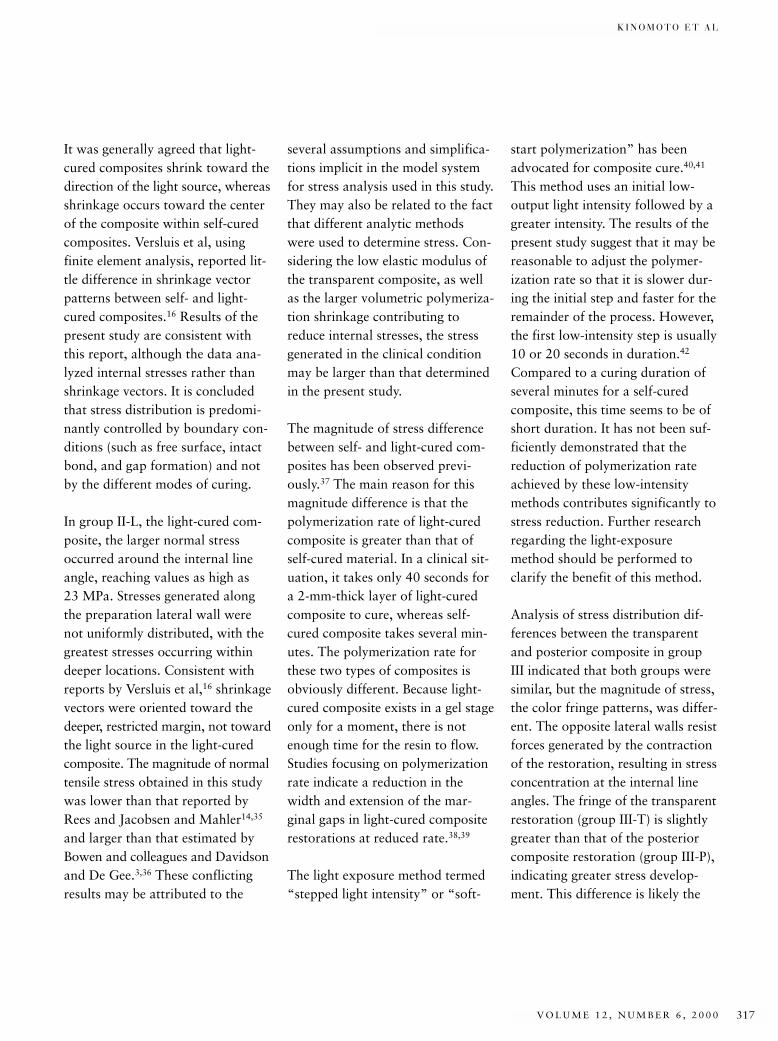
K I N O M O T O E T A L
V O L U M E 1 2 , N U M B E R 6 , 2 0 0 0 317
It was generally agreed that light-cured composites shrink toward thedirection of the light source, whereasshrinkage occurs toward the centerof the composite within self-curedcomposites. Versluis et al, usingfinite element analysis, reported lit-tle difference in shrinkage vectorpatterns between self- and light-cured composites.16 Results of thepresent study are consistent withthis report, although the data ana-lyzed internal stresses rather thanshrinkage vectors. It is concludedthat stress distribution is predomi-nantly controlled by boundary con-ditions (such as free surface, intactbond, and gap formation) and notby the different modes of curing.
In group II-L, the light-cured com-posite, the larger normal stressoccurred around the internal lineangle, reaching values as high as 23 MPa. Stresses generated alongthe preparation lateral wall werenot uniformly distributed, with thegreatest stresses occurring withindeeper locations. Consistent withreports by Versluis et al,16 shrinkagevectors were oriented toward thedeeper, restricted margin, not towardthe light source in the light-curedcomposite. The magnitude of normaltensile stress obtained in this studywas lower than that reported byRees and Jacobsen and Mahler14,35
and larger than that estimated byBowen and colleagues and Davidsonand De Gee.3,36 These conflictingresults may be attributed to the
several assumptions and simplifica-tions implicit in the model systemfor stress analysis used in this study.They may also be related to the factthat different analytic methodswere used to determine stress. Con-sidering the low elastic modulus ofthe transparent composite, as wellas the larger volumetric polymeriza-tion shrinkage contributing toreduce internal stresses, the stressgenerated in the clinical conditionmay be larger than that determinedin the present study.
The magnitude of stress differencebetween self- and light-cured com-posites has been observed previ-ously.37 The main reason for thismagnitude difference is that thepolymerization rate of light-curedcomposite is greater than that ofself-cured material. In a clinical sit-uation, it takes only 40 seconds fora 2-mm-thick layer of light-curedcomposite to cure, whereas self-cured composite takes several min-utes. The polymerization rate forthese two types of composites isobviously different. Because light-cured composite exists in a gel stageonly for a moment, there is notenough time for the resin to flow.Studies focusing on polymerizationrate indicate a reduction in thewidth and extension of the mar-ginal gaps in light-cured compositerestorations at reduced rate.38,39
The light exposure method termed“stepped light intensity” or “soft-
start polymerization” has beenadvocated for composite cure.40,41
This method uses an initial low-output light intensity followed by agreater intensity. The results of thepresent study suggest that it may bereasonable to adjust the polymer-ization rate so that it is slower dur-ing the initial step and faster for theremainder of the process. However,the first low-intensity step is usually10 or 20 seconds in duration.42
Compared to a curing duration ofseveral minutes for a self-curedcomposite, this time seems to be ofshort duration. It has not been suf-ficiently demonstrated that thereduction of polymerization rateachieved by these low-intensitymethods contributes significantly tostress reduction. Further researchregarding the light-exposuremethod should be performed toclarify the benefit of this method.
Analysis of stress distribution dif-ferences between the transparentand posterior composite in groupIII indicated that both groups weresimilar, but the magnitude of stress,the color fringe patterns, was differ-ent. The opposite lateral walls resistforces generated by the contractionof the restoration, resulting in stressconcentration at the internal lineangles. The fringe of the transparentrestoration (group III-T) is slightlygreater than that of the posteriorcomposite restoration (group III-P),indicating greater stress develop-ment. This difference is likely the
J O U R N A L O F E S T H E T I C D E N T I S T R Y318
P O L Y M E R I Z A T I O N C O N T R A C T I O N S T R E S S O F R E S I N C O M P O S I T E R E S T O R A T I O N S I N
A M O D E L C L A S S I C A V I T Y C O N F I G U R A T I O N U S I N G P H O T O E L A S T I C A N A L Y S I S
result of the larger polymerizationshrinkage of the transparent com-posite compared to that of the pos-terior material. Greater deforma-tion of the preparation modelgenerated the larger fringe patterns.The results indicate that distribu-tion of contraction stress generatedwithin the transparent composite issimilar to that generated within theclinical posterior material. Also, theresults show that contraction stressresults from competition betweenbond strength of the composite tothe preparation walls (tooth struc-ture) and the contraction forcesassociated with polymerization ofthe restoration itself.
CONCLUSION
Contraction stress is an undesirableand inevitable characteristic ofadhesive restorations encountered inclinical dentistry that may compro-mise the success of restorations.Although there have been attemptsdesigned to reduce this stress incomposite restorations, few methodshave been shown to be effective.Therefore, clinicians must under-stand concepts underlying polymer-ization contraction stress and real-ize that the quality of compositeresin restorations depends on thesuccessful management of this stress.
DISCLOSURE AND
ACKNOWLEDGMENTS
The authors wish to thank Mr. S.Yuasa, Tokuyama Co., Tokuyama,Japan, for providing the experimen-
tal transparent resin compositematerial, and Dr. D.L. Carnes, Uni-versity of Texas Health ScienceCenter at San Antonio, for review-ing and proofing this manuscript.
REFERENCES
1. Anusavice KJ. Phillips’ science of dentalmaterials. 10th Ed. Philadelphia: WBSaunders, 1996:211–235.
2. Asmussen E. Composite restorative resins.Composition versus wall-to-wall polymer-ization contraction. Acta Odontol Scand1975; 33:337–344.
3. Bowen RL, Nemoto K, Rapson JE. Adhe-sion bonding of various materials to hardtooth tissues: forces developing in compos-ite materials during hardening. J Am DentAssoc 1983; 106:475–477.
4. Hegdahl T, Gjerdet NR. Contractionstresses of composite resin filling materi-als. Acta Odontol Scand 1977;35:191–195.
5. Davidson CL, de Gee AJ, Feilzer A. Thecompetition between the composite–dentinbond strength and the polymerization contraction stress. J Dent Res 1984;63:1396–1399.
6. Carvalho RM, Pereira JC, Yoshiyama M,Pashley DH. A review of polymerizationcontraction: the influence of stress devel-opment versus stress relief. Oper Dent1996; 21:17–24.
7. Kemp-Scholte CM, Davidson CL. Com-plete marginal seal of Class V resin com-posite restorations effected by increasedflexibility. J Dent Res 1990;69:1240–1243.
8. Uno S, Shimokobe H. Contraction stressand marginal adaptation of compositerestorations in dentinal cavity. Dent MaterJ 1994; 13:19–24.
9. Staninec M, Kawakami M. Adhesion andmicroleakage tests of a new dentin bond-ing system. Dent Mater 1993; 9:204–208.
10. Prati C, Simpson M, Mitchem J, Tao L,Pashley DH. Relationship between bondstrength and microleakage measured in thesame Class I restorations. Dent Mater1992; 8:37–41.
11. Hansen EK. Effect of cavity depth andapplication technique on marginal adapta-tion of resins in dentin cavities. J Dent Res1986; 65:1319–1321.
12. Tay ER, Gwinnett AJ, Pang KM, et al.Variability in microleakage observed in atotal-etch wet-bonding technique underdifferent handling conditions. J Dent Res1995; 74:1168–1178.
13. Sakaguchi RL, Sasik CT, Bunczak MA, et al. Strain gauge method for measuringpolymerization contraction of compositeresins. J Dent 1991; 19:312–316.
14. Rees JS, Jacobsen PH. Stress generated byluting resins during cementation of com-posite and ceramic inlays. J Oral Rehabil1992; 19:115–122.
15. Katona TR, Winkler MM. Stress analysisof a bulk-filling Class V light-cured com-posite restoration. J Dent Res 1994;73:1470–1477.
16. Versluis A, Tantbirojn D, Douglas WH.Do dental composites always shrinktoward the light? J Dent Res 1998;77:1435–1445.
17. Davidson CL, De Gee AJ. Relaxation ofpolymerization contraction stresses byflow in dental composites. J Dent Res1984; 63:146–148.
18. Choi KK, Condon JR, Ferracane JL. Theeffect of adhesive thickness on polymeriza-tion contraction stress of composite.J Dent Res 2000; 79:812–817.
19. Kinomoto Y, Torii M. Photoelastic analy-sis of polymerization contraction stressesin resin composite restorations. J Dent1998; 26:165–171.
20. Kinomoto Y, Torii M, Takeshige F, EbisuS. Comparison of polymerization contrac-tion stresses between self- and light-curingcomposites. J Dent 1999; 27:383–389.
21. Frocht MM. Photoelasticity. London: JohnWiley & Sons, 1941:144–349.
22. Kuske A, Robertson G. Photoelastic stressanalysis. London: John Wiley & Sons,1974:105–389.
23. Craig RG, El-Ebrashi K, LePeak PJ, PeytonFA. Experimental stress analysis of dentalrestorations. Part 1. Two-dimensionalphotoelastic stress analysis of inlays. JProsthet Dent 1967; 17:277–291.
K I N O M O T O E T A L
V O L U M E 1 2 , N U M B E R 6 , 2 0 0 0 319
24. Farah JW, Craig RG. Stress analysis ofthree marginal configuration of full poste-rior crowns by three-dimensional photo-elasticity. J Dent Res 1974; 53:1219–1225.
25. Burns DA, Krause WR, Douglas HB,Burns DR. Stress distribution surroundingendodontic posts. J Prosthet Dent 1990;64:412–418.
26. Standlee JP, Caputo AA. Load transfer byfixed partial dentures with three abut-ments. Quintessence Int 1988;19:403–410.
27. Iga M, Takeshige F, Ui T, et al. The rela-tionship between polymerization shrinkagemeasured by a modified dilatometer andthe inorganic filler content of light-curedcomposites. Dent Mater J 1991; 10:38–45.
28. Hosoda H, Yamada T, Inokoshi S, et al.Contrivance of bubble-less mixing tech-nique for paste-paste type compositeresins. Jpn J Conserv Dent 1985;28:1266–1278.
29. Feilzer AJ, De Gee AJ, Davidson CL. Set-ting stress in composite resin in relation toconfiguration of the restoration. J DentRes 1987; 66:1636–1639.
30. Iwami Y, Yamamoto Y, Ebisu S. A newelectrical method for detecting marginalleakage of in vitro resin restorations. J Dent 2000; 28:241–247.
31. Craig RG, Peyton FA, Johnson DW. Compressive properties of enamel, dentalcements, and gold. J Dent Res 1961;40:936–945.
32. Willems G, Lambrechts P, Braem M, et al.A classification of dental compositesaccording to their morphological andmechanical characteristics. Dent Mater1992; 8:310–319.
33. Sano H, Ciucchi B, Matthews WG, et al.Tensile properties of mineralized and demineralized human and bovine dentin. J Dent Res 1994; 73:1205–1211.
34. Dauvillier BS, Feilzer AJ, De Gee AJ,Davidson CL. Visco-elastic parameters ofdental restorative materials during setting.J Dent Res 2000; 79:818–823.
35. Mahler DB. Letter to the editor. J DentRes 1990; 69:913.
36. Davidson CL, De Gee AJ. Relaxation ofpolymerization contraction stresses byflow in dental composites. J Dent Res1984; 63:146–148.
37. Feilzer AJ, De Gee AJ, Davidson CL. Set-ting stresses in composites for two differentcuring modes. Dent Mater 1993; 9:2–5.
38. Kato H. Relationship between the velocityof polymerization and adaptation todentin cavity wall of light-cured compos-ite. Dent Mater J 1987; 6:32–37.
39. Uno S, Asmussen E. Marginal adaptationof a restorative resin polymerized atreduced rate. Scand J Dent Res 1991;99:440–444.
40. Mehl A, Hickel R, Kunzelmann KH. Physical properties and gap formation oflight-cured composites with and without“soft-start polymerization.” J Dent 1997;25:321–330.
41. Koran P, Kurschner R. Effect of sequentialversus continuous irradiation of a light-cured resin composite on shrinkage, viscosity, adhesion, and degree of poly-merization. Am J Dent 1998; 11:17–22.
42. Bouschlicher MB, Rueggeberg FA, BoyerDB. Effect of stepped light intensity onpolymerization force and conversion in aphotoactivated composite. J Esthet Dent2000; 12:23–32.
Reprint requests: Yoshifumi Kinomoto,DDS, PhD, Department of Restorative Den-tistry and Endodontology, Osaka UniversityGraduate School of Dentistry, 1-8Yamadaoka, Suita, Osaka 565-0871, Japan;e-mail: [email protected]©2000 BC Decker Inc
J O U R N A L O F E S T H E T I C D E N T I S T R Y320
*Associate Professor, Department of Dental Clinical Sciences, Faculty of Dentistry, Dalhousie University,Halifax, Nova Scotia, Canada†Professor and Head, Department of Oral Technology and Dental Materials Science, Dental School, MalmöUniversity, Malmö, Sweden‡Research Assistant, Faculty of Dentistry, Dalhousie University, Halifax, Nova Scotia, Canada§Biostatistician, Community Health and Epidemiology, Dalhousie University, Halifax, Nova Scotia, Canada#Professor, Department of Clinical Dental Sciences, Faculty of Dentistry, Dalhousie University, Halifax,Nova Scotia, Canada
Effect of Distance on the Power Density from Two Light Guides
RICHARD B. PRICE, DDS, MS, FDS RCS (Edin)*
TORE DÉRAND, DDS, PHD †
MARY SEDAROUS, BSc ‡
PANTELIS ANDREOU, PHD §
ROBERT W. LONEY, DMD, MS#
ABSTRACT
Purpose: This study determined the effect of distance on the power density from standard andTurbo light guides (Demetron/Kerr, Danbury, Connecticut).
Materials and Methods: Power density was measured from 0 to 10 mm away from the tip of stan-dard 8-mm curved light guides and 13/8-mm Turbo curved light guides. To determine the effect ofdistance on power density, a polynomial regression line was fitted. The Kolmogorov-Smirnov (K-S)statistic and the Wilcoxon rank sum (WR) tests were used to determine if there was a difference inthe rate at which the power density decreased for the standard and Turbo light guides as the distancefrom the tip increased. Photographs of the light dispersion from each tip were also taken.
Results: At 0 mm the mean (± SD) power density from the two standard light guides was 743 ±6.1 mW/cm2 and from the four Turbo light guides was 1128 ± 22.1 mW/cm2. As the distance fromthe tip of the light-guide tip increased, the power density decreased, but the rate of decrease wasgreater from the Turbo light guides than from the standard light guides. At 6 mm the power den-sity from the standard light guides fell to 372 mW/cm2 (50% of the original value) and the powerdensity from the Turbo light guides fell to 263 mW/cm2 (23% of the original value). Both the K-Sstatistic and the WR sum test indicated that the distribution of light intensities was significantlydifferent from the two light guides (WR p-value .0246, K-S p-value < .0001). The two estimatedpolynomials intersected at 3.66 mm, and the 95% prediction intervals intersected at about 2.8 and4.8 mm. Therefore, beyond 5 mm away from the tip of the light guide, the standard light guidesgave higher power density readings than the Turbo light guides. Photographs showed that thelight dispersed at a wider angle from the Turbo light guides than from the standard light guide.
CLINICAL SIGNIFICANCE
Because the design of the light guide affects light dispersion, manufacturers should report thepower density at the tip of the light guide and 6 mm from the tip of the light guide
(J Esthet Dent 12:320–327, 2000)
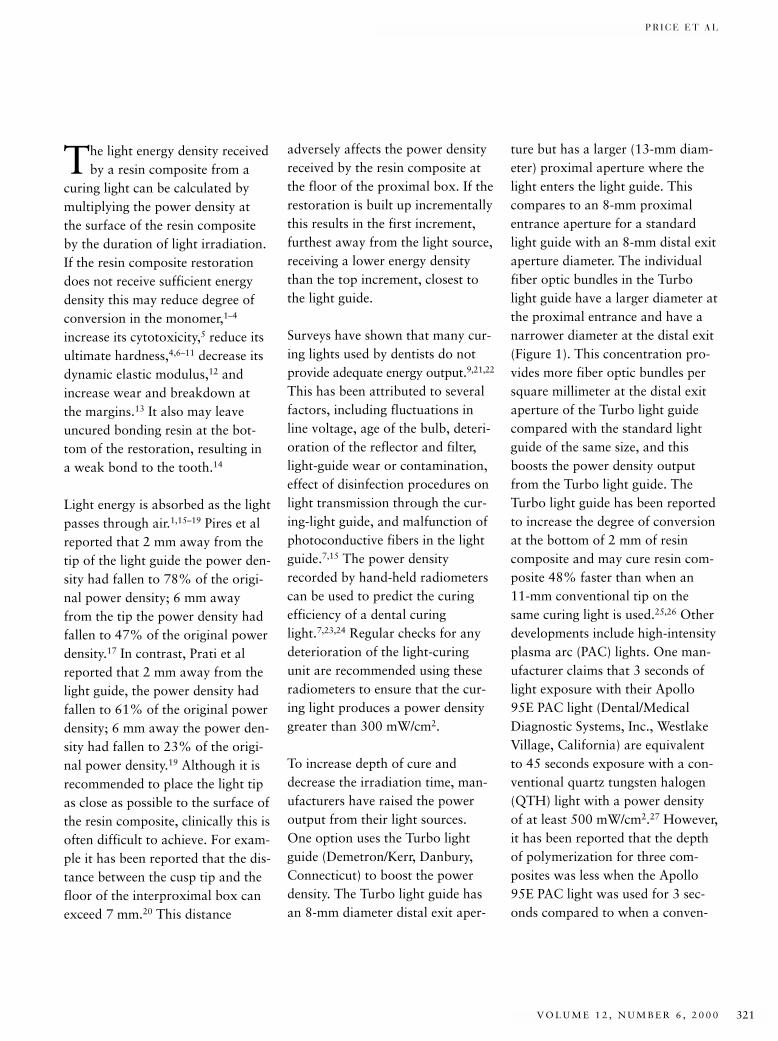
P R I C E E T A L
V O L U M E 1 2 , N U M B E R 6 , 2 0 0 0 321
The light energy density receivedby a resin composite from a
curing light can be calculated bymultiplying the power density atthe surface of the resin compositeby the duration of light irradiation.If the resin composite restorationdoes not receive sufficient energydensity this may reduce degree ofconversion in the monomer,1–4
increase its cytotoxicity,5 reduce itsultimate hardness,4,6–11 decrease itsdynamic elastic modulus,12 andincrease wear and breakdown atthe margins.13 It also may leaveuncured bonding resin at the bot-tom of the restoration, resulting ina weak bond to the tooth.14
Light energy is absorbed as the lightpasses through air.1,15–19 Pires et alreported that 2 mm away from thetip of the light guide the power den-sity had fallen to 78% of the origi-nal power density; 6 mm awayfrom the tip the power density hadfallen to 47% of the original powerdensity.17 In contrast, Prati et alreported that 2 mm away from thelight guide, the power density hadfallen to 61% of the original powerdensity; 6 mm away the power den-sity had fallen to 23% of the origi-nal power density.19 Although it isrecommended to place the light tipas close as possible to the surface ofthe resin composite, clinically this isoften difficult to achieve. For exam-ple it has been reported that the dis-tance between the cusp tip and thefloor of the interproximal box canexceed 7 mm.20 This distance
adversely affects the power densityreceived by the resin composite atthe floor of the proximal box. If therestoration is built up incrementallythis results in the first increment,furthest away from the light source,receiving a lower energy densitythan the top increment, closest tothe light guide.
Surveys have shown that many cur-ing lights used by dentists do notprovide adequate energy output.9,21,22
This has been attributed to severalfactors, including fluctuations inline voltage, age of the bulb, deteri-oration of the reflector and filter,light-guide wear or contamination,effect of disinfection procedures onlight transmission through the cur-ing-light guide, and malfunction ofphotoconductive fibers in the lightguide.7,15 The power densityrecorded by hand-held radiometerscan be used to predict the curingefficiency of a dental curinglight.7,23,24 Regular checks for anydeterioration of the light-curingunit are recommended using theseradiometers to ensure that the cur-ing light produces a power densitygreater than 300 mW/cm2.
To increase depth of cure anddecrease the irradiation time, man-ufacturers have raised the poweroutput from their light sources.One option uses the Turbo lightguide (Demetron/Kerr, Danbury,Connecticut) to boost the powerdensity. The Turbo light guide hasan 8-mm diameter distal exit aper-
ture but has a larger (13-mm diam-eter) proximal aperture where thelight enters the light guide. Thiscompares to an 8-mm proximalentrance aperture for a standardlight guide with an 8-mm distal exitaperture diameter. The individualfiber optic bundles in the Turbolight guide have a larger diameter atthe proximal entrance and have anarrower diameter at the distal exit(Figure 1). This concentration pro-vides more fiber optic bundles persquare millimeter at the distal exitaperture of the Turbo light guidecompared with the standard lightguide of the same size, and thisboosts the power density outputfrom the Turbo light guide. TheTurbo light guide has been reportedto increase the degree of conversionat the bottom of 2 mm of resincomposite and may cure resin com-posite 48% faster than when an 11-mm conventional tip on thesame curing light is used.25,26 Otherdevelopments include high-intensityplasma arc (PAC) lights. One man-ufacturer claims that 3 seconds oflight exposure with their Apollo95E PAC light (Dental/MedicalDiagnostic Systems, Inc., WestlakeVillage, California) are equivalentto 45 seconds exposure with a con-ventional quartz tungsten halogen(QTH) light with a power densityof at least 500 mW/cm2.27 However,it has been reported that the depthof polymerization for three com-posites was less when the Apollo95E PAC light was used for 3 sec-onds compared to when a conven-
J O U R N A L O F E S T H E T I C D E N T I S T R Y322
E F F E C T O F D I S T A N C E O N T H E P O W E R D E N S I T Y F R O M T W O L I G H T G U I D E S
tional QTH light source was usedfor 40 seconds.28 Increasedmicroleakage along the dentin mar-gins has also been reported whenusing a PAC light compared withusing a QTH light and 20 secondsirradiation with one PAC light didnot polymerize composite as well aswhen conventional QTH lightswere used for 40 seconds.29,30
The power density is usually great-est at the tip of the light guide, butthe design of the light guide mayalter the relation between powerdensity and distance from the light-guide tip. However, it has beenreported that a light-guide tip witha convex profile focused the lightoutput. The power density fromthis light guide reached a maximum
the power density (mW/cm2) fromstandard and Turbo light guides.The hypothesis was that as the dis-tance increased, the Turbo lightguides would always deliver a greaterpower density than the standardlight guide.
MATERIALS AND METHODS
One Optilux 500 curing light (serial#5808041 Demetron/Kerr) with an80 W OptiBulb was used to examinethe power density from two standard8-mm curved light guides (model#20941 Demetron/Kerr) and two13/8-mm Turbo+ curved light guides(model #952213 Demetron/Kerr).After a pilot project using two Turbolight guides showed a markeddecrease in power density as the dis-tance increased, one more 13/8-mmTurbo+ curved light guide (model#952213) and a previous model of13/8-mm Turbo curved light guide(model #21020 Demetron/Kerr)were also included in the study. The power density outputs from the light guides were all measured using a Cure Rite digital radiometer(Dentsply/Caulk, Milford, Delaware)with a new battery. The Cure Riteradiometer has been shown to bewithin 2% of a laboratory gradepower meter when measuring thepower density from a 7.5-mm diam-eter light guide.32 The Cure Rite hasbeen used by other researchers,17,33
and it provides a digital output in 1 mW/cm2 increments in place ofthe analog meter found on someradiometers. The power density(mW/cm2) was first measured at
value at 1 mm from the tip of thelight guide and did not fall belowthe zero distance power densityuntil 3 mm away from the tip of the light guide.16 Additionally, thedesign of some light guides madewith random fiber optic filamentshas been shown to produce moreeven light output across the surfaceof the light guide compared withlight guides manufactured usinggraded fibers.31 This design differ-ence may also affect the relationbetween distance and power den-sity. Since the design of the Turbolight guide is different from a stan-dard light guide, the purpose of thisstudy was to investigate whetherthe Turbo light guide had a focus-ing effect on the light output and todetermine the effect of distance on
Figure 1. The entrance and exit apertures showing 1.6times and 6.4 times views of the fiber optic filaments inthe 13/8-mm Turbo light guide. Left, entrance aperture;right, exit aperture.
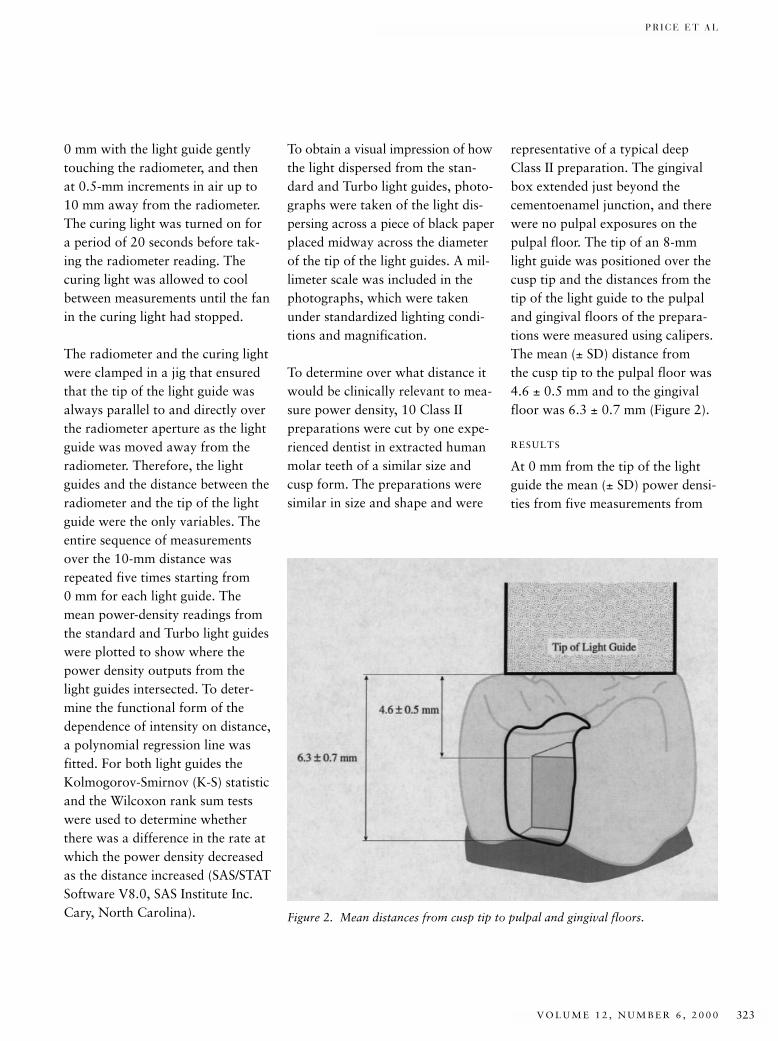
P R I C E E T A L
V O L U M E 1 2 , N U M B E R 6 , 2 0 0 0 323
0 mm with the light guide gentlytouching the radiometer, and thenat 0.5-mm increments in air up to10 mm away from the radiometer.The curing light was turned on fora period of 20 seconds before tak-ing the radiometer reading. Thecuring light was allowed to coolbetween measurements until the fanin the curing light had stopped.
The radiometer and the curing lightwere clamped in a jig that ensuredthat the tip of the light guide wasalways parallel to and directly overthe radiometer aperture as the lightguide was moved away from theradiometer. Therefore, the lightguides and the distance between theradiometer and the tip of the lightguide were the only variables. Theentire sequence of measurementsover the 10-mm distance wasrepeated five times starting from 0 mm for each light guide. Themean power-density readings fromthe standard and Turbo light guideswere plotted to show where thepower density outputs from thelight guides intersected. To deter-mine the functional form of thedependence of intensity on distance,a polynomial regression line wasfitted. For both light guides theKolmogorov-Smirnov (K-S) statisticand the Wilcoxon rank sum testswere used to determine whetherthere was a difference in the rate atwhich the power density decreasedas the distance increased (SAS/STATSoftware V8.0, SAS Institute Inc.Cary, North Carolina).
To obtain a visual impression of howthe light dispersed from the stan-dard and Turbo light guides, photo-graphs were taken of the light dis-persing across a piece of black paperplaced midway across the diameterof the tip of the light guides. A mil-limeter scale was included in thephotographs, which were takenunder standardized lighting condi-tions and magnification.
To determine over what distance itwould be clinically relevant to mea-sure power density, 10 Class IIpreparations were cut by one expe-rienced dentist in extracted humanmolar teeth of a similar size andcusp form. The preparations weresimilar in size and shape and were
representative of a typical deepClass II preparation. The gingivalbox extended just beyond thecementoenamel junction, and therewere no pulpal exposures on thepulpal floor. The tip of an 8-mmlight guide was positioned over thecusp tip and the distances from thetip of the light guide to the pulpaland gingival floors of the prepara-tions were measured using calipers.The mean (± SD) distance from the cusp tip to the pulpal floor was4.6 ± 0.5 mm and to the gingivalfloor was 6.3 ± 0.7 mm (Figure 2).
RESULTS
At 0 mm from the tip of the lightguide the mean (± SD) power densi-ties from five measurements from
Figure 2. Mean distances from cusp tip to pulpal and gingival floors.
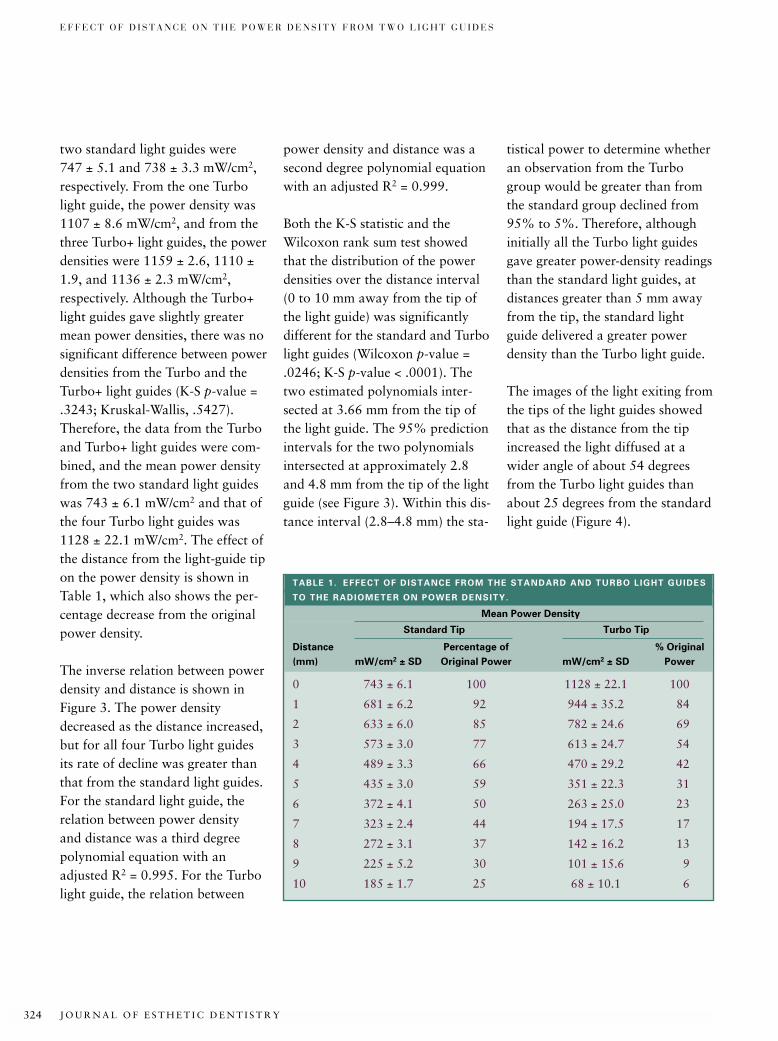
J O U R N A L O F E S T H E T I C D E N T I S T R Y324
E F F E C T O F D I S T A N C E O N T H E P O W E R D E N S I T Y F R O M T W O L I G H T G U I D E S
two standard light guides were 747 ± 5.1 and 738 ± 3.3 mW/cm2,respectively. From the one Turbolight guide, the power density was1107 ± 8.6 mW/cm2, and from thethree Turbo+ light guides, the powerdensities were 1159 ± 2.6, 1110 ±1.9, and 1136 ± 2.3 mW/cm2,respectively. Although the Turbo+light guides gave slightly greatermean power densities, there was nosignificant difference between powerdensities from the Turbo and theTurbo+ light guides (K-S p-value =.3243; Kruskal-Wallis, .5427).Therefore, the data from the Turboand Turbo+ light guides were com-bined, and the mean power densityfrom the two standard light guideswas 743 ± 6.1 mW/cm2 and that ofthe four Turbo light guides was1128 ± 22.1 mW/cm2. The effect ofthe distance from the light-guide tipon the power density is shown inTable 1, which also shows the per-centage decrease from the originalpower density.
The inverse relation between powerdensity and distance is shown inFigure 3. The power densitydecreased as the distance increased,but for all four Turbo light guidesits rate of decline was greater thanthat from the standard light guides.For the standard light guide, therelation between power density and distance was a third degreepolynomial equation with anadjusted R2 = 0.995. For the Turbolight guide, the relation between
power density and distance was asecond degree polynomial equationwith an adjusted R2 = 0.999.
Both the K-S statistic and theWilcoxon rank sum test showedthat the distribution of the powerdensities over the distance interval(0 to 10 mm away from the tip ofthe light guide) was significantlydifferent for the standard and Turbolight guides (Wilcoxon p-value =.0246; K-S p-value < .0001). Thetwo estimated polynomials inter-sected at 3.66 mm from the tip ofthe light guide. The 95% predictionintervals for the two polynomialsintersected at approximately 2.8and 4.8 mm from the tip of the lightguide (see Figure 3). Within this dis-tance interval (2.8–4.8 mm) the sta-
tistical power to determine whetheran observation from the Turbogroup would be greater than fromthe standard group declined from95% to 5%. Therefore, althoughinitially all the Turbo light guidesgave greater power-density readingsthan the standard light guides, atdistances greater than 5 mm awayfrom the tip, the standard lightguide delivered a greater powerdensity than the Turbo light guide.
The images of the light exiting fromthe tips of the light guides showedthat as the distance from the tipincreased the light diffused at awider angle of about 54 degreesfrom the Turbo light guides thanabout 25 degrees from the standardlight guide (Figure 4).
TABLE 1. EFFECT OF DISTANCE FROM THE STANDARD AND TURBO LIGHT GUIDES
TO THE RADIOMETER ON POWER DENSITY.
Mean Power Density
Standard Tip Turbo Tip
Distance Percentage of % Original
(mm) mW/cm2 ± SD Original Power mW/cm2 ± SD Power
0 743 ± 6.1 100 1128 ± 22.1 100
1 681 ± 6.2 92 944 ± 35.2 84
2 633 ± 6.0 85 782 ± 24.6 69
3 573 ± 3.0 77 613 ± 24.7 54
4 489 ± 3.3 66 470 ± 29.2 42
5 435 ± 3.0 59 351 ± 22.3 31
6 372 ± 4.1 50 263 ± 25.0 23
7 323 ± 2.4 44 194 ± 17.5 17
8 272 ± 3.1 37 142 ± 16.2 13
9 225 ± 5.2 30 101 ± 15.6 9
10 185 ± 1.7 25 68 ± 10.1 6
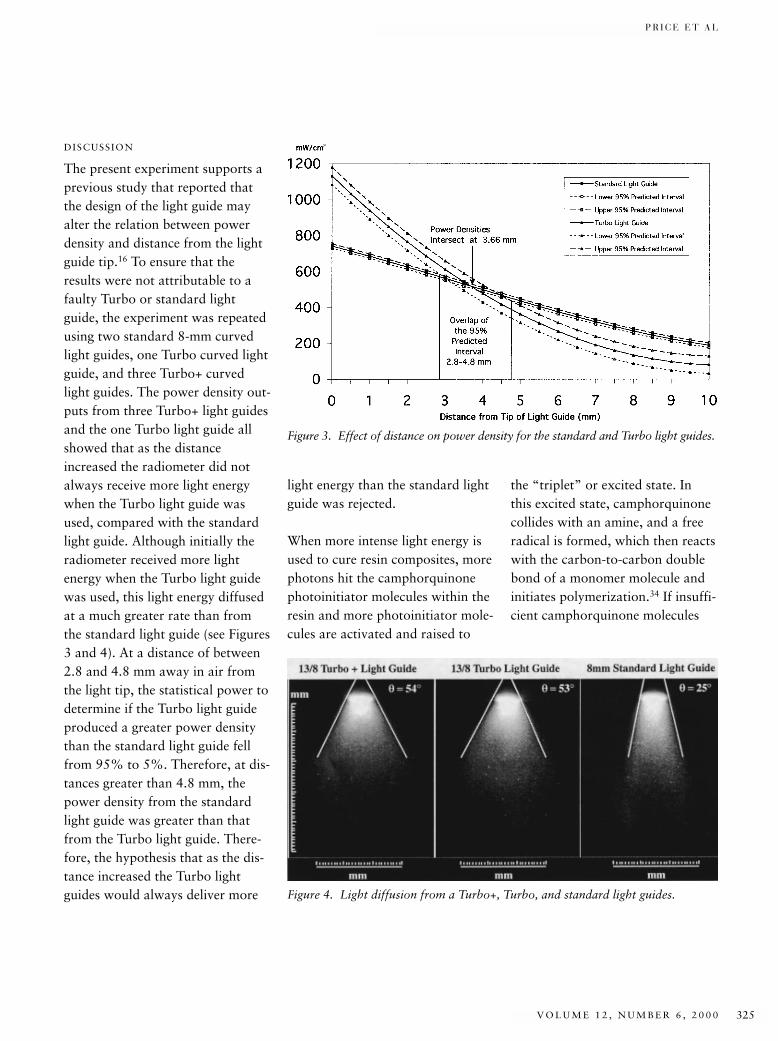
P R I C E E T A L
V O L U M E 1 2 , N U M B E R 6 , 2 0 0 0 325
DISCUSSION
The present experiment supports aprevious study that reported thatthe design of the light guide mayalter the relation between powerdensity and distance from the lightguide tip.16 To ensure that theresults were not attributable to afaulty Turbo or standard lightguide, the experiment was repeatedusing two standard 8-mm curvedlight guides, one Turbo curved lightguide, and three Turbo+ curvedlight guides. The power density out-puts from three Turbo+ light guidesand the one Turbo light guide allshowed that as the distanceincreased the radiometer did notalways receive more light energywhen the Turbo light guide wasused, compared with the standardlight guide. Although initially theradiometer received more lightenergy when the Turbo light guidewas used, this light energy diffusedat a much greater rate than fromthe standard light guide (see Figures3 and 4). At a distance of between2.8 and 4.8 mm away in air fromthe light tip, the statistical power todetermine if the Turbo light guideproduced a greater power densitythan the standard light guide fellfrom 95% to 5%. Therefore, at dis-tances greater than 4.8 mm, thepower density from the standardlight guide was greater than thatfrom the Turbo light guide. There-fore, the hypothesis that as the dis-tance increased the Turbo lightguides would always deliver more
light energy than the standard lightguide was rejected.
When more intense light energy isused to cure resin composites, morephotons hit the camphorquinonephotoinitiator molecules within theresin and more photoinitiator mole-cules are activated and raised to
the “triplet” or excited state. In this excited state, camphorquinonecollides with an amine, and a freeradical is formed, which then reactswith the carbon-to-carbon doublebond of a monomer molecule andinitiates polymerization.34 If insuffi-cient camphorquinone molecules
Figure 3. Effect of distance on power density for the standard and Turbo light guides.
Figure 4. Light diffusion from a Turbo+, Turbo, and standard light guides.
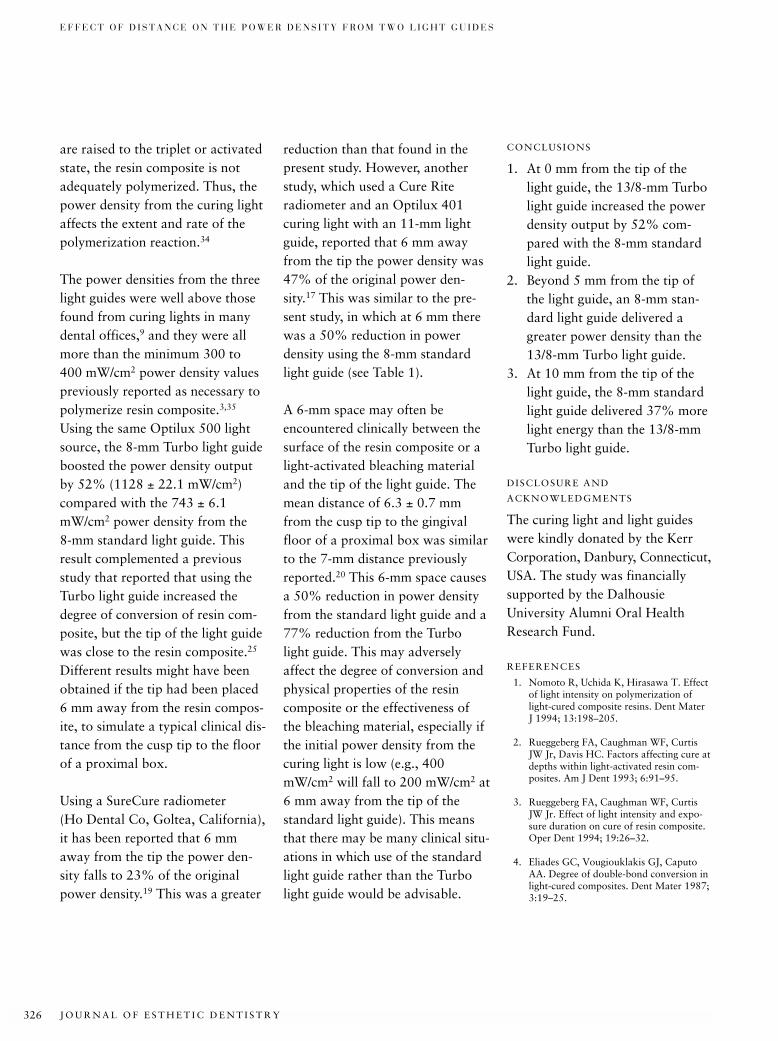
J O U R N A L O F E S T H E T I C D E N T I S T R Y326
E F F E C T O F D I S T A N C E O N T H E P O W E R D E N S I T Y F R O M T W O L I G H T G U I D E S
are raised to the triplet or activatedstate, the resin composite is notadequately polymerized. Thus, thepower density from the curing lightaffects the extent and rate of thepolymerization reaction.34
The power densities from the threelight guides were well above thosefound from curing lights in manydental offices,9 and they were allmore than the minimum 300 to 400 mW/cm2 power density valuespreviously reported as necessary topolymerize resin composite.3,35
Using the same Optilux 500 lightsource, the 8-mm Turbo light guideboosted the power density outputby 52% (1128 ± 22.1 mW/cm2)compared with the 743 ± 6.1mW/cm2 power density from the8-mm standard light guide. Thisresult complemented a previousstudy that reported that using theTurbo light guide increased thedegree of conversion of resin com-posite, but the tip of the light guidewas close to the resin composite.25
Different results might have beenobtained if the tip had been placed6 mm away from the resin compos-ite, to simulate a typical clinical dis-tance from the cusp tip to the floorof a proximal box.
Using a SureCure radiometer (Ho Dental Co, Goltea, California),it has been reported that 6 mmaway from the tip the power den-sity falls to 23% of the originalpower density.19 This was a greater
reduction than that found in thepresent study. However, anotherstudy, which used a Cure Riteradiometer and an Optilux 401 curing light with an 11-mm lightguide, reported that 6 mm awayfrom the tip the power density was47% of the original power den-sity.17 This was similar to the pre-sent study, in which at 6 mm therewas a 50% reduction in power density using the 8-mm standardlight guide (see Table 1).
A 6-mm space may often beencountered clinically between thesurface of the resin composite or alight-activated bleaching materialand the tip of the light guide. Themean distance of 6.3 ± 0.7 mmfrom the cusp tip to the gingivalfloor of a proximal box was similarto the 7-mm distance previouslyreported.20 This 6-mm space causesa 50% reduction in power densityfrom the standard light guide and a77% reduction from the Turbolight guide. This may adverselyaffect the degree of conversion andphysical properties of the resincomposite or the effectiveness ofthe bleaching material, especially ifthe initial power density from thecuring light is low (e.g., 400mW/cm2 will fall to 200 mW/cm2 at6 mm away from the tip of thestandard light guide). This meansthat there may be many clinical situ-ations in which use of the standardlight guide rather than the Turbolight guide would be advisable.
CONCLUSIONS
1. At 0 mm from the tip of thelight guide, the 13/8-mm Turbolight guide increased the powerdensity output by 52% com-pared with the 8-mm standardlight guide.
2. Beyond 5 mm from the tip ofthe light guide, an 8-mm stan-dard light guide delivered agreater power density than the13/8-mm Turbo light guide.
3. At 10 mm from the tip of thelight guide, the 8-mm standardlight guide delivered 37% morelight energy than the 13/8-mmTurbo light guide.
DISCLOSURE AND
ACKNOWLEDGMENTS
The curing light and light guideswere kindly donated by the KerrCorporation, Danbury, Connecticut,USA. The study was financiallysupported by the Dalhousie University Alumni Oral HealthResearch Fund.
REFERENCES
1. Nomoto R, Uchida K, Hirasawa T. Effectof light intensity on polymerization oflight-cured composite resins. Dent Mater J 1994; 13:198–205.
2. Rueggeberg FA, Caughman WF, CurtisJW Jr, Davis HC. Factors affecting cure atdepths within light-activated resin com-posites. Am J Dent 1993; 6:91–95.
3. Rueggeberg FA, Caughman WF, CurtisJW Jr. Effect of light intensity and expo-sure duration on cure of resin composite.Oper Dent 1994; 19:26–32.
4. Eliades GC, Vougiouklakis GJ, CaputoAA. Degree of double-bond conversion inlight-cured composites. Dent Mater 1987;3:19–25.
P R I C E E T A L
V O L U M E 1 2 , N U M B E R 6 , 2 0 0 0 327
5. Caughman WF, Caughman GB, ShiflettRA, Rueggeberg F, Schuster GS. Correla-tion of cytotoxicity, filler loading, and cur-ing time of dental composites. Biomateri-als 1991; 12:737–740.
6. Atmadja G, Bryant RW. Some factorsinfluencing the depth of cure of visiblelight-activated composite resins. Aust DentJ 1990; 35:213–218.
7. Shortall AC, Harrington E, Wilson HJ.Light-curing unit effectiveness assessed bydental radiometers. J Dent 1995;23:227–232.
8. Baharav H, Abraham D, Cardash HS,Helft M. Effect of exposure time on thedepth of polymerization of a visible light-cured composite resin. J Oral Rehabil1988; 15:167–172.
9. Pilo R, Oelgiesser D, Cardash HS. A sur-vey of output intensity and potential fordepth of cure among light-curing units inclinical use. J Dent 1999; 27:235–241.
10. Davidson-Kaban SS, Davidson CL, FeilzerAJ, de Gee AJ, Erdilek N. The effect ofcuring-light variations on bulk curing andwall-to-wall quality of two types and vari-ous shades of resin composites. DentMater 1997; 13:344–352.
11. Correr Sobrinho L, De Goes MF, ConsaniMA, Sinhoreti MAC, Knowles JC. Corre-lation between light intensity and exposuretime on the hardness of composite resin. J Mat Sci Mat Med 2000; 11:361–364.
12. Harris JS, Jacobsen PH, O’Doherty DM.The effect of curing light intensity and testtemperature on the dynamic mechanicalproperties of two polymer composites. J Oral Rehabil 1999; 26:635–639.
13. Ferracane JL, Mitchem JC, Condon JR,Todd R. Wear and marginal breakdown ofcomposites with various degrees of cure. J Dent Res 1997; 76:1508–1516.
14. Lee SY, Greener EH. Effect of excitationenergy on dentine bond strength and com-posite properties. J Dent 1994;22:175–181.
15. Sakaguchi RL, Douglas WH, Peters MC.Curing light performance and polymeriza-tion of composite restorative materials. J Dent 1992; 20:183–188.
16. Shortall AC, Harrington E. Effectivenessof battery powered light activation units.Br Dent J 1997; 183:95–100.
17. Pires JA, Cvitko E, Denehy GE, Swift EJJr. Effects of curing tip distance on lightintensity and composite resin microhard-ness. Quintessence Int 1993; 24:517–521.
18. Rueggeberg FA, Jordan DM. Effect oflight-tip distance on polymerization ofresin composite. Int J Prosthodont 1993;6:364–370.
19. Prati C, Chersoni S, Montebugnoli L,Montanari G. Effect of air, dentin andresin-based composite thickness on lightintensity reduction. Am J Dent 1999;12:231–234.
20. Yearn JA. Factors affecting cure of visiblelight activated composites. Int Dent J1985; 35:218–225.
21. Martin FE. A survey of the efficiency ofvisible light curing units. J Dent 1998;26:239–243.
22. Poulos JG, Styner DL. Curing lights:changes in intensity output with use overtime. Gen Dent 1997; 45:70–73.
23. Peutzfeldt A. Correlation between record-ings obtained with a light-intensity testerand degree of conversion of a light-curingresin. Scand J Dent Res 1994; 102:73–75.
24. Rueggeberg FA. Precision of hand-helddental radiometers. Quintessence Int 1993;24:391–396.
25. Curtis JW Jr, Rueggeberg FA, Lee AJ. Cur-ing efficiency of the Turbo Tip. Gen Dent1995; 43:428–433.
26. Clinical Research Associates. Resin curinglights: rapid cure. Clinical Research Asso-ciates Newsletter 2000; 24:1–4.
27. Apollo 95E 1-3 Second Curing Instruc-tions. Westlake Village, CA: Dental/Medical Diagnostic Systems, 1998:1–17.
28. Peutzfeldt A, Sahafi A, Asmussen E. Characterization of resin composites polymerized with plasma arc curing units.Dent Mater 2000; 16:330–336.
29. Brackett WW, Haisch LD, Covey DA.Effect of plasma arc curing on themicroleakage of Class V resin-based com-posite restorations. Am J Dent 2000;13:121–122.
30. Burgess JO, DeGoes M, Walker R, RippsAH. An evaluation of four light-curingunits comparing soft and hard curing.Pract Periodont Aesthet Dent 1999;11:125–132.
31. Harrington L, Wilson HJ. Determinationof radiation energy emitted by light activa-tion units. J Oral Rehabil 1995; 22:377–385.
32. Leonard DL, Charlton DG, Hilton TJ.Effect of curing-tip diameter on the accu-racy of dental radiometers. Oper Dent1999; 24:31–37.
33. Versluis A, Tantbirojn D, Douglas WH.Do dental composites always shrinktoward the light? J Dent Res 1998;77:1435–1445.
34. Rueggeberg F. Contemporary issues inphotocuring. Compendium 1999; 20:S4–15.
35. Curing radiometer operating instructions.Danbury, CT: Demetron Research Corp.,1990.
Presented at the Canadian Academy ofRestorative Dentistry and ProsthodonticsAnnual Scientific Session, September 14–16,2000, Halifax, Nova Scotia, Canada.
Reprint requests: Dr. Richard Price, DDS,MS, FDS RCS (Edin), Associate Professor,Department of Dental Clinical Sciences, Faculty of Dentistry, Dalhousie University,Halifax, Nova Scotia, Canada, B3H 3J5; e-mail: [email protected]© 2000 BC Decker Inc
J O U R N A L O F E S T H E T I C D E N T I S T R Y328
*Assistant Professor, Department of Operative Dentistry, College of Dentistry, The University of Iowa,Iowa City, Iowa †Professor, Section Director, Dental Materials, Department of Oral Rehabilitation, School of Dentistry,Medical College of Georgia, Augusta, Georgia
Effect of Ramped Light Intensity on PolymerizationForce and Conversion in a Photoactivated Composite
MURRAY R. BOUSCHLICHER, DDS, MS*
FREDERICK A. RUEGGEBERG, DDS, MS †
ABSTRACT
Purpose: This study evaluated the effect of ramped light intensity on the polymerization shrink-age forces and degrees of conversion (DC) of a hybrid composite.
Materials and Methods: Composite samples were bonded between two steel rods (2.50 mm diame-ter, 1.25 mm apart, configuration factor = 1.0) mounted in a universal testing machine using a con-stant displacement mode. Polymerization contraction force was recorded for 250 seconds underfour light exposure conditions: group 1, STD: (40 s × 800 mW/cm2); group 2, EXP: (150 mW/cm2
logarithmic increase to 800 mW/cm2 over 15 s) + (25 s × 800 mW/cm2); group 3, 2-STEP: (10 s ×150 mW/cm2) + (30 s × 800 mW/cm2); group 4, MED: (80 s × 400 mW/cm2). Maximum curingforce (N250s) and maximum force rate of the four groups were compared using one-way analysis ofvariance (ANOVA) (α = 0.05) and the Tukey test. Degrees of conversion obtained with STD, EXP,and MED cure modes were evaluated at three depths (top surface, 1 mm, and 2 mm) using Fouriertransform infrared spectroscopy (FTIR).
Results: Maximum rates of polymerization shrinkage force development and standard deviations(SD) in ascending order were group 4, MED: 0.33 ± 0.03 N/s; group 2, EXP: 0.35 ± 0.06 N/s; group1, STD: 0.44 ± 0.03 N/s; and group 3, 2-STEP: 0.46 ± 0.07 N/s. Maximum rates of polymerizationshrinkage force development of group 2, EXP and group 4, MED were statistically equivalent andlower than group 1, STD and group 3, 2-STEP. Maximum shrinkage forces (± SD) in ascendingorder were group 2, EXP: 20.4 ± 2.5 N; group 4, MED: 25.8 ± 1.0 N; group 3, 2-STEP: 27.4 ± 5.8N, and group 1, STD: 30.5 ± 2.7 N. Maximum force of the EXP mode was statistically lower thanMED, 2-STEP, and STD curing modes. The EXP ramp was successful in reducing the conversion rateat the top surface and at 1.0-mm depth, but it did not affect the total conversion compared to theSTD 40-second cure mode. There was no difference in DC at the top surface and 1-mm depth withmode of cure. The MED cure mode resulted in a higher DC than the EXP mode at a depth of 2 mm.
CLINICAL SIGNIFICANCE
Maximum shrinkage force and force rate exhibited during the first 250 seconds of polymeriza-tion were significantly lower using a ramped light intensity exposure. Ramped light intensitydecreased conversion rate at the top surface and at 1.0-mm depth, and did not affect the totalextent of conversion compared to a standard 40-second, single-intensity cure mode. The slowerconversion rate resulting from ramped light intensity helped to reduce the rate and maximumpolymerization stress, but would not be expected to compromise the physical properties for therestorative material, since similar degrees of conversion were obtained.
(J Esthet Dent 12:328–339, 2000)
B O U S C H L I C H E R A N D R U E G G E B E R G
V O L U M E 1 2 , N U M B E R 6 , 2 0 0 0 329
Manufacturers have introducedconventional quartz tungsten
halogen (QTH), xenon plasma arc(PAC), and argon ion laser curing-lights, with increasingly higher lightintensities or power densities (PD,units = mW/cm2) for photoinitiationof resin composite polymerization.Use of a higher PD for fixed expo-sure durations generally results in ahigher degree of monomer conver-sion to polymer with associatedimprovements in the mechanicalproperties of resin composite beingpolymerized.1 However, higherpolymerization shrinkage forcerates generated by more rapid con-version may result in loss of adhesionat the tooth–restoration interface. Ifcontraction forces exceed the bondstrength at this interface, the result-ing interfacial gap can lead to stain-ing, marginal leakage, tooth sensi-tivity, and recurrent caries.2–4 If thisinterface remains intact, contrac-tion forces may transfer stress tosurrounding tooth structure.5,6 Ifthe surrounding tooth structure iscompliant, the resulting strain ordeformation may cancel a portionor all of the developing stress.However, in high configuration-factor (C-factor) restorations, frac-tures in surrounding high-modulusenamel have been reported.7
Whereas an elevated PD is desirablefor achieving high conversion andimproved mechanical properties inthe shortest possible exposure inter-val, lower light intensities overlonger exposure intervals are more
favorable for maintenance of thetooth–restoration interface.8 Lowerlight intensity minimizes marginalgap formation,9 with less residualstress transfer.10 This finding pre-sumably results from a moreextended period of viscous flow inthe pre-gelation phase within the set-ting resin similar to that observed in chemical-cure composites.Within limits, it is possible to com-pensate for a lower PD by increas-ing exposure duration to obtain anenergy density (ED, units = mJ/cm2
= mW/cm2 × s) that results in anequivalent degree of conversion(DC).9 However, the increased expo-sure duration required to obtain anED resulting in an equivalent DCmay be objectionable to cliniciansfrom a time utilization standpoint.
When an initial, low PD is increasedto a higher, final PD by either astepped or ramped transition, theresulting “soft start” energy appli-cation sequence may result inimproved marginal adaptation anda DC equivalent to that of a single,continuous-intensity energy appli-cation sequence. Several studiesreport improved marginal adaptationwith stepped or ramped intensityincreases in PD that may improvemarginal adaptation by allowingviscous flow of the material duringpolymerization.8,11–14 Commerciallyavailable light-curing units withEAS that transition from a low tohigh PD include a stepped increase(Elipar® Highlight, ESPE America,Norristown, Pennsylvania), a dis-
continuous or interrupted stepincrease (VIP or Variable IntensityPolymerizer, Bisco, Inc., Schaumburg,Illinois), and a logarithmic increase(Elipar Trilight, ESPE America).
The purpose of this study was toevaluate the stress development(maximal stress value and stressrate) as well as conversion rate of acommercially available, photoiniti-ated resin composite when exposedto a variety of curing-light exposureprofiles. It was hypothesized thatlight exposure methods applyinginitial low power density valueswould provide significantly lowerstress values than a continuous,high-intensity application.
MATERIALS AND METHODS
Threaded steel rods were machinedto a cylindrical cross-section 2.50 mm diameter and 15.0 mmheight. The flat bonding surfaceswere microetched with 30 µsilanized silica (CoJet-Sand, ESPEAmerica), silanized with ESPE-Sil(ESPE America), and allowed to airdry for 60 seconds. The rods wereattached to the load cell andcrosshead of a universal testingmachine (UTM, MTS 318 BiaxialTest System, MTS Systems Corp.,Eden Prairie, Minnesota) in a tensiletest configuration with an extenso-meter maintaining constant dis-placement of 1.250 ± 0.001 mm(Figure 1). An unfilled bondingresin (All Bond 2 D/E Resin, Bisco,Inc.) was applied to the silanatedrod ends, brush thinned, and light-
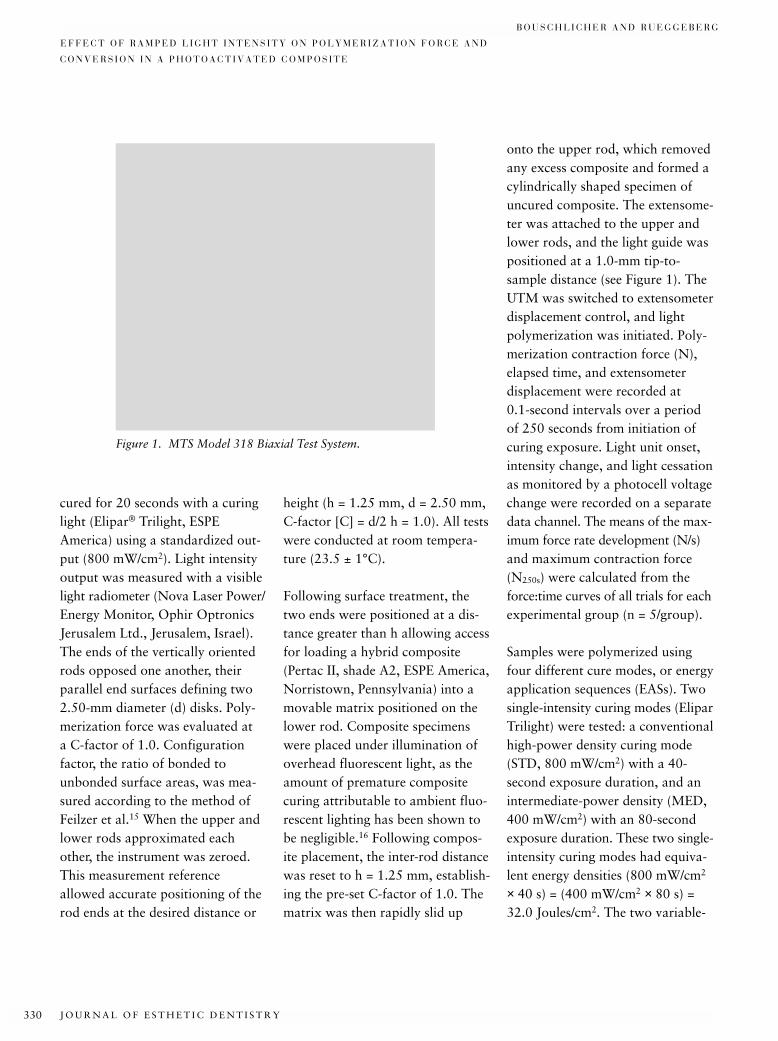
J O U R N A L O F E S T H E T I C D E N T I S T R Y330
E F F E C T O F R A M P E D L I G H T I N T E N S I T Y O N P O L Y M E R I Z A T I O N F O R C E A N D
C O N V E R S I O N I N A P H O T O A C T I V A T E D C O M P O S I T E
B O U S C H L I C H E R A N D R U E G G E B E R G
cured for 20 seconds with a curinglight (Elipar® Trilight, ESPE America) using a standardized out-put (800 mW/cm2). Light intensityoutput was measured with a visiblelight radiometer (Nova Laser Power/Energy Monitor, Ophir OptronicsJerusalem Ltd., Jerusalem, Israel).The ends of the vertically orientedrods opposed one another, theirparallel end surfaces defining two2.50-mm diameter (d) disks. Poly-merization force was evaluated at a C-factor of 1.0. Configurationfactor, the ratio of bonded tounbonded surface areas, was mea-sured according to the method ofFeilzer et al.15 When the upper andlower rods approximated eachother, the instrument was zeroed.This measurement referenceallowed accurate positioning of therod ends at the desired distance or
onto the upper rod, which removedany excess composite and formed acylindrically shaped specimen ofuncured composite. The extensome-ter was attached to the upper andlower rods, and the light guide waspositioned at a 1.0-mm tip-to-sample distance (see Figure 1). TheUTM was switched to extensometerdisplacement control, and lightpolymerization was initiated. Poly-merization contraction force (N),elapsed time, and extensometer displacement were recorded at 0.1-second intervals over a periodof 250 seconds from initiation ofcuring exposure. Light unit onset,intensity change, and light cessationas monitored by a photocell voltagechange were recorded on a separatedata channel. The means of the max-imum force rate development (N/s)and maximum contraction force(N250s) were calculated from theforce:time curves of all trials for eachexperimental group (n = 5/group).
Samples were polymerized usingfour different cure modes, or energyapplication sequences (EASs). Twosingle-intensity curing modes (EliparTrilight) were tested: a conventionalhigh-power density curing mode(STD, 800 mW/cm2) with a 40-second exposure duration, and anintermediate-power density (MED,400 mW/cm2) with an 80-secondexposure duration. These two single-intensity curing modes had equiva-lent energy densities (800 mW/cm2
× 40 s) = (400 mW/cm2 × 80 s) =32.0 Joules/cm2. The two variable-
height (h = 1.25 mm, d = 2.50 mm,C-factor [C] = d/2 h = 1.0). All testswere conducted at room tempera-ture (23.5 ± 1°C).
Following surface treatment, thetwo ends were positioned at a dis-tance greater than h allowing accessfor loading a hybrid composite(Pertac II, shade A2, ESPE America,Norristown, Pennsylvania) into amovable matrix positioned on thelower rod. Composite specimenswere placed under illumination ofoverhead fluorescent light, as theamount of premature compositecuring attributable to ambient fluo-rescent lighting has been shown tobe negligible.16 Following compos-ite placement, the inter-rod distancewas reset to h = 1.25 mm, establish-ing the pre-set C-factor of 1.0. Thematrix was then rapidly slid up
Figure 1. MTS Model 318 Biaxial Test System.
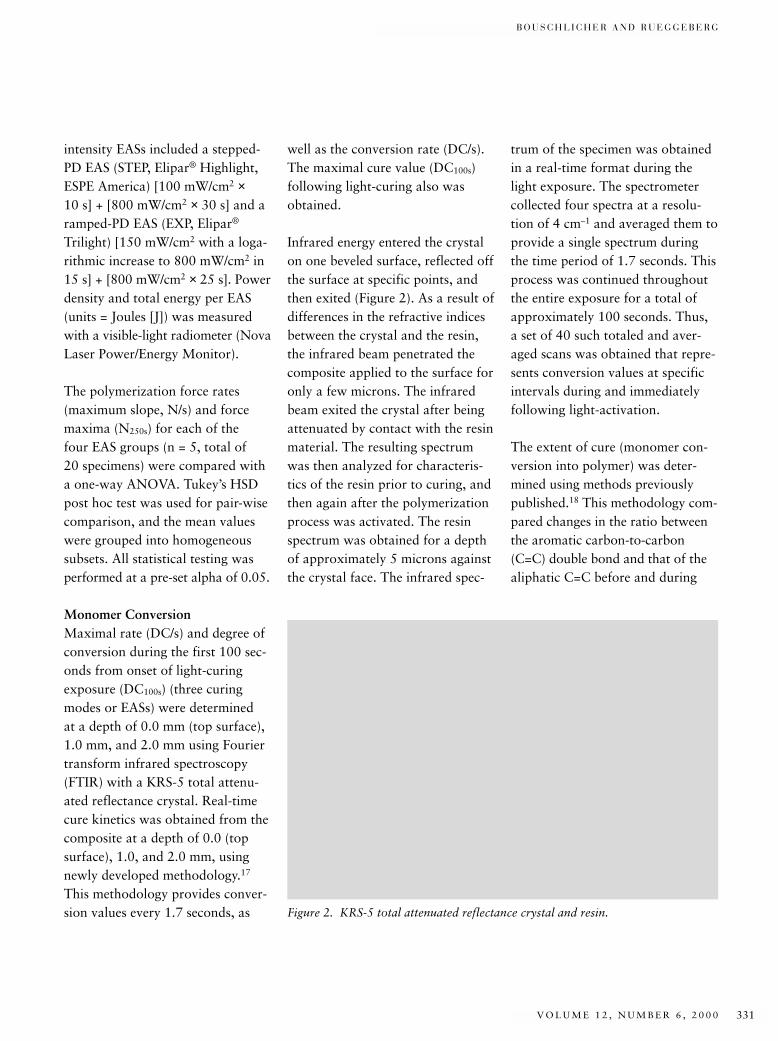
B O U S C H L I C H E R A N D R U E G G E B E R G
V O L U M E 1 2 , N U M B E R 6 , 2 0 0 0 331
intensity EASs included a stepped-PD EAS (STEP, Elipar® Highlight,ESPE America) [100 mW/cm2 ×10 s] + [800 mW/cm2 × 30 s] and aramped-PD EAS (EXP, Elipar®
Trilight) [150 mW/cm2 with a loga-rithmic increase to 800 mW/cm2 in15 s] + [800 mW/cm2 × 25 s]. Powerdensity and total energy per EAS(units = Joules [J]) was measuredwith a visible-light radiometer (NovaLaser Power/Energy Monitor).
The polymerization force rates(maximum slope, N/s) and forcemaxima (N250s) for each of the four EAS groups (n = 5, total of 20 specimens) were compared witha one-way ANOVA. Tukey’s HSDpost hoc test was used for pair-wisecomparison, and the mean valueswere grouped into homogeneoussubsets. All statistical testing wasperformed at a pre-set alpha of 0.05.
Monomer ConversionMaximal rate (DC/s) and degree ofconversion during the first 100 sec-onds from onset of light-curingexposure (DC100s) (three curingmodes or EASs) were determined at a depth of 0.0 mm (top surface),1.0 mm, and 2.0 mm using Fouriertransform infrared spectroscopy(FTIR) with a KRS-5 total attenu-ated reflectance crystal. Real-timecure kinetics was obtained from thecomposite at a depth of 0.0 (topsurface), 1.0, and 2.0 mm, usingnewly developed methodology.17
This methodology provides conver-sion values every 1.7 seconds, as
well as the conversion rate (DC/s).The maximal cure value (DC100s)following light-curing also wasobtained.
Infrared energy entered the crystalon one beveled surface, reflected offthe surface at specific points, andthen exited (Figure 2). As a result ofdifferences in the refractive indicesbetween the crystal and the resin,the infrared beam penetrated thecomposite applied to the surface foronly a few microns. The infraredbeam exited the crystal after beingattenuated by contact with the resinmaterial. The resulting spectrumwas then analyzed for characteris-tics of the resin prior to curing, andthen again after the polymerizationprocess was activated. The resinspectrum was obtained for a depthof approximately 5 microns againstthe crystal face. The infrared spec-
trum of the specimen was obtainedin a real-time format during thelight exposure. The spectrometercollected four spectra at a resolu-tion of 4 cm–1 and averaged them toprovide a single spectrum duringthe time period of 1.7 seconds. Thisprocess was continued throughoutthe entire exposure for a total ofapproximately 100 seconds. Thus,a set of 40 such totaled and aver-aged scans was obtained that repre-sents conversion values at specificintervals during and immediatelyfollowing light-activation.
The extent of cure (monomer con-version into polymer) was deter-mined using methods previouslypublished.18 This methodology com-pared changes in the ratio betweenthe aromatic carbon-to-carbon(C=C) double bond and that of thealiphatic C=C before and during
Figure 2. KRS-5 total attenuated reflectance crystal and resin.
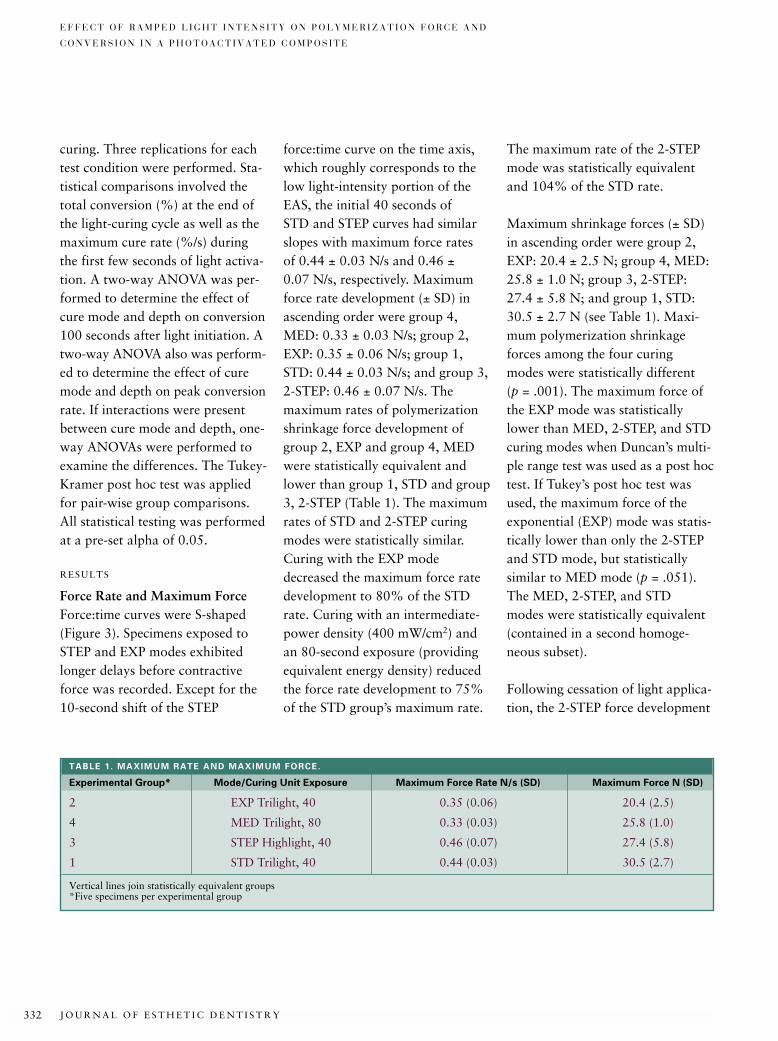
J O U R N A L O F E S T H E T I C D E N T I S T R Y332
E F F E C T O F R A M P E D L I G H T I N T E N S I T Y O N P O L Y M E R I Z A T I O N F O R C E A N D
C O N V E R S I O N I N A P H O T O A C T I V A T E D C O M P O S I T E
curing. Three replications for eachtest condition were performed. Sta-tistical comparisons involved thetotal conversion (%) at the end ofthe light-curing cycle as well as themaximum cure rate (%/s) duringthe first few seconds of light activa-tion. A two-way ANOVA was per-formed to determine the effect ofcure mode and depth on conversion100 seconds after light initiation. Atwo-way ANOVA also was perform-ed to determine the effect of curemode and depth on peak conversionrate. If interactions were presentbetween cure mode and depth, one-way ANOVAs were performed toexamine the differences. The Tukey-Kramer post hoc test was appliedfor pair-wise group comparisons.All statistical testing was performedat a pre-set alpha of 0.05.
RESULTS
Force Rate and Maximum ForceForce:time curves were S-shaped(Figure 3). Specimens exposed toSTEP and EXP modes exhibitedlonger delays before contractiveforce was recorded. Except for the10-second shift of the STEP
force:time curve on the time axis,which roughly corresponds to thelow light-intensity portion of theEAS, the initial 40 seconds of STD and STEP curves had similarslopes with maximum force rates of 0.44 ± 0.03 N/s and 0.46 ±0.07 N/s, respectively. Maximumforce rate development (± SD) inascending order were group 4,MED: 0.33 ± 0.03 N/s; group 2,EXP: 0.35 ± 0.06 N/s; group 1,STD: 0.44 ± 0.03 N/s; and group 3,2-STEP: 0.46 ± 0.07 N/s. The maximum rates of polymerizationshrinkage force development ofgroup 2, EXP and group 4, MEDwere statistically equivalent andlower than group 1, STD and group3, 2-STEP (Table 1). The maximumrates of STD and 2-STEP curingmodes were statistically similar.Curing with the EXP modedecreased the maximum force ratedevelopment to 80% of the STDrate. Curing with an intermediate-power density (400 mW/cm2) andan 80-second exposure (providingequivalent energy density) reducedthe force rate development to 75%of the STD group’s maximum rate.
The maximum rate of the 2-STEPmode was statistically equivalentand 104% of the STD rate.
Maximum shrinkage forces (± SD)in ascending order were group 2,EXP: 20.4 ± 2.5 N; group 4, MED:25.8 ± 1.0 N; group 3, 2-STEP:27.4 ± 5.8 N; and group 1, STD:30.5 ± 2.7 N (see Table 1). Maxi-mum polymerization shrinkageforces among the four curing modes were statistically different (p = .001). The maximum force ofthe EXP mode was statisticallylower than MED, 2-STEP, and STDcuring modes when Duncan’s multi-ple range test was used as a post hoctest. If Tukey’s post hoc test wasused, the maximum force of theexponential (EXP) mode was statis-tically lower than only the 2-STEPand STD mode, but statisticallysimilar to MED mode (p = .051).The MED, 2-STEP, and STD modes were statistically equivalent(contained in a second homoge-neous subset).
Following cessation of light applica-tion, the 2-STEP force development
TABLE 1. MAXIMUM RATE AND MAXIMUM FORCE.
Experimental Group* Mode/Curing Unit Exposure Maximum Force Rate N/s (SD) Maximum Force N (SD)
2 EXP Trilight, 40 0.35 (0.06) 20.4 (2.5)
4 MED Trilight, 80 0.33 (0.03) 25.8 (1.0)
3 STEP Highlight, 40 0.46 (0.07) 27.4 (5.8)
1 STD Trilight, 40 0.44 (0.03) 30.5 (2.7)
Vertical lines join statistically equivalent groups*Five specimens per experimental group
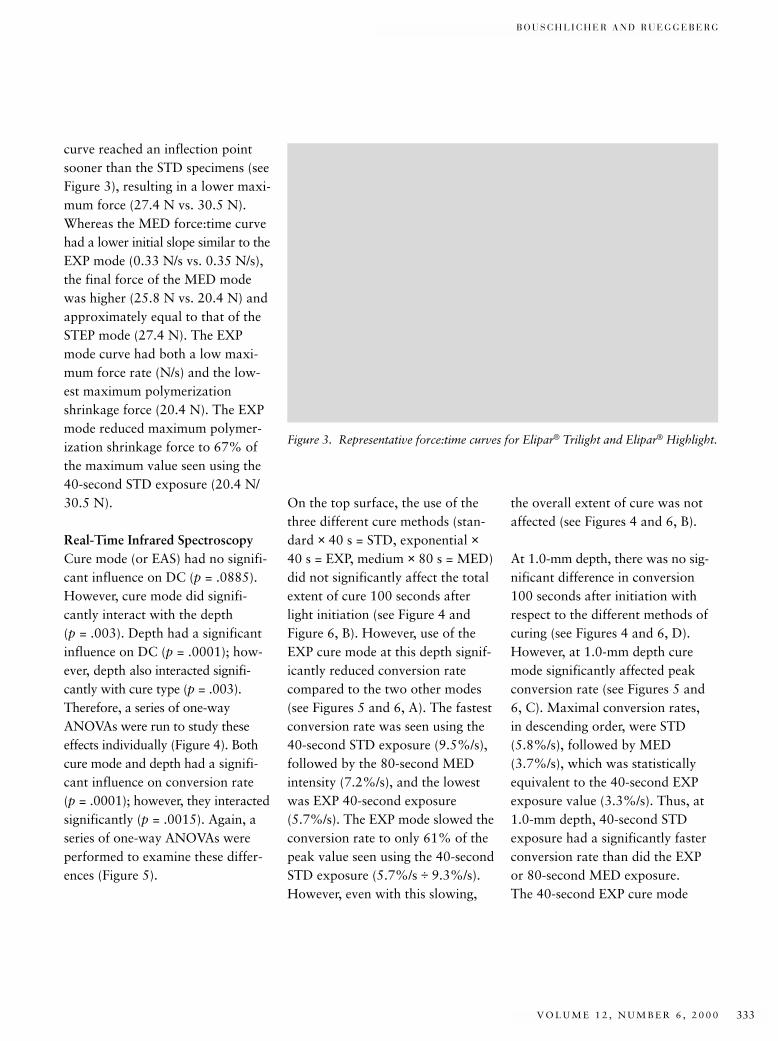
B O U S C H L I C H E R A N D R U E G G E B E R G
V O L U M E 1 2 , N U M B E R 6 , 2 0 0 0 333
curve reached an inflection pointsooner than the STD specimens (seeFigure 3), resulting in a lower maxi-mum force (27.4 N vs. 30.5 N).Whereas the MED force:time curvehad a lower initial slope similar to theEXP mode (0.33 N/s vs. 0.35 N/s),the final force of the MED modewas higher (25.8 N vs. 20.4 N) andapproximately equal to that of theSTEP mode (27.4 N). The EXPmode curve had both a low maxi-mum force rate (N/s) and the low-est maximum polymerizationshrinkage force (20.4 N). The EXPmode reduced maximum polymer-ization shrinkage force to 67% ofthe maximum value seen using the40-second STD exposure (20.4 N/30.5 N).
Real-Time Infrared SpectroscopyCure mode (or EAS) had no signifi-cant influence on DC (p = .0885).However, cure mode did signifi-cantly interact with the depth (p = .003). Depth had a significantinfluence on DC (p = .0001); how-ever, depth also interacted signifi-cantly with cure type (p = .003).Therefore, a series of one-wayANOVAs were run to study theseeffects individually (Figure 4). Bothcure mode and depth had a signifi-cant influence on conversion rate (p = .0001); however, they interactedsignificantly (p = .0015). Again, aseries of one-way ANOVAs wereperformed to examine these differ-ences (Figure 5).
On the top surface, the use of thethree different cure methods (stan-dard × 40 s = STD, exponential ×40 s = EXP, medium × 80 s = MED)did not significantly affect the totalextent of cure 100 seconds afterlight initiation (see Figure 4 andFigure 6, B). However, use of theEXP cure mode at this depth signif-icantly reduced conversion ratecompared to the two other modes(see Figures 5 and 6, A). The fastestconversion rate was seen using the40-second STD exposure (9.5%/s),followed by the 80-second MEDintensity (7.2%/s), and the lowestwas EXP 40-second exposure(5.7%/s). The EXP mode slowed theconversion rate to only 61% of thepeak value seen using the 40-secondSTD exposure (5.7%/s ÷ 9.3%/s).However, even with this slowing,
the overall extent of cure was notaffected (see Figures 4 and 6, B).
At 1.0-mm depth, there was no sig-nificant difference in conversion100 seconds after initiation withrespect to the different methods ofcuring (see Figures 4 and 6, D).However, at 1.0-mm depth curemode significantly affected peakconversion rate (see Figures 5 and6, C). Maximal conversion rates, in descending order, were STD(5.8%/s), followed by MED(3.7%/s), which was statisticallyequivalent to the 40-second EXPexposure value (3.3%/s). Thus, at1.0-mm depth, 40-second STDexposure had a significantly fasterconversion rate than did the EXP or 80-second MED exposure. The 40-second EXP cure mode
Figure 3. Representative force:time curves for Elipar® Trilight and Elipar® Highlight.
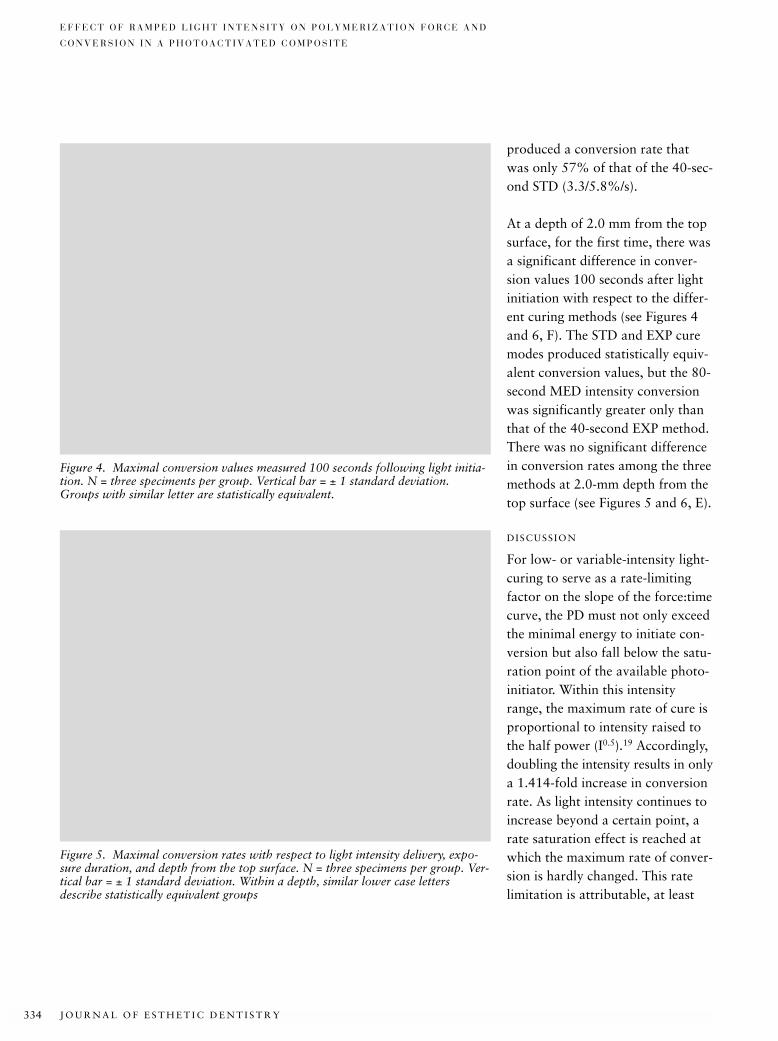
J O U R N A L O F E S T H E T I C D E N T I S T R Y334
E F F E C T O F R A M P E D L I G H T I N T E N S I T Y O N P O L Y M E R I Z A T I O N F O R C E A N D
C O N V E R S I O N I N A P H O T O A C T I V A T E D C O M P O S I T E
produced a conversion rate thatwas only 57% of that of the 40-sec-ond STD (3.3/5.8%/s).
At a depth of 2.0 mm from the topsurface, for the first time, there wasa significant difference in conver-sion values 100 seconds after lightinitiation with respect to the differ-ent curing methods (see Figures 4and 6, F). The STD and EXP curemodes produced statistically equiv-alent conversion values, but the 80-second MED intensity conversionwas significantly greater only thanthat of the 40-second EXP method.There was no significant differencein conversion rates among the threemethods at 2.0-mm depth from thetop surface (see Figures 5 and 6, E).
DISCUSSION
For low- or variable-intensity light-curing to serve as a rate-limitingfactor on the slope of the force:timecurve, the PD must not only exceedthe minimal energy to initiate con-version but also fall below the satu-ration point of the available photo-initiator. Within this intensityrange, the maximum rate of cure isproportional to intensity raised tothe half power (I0.5).19 Accordingly,doubling the intensity results in onlya 1.414-fold increase in conversionrate. As light intensity continues toincrease beyond a certain point, arate saturation effect is reached atwhich the maximum rate of conver-sion is hardly changed. This ratelimitation is attributable, at least
Figure 4. Maximal conversion values measured 100 seconds following light initia-tion. N = three speciments per group. Vertical bar = ± 1 standard deviation.Groups with similar letter are statistically equivalent.
Figure 5. Maximal conversion rates with respect to light intensity delivery, expo-sure duration, and depth from the top surface. N = three specimens per group. Ver-tical bar = ± 1 standard deviation. Within a depth, similar lower case lettersdescribe statistically equivalent groups
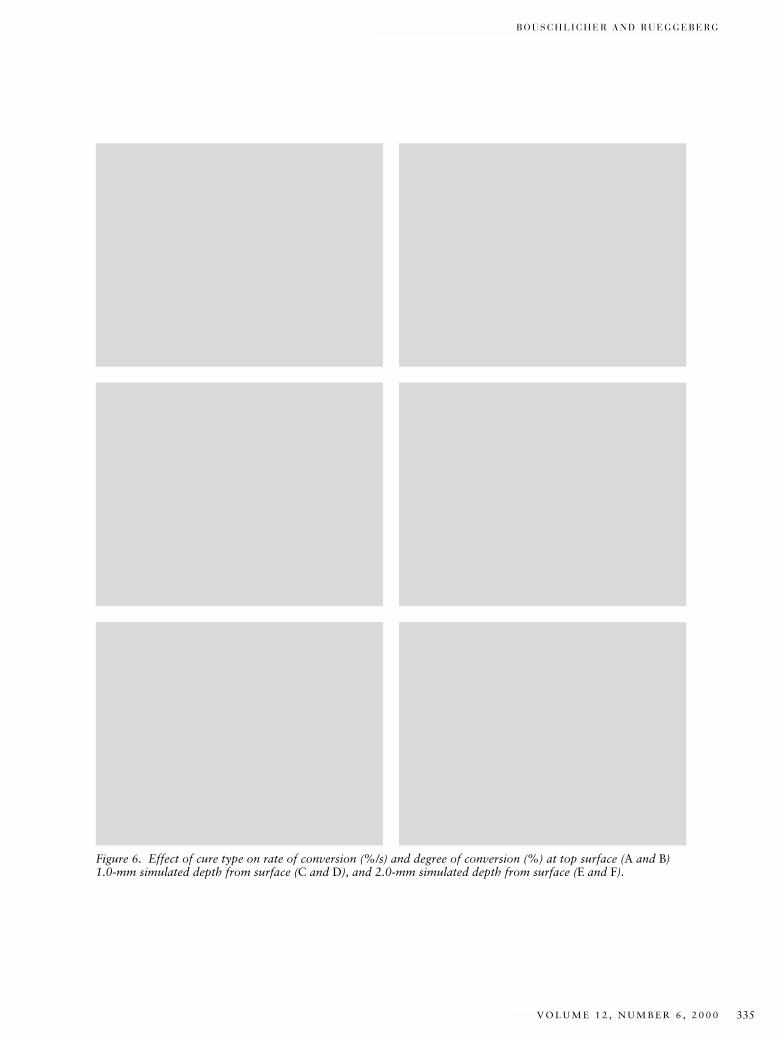
B O U S C H L I C H E R A N D R U E G G E B E R G
V O L U M E 1 2 , N U M B E R 6 , 2 0 0 0 335
Figure 6. Effect of cure type on rate of conversion (%/s) and degree of conversion (%) at top surface (A and B)1.0-mm simulated depth from surface (C and D), and 2.0-mm simulated depth from surface (E and F).
J O U R N A L O F E S T H E T I C D E N T I S T R Y336
E F F E C T O F R A M P E D L I G H T I N T E N S I T Y O N P O L Y M E R I Z A T I O N F O R C E A N D
C O N V E R S I O N I N A P H O T O A C T I V A T E D C O M P O S I T E
partly, to a decrease in the produc-tion of initiating radicals underintense illumination.20 Therefore,further increases in light intensitymay not affect the rate of conversion.
However, within the previouslymentioned intensity range, the con-version rate can be manipulated byacting on the initiation rate throughthe intensity (or PD) of the curinglight. The initial low PD of a vari-able light intensity EAS reduces theformation of free radicals, therebydecreasing the rate of conversion.Thus, reduced intensity values allowan extended time for compositeflow prior to mobility restrictionsbrought on by gelation and solidifi-cation of the irradiated material.Higher light intensity following theinitial low PD phase of the EAS isnecessary to obtain a DC equivalentto a standard single-intensity EAS.This equivalent DC must beachieved without incurring a clini-cally unacceptable time penalty forthe total exposure duration. Slow-ing the conversion rate by loweringthe PD is most critical at theunbound, top surface of the restora-tion that can relieve stress by flow.The external surface of the restora-tion also is the most highly irradiatedsurface. Deeper within the restora-tion, polymerization rates andshrinkage force rates are lower, sincelight attenuation by the overlyingthickness of composite slows thereaction rate. Therefore, to be effec-tive, a variable-intensity EAS should
demonstrate a reduced rate of con-version (%/s or DC/s) at the top surface. One would also expect areduced force rate (N/s), an equiva-lent degree of monomer conversion(DC), and exposure durationsroughly equivalent to a standard,single-intensity curing mode.
The EXP ramp was successful inreducing the conversion rate at thetop surface and at 1.0 mm beneaththe top surface, while obtaining aDC that was statistically equivalentto the STD 40-second cure mode.The lower conversion rates (%/s)recorded with EXP and MED curemodes had correspondingly lowrates of polymerization shrinkageforce development. Whereas a simi-lar DC was observed at the top sur-face and 1-mm depths, maximumpolymerization shrinkage forcesrecorded with these two EAS weredissimilar. The mean maximumforce-rates (N/s) of MED and EXPcure modes were similar; however,the EXP force:time curves had lowerinflection points and lower meanmaximum force. The lower forcerate, lower maximum force, andequivalent DC of the EXP modewould presumably optimize mainte-nance of the bonded interface with-out compromising the mechanicalproperties and biocompatibility thatare associated with a high DC.
The 80-second MED EAS demon-strated both a reduced conversionrate (%/s) and a reduced maximum
force rate (N/s). The conversionrate using this exposure methodwas approximately 75% that of the40-second STD exposure (7.2 %/s ÷9.5%/s). This reduction in forcerate with reduced PD is consistentwith previously reported results.9
Lower conversion rate with anaccompanying reduction in the forcerate at the surface of the compositemay be responsible for the improvedmarginal adaptation reported byseveral studies that have examinedreduced PD curing.7,10–12
Halving the intensity, but doublingthe exposure time (MED: 400 mW/cm2 × 80 s vs. STD: 800 mW/cm2 ×40 s) to provide similar ED (32 J/cm2)had no effect on total conversion atthe top surface. Similarly, there wasno difference in degree of conver-sion at a simulated depth of 1.0 mm100 seconds after light initiation.Also, at this depth, the 80-secondMED intensity conversion rate wasequivalent to both the 40-secondSTD and EXP rates. However, at2.0 mm from the top surface, the80-second MED exposure produceda significantly greater DC than wasachieved with the EXP mode. Thisincreased DC is probably related tothe more extended temperatureincrease from the curing light andto the exotherm reaction. Thesefactors may result in higher thermalmobility of the reacting network,which, in turn, leads to enhancedconversion of C=C double bonds.Although the DC achieved with the
B O U S C H L I C H E R A N D R U E G G E B E R G
V O L U M E 1 2 , N U M B E R 6 , 2 0 0 0 337
MED mode at 2.0 mm was numeri-cally higher than that with the 40-second STD mode, they were statis-tically equivalent. At 2.0-mm depth,there was no significant differencein conversion rates among the different treatments.
The current study confirmed find-ings that evaluated the “soft-start,”or stepped light intensity, mode ofthe Elipar Highlight. A prior studyfound statistically equivalent forcerates, maximum forces, and DC forequivalent exposure durations ofthe STD and STEP cure modes. Thecurrent study used the STD curemode of the newer Elipar Trilight asa control for STEP cure mode ofthe earlier Elipar Highlight. As inthe prior study, the STD and STEPcure modes resulted in similar forcerates and maximum forces. Whereassome studies report improved mar-ginal adaptation using the EliparHighlight,12,21 the results of thisstudy and a prior study found nodifference in force rate or maximumforce between the STD and STEPcure modes.22 Such findings suggestthat no improvement in marginaladaptation would be expectedbecause of decreased tensile forceswith the specific composite and C-factors tested. This is in agree-ment with Friedl and colleagues,23
who found that using a low-startcuring-light intensity did not pro-vide better marginal adaptation inClass V composite resin and poly-acid-modified resin restorations.
In the present study, a single light-curing unit was used to cure a 2.5-mm diameter cylindrical compos-ite specimen from one side only. Aprior study tested a higher C-factor(d = 5.0 mm, h = 1.25, C = d/2h =2.0) where the 5.0-mm diametersample required simultaneous useof two curing lights, owing to con-cerns over depth-of-cure and thetemporal effects of a stepped powerdensity energy applicationsequence.22 The total energy fluxsimultaneously applied from bothsides of the sample may haveexceeded the ED normally appliedin a clinical situation, where onlyone unbound external surface ofthe restoration would be irradiated.Therefore, the present study used asingle light-curing unit to irradiatea smaller diameter, lower C-factorspecimen (d = 2.5 mm, h = 1.25 mm,C = d/2h = 1.0) from only one side.Although the force and force rate in the both of these studies wereequivalent for the STD and STEPmodes, the values reported by thecurrent study (C = 1.0) are numeri-cally lower than those reportedfrom the prior study (C = 2.0).These findings are in agreement withthose of Feilzer and co-workers,15
who found that shrinkage stress isdependent on the ratio of bound tounbound surface area (d/2h) andindependent of the volume of arestoration. One would expect alower maximum force with anumerically lower ratio of bound
to unbound surface area (C-factor)through stress relief by flow fromthe unbound surface area. It couldalso be speculated that the differ-ence in energy flux resulting fromthe simultaneous use of two curinglights in the prior study might haveresulted in higher degrees of con-version and, therefore, higher con-traction forces. However, the degreeof conversion was similar in bothstudies (DC ≅ 60%). Therefore,since the same composite (Pertac II),curing light (Elipar Highlight), andenergy application sequence (40-s2-STEP) was used in both studies,any difference in the maximumshrinkage force between the twostudies should be related to the difference in C-factor. The meanmaximum force in the presentstudy, with C = 1.0, was 5.6 (1.2)MPa versus the 8.8 (0.6) MPa meanmaximum shrinkage force recordedin the prior study, with C = 2.0.
Since degree of conversion, rate ofconversion, shrinkage force rate,and maximum shrinkage force maybe strongly influenced by chemicaland physical properties unique toeach composite, the magnitude ofthe reported results would varywith the specific composite brandevaluated. Polymerization shrink-age force generally depends on thecomposition of the monomers in thematrix, diluents added to improvehandling, filler type, filler loading,filler silanization, the resultant mod-ulus of elasticity, and the coefficient
J O U R N A L O F E S T H E T I C D E N T I S T R Y338
E F F E C T O F R A M P E D L I G H T I N T E N S I T Y O N P O L Y M E R I Z A T I O N F O R C E A N D
C O N V E R S I O N I N A P H O T O A C T I V A T E D C O M P O S I T E
of linear thermal expansion.24–29
Additionally, the photoinitiator andaccelerator concentrations may affectthe rate of conversion (%/s) andfinal DC (%) that can be expectedwith a specific light intensity.30
Therefore, the clinician should notassume that a pre-set energy appli-cation sequence for photopolymer-ization is optimal for all compos-ites. Thus, the power density, exposure duration, and energyapplication sequence of the curinglight must be tailored to the overallcomposition of the composite tomaximize the degree of conversionwhile minimizing the shrinkagestress rate and maximum stress.
CONCLUSION
Maximum polymerization shrink-age force and maximum rate offorce development were significantlylower with ramped light intensity(EXP 40-s Trilight). Intermediateintensity (MED 80-s Trilight) alsoresulted in a significantly lower rateof force development than standard(STD) or stepped intensity (STEP)light-curing. Ramped light intensityslowed the rate of cure at the topsurface and at 1.0 mm beneath thesurface, but did not significantlyaffect the total conversion valuecompared to a standard 40-second,single-intensity cure mode. Theslower conversion rate resultingfrom ramped light intensity helpedto reduce the rate and maximumpolymerization stress, but would
not be expected to compromise thephysical properties of the restora-tive material, owing to a similardegree of conversion.
DISCLOSURE AND
ACKNOWLEDGMENTS
This study was supported by a grantfrom ESPE America. The authorsthank John M. Winterbottom forprogramming and operation of theMTS 318 Biaxial Test System.
REFERENCES
1. Rueggeberg FA, Caughman WF, CurtisJWJ, Davis HC. A predictive model for thepolymerization of photo-activated resincomposites. Int J Prosthodont 1994;7:159–166.
2. Eick JD, Welch FH. Polymerizationshrinkage of posterior composite resinsand its possible influence on postoperativesensitivity. Quintessence Int 1986;17:103–111.
3. Soltesz U, Benkeser G. Fatigue behaviourof filling materials. In: Kawahara H, ed.Oral implantology and biomaterials. TheNetherlands: Elsevier Science Publishers,1989:281–286.
4. Sidhu SK, Henderson LJ. Dentin adhesivesand microleakage in cervical resin compos-ites. Am J Dent 1992; 5:240–243.
5. Bowen RL, Rapson JE, Dickson G. Hard-ening shrinkage and hygroscopic expan-sion of composite resins. J Dent Res 1982;61:654–658.
6. Lutz F, Krejci I, Barbakow F. Quality anddurability of marginal adaptation inbonded composite restorations. DentMater 1991; 10:107–113.
7. Kanca J, Suh BI. Pulse activation: reducingresin-based composite contraction stressesat the enamel cavosurface margins. Am JDent 1999; 12:107–112.
8. Uno S, Asmussen E. Marginal adaptationof a restorative resin polymerized atreduced rate. Scand J Dent Res 1991;99:440–444.
9. Unterbrink G, Muessner R. Influence oflight intensity on two restorative systems. J Dent 1995; 23:183–189.
10. Bouschlicher MR, Vargas MA, Boyer DB.Effect of composite type, light intensity,configuration factor, and laser polymeriza-tion on polymerization contraction forces.Am J Dent 1997; 10:279–283.
11. Feilzer AJ, Dooren LH, de Gee AJ, Davidson CL. Influence of light intensityon polymerization shrinkage and integrityof restoration-cavity interface. Eur J OralSci 1995; 103:322–326.
12. Goracci G, Mori G, de’Martinis LC. Cur-ing light intensity and marginal leakage ofresin composite restorations. QuintessenceInt 1996; 27:355–362.
13. Mehl A, Hickel R, Kunzelmann KH. Physical properties and gap formation oflight-cured composites with and without‘softstart-polymerization.’ J Dent 1997;25:321–330.
14. Burgess JO, De Goes M, Walker R, RippsAH. An evaluation of four light-curingunits comparing soft and hard curing.Pract Periodont Aesthet Dent 1999;11:125–132.
15. Feilzer AJ, de Gee AJ, Davidson CL. Set-ting stress in composite resin in relation toconfiguration of the restoration. J DentRes 1987; 66:1636–1639.
16. Dlugokinski MD, Caughman WF, Ruegge-berg FA. Assessing the effect of extraneouslight on photoactivated resin composites. J Am Dent Assoc 1998; 129:1103–1109.
17. Rueggeberg FA, Caughman WF, ChanDCN. Novel approach to measure com-posite conversion kinetics during exposurewith stepped or continuous light-curing. J Esthet Dent 1999; 11:197–205.
18. Rueggeberg FA, Hashinger DT, FairhurstCW. Calibration of FTIR conversionanalysis of contemporary dental resincomposites. Dent Mater 1990; 6:241–249.
19. Billmeyer F Jr. Textbook of polymer sci-ence. 3rd Ed. New York: John Wiley andSons, 1984:49–58.
20. Decker C, Decker D, Morel F. Light inten-sity and temperature effect in photoiniti-ated polymerization. In: Scranton AB,Bowman CN, Peiffer RW, eds. Photopoly-
B O U S C H L I C H E R A N D R U E G G E B E R G
V O L U M E 1 2 , N U M B E R 6 , 2 0 0 0 339
merization: fundamentals and applica-tions. Vol. 673. Washington, DC: Ameri-can Chemical Society, 1997:63–80.
21. Mehl A, Manhart J, Kremers L, Kunzel-mann KH, Hickel R. Physical propertiesand marginal quality of Class II compositefillings after softstart polymerization. J Dent Res 1996; 76:279. (Abstr)
22. Bouschlicher MR, Rueggeberg FA, BoyerDB. Effect of stepped light intensity onpolymerization force and conversion in aphotoactivated composite. J Esthet Dent2000; 12:23–32.
23. Friedl KH, Schmalz G, Hiller K, Märkl A.Marginal adaption of Class V restorationswith and without “softstart-polymeriza-tion.” Oper Dent 1999; 25:26–32.
24. Asmussen E. Composite restorative resins:composition versus wall-to-wall polymer-ization contraction. Acta Odontol Scand1975; 33:337–343.
25. Condon JR, Ferracane JL. Assessing theeffect of composite formulation on poly-merization stress. J Am Dent Assoc 2000;131:497–503.
26. Condon JR, Ferracane JL. Reduction ofcomposite contraction stress through non-bonded microfiller particles. Dent Mater1998; 14:256–260.
27. Aarnts MP, Akinmade A, Feilzer AJ. Effectof filler load on contraction stress and volumetric shrinkage. J Dent Res 1999;78:482. (Abstr)
28. Sakaguchi RL, Ferracane JL. Stress trans-fer from polymerization shrinkage of achemical-cured composite bonded to apre-cast composite substrate. Dent Mater1998; 14:106–111.
29. Versluis A, Douglas WH, Sakaguchi RL.Thermal expansion coefficient of dentalcomposites measured with strain gauges.Dent Mater 1996; 12:290–294.
30. Aarnts MP, Akinmade A, Feilzer AJ.Effects of photoinitiator concentration onconversion, strength, and stress develop-ment. J Dent Res 1999; 78:234. (Abstr)
Reprint requests: Murray R. Bouschlicher,DDS, MS, Department of Operative Den-tistry, College of Dentistry, The Universityof Iowa, Iowa City, IA 52242; e-mail: [email protected]©2000 BC Decker Inc
J O U R N A L O F E S T H E T I C D E N T I S T R Y340
*Professor and Section Director, †Research Assistant, Dental Materials Section, Department of Oral Rehabilitation, School of Dentistry, Medical College of Georgia, Augusta, Georgia
Polymerization Depth of Contemporary Light-Curing Units Using Microhardness
FREDERICK A. RUEGGEBERG, DDS, MS*
JANET W. ERGLE †
DONALD J . METTENBURG †
ABSTRACT
Purpose: This research investigated composite depths of cure using a variety of light-curing unitsand exposure protocols.
Materials and Methods: Composite (Herculite XRV, shade A2, Kerr, Orange, California) wasexposed in opaque compules to conventional quartz tungsten halogen (QTH) units, soft-startunits, high-intensity QTH and plasma arc curing (PAC) lights, and one argon laser. Cured com-pules were sonicated to remove uncured composite and were sectioned and polished along thelong axis to expose cured composite. Knoop hardness was measured 0.5 mm from the irradiated,top surface and then at 1.0 mm and in 1.0-mm increments until reliable readings could no longerbe obtained. Hardness values were compared by analysis of variance at similar depths within aspecific curing-light classification, using the hardness of the standard 40-second conventionalQTH exposure as comparison (Dunnett’s t-test). Depth of cure was defined as the deepest hard-ness value found equivalent to that at 0.5-mm depth for a specific curing light and scenario.
Results: Conventional QTH lights provided similar hardness profiles. At 2-mm depth, use of adifferent unit or curing tip made no difference in hardness compared with the standard. At thisdepth, soft-start (pulse-delay and step-cure) methods yielded similar hardness as the standard.High-intensity QTH lights provided similar hardness at 2-mm depth in 10 seconds as the standard40-second exposure. Plasma-arc exposure for less than 10 seconds produced inferior hardnesscompared with the standard. A 10-second PAC and a 5-second laser exposure gave equivalenthardness at 2-mm depth as the 40-second standard. Depth of cure for almost all curing scenarioswas not greater than 2 mm.
CLINICAL SIGNIFICANCE
Similar-type conventional QTH lights with different tip diameter (8 and 12 mm) provide similarcomposite cure characteristics. Soft-start techniques provide similar cure profiles as conventionalQTH technique when used according to manufacturer’s recommendations. High-intensity QTHunits and the argon laser can reduce exposure time while providing composite with similar hard-ness as conventional QTH curing. Plasma-arc exposure should be at least of 10 seconds durationto provide hardness equivalent to that achieved with conventional 40-second QTH exposure.Even with consideration of high-intensity curing units, composite increments should still be nogreater than 2 mm to provide homogeneous hardness.
(J Esthet Dent 12:340–349, 2000)
R U E G G E B E R G E T A L
V O L U M E 1 2 , N U M B E R 6 , 2 0 0 0 341
For years, conventional methodsof exposing photoinitiated resin
composite materials have been withrelatively low-powered (35–75 W)quartz tungsten halogen (QTH)units.1 These units provide a widespectral output, after filtering,between 400 and 500 nm2–5; how-ever, the output intensity is typicallylower than 1000 mW/cm2. Conven-tional QTH curing sources operatein a continuous output mode; whenactivated, the source is driven toprovide full output intensity for theselected exposure duration.6 Whenusing these light sources, recom-mended exposure duration for 2-mmincremental composite placement isbetween 40 and 60 seconds.7–9
Currently, a wide variety of curinglights and methods is available.6
These newer units offer remarkablyhigher output intensity levels thanconventional QTH units previouslydescribed. Also, many featuresrelated to output control duringexposure have been provided.High-intensity QTH lights are aseparate classification of curingunits. Typically, the intensity ofthese sources is in excess of 1000mW/cm2.6 This level could bereached merely by replacing theconventional light-curing tip withone that concentrates light into asmaller distal tip end diameter.These tips, referred to as turbo tips,operate by gathering light from alarge proximal tip diameter nearthe focal plane of the QTH source
and concentrating that light into asmaller distal tip diameter.10 Thisconcentration results from use of atapered fiber optic glass bundle.The source voltage driving a con-ventional QTH bulb can also beincreased to provide increased radi-ant output.11 This mechanism,along with a turbo tip, is used in apopular unit to provide enhancedoutput level: Optilux 501 in burstmode (Demetron Research, Dan-bury, Connecticut). An additionalmethod of providing enhanced out-put levels from a QTH light is useof a high wattage-source generatinglight remote from the operatingfield. The intense irradiation fromthis unit is directed to the restora-tion via means of a liquid-filledlight guide (Kreativ Kuring Unit,Kreativ Inc., San Diego, California).
The rate of composite cure, and thedevelopment of stress from poly-merization shrinkage at the tooth–resin interface as well as within thetooth structure itself, are clinicalconcern.12–17 To minimize shrink-age, manufacturers have introducedQTH-based lights specificallydesigned to provide low levels ofintensity during the initial expo-sure.18,19 Lowering light intensity, isthought to reduce the rate at whichfree radicals are formed and therate at which polymerizationoccurs. Providing a low initial rateof cure is intended to allow com-posite to flow from the unbondedsurfaces to relieve stresses prior to
attaining a gel point.15,20 These sys-tems use a number of methods toprovide control over light out-put.6,21 Step-cure units generate aninitial low-level output for a prede-termined time into the curing expo-sure. Immediately following thisphase, the unit generates full outputfor the remainder of the exposure.The initial light intensity level canalso be slowly increased during theexposure and then maintained at ahigh, fixed level. Such a modifica-tion of light output is termed ramp-ing. A modification of the step-curemethod is the pulse-delay proce-dure.20 In this method, a short-duration, low-intensity exposure isprovided only to the last incremen-tal layer. A designated time isallowed to pass, during which thecomposite surface is contoured andpolished. At completion of thistime, a second, more intense andlonger exposure is provided tofinalize conversion.
A completely different method ofproviding extremely high levels ofirradiance uses the newly intro-duced plasma arc curing (PAC)units.6 Output levels from thesesources are remarkably higher thanthose of conventional or high-inten-sity QTH units. The PAC lights alsouse liquid light guides to reduce lev-els of infrared and ultraviolet radia-tion. Manufacturers claim thesesources can effectively reduce clini-cal exposure duration to only 1 to10 seconds, whereas a 40-second
J O U R N A L O F E S T H E T I C D E N T I S T R Y342
P O L Y M E R I Z A T I O N D E P T H O F C O N T E M P O R A R Y L I G H T - C U R I N G U N I T S U S I N G M I C R O H A R D N E S S
exposure from a conventional QTHlight would be required.
The argon ion laser was once popu-lar for curing photoactivated com-posites.22 However, fewer manu-facturers are supporting thistechnology for dental curing pur-poses. Many claims have beenmade related to this curing mode,indicating significant reduction inclinical exposure time compared tothe conventional QTH methodswhile yielding similar conversionand physical properties.22,23
Thus, claims of reduced exposurerequirements while providing simi-lar conversion values and depths ofcure as conventional QTH units aremade. Clinical success of a photo-cured dental restoration may dependupon obtaining high levels of con-version.24 With the clinician’s repu-tation and livelihood being basedon the success of restorationsplaced, manufacturers’ claims ofreduced exposure time and mainte-nance of high conversion levels ofthese new light-curing units andmethods need to be verified.
The purpose of this research is toexamine the depths of cure, usingmicrohardness values, when a vari-ety of commercial curing units andmethods are used to polymerize asingle lot of commercial, photoacti-vated dental composite. Thehypothesis tested is that the hard-ness value obtained using a conven-tional QTH exposure method
position so that the tip center wascoincident with the compule longaxis. Composite was exposed withthe curing tip end held 1 mm fromthe Mylar surface. Fifteen minutesfollowing exposure, the compulewas placed in solvent (methyl ethylketone, M209-4, Fisher Scientific,Fair Lawn, New Jersey) and soni-cated for 1 hour. Immersion andsonication removed uncured com-posite by dissolution. The specimenwas then placed in another holdingdevice that held the compule alongits horizontal axis. The compulewas ground in this device, to removethe plastic casing and to exposecured composite along a top–bottomplane. The specimen was groundalmost in half, preserving mechani-cal retention in the holder and com-pule. Attention was given to slowspeed and to wet grinding to ensurea minimal impact of specimenpreparation on hardness readings.The sequence of abrasives used onthe rotary grinding apparatus(Ecomet III, Buehler Corp., LakeBluff, Illinois) was as follows: 240,320, 400, and 600 grit, wet-ground(silicon carbide, Leco Corp., St. Joseph, Michigan); diamondpaste (Nos. 15, 6, and 1 syntheticdiamond paste, Lay Industrial Diamond Corp., Deerfield Beach,Florida) on a polishing cloth (No. 40-7628, Buehler Corp.).
Following polishing, specimenswere prepared for microhardnesstesting. Each compule was posi-tioned in another holding jig that
(standard) is equivalent to thoseachieved when the other curingunits and methods are applied asdirected by the manufacturer.
MATERIALS AND METHODS
The composite used throughout thisstudy was a hybrid, photoactivatedmaterial (Herculite XRV, shade A2,lot 712557, Kerr Dental Products,Orange, California). To minimizelight penetration from reflectionand scattering, composite wascured in black, opaque, plasticcompules. This method produced a stringent environment in which to examine specifically the effect of irradiated light without the con-founding factors of side reflectionor translucency of surroundingmatrix structure. Preparation forspecimen curing included removalof the curved compule end with asharp knife blade and removal ofthe plunger from the other end. Asmall piece of Mylar was placed ona tabletop, and the open compuleend, where the plunger had been,was placed on top of the plasticsquare. The composite was thencondensed against the Mylar sur-face, transferring the uncured massfrom one compule end to the other.The packed compule was positionedin a holding jig that aligned thespecimen vertically, with the top,Mylar-covered end facing upward(Figure 1). This jig was attached tothe platform of a laboratory jack-stand, allowing for vertical move-ment of the specimen. The distalend of a light-curing tip was held in
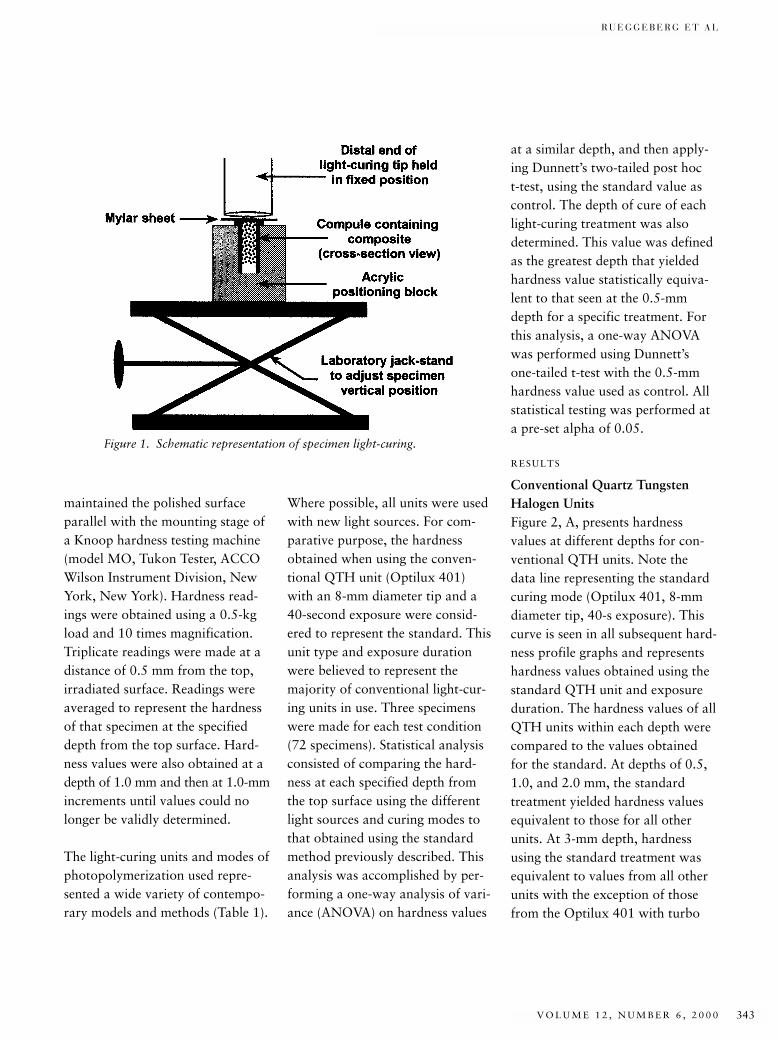
R U E G G E B E R G E T A L
V O L U M E 1 2 , N U M B E R 6 , 2 0 0 0 343
maintained the polished surfaceparallel with the mounting stage ofa Knoop hardness testing machine(model MO, Tukon Tester, ACCOWilson Instrument Division, NewYork, New York). Hardness read-ings were obtained using a 0.5-kgload and 10 times magnification.Triplicate readings were made at adistance of 0.5 mm from the top,irradiated surface. Readings wereaveraged to represent the hardnessof that specimen at the specifieddepth from the top surface. Hard-ness values were also obtained at adepth of 1.0 mm and then at 1.0-mmincrements until values could nolonger be validly determined.
The light-curing units and modes ofphotopolymerization used repre-sented a wide variety of contempo-rary models and methods (Table 1).
Where possible, all units were usedwith new light sources. For com-parative purpose, the hardnessobtained when using the conven-tional QTH unit (Optilux 401)with an 8-mm diameter tip and a40-second exposure were consid-ered to represent the standard. Thisunit type and exposure durationwere believed to represent themajority of conventional light-cur-ing units in use. Three specimenswere made for each test condition(72 specimens). Statistical analysisconsisted of comparing the hard-ness at each specified depth fromthe top surface using the differentlight sources and curing modes tothat obtained using the standardmethod previously described. Thisanalysis was accomplished by per-forming a one-way analysis of vari-ance (ANOVA) on hardness values
at a similar depth, and then apply-ing Dunnett’s two-tailed post hoc t-test, using the standard value ascontrol. The depth of cure of eachlight-curing treatment was alsodetermined. This value was definedas the greatest depth that yieldedhardness value statistically equiva-lent to that seen at the 0.5-mmdepth for a specific treatment. Forthis analysis, a one-way ANOVAwas performed using Dunnett’s one-tailed t-test with the 0.5-mmhardness value used as control. Allstatistical testing was performed ata pre-set alpha of 0.05.
RESULTS
Conventional Quartz TungstenHalogen UnitsFigure 2, A, presents hardness values at different depths for con-ventional QTH units. Note the data line representing the standardcuring mode (Optilux 401, 8-mmdiameter tip, 40-s exposure). Thiscurve is seen in all subsequent hard-ness profile graphs and representshardness values obtained using thestandard QTH unit and exposureduration. The hardness values of allQTH units within each depth werecompared to the values obtainedfor the standard. At depths of 0.5,1.0, and 2.0 mm, the standardtreatment yielded hardness valuesequivalent to those for all otherunits. At 3-mm depth, hardnessusing the standard treatment wasequivalent to values from all otherunits with the exception of thosefrom the Optilux 401 with turbo
Figure 1. Schematic representation of specimen light-curing.
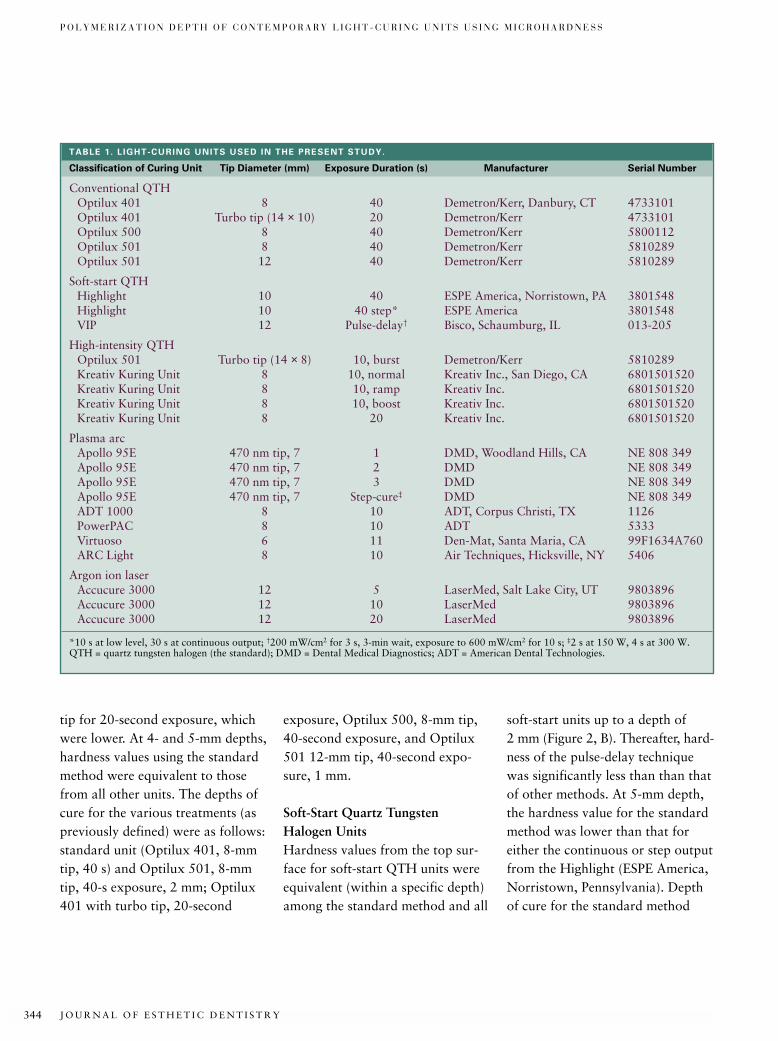
J O U R N A L O F E S T H E T I C D E N T I S T R Y344
P O L Y M E R I Z A T I O N D E P T H O F C O N T E M P O R A R Y L I G H T - C U R I N G U N I T S U S I N G M I C R O H A R D N E S S
tip for 20-second exposure, whichwere lower. At 4- and 5-mm depths,hardness values using the standardmethod were equivalent to thosefrom all other units. The depths ofcure for the various treatments (aspreviously defined) were as follows:standard unit (Optilux 401, 8-mmtip, 40 s) and Optilux 501, 8-mmtip, 40-s exposure, 2 mm; Optilux401 with turbo tip, 20-second
exposure, Optilux 500, 8-mm tip,40-second exposure, and Optilux501 12-mm tip, 40-second expo-sure, 1 mm.
Soft-Start Quartz Tungsten Halogen UnitsHardness values from the top sur-face for soft-start QTH units wereequivalent (within a specific depth)among the standard method and all
soft-start units up to a depth of 2 mm (Figure 2, B). Thereafter, hard-ness of the pulse-delay techniquewas significantly less than than thatof other methods. At 5-mm depth,the hardness value for the standardmethod was lower than that foreither the continuous or step outputfrom the Highlight (ESPE America,Norristown, Pennsylvania). Depthof cure for the standard method
TABLE 1. L IGHT-CURING UNITS USED IN THE PRESENT STUDY.
Classification of Curing Unit Tip Diameter (mm) Exposure Duration (s) Manufacturer Serial Number
Conventional QTHOptilux 401 8 40 Demetron/Kerr, Danbury, CT 4733101Optilux 401 Turbo tip (14 × 10) 20 Demetron/Kerr 4733101Optilux 500 8 40 Demetron/Kerr 5800112Optilux 501 8 40 Demetron/Kerr 5810289Optilux 501 12 40 Demetron/Kerr 5810289
Soft-start QTHHighlight 10 40 ESPE America, Norristown, PA 3801548Highlight 10 40 step* ESPE America 3801548VIP 12 Pulse-delay† Bisco, Schaumburg, IL 013-205
High-intensity QTHOptilux 501 Turbo tip (14 × 8) 10, burst Demetron/Kerr 5810289Kreativ Kuring Unit 8 10, normal Kreativ Inc., San Diego, CA 6801501520Kreativ Kuring Unit 8 10, ramp Kreativ Inc. 6801501520Kreativ Kuring Unit 8 10, boost Kreativ Inc. 6801501520Kreativ Kuring Unit 8 20 Kreativ Inc. 6801501520
Plasma arcApollo 95E 470 nm tip, 7 1 DMD, Woodland Hills, CA NE 808 349Apollo 95E 470 nm tip, 7 2 DMD NE 808 349Apollo 95E 470 nm tip, 7 3 DMD NE 808 349Apollo 95E 470 nm tip, 7 Step-cure‡ DMD NE 808 349ADT 1000 8 10 ADT, Corpus Christi, TX 1126PowerPAC 8 10 ADT 5333Virtuoso 6 11 Den-Mat, Santa Maria, CA 99F1634A760ARC Light 8 10 Air Techniques, Hicksville, NY 5406
Argon ion laserAccucure 3000 12 5 LaserMed, Salt Lake City, UT 9803896Accucure 3000 12 10 LaserMed 9803896Accucure 3000 12 20 LaserMed 9803896
*10 s at low level, 30 s at continuous output; †200 mW/cm2 for 3 s, 3-min wait, exposure to 600 mW/cm2 for 10 s; ‡2 s at 150 W, 4 s at 300 W.QTH = quartz tungsten halogen (the standard); DMD = Dental Medical Diagnostics; ADT = American Dental Technologies.
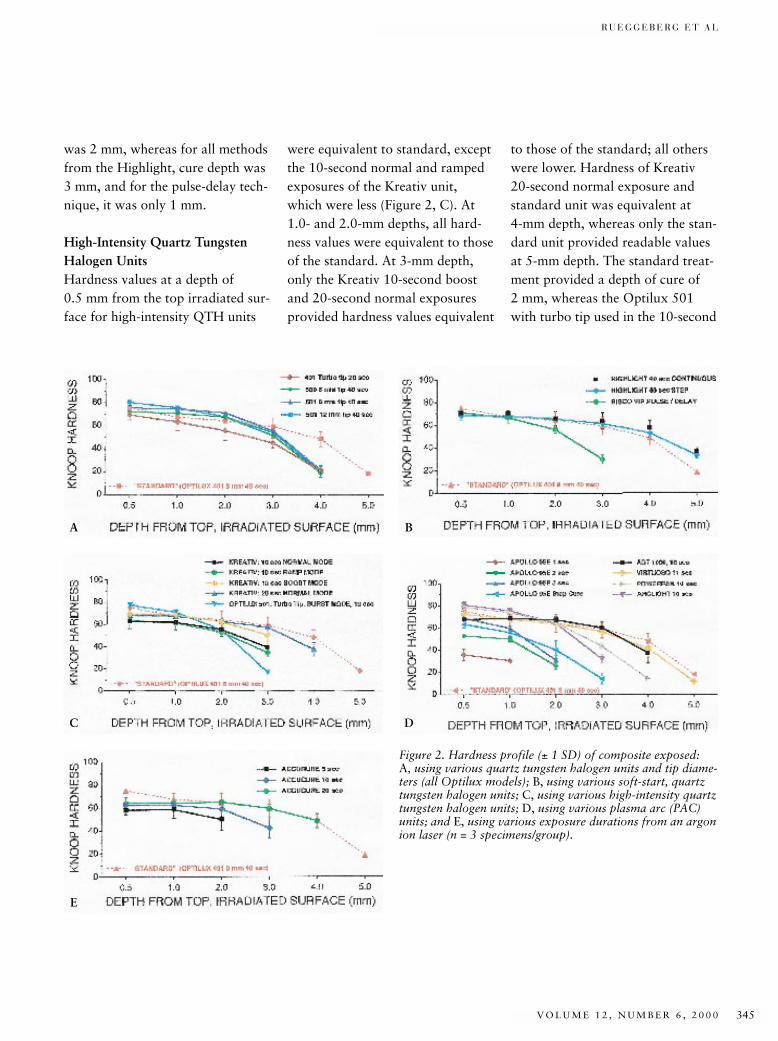
R U E G G E B E R G E T A L
V O L U M E 1 2 , N U M B E R 6 , 2 0 0 0 345
was 2 mm, whereas for all methodsfrom the Highlight, cure depth was3 mm, and for the pulse-delay tech-nique, it was only 1 mm.
High-Intensity Quartz TungstenHalogen UnitsHardness values at a depth of0.5 mm from the top irradiated sur-face for high-intensity QTH units
were equivalent to standard, exceptthe 10-second normal and rampedexposures of the Kreativ unit,which were less (Figure 2, C). At1.0- and 2.0-mm depths, all hard-ness values were equivalent to thoseof the standard. At 3-mm depth,only the Kreativ 10-second boostand 20-second normal exposuresprovided hardness values equivalent
to those of the standard; all otherswere lower. Hardness of Kreativ20-second normal exposure andstandard unit was equivalent at 4-mm depth, whereas only the stan-dard unit provided readable valuesat 5-mm depth. The standard treat-ment provided a depth of cure of 2 mm, whereas the Optilux 501with turbo tip used in the 10-second
A B
C
E
D
Figure 2. Hardness profile (± 1 SD) of composite exposed: A, using various quartz tungsten halogen units and tip diame-ters (all Optilux models); B, using various soft-start, quartztungsten halogen units; C, using various high-intensity quartztungsten halogen units; D, using various plasma arc (PAC)units; and E, using various exposure durations from an argonion laser (n = 3 specimens/group).
J O U R N A L O F E S T H E T I C D E N T I S T R Y346
P O L Y M E R I Z A T I O N D E P T H O F C O N T E M P O R A R Y L I G H T - C U R I N G U N I T S U S I N G M I C R O H A R D N E S S
burst mode had a depth of cure ofless than 1 mm. The Kreativ unit,used in all four scenarios, providedsimilar 2.0-mm depths of cure.
Plasma Arc Curing UnitsHardness values at 0.5-mm depthfor PAC units and exposure meth-ods were equivalent to standard,with the exception of all specimensexposed using the Apollo 95E(Dental Medical Diagnostics,Woodland Hills, California), whichyielded lower values (Figure 2, D).This trend was also seen at 1.0 mmdeep, except that at this level, thehardness from a 3-second Apollo95E exposure was equivalent tothat of standard. At 2-mm depth,no hardness values for the 1-secondApollo 95E could be recorded.Only the PAC units providing atleast 10-second exposure (Virtuoso,ARC Light, ADT 1000 [AmericanDental Technologies, Corpus Christi,Texas], and the PowerPAC units[American Dental Technologies])demonstrated hardness values simi-lar to those of the standard. Theonly exposure scenario using theApollo 95E that provided record-able hardness values at 3-mm depthwas the step-cure mode. This tech-nique, as well as use of the ARCLight (Air Techniques, Hicksville,New York), yielded hardness valueslower than all other units as well asthe standard method at 3-mmdepth. At 4-mm depth, the ADT1000 and Virtuoso units had hard-ness values equivalent to those of
the standard method, but thosefrom the PowerPAC were lower.The only hardness readings obtain-able at 5-mm depth were from thestandard technique and from theVirtuoso unit, which were equiva-lent. The standard mode provided adepth of cure of 2 mm. Of the PAClights providing exposure durationof at least 10 seconds, the ADT 100unit yielded a depth of cure of 3 mm,the Virtuoso 2 mm, and the Power-PAC and ARC Lights gave 1-mmcure depths. A 1- or 2-second expo-sure and the step-cure mode fromthe Apollo 95E unit gave a depth ofcure of 1 mm, whereas the 3-secondexposure cure depth was less than 1 mm.
Argon Ion LaserAll hardness values at a depth of 5 mm for an argon ion laser athighest output (250 mW) using various exposure durations wereequivalent, but lower than valuesachieved by the standard method(Figure 2, E). However, at depths of 1.0 and 2.0 mm, all hardnessvalues from the laser were equal tothose of the standard method. At3.0-mm depth, hardness from the5-second laser exposure could nolonger be recorded. At this depth,the 10-second laser exposure gavelower hardness values than eitherthe 20-second laser or the standardmode. The only hardness valuesattainable at 4-mm depth werefrom the standard technique andthe 20-second laser, which were
equivalent. The standard techniqueprovided a 2-mm depth of cure, asdid the 5- and 10-second laserexposures. The depth of cure using a20-second laser exposure was 3 mm.
DISCUSSION
For the conventional QTH units, alllights and methods provided equiv-alent hardness values within a givendepth up to 2 mm, validating theresearch hypothesis. The reasonthat the Optilux 401 with 8-mm tipshould provide hardness valuessuperior to those achieved by eitherthe 500 or the 501 with similarsized tip and equivalent exposureduration is not known. Perhaps, inthe specific Optilux 401 unit tested,the focal plane of the QTH sourcewas aligned better with respect tothe proximal curing tip aperturethan in the other units. All unitshad similar type sources (80WOptibulb), so hardness differencesmay be related to the specific opticsof the source and curing tip combi-nations. Statistically, not all theunits provided depths of cure up to2 mm with respect to hardness val-ues at 0.5-mm depth. The standardunit and method and the Optilux500 and 501 units with 8-mm tip for40-second exposure yielded 2-mmcure depths, whereas use of the turbotip in the Optilux 401 providedonly a 1-mm depth. The poor per-formance of the turbo tip could berelated to a focusing effect. The distalend of all curing tips was held at adistance of 1.0 mm from the Mylar
R U E G G E B E R G E T A L
V O L U M E 1 2 , N U M B E R 6 , 2 0 0 0 347
film during exposure. If the turbotip had a focal point, the tip couldhave been used outside of its mosteffective target-source distance.
All soft-start methods providedhardness up to a depth of 2 mm,equivalent to that achieved with thestandard technique, validating theresearch hypothesis. However, pastthis depth, the pulse-delay techniquedemonstrated inferior curing. How-ever, it should be noted that thistechnique is recommended only forthe last 1.5- to 2-mm thick incre-ment. Use of a step-cure method ofexposure duration equivalent to acontinuous one (Highlight step andnormal) produced hardness valuesequivalent to not only each otherbut also to that of the standardmethod. These results indicate thatthe step-cure method would providea cure value equivalent to that of acontinuous exposure, eliminatingthe possibility of under-cure owingto the use of a lower initial intensity.
For the high-intensity QTH units,not all exposure scenarios from theKreativ or from the Optilux 501 inburst mode with turbo tip providedvalues equivalent to those achievedwith the standard unit, invalidatingthe research hypothesis. It is inter-esting to note that no high-intensityQTH unit provided an enhanceddepth of cure greater than that seenwhen using the standard mode,which was 2 mm.
The research hypothesis for PAClights was not proven true for allexposure scenarios. Those PACunits providing exposure durationof at least 10 seconds generatedhardness values similar to those ofthe standard technique. At 2-mmdepth, all PAC lights providing atleast this duration had hardnessequivalent to that of the standardmethod. This result demonstratesthat a 10-second PAC light expo-sure provides equivalent compositehardness when a 2-mm increment isused. At this depth, none of theexposure scenarios from the Apollo95E provided hardness similar tothe former. Thus, short exposureduration (3 seconds or less, or astep-cure exposure of less than 6seconds) from a PAC light is seennot to provide a polymer matrix ofproperties similar to that of a con-ventional QTH unit. Only one PACunit (ADT 1000) indicated a depthof cure value exceeding the 2-mmlevel of the standard method. Thus,as a rule, PAC lights do not tend toprovide enhanced depths of curewhen used for 10-second exposures.When used for less than this dura-tion, the depths of cure are low.
The research hypothesis for hard-ness values obtained with the laserwas validated. As exposure durationfrom this unit increased, the depthto which hardness values could be obtained also increased. The 20-second argon exposure mirroredthe hardness profile of the 40-second
standard technique. Thus, it isbelieved that the argon laser can beused to reduce chairside curingtime, but perhaps by only one-halfof the recommended exposure timerecommended when using conven-tional QTH units. Depths of cureusing the laser were equivalent tothat of the standard method, withthe 20-second exposure providing a cure depth of 3 mm.
There was great variation in hard-ness profiles among the variousunits and methods compared to thestandard QTH mode. In general,use of the different conventionalQTH units yielded similar hardnessprofiles. Use of the turbo tip withthis type of unit did reduce expo-sure duration by half while provid-ing equivalent hardness values at 2-mm depth. However, it did notenhance hardness values above thevalue achieved with the standardmethod. The purpose of using high-output light sources is to reducechairside exposure time while pro-ducing properties equivalent tothose that would have been realizedif the longer exposure, conventionalQTH mode had been used. In manycases, such a reduction of time,while providing equivalent hard-ness, was realized. All methods ofproviding high-intensity QTH lightprovided similar hardness values at2-mm depth compared to the stan-dard 40-second treatment. Thus,use of the Optilux 501 in Burst modewith a turbo tip for 10-second dura-
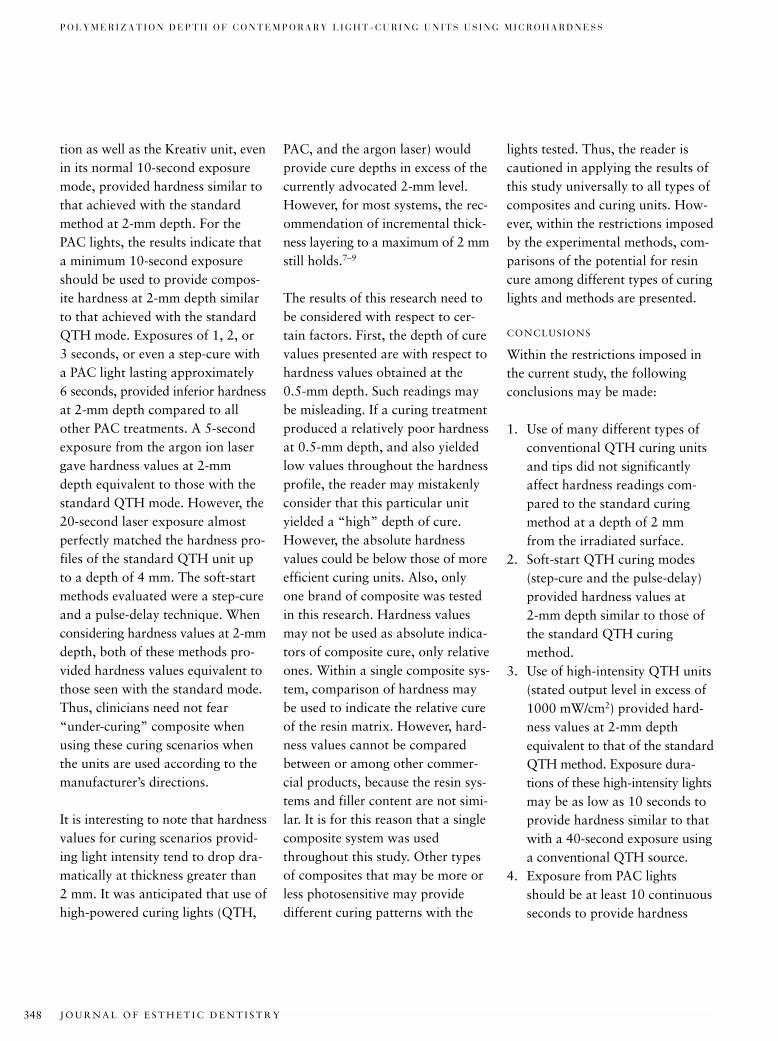
J O U R N A L O F E S T H E T I C D E N T I S T R Y348
P O L Y M E R I Z A T I O N D E P T H O F C O N T E M P O R A R Y L I G H T - C U R I N G U N I T S U S I N G M I C R O H A R D N E S S
tion as well as the Kreativ unit, evenin its normal 10-second exposuremode, provided hardness similar tothat achieved with the standardmethod at 2-mm depth. For thePAC lights, the results indicate thata minimum 10-second exposureshould be used to provide compos-ite hardness at 2-mm depth similarto that achieved with the standardQTH mode. Exposures of 1, 2, or 3 seconds, or even a step-cure witha PAC light lasting approximately 6 seconds, provided inferior hardnessat 2-mm depth compared to allother PAC treatments. A 5-secondexposure from the argon ion lasergave hardness values at 2-mmdepth equivalent to those with thestandard QTH mode. However, the 20-second laser exposure almostperfectly matched the hardness pro-files of the standard QTH unit upto a depth of 4 mm. The soft-startmethods evaluated were a step-cureand a pulse-delay technique. Whenconsidering hardness values at 2-mmdepth, both of these methods pro-vided hardness values equivalent tothose seen with the standard mode.Thus, clinicians need not fear“under-curing” composite whenusing these curing scenarios whenthe units are used according to themanufacturer’s directions.
It is interesting to note that hardnessvalues for curing scenarios provid-ing light intensity tend to drop dra-matically at thickness greater than2 mm. It was anticipated that use ofhigh-powered curing lights (QTH,
PAC, and the argon laser) wouldprovide cure depths in excess of thecurrently advocated 2-mm level.However, for most systems, the rec-ommendation of incremental thick-ness layering to a maximum of 2 mmstill holds.7–9
The results of this research need tobe considered with respect to cer-tain factors. First, the depth of curevalues presented are with respect tohardness values obtained at the 0.5-mm depth. Such readings maybe misleading. If a curing treatmentproduced a relatively poor hardnessat 0.5-mm depth, and also yieldedlow values throughout the hardnessprofile, the reader may mistakenlyconsider that this particular unityielded a “high” depth of cure.However, the absolute hardness values could be below those of moreefficient curing units. Also, onlyone brand of composite was testedin this research. Hardness valuesmay not be used as absolute indica-tors of composite cure, only relativeones. Within a single composite sys-tem, comparison of hardness maybe used to indicate the relative cureof the resin matrix. However, hard-ness values cannot be comparedbetween or among other commer-cial products, because the resin sys-tems and filler content are not simi-lar. It is for this reason that a singlecomposite system was usedthroughout this study. Other typesof composites that may be more orless photosensitive may provide different curing patterns with the
lights tested. Thus, the reader iscautioned in applying the results ofthis study universally to all types ofcomposites and curing units. How-ever, within the restrictions imposedby the experimental methods, com-parisons of the potential for resincure among different types of curinglights and methods are presented.
CONCLUSIONS
Within the restrictions imposed inthe current study, the followingconclusions may be made:
1. Use of many different types ofconventional QTH curing unitsand tips did not significantlyaffect hardness readings com-pared to the standard curingmethod at a depth of 2 mmfrom the irradiated surface.
2. Soft-start QTH curing modes(step-cure and the pulse-delay)provided hardness values at 2-mm depth similar to those ofthe standard QTH curingmethod.
3. Use of high-intensity QTH units(stated output level in excess of1000 mW/cm2) provided hard-ness values at 2-mm depthequivalent to that of the standardQTH method. Exposure dura-tions of these high-intensity lightsmay be as low as 10 seconds toprovide hardness similar to thatwith a 40-second exposure usinga conventional QTH source.
4. Exposure from PAC lightsshould be at least 10 continuousseconds to provide hardness
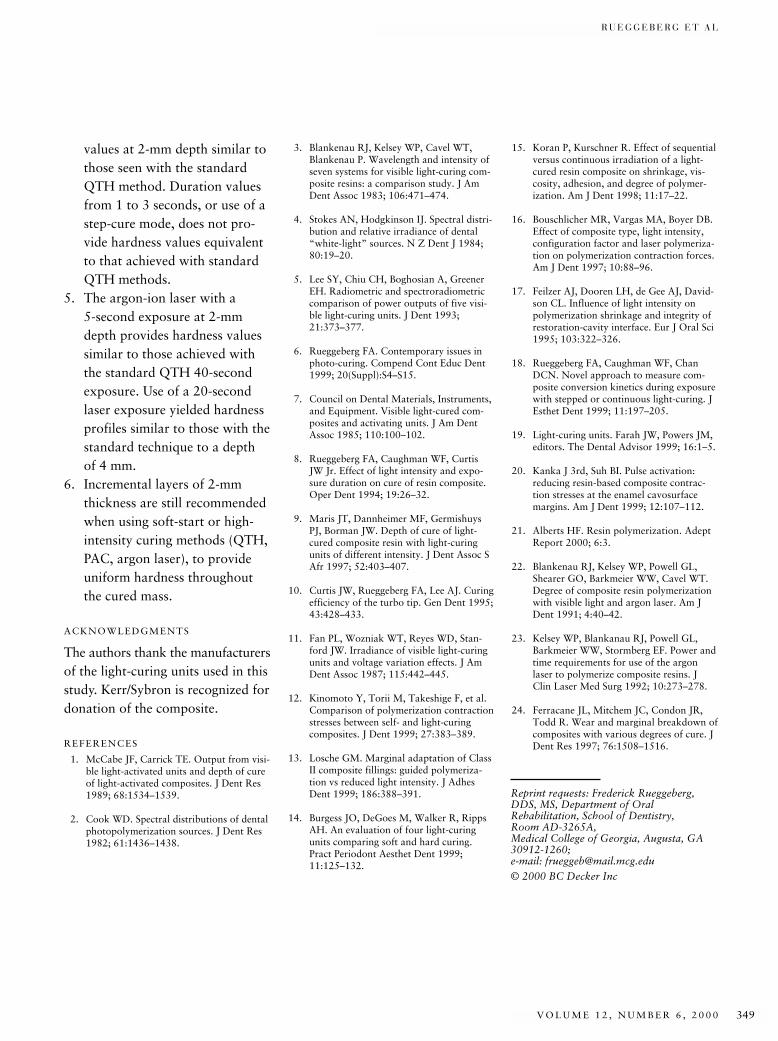
R U E G G E B E R G E T A L
V O L U M E 1 2 , N U M B E R 6 , 2 0 0 0 349
values at 2-mm depth similar tothose seen with the standardQTH method. Duration valuesfrom 1 to 3 seconds, or use of astep-cure mode, does not pro-vide hardness values equivalentto that achieved with standardQTH methods.
5. The argon-ion laser with a 5-second exposure at 2-mmdepth provides hardness valuessimilar to those achieved withthe standard QTH 40-secondexposure. Use of a 20-secondlaser exposure yielded hardnessprofiles similar to those with thestandard technique to a depth of 4 mm.
6. Incremental layers of 2-mmthickness are still recommendedwhen using soft-start or high-intensity curing methods (QTH,PAC, argon laser), to provideuniform hardness throughoutthe cured mass.
ACKNOWLEDGMENTS
The authors thank the manufacturersof the light-curing units used in thisstudy. Kerr/Sybron is recognized fordonation of the composite.
REFERENCES
1. McCabe JF, Carrick TE. Output from visi-ble light-activated units and depth of cureof light-activated composites. J Dent Res1989; 68:1534–1539.
2. Cook WD. Spectral distributions of dentalphotopolymerization sources. J Dent Res1982; 61:1436–1438.
3. Blankenau RJ, Kelsey WP, Cavel WT,Blankenau P. Wavelength and intensity ofseven systems for visible light-curing com-posite resins: a comparison study. J AmDent Assoc 1983; 106:471–474.
4. Stokes AN, Hodgkinson IJ. Spectral distri-bution and relative irradiance of dental“white-light” sources. N Z Dent J 1984;80:19–20.
5. Lee SY, Chiu CH, Boghosian A, GreenerEH. Radiometric and spectroradiometriccomparison of power outputs of five visi-ble light-curing units. J Dent 1993;21:373–377.
6. Rueggeberg FA. Contemporary issues inphoto-curing. Compend Cont Educ Dent1999; 20(Suppl):S4–S15.
7. Council on Dental Materials, Instruments,and Equipment. Visible light-cured com-posites and activating units. J Am DentAssoc 1985; 110:100–102.
8. Rueggeberg FA, Caughman WF, CurtisJW Jr. Effect of light intensity and expo-sure duration on cure of resin composite.Oper Dent 1994; 19:26–32.
9. Maris JT, Dannheimer MF, GermishuysPJ, Borman JW. Depth of cure of light-cured composite resin with light-curingunits of different intensity. J Dent Assoc SAfr 1997; 52:403–407.
10. Curtis JW, Rueggeberg FA, Lee AJ. Curingefficiency of the turbo tip. Gen Dent 1995;43:428–433.
11. Fan PL, Wozniak WT, Reyes WD, Stan-ford JW. Irradiance of visible light-curingunits and voltage variation effects. J AmDent Assoc 1987; 115:442–445.
12. Kinomoto Y, Torii M, Takeshige F, et al.Comparison of polymerization contractionstresses between self- and light-curingcomposites. J Dent 1999; 27:383–389.
13. Losche GM. Marginal adaptation of ClassII composite fillings: guided polymeriza-tion vs reduced light intensity. J AdhesDent 1999; 186:388–391.
14. Burgess JO, DeGoes M, Walker R, RippsAH. An evaluation of four light-curingunits comparing soft and hard curing.Pract Periodont Aesthet Dent 1999;11:125–132.
15. Koran P, Kurschner R. Effect of sequentialversus continuous irradiation of a light-cured resin composite on shrinkage, vis-cosity, adhesion, and degree of polymer-ization. Am J Dent 1998; 11:17–22.
16. Bouschlicher MR, Vargas MA, Boyer DB.Effect of composite type, light intensity,configuration factor and laser polymeriza-tion on polymerization contraction forces.Am J Dent 1997; 10:88–96.
17. Feilzer AJ, Dooren LH, de Gee AJ, David-son CL. Influence of light intensity onpolymerization shrinkage and integrity ofrestoration-cavity interface. Eur J Oral Sci1995; 103:322–326.
18. Rueggeberg FA, Caughman WF, ChanDCN. Novel approach to measure com-posite conversion kinetics during exposurewith stepped or continuous light-curing. JEsthet Dent 1999; 11:197–205.
19. Light-curing units. Farah JW, Powers JM,editors. The Dental Advisor 1999; 16:1–5.
20. Kanka J 3rd, Suh BI. Pulse activation:reducing resin-based composite contrac-tion stresses at the enamel cavosurfacemargins. Am J Dent 1999; 12:107–112.
21. Alberts HF. Resin polymerization. AdeptReport 2000; 6:3.
22. Blankenau RJ, Kelsey WP, Powell GL,Shearer GO, Barkmeier WW, Cavel WT.Degree of composite resin polymerizationwith visible light and argon laser. Am JDent 1991; 4:40–42.
23. Kelsey WP, Blankanau RJ, Powell GL,Barkmeier WW, Stormberg EF. Power andtime requirements for use of the argonlaser to polymerize composite resins. JClin Laser Med Surg 1992; 10:273–278.
24. Ferracane JL, Mitchem JC, Condon JR,Todd R. Wear and marginal breakdown ofcomposites with various degrees of cure. JDent Res 1997; 76:1508–1516.
Reprint requests: Frederick Rueggeberg,DDS, MS, Department of Oral Rehabilitation, School of Dentistry, Room AD-3265A, Medical College of Georgia, Augusta, GA30912-1260; e-mail: [email protected]© 2000 BC Decker Inc