journal of advances in information technology vol. 7, no
TRANSCRIPT

Concurrent Implementation of Supervised
Learning Algorithms in Disease Detection
Zhilbert Tafa Department of Computer Science, University for Business and Technology, Prishtina, Kosovo
Email: [email protected]
Abstract—Machine learning algorithms have been
extensively used in various areas, especially for diagnosing
medical conditions such as cardiovascular disease, cancer,
diabetes etc. Most of the researches estimate the individual
classification measures for the particular algorithm
implemented on a given dataset or combine two algorithms,
from possibly different machine learning groups, in
different phases of data processing. This paper shows that,
in case of a concurrent implementation of two (or more)
classification algorithms, the classification quality can be
significantly improved. The case study is built on the
Support Vector Machine (SVM) and the Naïve Bayes
classifier (NBC) in detection of diabetic or pre-diabetic
condition. The proposed hybrid system improves the overall
computer-based accuracy for diabetes classification to the
value of around 98%, and reduces the false negative
diagnosis to the value of 0.7 %. The results show that SVM
over performs NBC in diabetes detection, while joint
implementation over performs both classifiers individually.
The proposed system/approach can be adapted for
constructing the support tools in medical diagnostics.
Index Terms—algorithms, diabetes, machine learning,
support vector machine, naïve Bayes
I. INTRODUCTION
Machine Learning (ML) is the area of artificial
intelligence that enables the automated discovery of
patterns in data. The ML algorithms learn from
experience, by inspecting the data structures, relations,
and contents. This knowledge is used to predict the
position of the new records regarding the selected criteria.
The ML algorithms are mainly used in classification,
clustering and regression. As such, they have attracted a
great attention in many areas, especially in medical
diagnostics (such as [1] and [2] etc.); where patients need
to be classified regarding a particular medical condition.
A case study presented in this paper, treats the diabetes
dataset. Diabetes is a chronic disease that affects more
than 300 million people and is mainly indicated by the
inability of the body to produce insulin or the inability of
the cells to respond to the produced insulin. The absence
of symptoms, or the absence of recognition of the
indicators in the patient’s data, may lead to the pre-
diabetic or diabetic condition. As stated in [3], one third
of diabetic patients go undetected in early stage. The
Manuscript received August 10, 2015; revised November 20, 2015.
undetected disease may lead to other health implications,
such as: Heart stroke, kidney failure, blindness, etc. This
is the reason why there is a need for the computer-based
assistance in form of automated recognition of the
patients with diabetic or pre-diabetic condition, even
though the main symptoms (such as plasma glucose
concentration) have not exceed the normal values at the
time of measurement.
This paper presents a hybrid system for medical
diagnosing, constructed by a joint implementation of two
machine learning algorithms, namely SVM (Support
Vector Machine) and NBC (Naïve Bayes Classifier). The
aim of the hybridization is to improve the reliability over
individual use of each of algorithms. The SVM is a
relatively new classification algorithm that proved to be
very efficient, especially in case of imbalanced data, such
as those acquired in medical diagnosis [4]. On the other
hand, the Naïve Bayess classifier is a popular, simple,
and also a very successful classification scheme that
follows a different classification philosophy as compared
to the SVM, and can easily be integrated into the hybrid
system presented in the paper.
As shown in the case study on a newly acquired
diabetes dataset, with newly added attributes (as
compared to the previous work), the overall reliability of
the hybrid system over performs both classifiers
individually.
This approach has the potential to be used especially in
medical diagnostics, where computer-based tools are
preferable, but where some kind of the additional human
presence is necessary in order to make the diagnosis more
reliable, at least in cases of border line parameters.
The reminder of this paper is structured as follows.
The proceeding section reviews previous work on the
implementation of the classification methods in medical
diagnostics, especially in diabetes detection. Section III
presents the used materials and methods, i. e., the dataset
acquisition and the attribute’s description, the used
algorithms and the joint approach, as well as the
methodology of the performance measurements. The
results are given in Section IV. Finally, Section V
concludes the paper.
II. PREVIOUS WORK
Basically, there are two approaches that have been
widely deployed in diagnostic process: one that uses a
124
Journal of Advances in Information Technology Vol. 7, No. 2, May 2016
© 2016 J. Adv. Inf. Technol.doi: 10.12720/jait.7.2.124-128

particular ML algorithm and another that aims to use two
algorithms to improve the performances.
A comparison on some fundamental methods with
hybrid implementations is presented in [3]. The SVM
individually showed better performances than ANN,
while the hybrid k-Nearest Neighbor and k-means
clustering, as presented in [5], over performs other
algorithms under comparison setup. Another study, that
compares the results of SVM and Adaptive Neuro Fuzzy
(ANF) methods on diabetes dataset, also shows the better
performance of the SVM [6]. The individual
implementations of the Bayesian Network and K-Nearest
Neighbor algorithms in diabetes prediction are presented
in [7] and [8], respectively. While the Bayesian networks
show high accuracy, the K-Nearest Neighbor shows a
relatively low accuracy. A high accuracy of around 95 %
in diabetes detection is achieved by using the SVM in [9].
Since each machine learning method works differently
and exploits a different part of problem (input) space,
usually by using a different set of features, their
combination or integration usually gives better
performance than using each individual machine learning
or decision-making model alone [10]. An example of a
combined approach is given in [11], where K-Nearest
Neighbor and NBC are used in firstly classifying the
numerical attributes and lately classifying the categorical
attributes, respectively. A survey on hybrid classification
models for decision support is given in [10].
As compared to the mentioned studies, this paper uses
a different approach for hybridization. Here, both
algorithms are executed on the same set of attributes,
while the combination of algorithms for final
classification is made afterward. The decision on SVM
and NBC is made based on the researches from literature,
such as the one that presents empirical comparison of
supervised learning algorithms in disease detection [11],
where SVM has shown the best accuracy in diabetes
prediction and NBC was the second of algorithms
regarding the same criteria.
The acquired data were also tested on other
classification algorithms by using Weka machine learning
tool. Again, SVM has shown the best individual
performance.
III. MATERIALS AND METHODS
A. Data Ascquisition
In order to avoid the bias due to the specific expertise
level of the medical staff, the dataset, which contains 402 instances, was acquired from three different health care
centers. Knowing that the medical data belong to the
category of sensitive information, after the acquisition of
each record, the data were depersonalized. The dataset contains eight attributes, from which six
are usually included in similar researches (BMI, systolic
and diastolic blood pressures, the pre-meal and the post-
meal plasma glucose concentration, as well as the
inheritance factor), but it also contains some newly
introduced attributes such as regular diet and physical
activity. The data were acquired partly through clinical
examinations (plasma glucose concentration, blood
pressure and BMI), and partly through interview
questions. The diet habits and the physical activity could
not be measured explicitly, and would therefore introduce
the ambiguity to the interviewed participant without some
criterion established. Therefore, without the ambition to
comply with the sub-categories, the attributes are defined
according to their main meanings, relying on the basic
definitions from the report of Health and Social Care
Information Center in England for 2015. These
parameters are described in this paper as follows. The
participants were interviewed if they consume not
voluminous amounts of meal in equidistant intervals at
least three times a day and if their meal habits include
vegetables. On the other hand, the participants are
considered to be physically active if they conduct 150-
200 minutes of physical activity a week (without
categorizing them into less or more intensive physical
activities).
As implicated, five out of eight attribute values are
integer or decimal numbers, while three attributes are
Boolean. The last attribute, i.e., the answer on whether a
particular participant has diabetes or not, that is acquired
from the medical practitioners, is also represented as
Boolean “one” or “zero” which corresponds to the
answers “yes” or “no”, respectively.
The input data are moderately imbalanced with 80
records that belong to the class “yes” and 322 records that
belong to the class “no”. According to [12], SVM has
been given top priority for addressing the challenging
problem of imbalanced data. This is one more reason the
SVM is used as one of the algorithms.
B. The Algorithms: SVM and NBC
The SVM algorithm and Naïve NBC follow two
different classification philosophies. The beginning of the
algorithm is, however, the same in both cases - the
dataset is divided into the train set and the test set.
The data are presented as vectors in n-dimensional
space. Based on the vectors from the train set, the SVM
tends to map the learning examples from input space to a
new high-dimensional, potentially infinite-dimensional
feature space in which examples are linearly separable.
To do this, it often uses special transformation functions,
called kernels. Priory, the number of instances and
features are reduced to a small set of critical border
examples of each class that are called support vectors.
Then, the aim is to find a hyper plane that maximizes its
distances to the support vectors and that minimizes the
error estimation function:
1
1
2
nT
i
i
w w C
(1)
With the following constraints:
1 , 0, 1,T
i i i iy w x b i n
where w is the matrix of coefficients, b is a constant, and
ξ is a slack variable (i.e., the error tolerance). Here, n is
the number of learning example and C is a regularization
parameter.
125
Journal of Advances in Information Technology Vol. 7, No. 2, May 2016
© 2016 J. Adv. Inf. Technol.

Now, the optimal hyper plane is generally given with:
, 0w x b (2)
The hyper plane now divides the space into two areas:
one that is composed of (mainly) members of one class
and another that contains (mainly) the members of
another class.
While SVM uses geometric, analytical and algebraic
approach, the NBC uses purely probabilistic formulation.
The mathematical assumption of this method is somewhat
unrealistic, because it treats attributes as equally
important and independent. But, as shown in [13], this
approach leads to a simple scheme that, again works
surprisingly well in practice.
The NBC is build upon the conditional probability
theory. Here, the probability that a given record X
belongs to class Y=C, can be calculated as the product of
probability that each value of the record X belongs to
class C, i.e.,
1
( | ) ( | )q
i
i
P X Y C P X Y C
(3)
The probability that a given record will be classified in
class C is:
( | )P C P X CP C X
P X
(4)
The probability for all the classes is calculated and the
record is classified to belong to the class with the highest
probability value.
In case when values are numerical, the probability of
each attribute as to belong to a specific class is calculated
by using the Gaussian distribution function. In this case,
for each attribute-column, the mean µ and the standard
deviation σ are firstly calculated for each class. These
formulations are given with:
1
n
iiX
n
(5)
And
2
2 1
1
n
iiX
n
(6)
Now, the probability regarding each class is calculated
by using the Gaussian function:
2
221
2
x
f x e
(7)
The derived values are now inserted into (4) and the
instance is classified as belonging to the class with the
highest result.
C. The Logic of the Proposed System
Each new data is inspected by both algorithms. If both
point to the same result, the output is considered valid
(with a relatively high reliability). Otherwise, the output
is considered invalid and the patient is directed to the
further clinical examinations.
The logic behind the JSN is shown in Fig. 1.
Figure 1. The logics of the joint implementation.
The logic gates are only used to depict the system’s
functionality, while the system’s logic is purely
implemented in software. As shown, the new data is
tested both on SVM and NBC classifiers. If both
classifiers have the same output, then the output of the
XNOR gate is the Boolean one, which turns the switch
into the position A. This enables the signal from the
output of the AND gate to be transmitted as the
classification decision (1 that corresponds to “yes”, and 0
that corresponds to “no”), i.e., the AND gate actually
outputs the result from the classifiers. These results are
considered to be valid.
When classifiers point to different results, the output of
the XNOR gate will be zero, which turns the switch into
the position B. This position enables the signal from N/A
(Not Applicable) status to be conducted to the output
message. These results are considered to be invalid. In
this case, the user receives the message on the screen that
recommends further clinical examinations for a more
precise diagnose regarding a specific record.
The SVM and NBC classifiers are built on previously
stored records. The diagnosis attribute in these records is
filled by the medical professionals. The program is
implemented in MATLAB because of its flexibility. The
SVM uses bioinformatics tool while NBC function is
constructed manually by manually constructing
mathematical functions. The polynomial, the RBF
(Radial Basis Function) and linear kernels are examined
for SVM.
D. The Procedure of Performance Evaluation
The MATLAB routines enable for the random and
stratified data division into train set and test set. The
procedure of random sub-sampling validation turned out
to be more appropriate for assessing the performance
metrics of the concurrent implementation. In order to
mitigate any bias caused by samples chosen for holdout,
the repeated holdout is executed 100 times. The record
can be classified as either belonging to class YES
(positive to diabetes) or to class NO (negative to diabetes).
The performance evaluation procedure is implemented as
follows.
Repeat 100 times:
Create two matrixes randomly, namely
train set and test set.
Relying on the data from the train set, execute the
SVM and NBC routines, i.e., create the optimal
hyper plane for the SVM and calculate the
probabilities for the NBC.
126
Journal of Advances in Information Technology Vol. 7, No. 2, May 2016
© 2016 J. Adv. Inf. Technol.
Use every instance of the test set to evaluate the
performances of the SVM and NBC. In this phase,
it is important to count: the number of answers
given by classifiers that were true and wrong as
well as the number of answers that were the same
for both classifiers (both true and wrong regarding
the real answers). Also, it is important to count the
number of answers that were classified differently
by given classifiers.
To summarize on parameters for the performance
evaluation, after the program execution, the counted
parameters can be classified into two categories as
follows.
For both SVM and NBC individually, count:
The number of True Positive values (TP).
The number of False Positive values (FP).
The number of True Negative values (TN).
The number of False Negative values (FN).
If we denote the real answer (given in the test set)
with D, the results from the SVM with S, and the
results from NBC with N; then the following
parameters are counted as well:
JTP – the number of situations S=N=Yes=D.
JTN - the number of situations S=N=No=D.
JFP - the number of situations S=N=Yes≠D.
JFN - the number of situations S=N=No≠D.
N/A - the number of situations S≠N.
After counting the above parameters, the classifiers’
performances were calculated in terms of the accuracy as
well as the precision and recall for classes YES and NO
in accordance to the definition from the literature [14].
While the precision and recall give different aspects of
the classification quality, the overall test’s accuracy is
measured with F-measure given with:
2* *Precision Recall
Precision Recall (8)
F-measure measures the balance between the precision
and recall and represents the quality of the solution by
using a single number [15].
IV. RESULTS AND DISCUSSIONS
The results were evaluated for SVM, NBC and for the
JSN (Joint SVM and NBC). The repeated random-sub-
sampling validation was practically more suitable for the
system performance assessment. On each execution, the
classifiers were extracted and the above mentioned
parameters were counted. After all the iterations, the
performances were evaluated in terms of: accuracy,
precision, recall, and F-measure.
The results regarding the overall accuracy as well as on
the precision and recall for classes YES and NO, for
SVM and NBC individually are summarized in Table I.
The joint implementation have the rate of N/A results
of 5.23 %, which means that in most of the cases the
patient will be classified the same way by both algorithms
and the system will give the valid outputs.
With the 5.23% of data excluded, the results for the
JSN can be summarized in Table II.
TABLE I. PERFORMANCE MEASUREMENTS ON SVM AND NBC
Accuracy Precision
(NO)
Recall
(NO)
Precision
(YES)
Recall
(YES)
SVM 95.52 % 0.97 0.975 0.892 0.868
NBC 94.53 % 0.981 0.951 0.814 0.921
TABLE II. PERFORMANCE MEASUREMENTS ON JSN
Accuracy Precision
(NO)
Recall
(NO)
Precision
(YES)
Recall
(YES)
JSN 97,8 % 0.986 0.993 0.967 0.919
Ideally, if 5.23% of participants/patients (that are
classified differently by two classifiers), get the precise
diagnosis after the further examinations, which is a
realistic assumption, the parameters in Table II will be
further improved. For example, the accuracy will become
around 98 %, which is significantly better than the
accuracy of the classifiers individually (95.52 % and
94.53 %). Other parameters are expected also to get
improved.
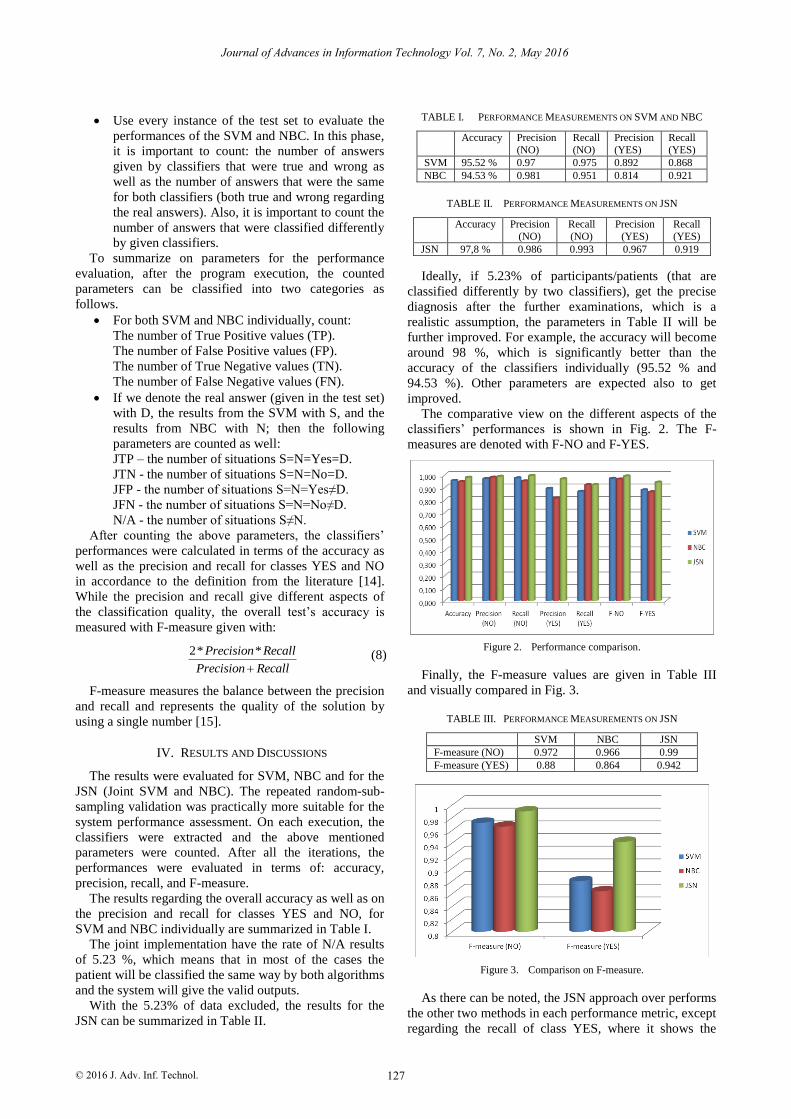
The comparative view on the different aspects of the
classifiers’ performances is shown in Fig. 2. The F-
measures are denoted with F-NO and F-YES.
Figure 2. Performance comparison.
Finally, the F-measure values are given in Table III
and visually compared in Fig. 3.
TABLE III. PERFORMANCE MEASUREMENTS ON JSN
SVM NBC JSN
F-measure (NO) 0.972 0.966 0.99
F-measure (YES) 0.88 0.864 0.942
Figure 3. Comparison on F-measure.
As there can be noted, the JSN approach over performs
the other two methods in each performance metric, except
regarding the recall of class YES, where it shows the
127
Journal of Advances in Information Technology Vol. 7, No. 2, May 2016
© 2016 J. Adv. Inf. Technol.

similar results as NBC. On the other hand, SVM over
performs the NBC in most of the measures.
It is important to note that, along with other metrics,
JSN improves the class NO precision and especially
recall. This has the significant implications on improving
the overall computer based diagnostic quality, since the
reduction of the false negative decision is considered to
be of a crucial importance in medical diagnostics. Finally,
F-measure shows significant difference of the JSN in
precision/recall balance.
V. CONCLUSIONS
The machine learning algorithms are extensively used
in medical diagnostics. Regarding the diabetes
classification, and according to the literature, in this area
the SVM has shown the best performances.
This paper introduces an algorithm that is built on the
concurrent use of SVM and NBC. The aim of integrating
two algorithms into the joint implementation is to further
improve the overall performances (of the SVM-based
diagnostic tool).
In order to compare the results and the improvements,
the performances were evaluated for both classifiers
individually as well as for the JSN classifier.
As shown, the SVM over performs NBC individually
but JSN over performs both algorithms in almost all
categories.
The main strengths of the joint implementation are
contained in significant improvement of the overall
system accuracy, in improvement of the precision and
recall of the negative diagnosis (NO) as well as in the
improvement of the positive diagnosis (YES) precision.
A drawback of the presented approach is that, in its
relatively small portion (of around 5.3% of cases), the
decision making process becomes manual. However, we
predicate that, in medical applications, there should be
some kind of “professional physical presence” that
manually re-estimate some border line cases, i.e., that the
diagnostic process should not be purely automatic.
The presented approach can be adapted for
implementation as an online and/or in-hospital support
tool that would provide the first opinion regarding
various medical conditions.
REFERENCES
[1] T. N. Kim, J. M. Kim, J. C. Won, M. S. Park, S. K. Lee, S. H.
Yoon, et al., “A decision tree-based approach for identifying
urban-rural differences in metabolic syndrome risk factors in the
adult Korean population,” Journal of Endocrinological Investigation, vol. 35, pp. 847-852, 2012.
[2] J. Nahar, K. S. Tickle, A. B. Ali, and Y. P. Chen, “Significant
cancer prevention factor extraction: an association rule discovery approach,” Journal of Medical Systems, vol. 35, pp. 353-367, 2011.
[3] S. Peter, “An analytical study on early diagnosis and classification
of diabetes mellitus,” Bonfring International Journal on Data Mining, vol. 4, no. 2, pp. 7-11, 2014.
[4] S. Zhang, S. Sadaoui, and M. Mouhoub, “An empirical analysis of
imbalanced data classification,” Computer and Information Science, vol. 1, pp. 151-162, 2015.
[5] M. NirmalaDevi, S. Appavu, and U. V. Swathi, “An amalgam
KNN to predict diabetes mellitus,” in Proc. 2013 International Conference on Emerging Trends in Computers, Communication
and Nanotechnologies, 2013, pp. 691-695.
[6] S. B. Choi, W. J. Kim, T. K. Yoo, J. S. Park, J. W. Chung, Y. Lee, et al, “Screening for prediabetes using machine learning models,”
Computational and Mathematical Methods in Medicine, 2014.
[7] M. Kumari, R. Vohra, and A. Arora, “Prediction of diabetes using Bayesian network,” International Journal of Computer Science
and Information Technologies, vol. 5, no. 4, pp. 5174-5178, 2014.
[8] K. Saxena, Z. Khan, and S. Singh, “Diagnosis of diabetes mellitus using K nearest neighbor algorithm,” International Journal of
Computer Science Trends and Tecnnology, vol. 2, pp. 36-43, 2014.
[9] R. Aishwarya, P. Gayathri, and N. Jasinkar, “A method for classification using macnine learning technique for diabetes,”
International Journal of Engineering and Technology, vol. 5, no. 3,
pp. 2903-2908, 2013. [10] V. Miskovic, “Machine learning of hybrid classification models
for decision support,” in Sinteza 2014: Impact of Internet on
Business Activities in Serbia and Worldwide, 2014, pp. 318-323. [11] E. Z. Ferdousy, M. Islam, and M. A. Martin, “Combination of
naïve bayes classifier and K-nearest neighbor (cNK) in the
classification based predictive models,” Computer And Information Science, vol. 6, no. 3, pp. 48-56, 2013.
[12] P. Cao, D. Zhao, and O. Zaiane, “An optimized cost-sensitive
SVM for imbalanced data learning,” in Advances in Knowledge Discovery and Data Mining, Springer, Berlin Heidelberg, 2013,
pp. 280-292. [13] I. H. Witten, E. Frank, and M. A. Hall, “Algorithms: The basic
methods,” in Data Mining: Practical Machine Learning Tools and
Techniques, 3rd ed., Burlington MA, 2011, ch. 4, sec. 4.1, pp. 86-87.
[14] I. H. Witten, E. Frank, and M. A. Hall, “Counting the cost,” in
Data Mining: Practical Machine Learning Tools and Techniques, third ed., Burlington MA, 2011, ch. 5, sec. 5.7, pp. 163-180.
[15] H. Daume, “Evaluating model performance,” in A Course in
Machine Learning, 2012, ch. 4, sec. 4.5, pp. 58-60.
Zhilbert Tafa
is a professor of Computer
Science at University for Business and
Technology in Prishtina, Kosovo. He received his Ph.D. in electrical engineering from
Belgrade University. His research interests
include wireless sensor networks, computer networks, machine learning
and medical
informatics.
128
Journal of Advances in Information Technology Vol. 7, No. 2, May 2016
© 2016 J. Adv. Inf. Technol.