journal of aging and health
TRANSCRIPT

http://jah.sagepub.com
Journal of Aging and Health
DOI: 10.1177/0898264308321081 2008; 20; 767 originally published online Jun 17, 2008; J Aging HealthBenjamin A. Shaw and Linda S. Spokane
Physical Activity Changes During Early Old AgeExamining the Association Between Education Level and
http://jah.sagepub.com/cgi/content/abstract/20/7/767 The online version of this article can be found at:
Published by:
http://www.sagepublications.com
can be found at:Journal of Aging and Health Additional services and information for
http://jah.sagepub.com/cgi/alerts Email Alerts:
http://jah.sagepub.com/subscriptions Subscriptions:
http://www.sagepub.com/journalsReprints.navReprints:
http://www.sagepub.com/journalsPermissions.navPermissions:
http://jah.sagepub.com/cgi/content/refs/20/7/767 Citations
at SUNY ALBANY LIBRARY on January 28, 2010 http://jah.sagepub.comDownloaded from

Examining the Association Between Education Level and Physical Activity Changes During Early Old AgeBenjamin A. Shaw, PhD, MPHUniversity at Albany, State University of New YorkLinda S. Spokane, MSNew York Association of Homes and Services for the Aging
Objective: This study examined the relationship between aging and regularphysical activity. The moderating effects of education and the extent to whichemployment and health status influence physical activity were also examined.Method: Multilevel logistic regression was conducted using longitudinal datafrom a national sample of 7,595 adults aged 54 to 72. Results: An age-relateddecline in physical activity was observed, steeper among low-education indi-viduals. Lack of physical activity was predicted by worsening health andreduced workforce participation, but these associations varied by educationlevel. For low-education individuals, not working and job losses were associ-ated with reduced physical activity, whereas for highly educated individualsthe reverse was true. Health problems were associated more strongly withreduced physical activity in high-education individuals. Discussion: Early oldage is a critical period for promoting physical activity. Different interventionstrategies for groups of different socioeconomic status may be needed.
Keywords: aging; education; physical activity
Current trends in population aging are unprecedented in human historyand have raised concerns about the prospects of an increase in the
prevalence of morbidity in the population and a rise in health care costs
Journal of Aging and HealthVolume 20 Number 7
October 2008 767-787© 2008 Sage Publications
10.1177/0898264308321081http://jah.sagepub.com
hosted athttp://online.sagepub.com
767
Authors’ Note: This study was supported by a grant from the Center for Social andDemographic Analysis at the University at Albany. We would like to thank William Gallo forhis comments on an earlier version of this article. Correspondence concerning this articleshould be addressed to Benjamin A. Shaw, Department of Health Policy, Management, andBehavior, School of Public Health, State University of New York at Albany, One UniversityPlace, Rensselaer, NY 12144-3456; e-mail: [email protected].
at SUNY ALBANY LIBRARY on January 28, 2010 http://jah.sagepub.comDownloaded from

(Gruenberg, 1977). These concerns have helped bring to light the protectiveroles of individual behaviors (McGinnis & Foege, 1993; Mokdad, Marks,Stroup, & Gerberding, 2004). Indeed, many believe that promoting healthybehavior offers the most promising means for offsetting, or “compress-ing,” the growing illness burden that could arise from our aging population(Fries, 2003).
Physical activity is one behavior that has well-documented health benefitsand is considered one of the most effective measures for preventing chronicillnesses such as coronary heart disease and diabetes (U.S. Department ofHealth & Human Services [USDHHS], 1996). For this reason, the Centersfor Disease Control and Prevention (CDC) recommend that adults engagein moderate-intensity activities for at least 30 minutes on 5 or more daysper week or vigorous-intensity activities for at least 20 minutes on 3 or moredays per week (USDHHS, 1996). Current data from the Behavioral RiskFactor Surveillance Study (BRFSS), however, indicate that approximately50% of all adults do not currently meet these recommendations (CDC,2006). Furthermore, the prevalence of regular physical activity appears todecline precipitously in later life, dropping from 44.8% among those aged55 to 64 to 39.0% among those aged 65 and older (CDC, 2006).
Cross-sectional, aggregate-level data such as these are useful for monitor-ing the magnitude of inactivity in the population and for setting broad inter-vention priorities (Brownson, Boehmer, & Luke, 2004). However, thesedata reveal little about changes in physical activity behavior that are likelyto occur within individuals as they age or how individuals differ from oneanother with respect to age-related changes in physical activity. Utilizing datacollected from the same individuals over extended periods during the agingprocess can help to address these gaps. For example, following the sameindividuals over time enables testing of the effects of aging on physical activ-ity within individuals in a way that is not completely confounded by inter-personal differences across age groups (Shaw, Krause, Liang, & Bennett,2007). It is possible that within-person aging-related declines in physicalactivity occur even more readily than is suggested by cross-sectional data.This might be the case, for instance, if the healthiest and most activemembers of older age groups are more likely than those with poorer healthto respond to cross-sectional surveys (i.e., the healthy participation effect),thereby obscuring declines in activity that might occur over time within thesame individuals (Mendes de Leon, 2007).
Examining interpersonal differences in age-related changes in physicalactivity is also essential, especially in light of current evidence of an increas-ing degree of heterogeneity in health during old age (Liang et al., 2003;
768 Journal of Aging and Health
at SUNY ALBANY LIBRARY on January 28, 2010 http://jah.sagepub.comDownloaded from

Liang et al., 2005; Nelson & Dannefer, 1992). Consistent with a notion ofthe social stratification of health, this study aims to begin accounting forvariation in physical activity behavior during early old age by focusing ona major component of socioeconomic status (SES): education level. Indeed,many consider education to be a primary driving force behind the socialstratification of health, shaping several more proximate determinants of health,such as employment opportunities and financial well-being as well as personalcontrol beliefs and healthy lifestyles (Mirowsky & Ross, 2003).
Nevertheless, much is not known about the linkages between education andphysical activity during the aging process. Findings from several population-based cross-sectional studies show evidence of education-based disparitiesin physical activity during middle and late life (Chad et al., 2005; Grzywacz& Marks, 2001; Kaplan, Newsom, McFarland, & Lu, 2001; King et al., 2000;Kubzansky, Berkman, Glass, & Seeman, 1998). At the same time, someforms of physical activity, such as strenuous work-related activity, areknown to be inversely related to education level (He & Baker, 2005). Andwe know little about the degree to which education level is associated withwithin-person changes in physical activity during old age.
The extent to which changes in key health and lifestyle factors influencephysical activity during early old age is also not well understood. Departuresfrom the workforce, as well as increases in the incidence of chronic condi-tions and functional limitations during early old age, may each contributeto the trend of declining physical activity observed for the population as awhole; however, these transitions may affect physical activity differentlydepending on an individual’s education level. For example, leaving thework force may have a particularly strong negative impact on the physicalactivity of those with lower levels of education. Recent evidence supportsthis notion by revealing substantial variability in the effects of retirement onphysical activity. For instance, investigators have recently found that retire-ment is likely to cause declines only in certain types of work-related physicalactivity and not in leisure-time physical activity (Slingerland et al., 2007).Given that adults with low levels of education are more likely to haveworked in positions that require physical labor (He & Baker, 2005), thispattern of decline would suggest that the less well educated would sufferthe greatest losses in overall physical activity following departures from theworkforce. Furthermore, other research has suggested that for retirees whodo not return to work, rates of physical activity actually increase followingretirement, at least during early old age (Mein, Shipley, Hillsdon, Ellison, &Marmot, 2005). Given that highly educated adults are more likely than lesseducated adults to have the financial resources to retire without returning to
Shaw, Spokane / Education Level and Physical Activity Changes 769
at SUNY ALBANY LIBRARY on January 28, 2010 http://jah.sagepub.comDownloaded from

work, this suggests that retirement may in fact enable high SES adults todevote more time to engaging in physical activities.
Highly educated individuals may also be better equipped to maintainregular physical activity after the onset of morbidity and disability. Forexample, higher levels of education provide individuals with a myriad ofadvantages that are likely to promote physical activity even in the face ofage-related changes in abilities, including increased knowledge about itsbenefits, a stronger sense of personal control and self-efficacy for physicalactivity, healthier influences from social network members, and greateraccess to resources that facilitate physical activity (McAuley et al., 2006;Mirowsky & Ross, 2003; Wray, Herzog, Willis, & Wallace, 1998). On theother hand, it is also possible that increasing age and impairment may actuallyserve to “level the playing field” with respect to physical activity stratifica-tion. According to the age-as-leveler hypothesis, socioeconomic differen-tials in physical activity would be expected to grow significantly smaller inold age, as the physical changes associated with aging create barriers tophysical activity across the entire socioeconomic gradient (House et al.,1994; Wray, Alwin, & McCammon, 2005).
The purpose of this study is to address each of these issues, utilizing datafrom a nationally representative sample of older adults followed over a 6-yearperiod, from 1996 to 2002. The following specific hypotheses were tested:(a) on average, the probability of engaging in regular physical activitydeclines within individuals with increasing age, (b) education level is pos-itively associated both with the probability of engaging in regular physicalactivity overall and with less steep age-related declines in physical activity,and (c) age-related increases in health problems and declines in participa-tion in the work force are associated with lower rates of subsequent physicalactivity, and these associations are particularly strong among individualswith relatively low education levels.
Method
Data Source and Collection
Data for this study came from the Health and Retirement Study (HRS), anationally representative panel survey of community-dwelling older Americansborn between 1931 and 1941 (RAND Center for the Study of Aging, 2004).The original HRS sample was selected from a sampling frame of households,generated using a multistage, clustered area probability frame. The HRS issponsored by the National Institute of Aging and is conducted by the
770 Journal of Aging and Health
at SUNY ALBANY LIBRARY on January 28, 2010 http://jah.sagepub.comDownloaded from

University of Michigan. Further details about this study are available online(http://hrsonline.isr.umich.edu/) and in print (Juster & Suzman, 1995).
Data were first collected from the HRS sample (N = 12,521) in 1992,and data collection continues on a biannual basis. To make use of consistentmeasures of physical activity, four waves of data collected between 1996and 2002 were used. Furthermore, only those respondents with validresponses to the physical activity measure for at least two waves wereincluded in this study.
After employing these criteria, the sample included 7,595 respondents,observed 27,050 times (an average of 3.56 observations per respondent).This sample was 44.0% male, was 81.0% White, and had an average age atbaseline of 59.7 years (range = 54 to 72). The average level of education inthis sample was 12.1 years of schooling.
Measures
Physical activity. The HRS survey contained the following single questionabout physical activity in each of the four waves: “On average over the last12 months have you participated in vigorous physical activity or exercisethree times a week or more? By vigorous physical activity, we mean thingslike sports, heavy housework, or a job that involves physical labor.”Responses were coded in a binary format (1 = yes, 0 = no). Over the courseof the study period, the prevalence of participation in regular physicalactivity was 48.0%.
Education level. Education level was measured as a continuous variableand represents years of completed schooling.
Time-varying predictors. The current study included a set of work andhealth status measures that were assessed at each wave. The work status mea-sure represents whether an individual was working for pay (1) or not (0).Health status measures included a count of eight chronic conditions (i.e., highblood pressure, diabetes, cancer, lung disease, heart disease, stroke, psychi-atric problems, and arthritis), a count of functional limitations (i.e., thenumber of activities of daily living—bathing, eating, dressing, walking acrossa room, and getting into or out of bed—with which an individual reported atleast some difficulty), and a measure of depressive symptoms based on theCenter for Epidemiologic Studies Depression Scale (Radloff, 1977), rangingfrom 0 to 8. In addition, a time-varying measure of marital status (1 = mar-ried, 0 = other) was included as a control variable in our models.
Shaw, Spokane / Education Level and Physical Activity Changes 771
at SUNY ALBANY LIBRARY on January 28, 2010 http://jah.sagepub.comDownloaded from

Additional demographic control variables. All analyses controlled forthe effects of gender (1 = male, 0 = female) and race (1 = White, 0 = non-White). It should be noted that the vast majority (82%) of the non-Whitegroup in this sample consisted of Black or African American individuals. Infact, non-Whites who were not Black made up less than 5% of the totalsample. Under these conditions, it is not feasible to break the non-Whitecategory into a finer gradation. In this case, therefore, race is broadly con-ceptualized in terms of majority versus minority racial status.
Data Analysis
The analyses for this study focused on estimating the association betweena respondent’s age at different observation points and the probability ofengaging in regular physical activity. These analyses were carried out withmultilevel logistic regression. Multilevel analyses are appropriate in thiscontext because the occasions of measurement of physical activity and ageare nested within individuals (Hox, 2002). Multilevel modeling of these dataallows for the estimation of the changes in the log odds of participationin regular physical activity that are associated with increasing age withinindividuals.
The statistical procedures for this study were conducted in three stages.In the first stage, the log odds of participation in regular physical activitywere modeled as a function of age (centered on the sample mean anddivided by the standard deviation) over the course of the four waves of datacollection for each individual. This model produces two fixed effects and tworandom effects. The fixed effects represent the average log odds of physi-cal activity at the mean age for the sample and the average intraindividualchanges in the log odds of physical activity with increasing age for the sam-ple taken as a whole. The random effects represent the degree to whichrespondents’ physical activity at the intercept, and change rates, deviatedfrom the mean. These random effects are used to determine whether the dataincluded interindividual variance with regard to intraindividual changes inphysical activity.
To control for the potential effects of heterogeneity with respect to ageat baseline, a time-invariant variable representing birth year was included inthis, and subsequent, models. Also, a variable distinguishing betweenrespondents with complete data at all four waves (n = 6,228) and those whodropped out (n = 1,367) was included in the models to control for potentialdifferences in the trajectories of these two groups. Gender, race, and maritalstatus were also included as control variables.
772 Journal of Aging and Health
at SUNY ALBANY LIBRARY on January 28, 2010 http://jah.sagepub.comDownloaded from

Next, education level was included in the model, specified as both amain effect and an interaction with age. The main effect for education levelrepresents the association between educational attainment and the log oddsof physical activity at the mean age of the sample, after controlling for theeffects of gender, race, and the other control variables. The multiplicativeterm between age and education level represents the influence of educationalattainment on age-related changes in physical activity.
Finally, several other time-varying covariates—measures of work andhealth status—were entered into the model. As an extension of the work ofYang and George (2005), for each time-varying construct, two variableswere included in the model. The first set of time-varying predictors repre-sents each respondent’s score on a predictor during the prior wave.Associations between these so-called “lagged” time-varying predictors andphysical activity represent the relationship between work or health status ata given point in time and physical activity approximately 2 years later. Thesecond set of time-varying variables represents the change in a given predic-tor between the current and prior wave. For dichotomous predictors, such aswork status, change variables indicating gains (i.e., a job gain) and losses(i.e., job loss) were entered as dummy variables to be compared with stablework status. For continuous predictors, such as chronic conditions, a singlechange score was entered for each respondent at each wave. Associationsbetween these change variables and physical activity represent the relation-ship between transitions in work or health status during the preceding 2years and physical activity at a given point in time. In addition, a series ofmultiplicative terms was estimated for each of these time-varying covariatesand education level. These multiplicative terms represent the degree towhich the association between the time-varying predictors and participationin regular physical activity varied across education level.
Results
The relationship between age and physical activity was examined first.Table 1 shows the percentage of the sample who met the recommendedlevel of vigorous physical activity at each of the four waves. As is evidentfrom this table, physical activity rates declined in this sample over time(from 50.9% in Wave 1 to 44.9% in Wave 4) as the mean age increased(from 59.4 in Wave 1 to 65.3 in Wave 4). The extent to which this overallpattern of decline represents within-person declines in physical activity withadvancing age, however, is uncertain. This is because, as this table shows,
Shaw, Spokane / Education Level and Physical Activity Changes 773
at SUNY ALBANY LIBRARY on January 28, 2010 http://jah.sagepub.comDownloaded from

between each wave both increases and decreases in physical activity wereobserved. Specifically, between each wave approximately 12.7% to 14.6%of the sample increased their frequency of physical activity from less thanthree times per week to three or more times per week, whereas approximately15.5% to 16.7% of the sample experienced declines. It should also be notedthat the size of the available sample, and presumably the composition,changed over time. Therefore, it is unclear to what extent the pattern ofdecline in physical activity reflects the fact that a slightly different availablesample was analyzed at each wave.
Multilevel logistic regression analysis can help to control for these uncer-tainties by estimating the sample’s average rate of within-person, age-relatedchange in physical activity. A parameter estimate representing the averagechange in the log odds of physical activity associated with increasing agebetween 1996 and 2002 appears in the column labeled Model 1 of Table 2.This estimate shows that, after controlling for the effects of birth cohort,attrition, gender, and race, the log odds of participation in regular physicalactivity decreased with advancing age (b = –0.163, p ≤ .001). The odds ratio(OR) associated with this estimate (OR = 0.849, 95% confidence interval[CI] = 0.820, 0.880) suggests that between ages 54 and 72, individuals’ oddsof participation in regular physical activity decreased by about 15% every3.85 years (i.e., 1 standard deviation), or about 3.9% per year.
774 Journal of Aging and Health
Table 1Rates of Vigorous Physical Activity and Activity
Change and Mean Age by Wave
Observation Year
1996 1998 2000 2002
Vigorous physical activity (≥ 3 times per week)% of available sample meeting recommendation 50.9 47.4 47.3 44.9
% of available sample increasing from previous wavea — 13.0 14.6 12.7
% of available sample decreasing from previous waveb — 16.7 15.5 16.0
Mean age of available sample 59.4 61.2 63.2 65.3Available sample size 7,940 8,020 7,600 7,236
a. Increasing from < 3 times per week to ≥ 3 times per week.b. Decreasing from ≥ 3 times per week to < 3 times per week.
at SUNY ALBANY LIBRARY on January 28, 2010 http://jah.sagepub.comDownloaded from

775
Tabl
e 2
Par
amet
er E
stim
ates
,Rob
ust
Stan
dard
Err
ors,
and
Odd
s R
atio
s fo
r M
ulti
leve
l L
ogis
tic
Reg
ress
ion
Mod
els
Pre
dict
ing
Reg
ular
Phy
sica
l Act
ivit
y
Mod
el 1
Mod
el 2
Mod
el 3
Inde
pend
ent V
aria
ble
bSE
OR
95%
CI
bSE
OR
95%
CI
bSE
OR
95%
CI
Inte
rcep
t–0
.046
0.01
9*0.
955
0.92
0,0.
990
–0.0
560.
019*
*0.
946
0.91
2,0.
981
–0.1
270.
022*
**0.
881
0.84
4,0.
919
Tim
e-va
ryin
g pr
edic
tor
Age
–0.1
630.
018*
**0.
849
0.82
0,0.
880
–0.1
690.
018*
**0.
844
0.81
4,0.
875
–0.0
150.
031
0.98
50.
927,
1.04
6W
ork
stat
us (
lagg
ed)
0.16
90.
042*
**1.
184
1.09
1,1.
285
Job
gain
0.20
60.
071*
*1.
229
1.06
9,1.
412
Job
loss
–0.1
120.
048*
0.89
40.
813,
0.98
2C
hron
ic c
ondi
tions
(la
gged
)–0
.191
0.01
5***
0.82
60.
802,
0.85
2C
hron
ic c
ondi
tion
tran
sitio
n–0
.130
0.02
9***
0.87
80.
829,
0.93
0Fu
nctio
nal l
imita
tions
(la
gged
)–0
.436
0.03
4***
0.64
60.
605,
0.69
1Fu
nctio
nal l
imita
tion
tran
sitio
n–0
.267
0.03
0***
0.76
50.
722,
0.81
1D
epre
ssiv
e sy
mpt
oms
(lag
ged)
–0.1
130.
012*
**0.
893
0.87
1,0.
916
Dep
ress
ive
sym
ptom
tran
sitio
n–0
.078
0.00
9***
0.92
50.
909,
0.94
1T
ime-
inva
rian
t pre
dict
orE
duca
tion
0.16
20.
017*
**1.
176
1.13
7,1.
216
0.04
70.
021*
1.04
81.
006,
1.09
1In
tera
ctio
nsE
duca
tion
×ag
e0.
056
0.01
4***
1.05
81.
029,
1.08
80.
025
0.01
91.
025
0.98
7,1.
065
Edu
catio
n ×
wor
k st
atus
–0.3
220.
043*
**0.
725
0.66
6,0.
788
(con
tinu
ed)
at SUNY ALBANY LIBRARY on January 28, 2010 http://jah.sagepub.comDownloaded from

776
Tabl
e 2
(con
tinu
ed)
Mod
el 1
Mod
el 2
Mod
el 3
Inde
pend
ent V
aria
ble
bSE
OR
95%
CI
bSE
OR
95%
CI
bSE
OR
95%
CI
Edu
catio
n ×
job
gain
–0.2
210.
071*
*0.
802
0.69
7,0.
922
Edu
catio
n ×
job
loss
0.26
20.
052*
**1.
299
1.17
3,1.
439
Edu
catio
n ×
chro
nic
cond
ition
s–0
.046
0.01
5**
0.95
50.
927,
0.98
5E
duca
tion
×ch
roni
c co
nditi
ons
tran
sitio
n–0
.034
0.03
00.
967
0.91
2,1.
025
Edu
catio
n ×
func
tions
lim
itatio
ns–0
.110
0.02
7***
0.89
50.
850,
0.94
4E
duca
tion
×fu
nctio
ns li
mita
tions
tr
ansi
tion
–0.0
710.
028*
0.93
20.
881,
0.98
5E
duca
tion
×de
pres
sive
sym
ptom
s–0
.004
0.01
10.
996
0.97
4,1.
018
Edu
catio
n ×
depr
essi
ve s
ympt
oms
tran
sitio
n–0
.005
0.00
90.
995
0.97
8,1.
012
Not
e:O
R =
odds
rat
io; C
I =
conf
iden
ce in
terv
al. M
odel
con
trol
s fo
r th
e m
ain
effe
cts
of b
irth
coh
ort,
attr
ition
,gen
der,
race
,and
mar
ital s
tatu
s.*p
≤.0
5. *
*p≤
.01.
***
p≤
.001
.
at SUNY ALBANY LIBRARY on January 28, 2010 http://jah.sagepub.comDownloaded from

The potential effects of education, work status, and health status onphysical activity were assessed next. Before turning to the relevant resultsfrom the logistic regression analyses presented in Table 2, we examined howeach of our predictors varied according to physical activity status at baseline.The results of these bivariate analyses are presented in Table 3. At baseline,respondents defined as not engaging in regular vigorous activity were slightlyolder (59.43 vs. 59.32 years) and less well educated (11.90 vs. 12.39 years)than respondents performing regular exercise at baseline (p = .07 for bothassociations). Regular physical activity at baseline was associated morestrongly with other predictors. For instance, participation in regular physical
Shaw, Spokane / Education Level and Physical Activity Changes 777
Table 3Bivariate Associations Between Physical Activity
and Predictor Variables at Baseline
Vigorous Physical Activity ≥ 3 Times per Week
Predictor Yes No p
Gender (%) .000a
Male 56.2 43.8Female 46.5 53.5
Race (%) .000a
White 52.7 47.3Non-White 44.0 56.0
Work status (%) .000a
Working for pay 57.0 43.0Not working for pay 42.9 57.1
Marital status (%) .000a
Married 53.0 47.0Not married 45.7 54.3
Attrition (< 4 waves of data) (%) .004a
Yes 47.6 52.4No 51.7 48.3
Mean age 59.32 59.43 .07b
Mean education (years) 12.39 11.90 .07b
Mean # of chronic conditions 1.16 1.59 .03b
Mean functional limitations 0.09 0.33 .02b
Mean CESD score 0.93 1.62 .04b
Note: CESD = Center for Epidemiologic Studies Depression Scale.a. p value for chi-square test comparing prevalence of physical activity by predictor.b. p value for independent-samples t test comparing means between “yes” and “no” physicalactivity groups.
at SUNY ALBANY LIBRARY on January 28, 2010 http://jah.sagepub.comDownloaded from
activity was more common among males than females (56.2% vs. 46.5%,p ≤ .001), Whites than non-Whites (52.7% vs. 44.0%, p ≤ .001), workersthan nonworkers (57.0% vs. 42.9%, p ≤ .001), and married than nonmarriedrespondents (53.0% vs. 45.7%, p ≤ .001). Furthermore, respondents engag-ing in regular physical activity had fewer chronic conditions (1.16 vs. 1.59,p ≤ .05), functional limitations (0.09 vs. 0.33, p ≤ .05), and depressivesymptoms (0.93 vs. 1.62, p ≤ .05) than did less active respondents. Finally,this table also shows that respondents who remained in the study for all fourwaves of data collection had higher rates of physical activity at baselinethan did those who dropped out (51.7% vs. 47.6%, p = .004).
In the next stages of analyses, these associations were examined in amultivariate and time-varying context, as shown in Models 2 and 3 of Table 2.Model 2 shows the extent to which education level was associated with boththe odds of engaging in regular physical activity and age-related changes in
778 Journal of Aging and Health
0
0.1
0.2
0.3
0.4
0.5
0.6
0.7
55 57 59 61 63 65 67 69 71
Age
Pred
icte
d pr
obab
ility
Low Ed High Ed
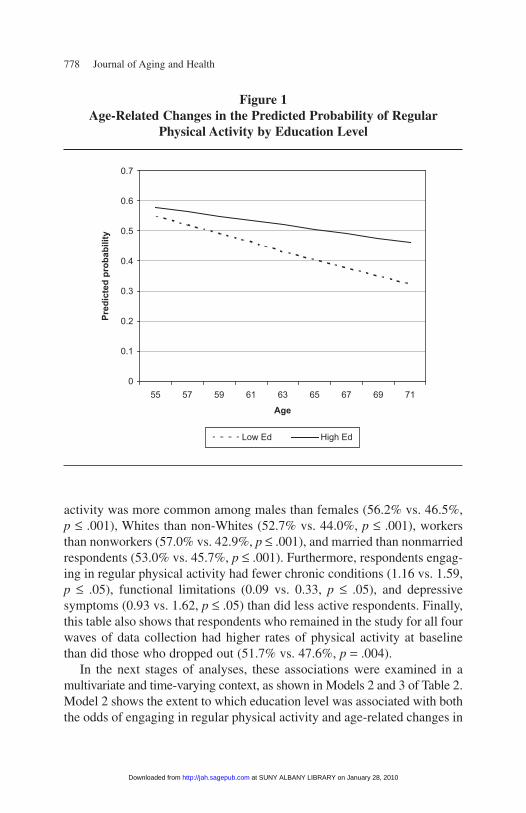
Figure 1Age-Related Changes in the Predicted Probability of Regular
Physical Activity by Education Level
at SUNY ALBANY LIBRARY on January 28, 2010 http://jah.sagepub.comDownloaded from

the odds of physical activity participation. These estimates suggest that theodds of engaging in physical activity at any time during this study werehigher for individuals with high levels of education compared to individu-als with less education (OR = 1.176, 95% CI = 1.137, 1.216). Furthermore,the results of this model show that education level moderated the associa-tion between age and physical activity. Specifically, the positive coefficientof the multiplicative term education × age (b = 0.056, p ≤ .001) suggeststhat the inverse association between age and physical activity became weakeras education level increased. The predicted relationship among physicalactivity, age, and education level is presented in Figure 1. As this figureshows, the age-related decline in physical activity was not as steep amongthe highly educated compared to the less educated. As a result, educationdisparities in physical activity widened with increasing age.
Finally, the third model shown in Table 2 examines the degree to whichother time-varying predictors were associated with physical activity as wellas the degree to which these associations varied according to education level.The findings presented here show that all of the lagged time-varying predic-tors were significantly associated with physical activity. For example, chronicconditions (OR = 0.826, 95% CI = 0.802, 0.852), functional limitations(OR = 0.646, 95% CI = 0.605, 0.691), and depressive symptoms (OR = 0.893,95% CI = 0.871, 0.916) were each associated with decreased odds of physi-cal activity. Working for pay was associated with increased odds of subse-quent physical activity (OR = 1.184, 95% CI = 1.091, 1.285).
In addition, interwave changes, or transitions, in many of the time-varyingpredictors were associated with subsequent physical activity status. Forexample, increases in chronic conditions (OR = 0.878, 95% CI = 0.829,0.930), functional limitations (OR = 0.765, 95% CI = 0.722, 0.811), anddepressive symptoms (OR = 0.925, 95% CI = 0.909, 0.941) were all asso-ciated with decreased odds of engaging in regular physical activity. Joblosses were also negatively associated with physical activity (OR = 0.894,95% CI = 0.813, 0.982), whereas job gains were positively associated withphysical activity (OR = 1.229, 95% CI = 1.069, 1.412).
The multiplicative terms in Table 2 provide information about the degreeto which health and work status factors may affect physical activity at dif-ferent levels of education. For instance, the interaction between educationand lagged work status (b = –0.322, p ≤ .001) indicates that the associationbetween employment status and physical activity varied by level of educa-tion. In fact, as shown in Figure 2, this coefficient indicates that at lowerthan average levels of education, employment was positively associatedwith physical activity, whereas at higher than average levels of education,
Shaw, Spokane / Education Level and Physical Activity Changes 779
at SUNY ALBANY LIBRARY on January 28, 2010 http://jah.sagepub.comDownloaded from

780 Journal of Aging and Health
0
0.1
0.2
0.3
0.4
0.5
0.6
Working Not Working
Pred
icte
d Pr
obab
ility
Low EdHigh Ed
0
0.1
0.2
0.3
0.4
0.5
0.6
0 1 2
Count of Chronic Conditions
Pred
icte
d Pr
obab
ility
Low EdHigh Ed
0
0.1
0.2
0.3
0.4
0.5
0.6
No Llimitations One Limitation
Functional Status
Pred
icte
d Pr
obab
ility
Low EdHigh Ed
Figure 2Education Differences in the Predicted Probability of Regular Physical
Activity by Work, Health, and Functional Status, 1996 to 2002
at SUNY ALBANY LIBRARY on January 28, 2010 http://jah.sagepub.comDownloaded from
employment became negatively associated with physical activity. In addi-tion, the negative interactions between education and chronic conditions(b = –0.046, p ≤ .01) and functional limitations (b = –0.110, p ≤ .001) indicatethat the negative association between health problems and physical activitywas particularly strong among individuals with high levels of education. Asshown in Figure 2, when also considering education differences in the inter-cept of physical activity, these negative interactions mean that highly educatedindividuals are likely to engage in physical activity at higher rates than lesseducated individuals until health or functional limitations arise.
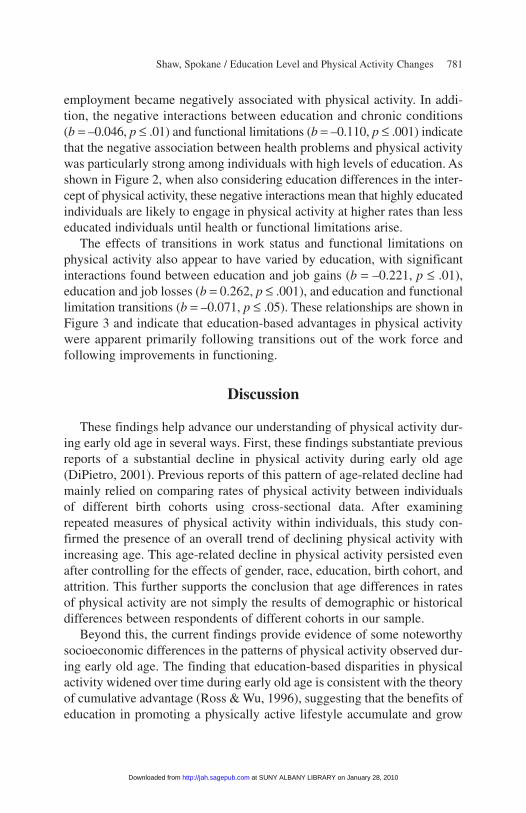
The effects of transitions in work status and functional limitations onphysical activity also appear to have varied by education, with significantinteractions found between education and job gains (b = –0.221, p ≤ .01),education and job losses (b = 0.262, p ≤ .001), and education and functionallimitation transitions (b = –0.071, p ≤ .05). These relationships are shown inFigure 3 and indicate that education-based advantages in physical activitywere apparent primarily following transitions out of the work force andfollowing improvements in functioning.
Discussion
These findings help advance our understanding of physical activity dur-ing early old age in several ways. First, these findings substantiate previousreports of a substantial decline in physical activity during early old age(DiPietro, 2001). Previous reports of this pattern of age-related decline hadmainly relied on comparing rates of physical activity between individualsof different birth cohorts using cross-sectional data. After examiningrepeated measures of physical activity within individuals, this study con-firmed the presence of an overall trend of declining physical activity withincreasing age. This age-related decline in physical activity persisted evenafter controlling for the effects of gender, race, education, birth cohort, andattrition. This further supports the conclusion that age differences in ratesof physical activity are not simply the results of demographic or historicaldifferences between respondents of different cohorts in our sample.
Beyond this, the current findings provide evidence of some noteworthysocioeconomic differences in the patterns of physical activity observed dur-ing early old age. The finding that education-based disparities in physicalactivity widened over time during early old age is consistent with the theoryof cumulative advantage (Ross & Wu, 1996), suggesting that the benefits ofeducation in promoting a physically active lifestyle accumulate and grow
Shaw, Spokane / Education Level and Physical Activity Changes 781
at SUNY ALBANY LIBRARY on January 28, 2010 http://jah.sagepub.comDownloaded from
782 Journal of Aging and Health
0
0.1
0.2
0.3
0.4
0.5
0.6
Job Gain Stable Job Loss
Work Transitions
Pred
icte
d Pr
obab
ility
Low EdHigh Ed
0
0.1
0.2
0.3
0.4
0.5
0.6
One fewer limitations One additional limitation
Functional Status Transitions
Pred
icte
d Pr
obab
ility
Low EdHigh Ed
Figure 3Education Differences in the Associations Between InterwaveTransitions in Work and Functional Status and the Predicted
Probability of Regular Physical Activity
at SUNY ALBANY LIBRARY on January 28, 2010 http://jah.sagepub.comDownloaded from

over time. Moreover, these education-based differences in rates of physicalactivity decline contribute to our growing understanding of the relationshipbetween socioeconomic position and physical activity (McNeill, Kreuter, &Subramanian, 2006) and may help explain observations of socioeconomicdisparities in functional disability incidence among older adults (Melzer,Izmirlian, Leveille, & Guralnik, 2001). However, an understanding of thefactors responsible for the growing educational disparities in physical activityis also critical for developing effective physical activity promotion inter-ventions for older adults.
This study provides some preliminary insight into why rates of decline inphysical activity may differ by education level. In particular, the interactionsbetween the health and work status variables and education level suggestthat the contributions of these time-varying factors differ according to edu-cation level. For example, the current findings suggest that working for paywas positively associated with physical activity for low education individu-als but inversely associated with physical activity for highly educatedindividuals. Previous research has shown a positive relationship betweenleisure-time physical activity and education level and an inverse relationshipbetween work-related physical activity and education level among olderadults (He & Baker, 2005; Ransdell & Wells, 1998). The current findingssignificantly advance our understanding of the relationships among educa-tion, work status, and physical activity by examining them over time andmay help explain why individuals with relatively low levels of educationexperienced steeper declines in physical activity during early old age. In par-ticular, the current findings seem to suggest that low education individuals’reliance on employment as a major source of physical activity results in pre-cipitous declines in physical activity as they move through early old age andtransition out of the workforce. In contrast, for individuals with higher lev-els of education, work is not as strongly associated with physical activity andmay in fact detract from it. Thus, when highly educated individuals leave theworkforce, it is unlikely that they are losing their main source of activity andmay actually be freeing up time to engage in leisure-time physical activity.Such a finding has important intervention implications for aging adults withlow levels of education. In particular, these findings suggest that developingand promoting opportunities for physical activity among aging individualswith low levels of education who have recently transitioned out of the for-mal workforce, or who are planning such a transition in the near future,should be a major public health priority.
In addition, the current findings suggest that increases in health prob-lems appear to be particularly salient impediments to physical activity for
Shaw, Spokane / Education Level and Physical Activity Changes 783
at SUNY ALBANY LIBRARY on January 28, 2010 http://jah.sagepub.comDownloaded from

highly educated individuals. These findings appear to be consistent with theage-as-leveler hypothesis (House et al., 1994; Wray et al., 2005). Althoughour findings regarding education differences in age-related changes inphysical activity showed a widening gap in physical activity with increas-ing age, our findings also suggest that this education gap may diminishfollowing the onset of morbidity and disability. In other words, health statusappears to matter more than education level in determining physical activityparticipation. This should signal the need to target individuals at all levelsof SES with interventions promoting physical activity after the onset ofage-related morbidity.
In reviewing the findings from this study, readers should keep in mindsome of the study’s key limitations. For example, the dependent variable,physical activity, is measured with a single survey item, with just tworesponse options (yes or no). This is problematic for several reasons. First,as demonstrated by Mendes de Leon (2007), this artificial dichotomizingof a variable that naturally occurs on a continuum can bias results. Forinstance, according to this measurement strategy, it is possible for individ-uals to change their physical activity frequency by 2 or more days per weekwithout showing change in our measure (e.g., changing from 5 to 3 days perweek). At the same time, other individuals who change from 2 to 3 or from3 to 2 episodes of physical activity per week would show a change in ourmeasure.
Second, like any single-item measure of an outcome, our measure ofphysical activity is subject to random measurement error and, thus, low reli-ability. Although this type of error typically attenuates associations, thusresulting in a conservative estimate of the effects of age on physical activity,future research in this area should strive to employ a more reliable measureof this construct to more accurately represent the relationship between ageand physical activity.
Third, concerns about the content validity of this measure of physicalactivity should be noted. For example, walking is a major form of physicalactivity in later life yet was not included in our measure. On the other hand,other activities that are not always included in measures of physical activity,such as heavy housework and job-related activities, were included in themeasures of physical activity in the HRS survey. Therefore, we advise cautionwhen comparing rates of vigorous physical activity from the current studyto rates from other studies that use different measures of physical activity,such as the BRFSS. In fact, according to the BRFSS, rates of vigorousactivity for individuals aged 55 to 64 and 65 and older are only 21.1% and14.1%, respectively. The rates of vigorous physical activity that we found
784 Journal of Aging and Health
at SUNY ALBANY LIBRARY on January 28, 2010 http://jah.sagepub.comDownloaded from

are more similar to the rates of “moderate or vigorous” physical activityfound in the BRFSS (i.e., 44.8% for ages 55 to 64 and 39.0% for ages 65and older; CDC, 2006).
Finally, a more accurate representation of age-related changes in physicalactivity during early old age could be gained with additional waves of datacollection. Also, whenever possible, the inclusion of several additionalpredictors of physical activity, such as living arrangements and income(Chad et al., 2005), could provide a more precise understanding of the extentto which age, education, and work and health status are associated withphysical activity.
Despite these data limitations, the current study provides an importantset of findings regarding aging and physical activity. It is clear from thisstudy that as physical activity rates decline during later life, the education-based disparities in physical activity apparent in cross-sectional data do notsimply persist but actually increase. Therefore, early old age is a criticalperiod for promoting physical activity. However, in light of current evidencethat some of the contributors to physical activity that decline during thisstage of life vary on the basis of educational attainment, it is also apparentthat different strategies may be needed to promote physical activity forolder adults with different levels of education.
References
Brownson, R. C., Boehmer, T. K., & Luke, D. A. (2004). Declining rates of physical activity inthe United States: What are the contributors? Annual Review of Public Health, 26, 421-443.
Centers for Disease Control and Prevention. (2006). Behavioral Risk Factor SurveillanceSystem Survey data. Atlanta, GA: Author.
Chad, K. E., Reeder, B. A., Harrison, E. L., Ashworth, N. L., Sheppard, S. M., Schultz, S. L.,et al. (2005). Profile of physical activity levels in community-dwelling older adults.Medicine and Science in Sports and Exercise, 37, 1774-1784.
DiPietro, L. (2001). Physical activity in aging: Changes in patterns and their relationship tohealth and function. Journals of Gerontology, 56A, 13-22.
Fries, J. F. (2003). Measuring and monitoring success in compressing morbidity. Annals ofInternal Medicine, 139, 455-459.
Gruenberg, E. (1977). The failure of success. Milbank Quarterly, 55, 3-24.Grzywacz, J. G., & Marks, N. F. (2001). Social inequalities and exercise during adulthood:
Toward an ecological perspective. Journal of Health and Social Behavior, 42, 202-220.He, X. Z., & Baker, D. W. (2005). Differences in leisure-time, household, and work-related
physical activity by race, ethnicity, and education. Journal of General Internal Medicine,20, 259-266.
House, J. S., Lepkowski, M., Kinney, A. M., Mero, R. P., Kessler, R. C., & Herzog, R. A. (1994).The social stratification of aging and health. Journal of Health and Social Behavior, 35,213-234.
Shaw, Spokane / Education Level and Physical Activity Changes 785
at SUNY ALBANY LIBRARY on January 28, 2010 http://jah.sagepub.comDownloaded from
Hox, J. (2002). Multilevel analysis: Techniques and applications. Mahwah, NJ: LawrenceErlbaum.
Juster, F. T., & Suzman, R. (1995). An overview of the Health and Retirement Study. Journalof Human Resources, 30, S7-S56.
Kaplan, M. S., Newsom, J. T., McFarland, B. H., & Lu, L. (2001). Demographic and psychoso-cial correlates of physical activity in late life. American Journal of Preventive Medicine,21, 306-312.
King, A. C., Castro, C., Wilcox, S., Eyler, A. A., Sallis, J. F., & Brownson, R. C. (2000).Personal and environmental factors associated with physical inactivity among differentracial-ethnic groups of U.S. middle aged and older-aged women. Health Psychology, 19,354-364.
Kubzansky, L. D., Berkman, L. F., Glass, T. G., & Seeman, T. E. (1998). Is educational attainmentassociated with shared determinants of health in the elderly? Findings from the MacArthurStudies of Successful Aging. Psychosomatic Medicine, 60, 578-585.
Liang, J., Shaw, B. A., Krause, N., Bennett, J. M., Blaum, C., Kobayashi, E., et al. (2003).Changes in functional status among older adults in Japan: Successful and usual aging.Psychology and Aging, 18, 684-695.
Liang, J., Shaw, B. A., Krause, N., Bennett, J. M., Kobayashi, E., Fukaya, T., et al. (2005).How does self-assessed health change with age? A study of older adults in Japan. Journalof Gerontology: Social Sciences, 60B, S224-S232.
McAuley, E., Konopack, J. F., Morris, K. S., Motl, R. W., Hu, L., Doerksen, S. E., et al. (2006).Physical activity and functional limitations in older women: Influence of self-efficacy.Journal of Gerontology: Psychological Sciences, 61B, P270-P277.
McGinnis, J. M., & Foege, W. H. (1993). Actual causes of death in the United States. Journalof the American Medical Association, 270, 2207-2212.
McNeill, L. H., Kreuter, M. W., & Subramanian, S. V. (2006). Social environment and physicalactivity: A review of concepts and evidence. Social Science and Medicine, 63, 1011-1022.
Mein, G. K., Shipley, M. J., Hillsdon, M., Ellison, G. T. H., & Marmot, M. G. (2005). Work,retirement and physical activity: Cross-sectional analyses from the Whitehall II Study.European Journal of Public Health, 15, 317-322.
Melzer, D., Izmirlian, G., Leveille, S. G., & Guralnik, J. M. (2001). Educational differences inthe prevalence of mobility disability in old age: The dynamics of incidence, mortality, andrecovery. Journal of Gerontology: Social Sciences, 56, S294-S301.
Mendes de Leon, C. F. (2007). Aging and the elapse of time: A comment on the analysis ofchange. Journal of Gerontology: Social Sciences, 62B, S198-S202.
Mirowsky, J., & Ross, C. E. (2003). Education, social status, and health. New York: Aldine.Mokdad, A. H., Marks, J. S., Stroup, D. F., & Gerberding, J. L. (2004). Actual causes of death
in the United States, 2000. Journal of the American Medical Association, 291, 1238-1245.Nelson, E. A., & Dannefer, D. (1992). Aged heterogeneity: Fact or fiction? The fate of diversity
in gerontological research. The Gerontologist, 32, 17-23.Radloff, L. S. (1977). The CES-D scale: A self-report depression scale for research in the
general population. Applied Psychological Measurement, 1, 385-401.RAND Center for the Study of Aging. (2004, April). RAND HRS data (Version G). Santa
Monica, CA: Author.Ransdell, L. B., & Wells, C. L. (1998). Physical activity in urban White, African-American, and
Mexican-American women. Medicine and Science in Sports and Exercise, 30, 1608-1615.Ross, C. W., & Wu, C. L. (1996). Education, age, and the cumulative advantage in health.
Journal of Health and Social Behavior, 37, 104-120.
786 Journal of Aging and Health
at SUNY ALBANY LIBRARY on January 28, 2010 http://jah.sagepub.comDownloaded from

Shaw, B. A., Krause, N., Liang, J., & Bennett, J. (2007). Tracking changes in social relationsthroughout late life. Journals of Gerontology; Social Sciences, 62B, S90-S99.
Slingerland, A. S., van Lenthe, F. J., Jukema, J. W., Kamphius, C. B. M., Looman, C., Giskes,K., et al. (2007). Aging, retirement, and changes in physical activity: Prospective cohortfindings from the GLOBE study. American Journal of Epidemiology, 165, 1356-1363.
U.S. Department of Health & Human Services. (1996). Physical activity and health: A reportof the surgeon general. Atlanta, GA: Author.
Wray, L. A., Alwin, D. F., & McCammon, R. J. (2005). Social status and risky health behaviors:Results from the Health and Retirement Study. Journals of Gerontology: Psychologicaland Social Sciences, 60, S85-S92.
Wray, L. A., Herzog, A. R., Willis, R. J., & Wallace, R. B. (1998). The impact of educationand heart attack on smoking cessation among middle-aged adults. Journal of Health andSocial Behavior, 39, 271-294.
Yang, Y., & George, L. K. (2005). Functional disability, disability transitions, and depressivesymptoms in late life. Journal of Aging and Health, 17, 263-292.
Shaw, Spokane / Education Level and Physical Activity Changes 787
at SUNY ALBANY LIBRARY on January 28, 2010 http://jah.sagepub.comDownloaded from