journal of ambient intelligence and smart environments 1...
TRANSCRIPT

Coping with multiple residents in a smart
environment
Aaron S. Crandall∗
and Diane J. Cook
School of Electrical Engineering and Computer Science, Washington State University, Box 642752, Pullman, WA 99163, USA, E-mail: [email protected]
Abstract. Smart environment research has resulted in many useful tools for modeling, monitoring, and adapting to a single
resident. However, many of these tools are not equipped for coping with multiple residents in the same environment simulta-
neously. In this paper we investigate a first step in coping with multiple residents, that of attributing sensor events to
individuals in a multi-resident environment. We discuss approaches that can be used to achieve this goal and we evaluate our
implementations in the context of two physical smart environment testbeds. We also explore how learning resident identifiers
can aid in performing other analyses on smart environment sensor data such as activity recognition.
Keywords: Multiple residents, smart environments, sensor event labeling, naïve Bayes classifier, Markov models
∗ Corresponding author. E-mail: [email protected].
1. Introduction
With the introduction of more complex ambient
intelligence and smart environment systems, the pos-
sibilities for customizing system behavior have in-
creased dramatically. Significant headway has been
made in tracking individuals through spaces using
wireless devices [1,18,22] and in recognizing activi-
ties within smart spaces based on video data
[6,10,23], motion sensor data [13,27], or other
sources of information [16,18]. However, much of
the theory and most of the algorithms are designed to
handle one individual in the space at a time. Passive
tracking, activity recognition, event prediction, and
behavior automation becomes significantly more
difficult when there are multiple residents in the en-
vironment.
The long-term goal of our research project is to
model, monitor, and automate resident activities in
multiple-resident smart environments. There are sim-
plifications that would ease the complexity of coping
with multiple residents in a single space. For exam-
ple, we could ask residents to wear devices that en-
able tracking them through the space [9,28]. This
particular solution is impractical for situations in
which individuals do not want to wear the device,
forget to wear the device, or enter and leave the envi-
ronment frequently. Similarly, capturing resident
behavior with video cameras has been shown to aid
in understanding resident behavior even in group
settings [14]. However, surveys with target popula-
tions have revealed that many individuals are adverse
to embedding cameras in their personal environments
[10]. In addition, processing the video is computa-
tionally expensive and relies upon first tracking the
resident before the correct video data can be captured
and analyzed [24]. As a result, our aim is to identify
the individuals and their activities in a smart envi-
ronment using only embedded, passive sensors.
These types of sensors are unobtrusive and have been
correlated with high technology acceptance rates for
older adults [5].
Our first step in achieving our long-term goal is to
design an algorithm that learns a mapping from sen-
sor events to the resident that is responsible for trig-
gering the event. This mapping provides valuable
information that will allow our algorithms to learn
patterns of resident behaviors, recognize current ac-
tivities in multi-resident settings, identify the indi-
viduals currently in the environment, monitor their
Journal of Ambient Intelligence and Smart Environments 1 (2009) 1–12DOI 10.3233/AIS-2009-0041IOS Press
1876-1364/09/$17.00 © 2009 – IOS Press and the authors. All rights reserved
1

well-being, and automate their interactions with the
environment. Previous work [3] does give some indi-
cation that this is an important first step in coping
with multiple residents.
To date, the focus of multi-resident smart envi-
ronment research has been on analyzing global be-
haviors and preferences to keep a group of inhabi-
tants satisfied [22]. In contrast, our research is fo-
cused on identifying an individual and modeling their
behaviors in the context of a multi-resident space.
This technology will bring ambient intelligence and
smart environment technologies to group environ-
ments such as workplaces, group homes, and private
homes that house multiple residents.
2. Smart environment testbeds
We will test our multiple-resident sensor labeling
algorithms in two physical smart environment test-
beds: a smart apartment and a smart workplace.
These testbeds are located on the Washington State
University campus and are maintained as part of our
ongoing CASAS smart home project [21]. As shown
in Fig. 1, the smart apartment testbed includes three
bedrooms, one bathroom, a kitchen, and a liv-
ing/dining room. The apartment is equipped with
motion sensors (as shown in Fig. 2) distributed ap-
proximately 1 meter apart throughout the space. In
addition, we have also installed sensors to provide
ambient temperature readings and custom-built ana-
log sensors to provide readings for hot water, cold
Fig. 1. The smart apartment testbed. Sensors in the apartment monitor motion (M), temperature (T), water (W), burner (B), telephone (P), and item (I) use.
Fig. 2. CASAS sensors: motion detector and Insteon light switch.
A.S. Crandall and D.J. Cook / Coping with multiple residents in a smart environment2

water, and stove burner use. Voice over IP using As-
terisk software [1] captures phone usage and contact
switch sensors allow us to monitor usage of key
items including a cooking pot, a medicine container,
and the phone book. Lastly, Insteon power controls
and switches are used to monitor and control the
lighting in the space. Sensor data is captured using a
sensor network that was designed in-house and is
stored in a SQL database. Our middleware uses a
XMPP-based publish-subscribe protocol as a light-
weight platform and language-independent method to
push data to client tools (e.g., the data mining [8],
prediction [6], multiple-resident analysis, and activity
recognition algorithms [4]) with minimal overhead
and maximal flexibility. To maintain privacy we re-
move participant names and identifying information
and encrypt collected data before it is transmitted
over the network.
In addition, we have equipped an on-campus smart
workplace environment, shown in Fig. 3. This is a
lab that is organized into four cubicles with desks and
computers, a server area, a postdoc office, a meeting
area, a lounge, and a kitchen. Like the apartment, the
lab is equipped with motion sensors placed approxi-
mately 1 meter apart throughout the space. In addi-
tion, powerline controllers are used to operate all of
the lights in the room and manual interactions with
these lights are captured by the environment. Finally,
magnetic open/closed sensors record door openings
and closings in the space. Residents in this space
have unique spatial areas which they occupy when
they work in the lab.
The data gathered by CASAS is represented by the
following features:
1. Date
2. Time
Meeting
area
Kitchen Postdoc
office
Cubicle
Cubicle
Cubicle
Fig. 3. WSU smart workplace testbed.
A.S. Crandall and D.J. Cook / Coping with multiple residents in a smart environment 3

3. Sensor serial number
4. Event message
5. Annotated class
The first four fields are generated automatically by
the CASAS middleware. The annotated class field is
the target feature for our learning problem and repre-
sents an identifier for the resident to which the other
fields can be mapped. Sample data collected in the
smart workplace is shown in Table 1.
3. Identifying the resident from a sensor event
In order to map a sensor event to the resident that
triggered the event, we learn a mapping function us-
ing a supervised learning approach. This approach to
identifying residents builds on the assumption that
we do not need to tag individuals in order to identify
them, nor do we need to necessarily track them
through the space. Instead, each resident is unique in
terms of their behaviors and the actions they perform
in the space. As a result, if we have enough historical
data that associates sensor event information with the
resident that triggered the event, we can learn a map-
ping from sensor event features to resident ID and
use the mapping to identify the resident that triggered
future sensor events. Once the ID of the resident is
determined for a sensor even then we can answer
additional questions such as which residents are cur-
rently in the space, what is the total number of indi-
viduals in the space, and what are the activities that
the residents are currently performing.
There are many supervised learning algorithms
that could be employed for this particular problem.
Because the data is plentiful and has a spa-
tial/temporal component, we consider two learning
algorithms: a naïve Bayes classifier and a Markov
model-based classifier. These types of classifiers
have been used with good effect for other smart
home problems [17,25]. While the two classifier al-
gorithms make use of the same data to accomplish
the learning goal, they employ very different strate-
gies for identifying a mapping between the four fea-
tures of a sensor event and the resident ID.
3.1. Identifying the resident using a naïve Bayes classifier
In the first approach, we train a naïve Bayes classi-
fier to identify the resident based on the features of
the sensor event.
A naïve Bayes classifier uses the relative fre-
quency of data points, their feature descriptors, and
their labels to learn a mapping from a data point de-
scription to a classification label. The resident label,
R, is calculated as
( | ) ( )arg max ( | )
( )r R
P D r P rP r D
P D∈
=.
In this calculation D represents the feature values.
The denominator will be the same for all values of r
so we calculate only the numerator values, for which
P(r) is estimated by the proportion of cases for which
the activity label is a (in our case each participant
performed all five activities so there is a uniform
probability over all activity values) and P(D | r) is
calculated as the probability of the feature value
combination for the particular observed activity, or
( | )i iP d rΠ .
We could attempt to use only features 3 and 4
(sensor ID and message) as input to the learning
problem. The remaining features, date and time, are
more difficult to use. Both of these features have a
very large number of possible values, so we need to
consider effective methods for abstracting date and
time information into a smaller set of possible values.
The different feature choices that could be considered
for these values, as shown in Table 2, divide up the
data in different ways and capture resident behaviors
with varying degrees of accuracy. We test the accu-
racy of each of these time representations when we
evaluate our learning algorithms.
The statistical calculations of a naïve Bayes classi-
fier offers the benefit of fast learning but lacks an
effective approach to reasoning about context in an
event stream, which is valuable for this learning
problem. In order to capture this context we also con-
sider a second approach to learning resident IDs, as
described in the next section.
Table 1 Subset of data used for classifier training.
Date Time Serial Message ID
2007-12-21 16:41:41 07.70.eb:1 ON Res1
2007-12-21 16:44:36 07.70.eb:1 OFF Res1
2007-12-24 08:13:50 e9.63.a7:5 ON Res2
2007-12-24 14:31:30 e9.63.a7:5 OFF Res2
Table 2 Alternative time-based feature values
Type # Feature Type Example
1 Plain Motion01#ON
2 Hour of day Motion01#ON#16
3 Day of week Motion01#ON#Friday
4 Part of week Motion01#ON#Weekday
5 Part of day Motion01#ON#Afternoon
A.S. Crandall and D.J. Cook / Coping with multiple residents in a smart environment4

3.2. Identifying the resident using a Markov model
In our second approach we represent resident be-
haviors using Markov models. A Markov Model
(MM) is a statistical model of a dynamic system. A
MM models the system using a finite set of states,
each of which is associated with a multidimensional
probability distribution over a set of parameters. The
system is assumed to be a Markov process, so the
current state depends on a finite history of previous
states (in our case, the current state depends only on
the previous state). Transitions between states are
governed by transition probabilities. For any given
state a set of observations can be generated according
to the associated probability distribution.
Because our goal is to identify the activity that
corresponds to a sequence of observed sensor events,
we generate one Markov model for each resident that
we are observing. We use the training data to learn
the transition probabilities between states for the cor-
responding activity model and to learn probability
distributions for the feature values of each state in the
model.
To label a sequence of sensor event observations
with the corresponding resident ID, we compute R as
1.. 1..argmax ( | ) ( | ) ( )
r R t t
P r e P e r P r∈
= . P(r) is esti-
mated as before, while 1..
( | )t
P e r is the result of
computing the sum, over all states, S, in model r, of
the likelihood of being in each state after processing
a sequence of sensor events e1..t that leads up to the
current time, t. The likelihood of being in state s S∈
is updated after each sensor event ej is processed us-
ing the formula found in the equation below:
11.. 1 1 1.. 1
( | ) ( | ) ( | ) ( | )j
j j j j j j j js
P S e P e S P S s P s e−
− − −
= ∑
The probability is updated based on the probability
of transitioning from any previous state to the current
state (the first term of the summation) and the prob-
ability of being in the previous state given the sensor
event sequence that led up to event ej. We selected Markov models for our second ap-
proach because this representation encapsulates addi-
tional contextual information. As a result, the context
of the sensor event is used when labeling the event
with a resident ID. By adding transitions between
states in the model, the spatial and temporal relation-
ships between sensor events are captured. Thus, by
taking more of both the physical and the temporal
information into account, we hypothesize that our
algorithms will label events more accurately even
when the number of residents increases.
4. Evaluating performance of the learning
algorithms
To determine the effectiveness of our learning al-
gorithms at identifying residents from sensor event
information, we evaluated the naïve Bayes classifier
and the Markov model classifier using real data col-
lected in our smart environment testbeds.
4.1. The data sets
The first dataset, which we label the Workplace
dataset, was gathered over the course of three weeks
in our smart workplace environment. During this
time there were only three residents working in the
space, and we asked each of them to log their pres-
ence by pushing a unique button on a pinpad when
they entered and left the space. In order to generate
training data for the learning algorithms, this first
database was filtered to only use sensor events during
the times when there was a single resident in the en-
vironment. This way we were ensured that each sen-
sor event would be correctly labeled with the corre-
sponding resident ID. Over 6,000 unique sensor
events were captured, annotated, and used as data for
our evaluation. Table 1 shows a portion of the data
that was captured during this time.
For the second dataset, which we label the Apart-ment dataset, we collected sensor data in our smart
apartment while two residents lived there. This data-
set assesses the ability of our algorithms to identify
residents even when the residents occupy the space
simultaneously, which is a more challenging situa-
tion. Each resident occupied a separate bedroom but
regularly shared the downstairs common space.
Unlike the previous dataset, we made no constraints
on resident activities and did not ask them to log their
presence. Instead, our team annotated the sensor data
after it was collected and confirmed that the annota-
tion with the residents to ensure accuracy of the la-
bels. The result was a corpus of over 20,000 unique
sensor events collected over a 5 day period.
The third and final dataset, which we label the Ac-tivity Tracking dataset, again contains sensor events
collected over a period of eight weeks while two
residents (different than the Apartment dataset) lived
in the smart apartment. As with the second dataset
we collected this activity to see how well we could
map sensor events to specific residents. However, we
additionally used this dataset to determine how well
we could recognize activities that were being per-
formed by the residents as they performed their nor-
A.S. Crandall and D.J. Cook / Coping with multiple residents in a smart environment 5

mal daily routines. We perform this activity recogni-
tion first without resident identifier information and
second when the data is enhanced by adding the auto-
matically-labeled resident identifier to each sensor
event. This way we determine how well we can rec-
ognize residents and the degree to which this infor-
mation aids in other multi-resident tasks such as ac-
tivity recognition.
4.2. Naïve Bayes classifier performance on workplace data
Figure 4 shows the 3-fold cross validation accu-
racy of our naïve Bayesian classifier (NBC) for the
three residents we monitored in the smart workplace.
This figure graphs not only the classification accu-
racy for each target value but also the false positive
rate.
Note that the classification accuracy is quite high
for the Res 1 case, but so is the false positive rate.
This is because Resident 1 was responsible for most
(approximately 62%) of the sensor events contained
in the data set. As a result, the apriori probability that
any sensor event should be attributed to Resident 1 is
high and the naïve Bayes classifier incorrectly attrib-
utes Resident 2 and 3 events to Resident 1 as well.
On the other hand, while Resident 3 has a much
lower classification accuracy, it also has a lower false
positive rate.
In order to address these classification errors, we
added more descriptive features to our data set. In
particular, we added the date and time of each sensor
event, as shown in Table 2. The classifier can now
use time of day or day of week information to differ-
entiate between the behaviors of the various resi-
dents. For example, Resident 1 always arrived early
in the day, while Resident 2 often stayed in the
workplace late into the evening. Finding the correct
features to use for this kind of behavior modeling can
be accomplished by balancing the accuracy rate with
the false positive rate.
The choice of features descriptors to use is quite
important and has a dramatic effect on the classifica-
tion accuracy. Looking at accuracy rate for alterna-
tive feature descriptors, Fig. 5 shows that the hour-
of-day descriptor significantly improves classifica-
tion performance. Additionally, by using hour-of-
day, the false positive rate drops dramatically, as
shown in Fig. 6. We thus use the hour-of-day feature
in the remainder of our experiments. With a classifi-
cation accuracy of over 93% and a false positive rate
below 7% (see Fig. 7), smart environments that rely
on this classifier can have a high degree of confi-
dence in the resident identification that this algorithm
provides.
Fig. 4. NBC classification accuracy for Workplace dataset.
Fig. 5. Average NBC accuracy rates by feature type for Workplace dataset.
Fig. 6. Average NBC false positive rates by feature type for Work-place dataset.
A.S. Crandall and D.J. Cook / Coping with multiple residents in a smart environment6

4.3. Enhancing performance with time deltas
Adding new features to our data set did improve
the classification accuracy of our algorithm. How-
ever, the results showed that there is still room for
improvement. We hypothesize that one reason for the
remaining inaccuracies is the type of sensor events
we are classifying. Many motion sensor events occur
when individuals are moving through the space to get
to a destination, and do not differentiate well between
residents in the space. On the other hand, when a
resident is in a single location for a lengthy period,
that location is a type of destination for the resident.
They are likely performing an activity of interest in
that location. As a result, only the motion sensor data
that corresponds to these destination events should be
used for resident classification.
To validate our hypothesis, the data set was culled
of all extra sensor events. Specifically, when the
same sensor generates multiple readings in a row we
keep only the first reading of the series. These multi-
ple redundant readings are likely due to small move-
ments occurring repeatedly within a single small area
of the workplace. Replacing the entire sequence with
a single sensor event allows the one event to repre-
sent the entire activity taking place at that location.
Starting from this reduced set of events, we calcu-
lated each time delta, or the amount of time that has
elapsed since the preceding event. The chart shown
in Fig. 7 graphs counts of the number of seconds an
individual spent at any one motion sensor location in
the smart workplace before moving to a new loca-
tion. The average time spent at any location was 35
seconds, with a standard deviation of 10 seconds.
The fact that graph shows an exponential decay as
the amount of time increases provides evidence to
support our hypothesis that sensor events occurring at
destination locations are the most valuable for identi-
fying residents.
Using the insights gained from the time delta dis-
tribution, we removed from the dataset all motion
sensor events whose time deltas fell below two stan-
dard deviations from the mean. We repeated our per-
formance evaluation with this reduced dataset.
The accuracy and false positive rate of the NBC
classifier improved substantially with this new data-
set. This is attributed to the fact that motion sensors
in shared spaces or walkways will typically generate
events with small time deltas. Because these sensor
events are also the ones with the most false positive
rates in the original experiment, removing the corre-
sponding sensor events will likely improve the over-
all performance of the classifier. Note that with this
filtered-data approach, sensor events with short dura-
tions will not be assigned a mapping to a specific
resident. However, by combining this algorithm with
a tool that tracks inhabitants through the space be-
tween these events [12], we can get very high accu-
racy rates with less effort.
In this second experiment, our naïve Bayes classi-
fier yielded accuracy rates over 98% with false posi-
tive rates landing as low as 1%. Again there are per-
formance differences with different feature choices,
as shown in Figs 8 and 9. Once again the hour-of-day
feature offers the best results, as it gives the naïve
Bayes classifier information that successfully differ-
entiates between resident behaviors.
Fig. 7. Counts of time durations that an individual spends at any sensor location in the Workplace dataset.
Fig. 8. NBC classification accuracy results for Workplace dataset filtered by time deltas.
A.S. Crandall and D.J. Cook / Coping with multiple residents in a smart environment 7

4.4. Markov model classifier performance on workplace data
Next, we want to compute classification accuracy
for our Markov model-based learning algorithm and
compare it with the results using the naïve Bayes
classifier. As with the naïve Bayes classifier, there
are decisions to make that influence the performance
of the Markov model. The primary decision is the
event sequence size to provide to the model. As de-
scribed in Section 3.2, a series of events is provided
as input to the model in order to output a resident
identifier for the most recent event at time t. Because
the series size should be the same for each calcula-
tion, we do not provide events starting at the begin-
ning of the data collection for each label we generate.
Instead, we provide a fixed number of events, or
event window size, that occur immediately prior to
and include event t. Figure 10 shows the classification results that re-
sult from alternative window sizes. As the figure
shows, the window size does have an effect on classi-
fication accuracy. Because a window size of 25 per-
forms best for the Workplace dataset we use it for the
remainder of our experiments. In general, the algo-
rithm can sample different window sizes for a new
dataset and use the one that performs best on the
sample set.
The most direct comparison between these two
approaches is to compare accuracies using the
“plain” feature type (see Table 2) for the naïve Bayes
classifier and the 25-event window size for the
Markov model. In this case the NBC algorithms re-
sults in 76% classification accuracy, in comparison
with 84% classification accuracy resulting from us-
ing the Markov model. The improved accuracy for
the Markov model is most likely due to the implicit
spatial and temporal relationships that are encoded
between sensor events. On the other hand, we do not
apply our data filtering steps to the Markov model.
We keep all of the events for use with the Markov
model because even short events provide valuable
contextual information for the model. Removing
these events renders the classifier unusable, as there
is too little evidence to process.
4.5. Classifier using hidden Markov model
The original Markov models that we designed did
not employ hidden nodes. As a result, we had to learn
a separate model for each resident. To address this
issue we next designed a hidden Markov model in
which a single model is used to encapsulate all of the
residents and the sensor events they trigger.
Using the hidden Markov model, hidden nodes
represent system states that are abstract and cannot
be directly observed. In contrast, observable nodes
represent system states that can be directly observed.
Vertical transition probabilities between hidden and
observed nodes are learned from training data, as are
horizontal transition probabilities between hidden
nodes.
In our model, the hidden nodes represent smart
environment residents and we insert a hidden node
for each resident that we are modeling. The observ-
able nodes are associated with probability distribu-
tions over feature values including the motion sensor
ID and the sensor message. We can then use the
Viterbi algorithm [26] to calculate the most likely
sequence of hidden states that corresponds to the
Fig. 9. NBC false positive rates for Workplace dataset filtered by time deltas.
Fig. 10. Markov model classification accuracy on Workplace dataset by event window size.
A.S. Crandall and D.J. Cook / Coping with multiple residents in a smart environment8
observed sensor sequence. This sequence of hidden
states provides us with the highest-likelihood resident
IDs that correspond to each sensor event in the se-
quence.
Using our hidden Markov model, the resulting
classifier performance with an event window of 25 is
92.4%. This model clearly outperforms the earlier
Markov chain approach. However, while the model
represents temporal sequence information, the dura-
tion of events (relative time since the previous event)
are not captured. This information provides even
greater insight on the type of activity or behavior that
is being reflected in the data.
To address this issue, we add a time value to the
feature list associated with each observable state. The
time value corresponds to the amount of time, in mil-
liseconds, that elapsed since the previous sensor
event. Because the possible number of time values is
inordinately large, we discretize the time values into
three equal-size ranges. Testing our hidden Markov
model with time values on the Workplace data, we
see a resulting classification accuracy of 95.3%. This
approach yields the best results of all of our Markov
model classifiers and provides an approach that
should effectively scale to an arbitrary number of
residents.
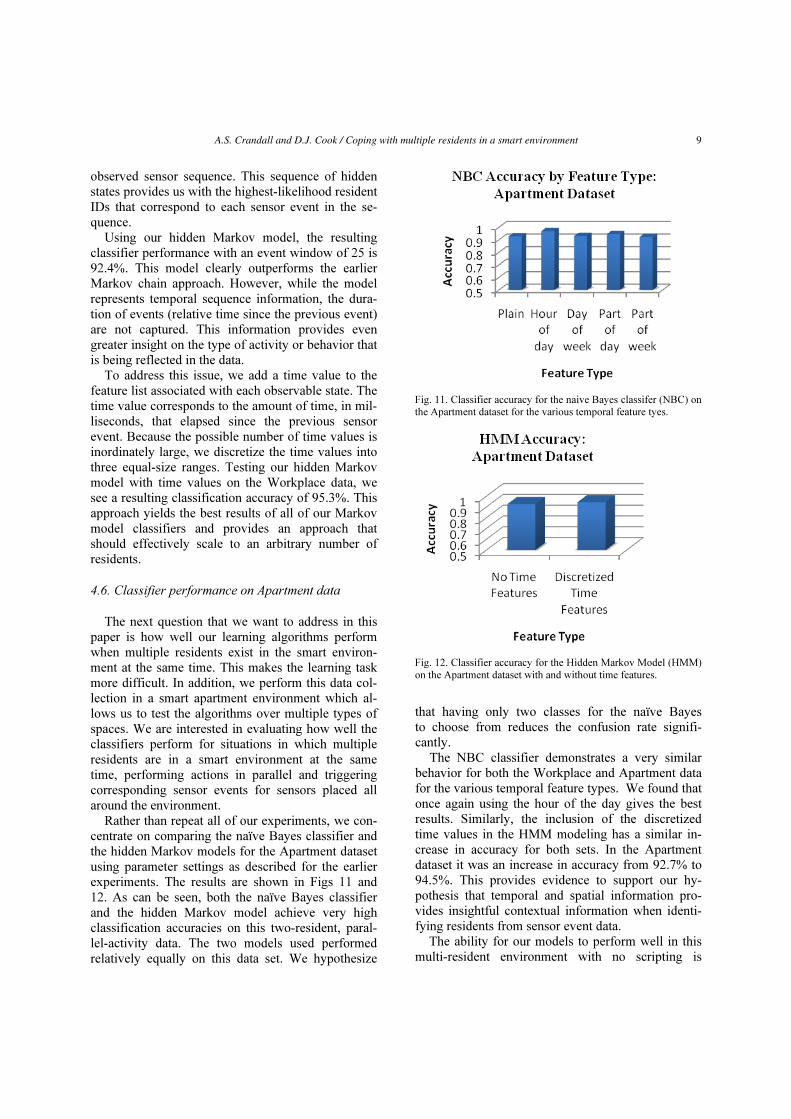
4.6. Classifier performance on Apartment data
The next question that we want to address in this
paper is how well our learning algorithms perform
when multiple residents exist in the smart environ-
ment at the same time. This makes the learning task
more difficult. In addition, we perform this data col-
lection in a smart apartment environment which al-
lows us to test the algorithms over multiple types of
spaces. We are interested in evaluating how well the
classifiers perform for situations in which multiple
residents are in a smart environment at the same
time, performing actions in parallel and triggering
corresponding sensor events for sensors placed all
around the environment.
Rather than repeat all of our experiments, we con-
centrate on comparing the naïve Bayes classifier and
the hidden Markov models for the Apartment dataset
using parameter settings as described for the earlier
experiments. The results are shown in Figs 11 and
12. As can be seen, both the naïve Bayes classifier
and the hidden Markov model achieve very high
classification accuracies on this two-resident, paral-
lel-activity data. The two models used performed
relatively equally on this data set. We hypothesize
that having only two classes for the naïve Bayes
to choose from reduces the confusion rate signifi-
cantly.
The NBC classifier demonstrates a very similar
behavior for both the Workplace and Apartment data
for the various temporal feature types. We found that
once again using the hour of the day gives the best
results. Similarly, the inclusion of the discretized
time values in the HMM modeling has a similar in-
crease in accuracy for both sets. In the Apartment
dataset it was an increase in accuracy from 92.7% to
94.5%. This provides evidence to support our hy-
pothesis that temporal and spatial information pro-
vides insightful contextual information when identi-
fying residents from sensor event data.
The ability for our models to perform well in this
multi-resident environment with no scripting is
Fig. 11. Classifier accuracy for the naive Bayes classifer (NBC) on the Apartment dataset for the various temporal feature tyes.
Fig. 12. Classifier accuracy for the Hidden Markov Model (HMM) on the Apartment dataset with and without time features.
A.S. Crandall and D.J. Cook / Coping with multiple residents in a smart environment 9

encouraging. These kinds of classifiers should be
able to provide better tools for discerning an individ-
ual’s activity history, even in complex multi-resident
environments.
4.7. Classifier performance on Activity Tracking data
The final question that we want to address in this
paper is how well our learning algorithms aid in per-
forming other types of smart environment tasks. Spe-
cifically, we apply our naïve Bayes classifier to the
Activity Tracking dataset to determine how well the
algorithm can correct map sensor events to resident
identifiers. In addition, we use a separate naïve Bayes
classifier to identify which of 14 possible activities
the residents are currently performing. We evaluate
the performance of activity recognition with and
without the learned resident identification to deter-
mine the extent to which the learned resident infor-
mation actually improves performance of our activity
recognition algorithm.
Figure 13 summarizes the results of our naïve
Bayes classifier as applied to the sensor events col-
lected in the smart apartment as part of the Activity Tracking data collection. The resident identification
accuracy is very similar to the accuracy for the Smart Apartment dataset, peaking at 92.2% accuracy when
the Hour of day feature is used.
Finally, we used a naïve Bayes classifier to per-
form activity recognition on this dataset. We use the
classifier to map a sequence of sensor events to one
of 14 possible activity labels: 1) Resident1 going
from bed to bathroom, 2) Resident2 going from
bed to bathroom, 3) Resident1 preparing/eating
breakfast, 4) Resident1 preparing/eating breakfast, 5)
Watching TV (either resident), 6) Cleaning bathtub
(either resident), 7) Resident1 working at the com-
puter, 8) Resident2 working at the computer, 9)
Resident1 sleeping, 10) Resident2 sleeping, 11) Pre-
paring/eating lunch (either resident), 12) Prepar-
ing/eating dinner (either resident), 13) Cleaning (ei-
ther resident), or 14) Studying at the dining room
table (either resident). The naïve Bayes classifier
initially achieved an accuracy of 80.8% on this data-
set. This is a fairly good result given the number of
activities that we need to discriminate and the fact
that residents are performing activities in an inter-
woven and parallel fashion.
To determine how activity recognition can benefit
from learned resident information, we next enhance
the Activity Tracking dataset by adding an extra field
to each sensor event containing the resident identifier
that is automatically generated by our naïve Bayes
classifier. We test our activity recognition algorithm
again on this enhanced dataset. This time we achieve
an accuracy of 89.2%. The results of these two ex-
periments are graphed in Fig. 14 and clearly demon-
strate that learned resident labels enhance the accu-
racy of other smart environment tasks such as activ-
ity recognition.
5. Conclusions
The field of smart environments is maturing to the
point where technologies are ready for deployment in
people’s homes. The applications of smart environ-
ment technologies are becoming quite numerous,
Fig. 13. Classifier Classifier accuracy for the naive Bayes classifer (NBC) on the Activity Tracking dataset for the various temporal feature tyes.
Fig. 14. Activity recognition accuracy with and without learned resident identifiers.
A.S. Crandall and D.J. Cook / Coping with multiple residents in a smart environment10

from health monitoring [19] to energy conservation
and home automation. Before the benefit of smart
environments can be fully realized, researchers need
to tackle the issue of coping with multiple residents.
As a first step, in this paper we address the issue of
recognizing residents in a smart environment based
on observed sensor data. Specifically, we implement
and compare two approaches to learning a mapping
from sensor event features to a resident ID that is
responsible for triggering the sensor event.
Using two real-world testbeds with real-world ac-
tivities, both the naïve Bayes classifier and the
Markov model classifier perform well. Each learning
approach is improved when we consider event tim-
ings and the Markov model is made more robust
when we incorporate hidden States. When using
these classifiers in a medical or security environment,
the false positive rate is also very important. The
system should hold off on making decisions instead
of guessing because incorrect information may lead
to not just poor performance, but may impact diagno-
sis or emergency responsiveness of the environment.
These kinds of real-world issues impact a number of
smart home technology designs and choices.
We found that alternative time representations can
greatly influence the performance of any temporally-
dependent environment, and this study is no excep-
tion. Whether the final application needs a very high
level of certainty for the residents or can trade off the
certainty for higher accuracy across the entire set of
individuals is decided by the smart home application.
Fortunately, as the systems move towards employing
ensembles of tools, they will be able to automatically
experiment with and select effective feature represen-
tations.
Both the naïve Bayes classifier and the Markov-
based classifiers offer advantages and disadvantages.
We can keep the deficiencies of these algorithms
mitigated by allowing them to automatically select
features and by leveraging the strengths of each ap-
proach to modeling resident behavior.
We also discovered that learning resident identifi-
ers for smart environment sensor events aids in the
performing of other smart environments tasks. In this
paper we demonstrated this feature for activity rec-
ognition, but the learned information could be used
for a number of other data analysis, prediction, and
automation tasks as well.
A number of directions for future work are appar-
ent that will continue to strengthen the capabilities of
smart home resident identifiers. Providing additional
data will highlight the robustness of alternative solu-
tions. In a future study, we will evaluate the accuracy
of these learning algorithms as the number of resi-
dents in a single space is scaled up. We will also em-
ploy our algorithms to determine the number of indi-
viduals that are currently in a specific smart envi-
ronment.
We will also evaluate this classifier as a compo-
nent of an overall smart environment system, such as
CASAS, in which preferences are specified and deci-
sions are automatically made based on the informa-
tion that is provided by the classifier. Because a resi-
dent classifier system is now available, smart envi-
ronment systems such as CASAS will be able to
make more refined and adaptive decisions that ac-
commodate each of the residents that live or work in
the smart environment.
Acknowledgements
This work is supported in part by NSF grant IIS-
0121297 and by NIH grant 1R21DA024294-01.
References
[1] Asteriskguru.com, www.asteriskguru.com/tutorials/. [2] P. Bahl and V. Padmanabhan. Radar: An in-building rf-based
user location and tracking system, in: Proceedings of IEEE Infocom, 2000, pp. 775–784.
[3] D. Cook and S. Das. How smart are our environments? An updated look at the state of the art, Journal of Pervasive and Mobile Computing 3(2):53–73, 2007.
[4] D. Cook and M. Schmitter-Edgecombe. Assessing the qual-ity of activities in a smart environment, Methods of Informa-tion in Medicine, to appear.
[5] G. Demiris, D. Oliver, G. Dickey, M. Skubic and M. Rantz. Findings from a participatory evaluation of a smart home ap-plication for older adults, Technology and Health Care 16:111–118, 2008.
[6] W. Feng, J. Walpole, W. Feng, and C. Pu. Moving towards massively scalable video-based sensor networks, in: Pro-ceedings of the Workshop on New Visions for Large-Scale Networks: Research and Applications, 2001.
[7] K. Gopalratnam and D. Cook. Online sequential prediction via incremental parsing: The Active LeZi algorithm, IEEE Intelligent Systems 22(1):52–58, 2007.
[8] E. Heierman, M. Youngblood, and D. Cook. Mining tempo-ral sequences to discover interesting patterns, in: Proceedings of the KDD Workshop on Mining Temporal and Sequential Data, 2004.
[9] J. Hightower and G. Borriello. Location systems for ubiqui-tous computing, Computer 32(8):57–66, 2001.
[10] S. Intille. Designing a home of the future, IEEE Pervasive Computing 1:80–86, 2002.
[11] Jabber.org. Open instant messaging and presence. http://www.jabber.org, 2008.
[12] V. Jakkula, A. Crandall, and D. Cook. Knowledge discovery in entity based smart environment resident data using tempo-
A.S. Crandall and D.J. Cook / Coping with multiple residents in a smart environment 11

ral relation based data mining, in: Proceedings of the IEEE Workshop on Temporal-Spatial Data Mining, 2007.
[13] V. Jakkula and D. Cook. Using temporal relations in smart environment data for activity prediction, in: Proceedings of the International Conference on Machine Learning, 2007.
[14] J. Kumm, S. Harris, B. Meyers, B. Brumitt, M. Hale, and S. Shafer. Multi-camera multi-person tracking for easy liv-ing, in: Proceedings of the International Workshop on Visual Surveillance, 2000, pp. 3–10.
[15] C. Lu, Y. Ho, and L. Fu. Creating robust activity maps using wireless sensor network in a smart home, in: Proceedings of the Annual Conference on Automation Science and Engi-neering, 2007.
[16] S. Moncrieff. Multi-model emotive computing in a smart house environment, Journal of Pervasive and Mobile Com-puting 3(2):74–94, 2007.
[17] E. Munguia-Tapia, S. Intille, and K. Larson. Activity recog-nition in the home setting using simple and ubiquitous sen-sors, in: Proceedings of PERVASIVE, 2004, pp. 158–175.
[18] R. Orr and G. Abowd. The smart floor: A mechanism for natural user identification and tracking, in: Proceedings of the Conference on Human Factors in Computing Systems, 2000.
[19] M. Pollack. Intelligent technology for an aging population: The use of AI to assist elders with cognitive impairment, AI Magazine 26(2):9–24, 2005.
[20] N. Priyantha, A. Chakraborty, and H. Baakrishnan. The cricket location support system, in: Proceedings of the Inter-national Conference on Mobile Computing and Networking, 2000, pp. 32–43.
[21] P. Rashidi, G. Youngblood, D. Cook, and S. Das. Inhabitant guidance of smart environments, in: Proceedings of the In-ternational Conference on Human-Computer Interaction, 2007, pp. 910–919.
[22] N. Roy, A. Roy, K. Basu, and S. Das. A cooperative learning framework for mobility-aware resource management in multi-inhabitant smart homes, in: Proceedings of the IEEE International Conference on Mobile and Ubiquitous Systems: Networking and Services, 2005, pp. 393–403.
[23] L. Snidaro, C. Micheloni, and C. Chivedale. Video security for ambient intelligence, IEEE Transactions on Systems, Man, and Cybernetics, Part A: Systems and Humans, 35(1):133–144, 2005.
[24] C. Stauffer and E. Grimson. Learning patterns of activity us-ing real-time tracking, IEEE Transactions on Pattern Analy-sis and Machine Intelligence 22(8):747–757, 2000.
[25] T. van Kastern and B. Kröse. Bayesian activity recognition in resident for elders, in: Proceedings of the International Conference on Intelligent Environments, 2008.
[26] A. Viterbi. Error bounds for convolutional codes and an as-ymptotically optimum decoding algorithm, IEEE Transac-tions on Information Theory 13(2):260–269, 1967.
[27] C. Wren and E. Munguia-Tapia. Toward scalable activity recognition for sensor networks, Lecture Notes on Computer Science, 3987:168–185, 2006.
[28] J. Yin, Q. Yang, and D. Shen. Activity recognition via user-trace segmentation, ACM Transactions on Sensor Networks, 4(4):article 19, 2008.
A.S. Crandall and D.J. Cook / Coping with multiple residents in a smart environment12