journal of analytical and applied...
TRANSCRIPT
Pd
Aa
b
c
d
a
ARRAA
KCBCPST
1
tsTfcpcCatN
h0
Journal of Analytical and Applied Pyrolysis 124 (2017) 79–88
Contents lists available at ScienceDirect
Journal of Analytical and Applied Pyrolysis
journa l h om epage: www.elsev ier .com/ locate / jaap
orosity development and reactivity changes of coal–biomass blendsuring co-pyrolysis at various temperatures
mi Vyasa, Thiago Chellappab,c, Jillian L. Goldfarbb,d,∗
Department of Electrical and Computer Engineering, Boston University, 8 St. Mary’s Street, Boston, MA 02215, USADepartment of Mechanical Engineering, Boston University, 110 Cummington Mall, Boston, MA 02215, USAFederal University of Rio Grande do Norte, Department of Mechanical Engineering and Department of Arts, 59078-970, Natal, RN, BrazilDivision of Materials Science & Engineering, Boston University, 15 St. Mary’s Street, Brookline, MA 02446, USA
r t i c l e i n f o
rticle history:eceived 28 December 2015eceived in revised form 15 February 2017ccepted 21 February 2017vailable online 24 February 2017
eywords:oaliomasso-pyrolysisorosityurface areahermal reactivity
a b s t r a c t
While co-firing of coal and biomass represents an inexpensive, efficient, short-range future method toincorporate more renewable fuels into our energy generation portfolio, we know little about how U.S.domestic coals and biomasses behave together. Computational fluid dynamics models are routinely usedto model combustion of solids in packed and fluidized beds, for which porosity changes are a key vari-able to predicting heterogeneities in transport and fuel reactivity. This work probes the changes in carboncontents, thermal reactivities, surface areas, and porosities as a function of blend ratio and pyrolysis tem-perature for a series of Pennsylvania coal and feed corn stover biomass blends. There is a fairly lineartrend between both percent biomass in a blend and pyrolysis temperature with volatile matter contentof the char; this additive nature of the blended streams does not extend to surface area and porosity.Surface areas (measured by N2 adsorption isotherms) peaked for the pure coal and 10 wt% biomass peaksaround 600 ◦C, and for the 20 and 50 wt% biomass and pure biomass between 600 and 750 ◦C. The sur-face area decreases for all samples when the pyrolysis temperature reaches 900 ◦C. Generally, higher
temperatures led to enhanced microporosity across all fuels and blends, though this was not a lineartrend. Of keen interest to co-firing scenarios was the disappearance of segregated oxidation behavior ofthe coal–biomass blends at pyrolysis temperatures as low as 300 ◦C, suggesting that co-firing could beimproved by preheating the comingled fuels and low temperatures before their introduction into theboiler.© 2017 Elsevier B.V. All rights reserved.
. Introduction
Second-generation biomass feedstocks, comprised of agricul-ural waste and organic byproducts, represent a possible stopgapource replacement for dwindling conventional fossil fuel sources.hey may be blended with traditional fuels such as coal, an avenueor immediate usage given the infrastructure already in place foroal, or treated separately to produce 100% renewable energy, aromise for the more distant future. The co-firing of biomass andoal is an efficient and inexpensive use of biomass that reduces netO2 emissions from power plants [1]. Biomasses are often used to
chieve a better control of the burning process; in co-combustionhey increase the volatile matter content, flame stability, and alterOx precursor formation [2–4]. Despite these applicable benefits to∗ Corresponding author.E-mail addresses: [email protected], [email protected] (J.L. Goldfarb).
ttp://dx.doi.org/10.1016/j.jaap.2017.02.018165-2370/© 2017 Elsevier B.V. All rights reserved.
the United States, the majority of studies on coal–biomass pyrol-ysis and combustion behavior originate in Europe and Asia. Whilethe overall trends that our worldwide counterparts have found arereasonably applicable to our energy generation systems, we usedifferent coals and produce different agricultural waste streams,leading to differences in co-firing efficiencies. Coal–biomass sys-tems from the Northeastern/Mid-Atlantic regions of the U.S. tendto use coals of higher sulfur content and different biomasses thanmany previous studies. Because the chemical characteristics of theblend dictate its thermal and kinetics profile, without data on rel-evant systems, it is difficult to design processes to utilize locallyavailable biomass and East Coast coal. The ability to co-fire coaland biomass depends on the characteristics of the power plant,availability and price of biomass within a reasonable transportabledistance of the plant, and the perceived economic value of environ-
mental benefits [5].Biomass and coal are carbonaceous fuels that progress frompyrolysis to oxidation through a series of steps, for which solid
8 and Applied Pyrolysis 124 (2017) 79–88
dapdsvb[iccoamtaa
enptbasbddbcnamsaotirsispm[
mtTfarattibRhasoycsl
Table 1Ultimate, proximate, and combustion enthalpy analyses of samples [1,2].
wt% (dry basis) Pennsylvania coal Feed corn stover
C 76.28 46.55H 5.33 5.66N 1.42 0.95S 1.73 0.13O 7.65 39.59Moisture 6.55 4.54Volatile 32.18 75.77Fixed 60.88 16.16Ash 6.93 8.07HHV (MJ/kg) 30.93 11.60
0 A. Vyas et al. / Journal of Analytical
evolatilization is the first step [6,7]. Due to its less-condensedromatic nature, biomass pyrolysis yields different temperaturerofiles than those of coal decomposition, yet their separateevolatilization stages can often be followed in a co-pyrolysiscenario [8]. In order to design an effective thermochemical con-ersion unit, we must know the chemical composition, thermalehavior, and reactivity of the fuel in question [9]. As Gayan et al.10] note, combustion models used for coal must be modified tonclude biomass’ higher reactivity and volatile matter content thanoal. During devolatilization, the solid’s macromolecular structurehanges due to depolymerization, vaporization, and cross-linkingf the solid matrix, causing aromatic ring rupture, evolving gasesnd tars, and forming a carbonaceous char. Devolatilization is oftenodeled using different rate expressions for each conversion (gas,
ar, and char) process [11]. However, there is considerable debates to whether or not devolatilization of fuel blends can be modeleds an additive function of each fuel’s contribution [12–14].
To improve the combustion efficiency and reduce pollutantmissions of solid biomass and blended biomass–coal streams, weeed a better understanding of the conversion processes. Com-utational fluid dynamics (CFD) simulations are commonly usedo model the combustion of solid fuels in packed and fluidizededs [15–21]. However, models that neglect changes in porosityre unable to account for heterogeneities in transport and fuel con-umption [22], as changes in char reactivity can mediate carbonurnout [23]. The surface area and porosity of chars are one of manyetermining factors in whether reaction rates – be it pyrolysis, oxi-ation, adsorption, chemical, etc. – in CFD models are controlledy gaseous diffusion through the pore surface, versus kineticallyontrolled regimes where reaction rates are limited by total inter-al surface area [24–27]. Often, such intrinsic solid reactivitiesre expressed on a basis of available surface area [28]. In suchodels, Knudsen diffusion is often neglected, assumed to be incon-
equential as compared to molecular diffusion [29]. To improve theccuracy of CFD models, the changing volatile fraction and porosityf solid fuels can be incorporated [30–32]. As pyrolysis continues,he solid fraction of a combustion bed decreases as the porosityncreases [33]. Depending on whether or not a shrinking- and/oreacting-core mechanism is responsible for overall rate limiting,olids either decrease in density or particle size, each of which hasts own kinetic parameter [34]. Knowledge of how the porosity andurface area changes as a function of temperature – and if the co-yrolysis of biomass and coal can be represented by an additiveodel – could improve the accuracy and reliability of CFD models
35–37].There is substantial discord among those who study the ther-
ochemical conversion of blended fuels, specifically concerninghe interactions – or lack thereof – between different solid fuels.he chemical analysis literature shows that different species areormed at different rates when fuels are blended than a simpledditive nature indicates. Other studies that focus only on globaleaction kinetics say that fuel blends are easily described by andditive or linear scheme, whereby each fuel contributes to theotal activation energy or decomposition rate as a weighted frac-ion of its presence [38–42]. However, there is little data availablen the literature that compares the porosity development in theselends. One of the few recent studies in this vein was performed byowan et al. [43] on the co-pyrolysis of a 50–50 blend of coal andardwood. The authors find some synergistic (or non-additive) tarnd char yields, as well as FTIR char structures, for 50–50 blendedtreams. In this study we probe the porosities of pyrolyzed blendsf a Pennsylvania Coal and Feed Corn Stover at different pyrol-
sis temperatures and three blend ratios (90–10, 80–20, 50–50oal–biomass) to make inferences on the extent to which diffu-ion might limit thermal behavior due to changes in porosity. Weook at the BET isotherms of the semi-carbonaceous chars result-PA coal provided by PSNH suppliers.Biomass performed by Hazen Research, Golden, CO.
ing from the pyrolysis of these blends at multiple temperatures todetermine the potential for waste-to-byproduct conversion suchas concrete/cement additives and sorbent material. This is com-plemented by a nonisothermal thermogravimetric analysis of thecoal–biomass blends to probe the reactivity of the fuel blends. Thisstudy compliments a recent publication from our laboratory [40]on the pyrolysis kinetics of blends of PA Coal and Feed Corn Stoverdetermined via the distributed activation energy model.
2. Materials and methods
2.1. Sample preparation
A commercial U.S. high-volatile bituminous coal from Pennsyl-vania was obtained as part of a shipment received by the PSNHMerrimack Station (Public Service of New Hampshire, now Ever-source Energy) in October 2011. Feed corn stover was collectedduring the same time from the Coppal House Farm in Lee, NH.It was dried in a laboratory oven overnight to prevent decompo-sition. Table 1 supplies the proximate and ultimate analyses ofeach raw fuel used in this investigation. The higher heating val-ues were measured in-house on a Parr Model 6100 Oxygen BombCalorimeter, standardized with NIST-traceable Benzoic acid. Allsamples were mechanically ground and sieved to a particle sizeof 125–250 �m. van de Velden et al. [44] demonstrated that masstransfer limitations occur in the pyrolysis of large particles becauseof temperature gradients within the particle. As Gu et al. [45–47]have shown in their CFD models, the temperature gradients insideparticles can be neglected with sufficiently small Biot numbers thatwould result from particles of this size and smaller.
The biomass and coal were blended at weight ratios of 90:10,80:20, and 50:50, measured to the 0.1 mg on a Sartorius semi-microbalance directly into clean glass vials. The samples werehomogenized on a vortex mixter. The blended samples, along withraw samples of both coal and biomass, were pyrolyzed underhigh purity nitrogen gas with a flow rate of 125–150 mL/min ina Thermo-Scientific Lindberg Blue TF55035A-1 tube furnace. Theywere heated at a rate of 10 ◦C/min and held at 110 ◦C for 30 min todrive off moisture. They were then heated to their respective max-imum temperatures of 300 ◦C, 450 ◦C, 600 ◦C, 750 ◦C, and 900 ◦C (at10 ◦C/min) and held for 30 min before being allowed to cool to roomtemperature under continuous nitrogen flow to prevent oxidation.
2.2. Thermal analysis
To determine the volatile matter, fixed carbon, and ash content
of each material, each pure solid fuel and blend was first pyrolyzedin a high purity nitrogen atmosphere (reactive plus protective gasflow at 70 mL/min) in a 70 �L alumina crucible. Samples wereheated to 110 ◦C and held for 30 min to insure moisture removal.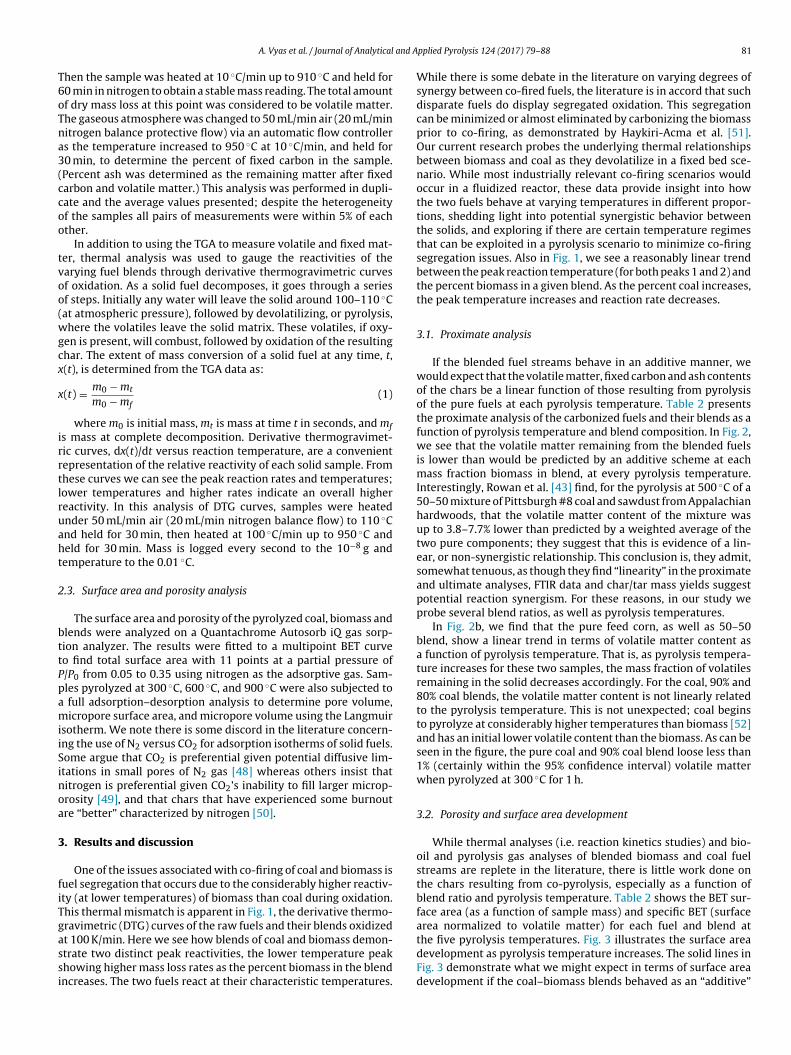
and A
T6oTna3(ccoo
tvoo(wgcx
x
irrtlruaht
2
bttPpamiiSinoa
3
fiTgassi
A. Vyas et al. / Journal of Analytical
hen the sample was heated at 10 ◦C/min up to 910 ◦C and held for0 min in nitrogen to obtain a stable mass reading. The total amountf dry mass loss at this point was considered to be volatile matter.he gaseous atmosphere was changed to 50 mL/min air (20 mL/minitrogen balance protective flow) via an automatic flow controllers the temperature increased to 950 ◦C at 10 ◦C/min, and held for0 min, to determine the percent of fixed carbon in the sample.Percent ash was determined as the remaining matter after fixedarbon and volatile matter.) This analysis was performed in dupli-ate and the average values presented; despite the heterogeneityf the samples all pairs of measurements were within 5% of eachther.
In addition to using the TGA to measure volatile and fixed mat-er, thermal analysis was used to gauge the reactivities of thearying fuel blends through derivative thermogravimetric curvesf oxidation. As a solid fuel decomposes, it goes through a seriesf steps. Initially any water will leave the solid around 100–110 ◦Cat atmospheric pressure), followed by devolatilizing, or pyrolysis,here the volatiles leave the solid matrix. These volatiles, if oxy-
en is present, will combust, followed by oxidation of the resultinghar. The extent of mass conversion of a solid fuel at any time, t,(t), is determined from the TGA data as:
(t) = m0 − mt
m0 − mf(1)
where m0 is initial mass, mt is mass at time t in seconds, and mfs mass at complete decomposition. Derivative thermogravimet-ic curves, dx(t)/dt versus reaction temperature, are a convenientepresentation of the relative reactivity of each solid sample. Fromhese curves we can see the peak reaction rates and temperatures;ower temperatures and higher rates indicate an overall highereactivity. In this analysis of DTG curves, samples were heatednder 50 mL/min air (20 mL/min nitrogen balance flow) to 110 ◦Cnd held for 30 min, then heated at 100 ◦C/min up to 950 ◦C andeld for 30 min. Mass is logged every second to the 10−8 g andemperature to the 0.01 ◦C.
.3. Surface area and porosity analysis
The surface area and porosity of the pyrolyzed coal, biomass andlends were analyzed on a Quantachrome Autosorb iQ gas sorp-ion analyzer. The results were fitted to a multipoint BET curveo find total surface area with 11 points at a partial pressure of/P0 from 0.05 to 0.35 using nitrogen as the adsorptive gas. Sam-les pyrolyzed at 300 ◦C, 600 ◦C, and 900 ◦C were also subjected to
full adsorption–desorption analysis to determine pore volume,icropore surface area, and micropore volume using the Langmuir
sotherm. We note there is some discord in the literature concern-ng the use of N2 versus CO2 for adsorption isotherms of solid fuels.ome argue that CO2 is preferential given potential diffusive lim-tations in small pores of N2 gas [48] whereas others insist thatitrogen is preferential given CO2’s inability to fill larger microp-rosity [49], and that chars that have experienced some burnoutre “better” characterized by nitrogen [50].
. Results and discussion
One of the issues associated with co-firing of coal and biomass isuel segregation that occurs due to the considerably higher reactiv-ty (at lower temperatures) of biomass than coal during oxidation.his thermal mismatch is apparent in Fig. 1, the derivative thermo-ravimetric (DTG) curves of the raw fuels and their blends oxidized
t 100 K/min. Here we see how blends of coal and biomass demon-trate two distinct peak reactivities, the lower temperature peakhowing higher mass loss rates as the percent biomass in the blendncreases. The two fuels react at their characteristic temperatures.pplied Pyrolysis 124 (2017) 79–88 81
While there is some debate in the literature on varying degrees ofsynergy between co-fired fuels, the literature is in accord that suchdisparate fuels do display segregated oxidation. This segregationcan be minimized or almost eliminated by carbonizing the biomassprior to co-firing, as demonstrated by Haykiri-Acma et al. [51].Our current research probes the underlying thermal relationshipsbetween biomass and coal as they devolatilize in a fixed bed sce-nario. While most industrially relevant co-firing scenarios wouldoccur in a fluidized reactor, these data provide insight into howthe two fuels behave at varying temperatures in different propor-tions, shedding light into potential synergistic behavior betweenthe solids, and exploring if there are certain temperature regimesthat can be exploited in a pyrolysis scenario to minimize co-firingsegregation issues. Also in Fig. 1, we see a reasonably linear trendbetween the peak reaction temperature (for both peaks 1 and 2) andthe percent biomass in a given blend. As the percent coal increases,the peak temperature increases and reaction rate decreases.
3.1. Proximate analysis
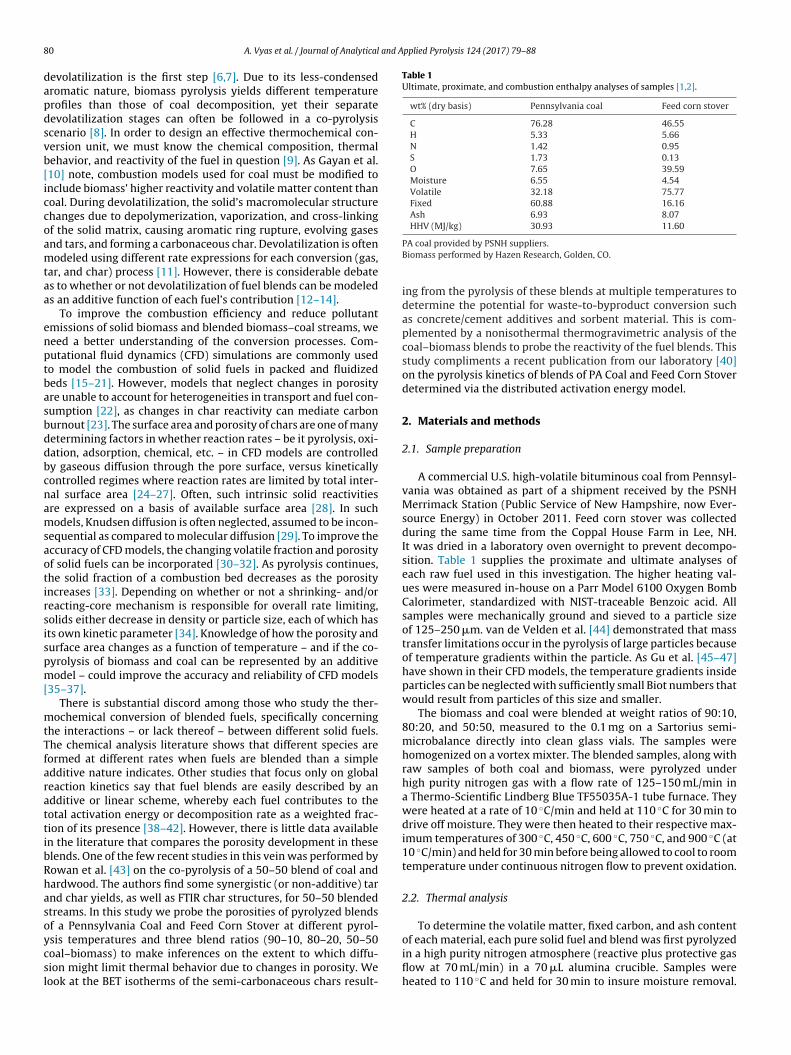
If the blended fuel streams behave in an additive manner, wewould expect that the volatile matter, fixed carbon and ash contentsof the chars be a linear function of those resulting from pyrolysisof the pure fuels at each pyrolysis temperature. Table 2 presentsthe proximate analysis of the carbonized fuels and their blends as afunction of pyrolysis temperature and blend composition. In Fig. 2,we see that the volatile matter remaining from the blended fuelsis lower than would be predicted by an additive scheme at eachmass fraction biomass in blend, at every pyrolysis temperature.Interestingly, Rowan et al. [43] find, for the pyrolysis at 500 ◦C of a50–50 mixture of Pittsburgh #8 coal and sawdust from Appalachianhardwoods, that the volatile matter content of the mixture wasup to 3.8–7.7% lower than predicted by a weighted average of thetwo pure components; they suggest that this is evidence of a lin-ear, or non-synergistic relationship. This conclusion is, they admit,somewhat tenuous, as though they find “linearity” in the proximateand ultimate analyses, FTIR data and char/tar mass yields suggestpotential reaction synergism. For these reasons, in our study weprobe several blend ratios, as well as pyrolysis temperatures.
In Fig. 2b, we find that the pure feed corn, as well as 50–50blend, show a linear trend in terms of volatile matter content asa function of pyrolysis temperature. That is, as pyrolysis tempera-ture increases for these two samples, the mass fraction of volatilesremaining in the solid decreases accordingly. For the coal, 90% and80% coal blends, the volatile matter content is not linearly relatedto the pyrolysis temperature. This is not unexpected; coal beginsto pyrolyze at considerably higher temperatures than biomass [52]and has an initial lower volatile content than the biomass. As can beseen in the figure, the pure coal and 90% coal blend loose less than1% (certainly within the 95% confidence interval) volatile matterwhen pyrolyzed at 300 ◦C for 1 h.
3.2. Porosity and surface area development
While thermal analyses (i.e. reaction kinetics studies) and bio-oil and pyrolysis gas analyses of blended biomass and coal fuelstreams are replete in the literature, there is little work done onthe chars resulting from co-pyrolysis, especially as a function ofblend ratio and pyrolysis temperature. Table 2 shows the BET sur-face area (as a function of sample mass) and specific BET (surfacearea normalized to volatile matter) for each fuel and blend at
the five pyrolysis temperatures. Fig. 3 illustrates the surface areadevelopment as pyrolysis temperature increases. The solid lines inFig. 3 demonstrate what we might expect in terms of surface areadevelopment if the coal–biomass blends behaved as an “additive”
82 A. Vyas et al. / Journal of Analytical and Applied Pyrolysis 124 (2017) 79–88
Fig. 1. DTG analysis for oxidation at 100 ◦C/min for raw fuels and their blends.
Table 2Carbon contents and BET surface area for coal, biomass and blends pyrolyzed at various temperatures between 300 and 900 ◦C (with NIST-calculated standard deviations[79]).
Pyrolysistemperature, ◦C
Volatile matter,wt fraction
Fixed carbon, wtfraction
Ash (by differencewt fraction)
BET surface area,m2/g
Specific surfacearea, m2/gVM
1:0 PA:FC 300 0.313 ± 0.09 0.610 ± 0.018 0.078 11.376 ± 0.307 36.403 ± 0.983450 0.190 ± 0.006 0.719 ± 0.022 0.092 4.147 ± 0.112 21.859 ± 0.590600 0.125 ± 0.004 0.771 ± 0.023 0.104 19.457 ± 0.525 156.215 ± 4.218750 0.113 ± 0.003 0.722 ± 0.022 0.165 5.246 ± 0.142 46.588 ± 1.258900 0.083 ± 0.002 0.802 ± 0.024 0.116 5.292 ± 0.143 63.885 ± 1.725
9:1 PA:FC 300 0.365 ± 0.011 0.554 ± 0.017 0.081 17.236 ± 0.465 47.287 ± 1.277450 0.216 ± 0.006 0.681 ± 0.020 0.103 8.719 ± 0.235 40.350 ± 1.089600 0.129 ± 0.004 0.756 ± 0.023 0.115 33.014 ± 0.891 255.229 ± 6.891750 0.106 ± 0.003 0.766 ± 0.023 0.118 14.226 ± 0.384 134.620 ± 3.635900 0.106 ± 0.003 0.766 ± 0.023 0.128 11.149 ± 0.301 105.484 ± 2.848
4:1 PA:FC 300 0.409 ± 0.012 0478 ± 0.014 0.113 10.352 ± 0.280 25.307 ± 0.683450 0.211 ± 0.006 0.667 ± 0.020 0.122 10.468 ± 0.283 49.687 ± 1.342600 0.147 ± 0.004 0.712 ± 0.021 0.141 18.162 ± 0.490 123.340 ± 3.330750 0.121 ± 0.004 0.751 ± 0.023 0.128 17.983 ± 0.486 148.713 ± 4.015900 0.093 ± 0.003 0.773 ± 0.023 0.135 12.947 ± 0.350 139.772 ± 3.774
1:1 PA:FC 300 0.417 ± 0.013 0.482 ± 0.014 0.101 27.174 ± 0.734 65.146 ± 1.759450 0.339 ± 0.010 0.508 ± 0.015 0.154 5.247 ± 0.142 15.492 ± 0.418600 0.184 ± 0.006 0.681 ± 0.020 0.135 40.319 ± 1.089 219.591 ± 5.929750 0.171 ± 0.005 0.652 ± 0.020 0.177 41.921 ± 1.132 244.874 ± 6.612900 0.097 ± 0.003 0.656 ± 0.020 0.246 18.255 ± 0.493 187.557 ± 5.064
0:1 PA:FC 300 0.645 ± 0.019 0.156 ± 0.005 0.199 23.123 ± 0.624 35.847 ± 0.968450 0.610 ± 0.018 0.110 ± 0.03 0.280 8.207 ± 0.222 13.454 ± 0.363
05
04
06
fS
S
5aamio44yatp
600 0.470 ± 0.014 0.173 ± 0.0750 0.413 ± 0.012 0.122 ± 0.0900 0.335 ± 0.010 0.206 ± 0.0
unction of mass fraction, x, whereby the predicted surface area,Apredict, would be equal to:
Apredict = xFCSAFC + xILSAIL (2)
However, as Fig. 3 shows, this is hardly the case. For all but the0:50 blend at 450 ◦C, the “predicted” surface areas are consider-bly lower than the measured surface areas, suggesting that the coalnd biomass synergistically interact to promote porosity develop-ent. We probe this further through Fig. 4, which demonstrates the
mpact of pyrolysis temperature on the BET surface areas of eachf the coal-feed corn blends. As pyrolysis temperature increases to50 ◦C, the surface areas of the samples (with the exception of the:1 coal:corn sample) drop significantly, and then rise as the pyrol-
sis temperature reaches 600 ◦C. This is an expected phenomenon;t lower pyrolysis temperatures the evolved gases can re-condenseo form tars and become trapped within the chars. The higher tem-erature is able to release them from the solid matrix [53–55]. The0.357 23.593 ± 0.637 50.163 ± 1.3540.465 29.881 ± 0.807 72.421 ± 1.9550.458 14.674 ± 0.396 43.750 ± 1.181
re-condensation of tars within solid biomass and coal matrices iswell-documented in the literature (for at least single samples), andhere we have extended it to coal–biomass blends. While the degreeof re-condensation within tars is quite variable, being dependenton pyrolysis unit design, residence time, and to some extent thespecific biomass [56–60]; overall, it has been shown that as pyrol-ysis temperature increases, the lower molecular weight (morevolatile components) decrease, with a somewhat murkier picturefor polycyclic aromatic hydrocarbons [61–63]. However, there isa balance between increasing pyrolysis temperature to preventtar re-condensation, and removing the majority of the volatilecompounds that promote high surface areas, as seen with higherpyrolysis temperatures. At 750 ◦C and 900 ◦C the BET surface areas
of the coal chars, 5.246 ± 0.142 and 5.292 ± 0.143 m2/gchar, respec-tively, are considerably lower than the biomass and blends, whichrange from 11.149 ± 0.301 to 41.921 ± 1.132 m2/gchar, for the 9:1pyrolyzed at 900 ◦C and 1:1 at 750 ◦C samples, respectively. At these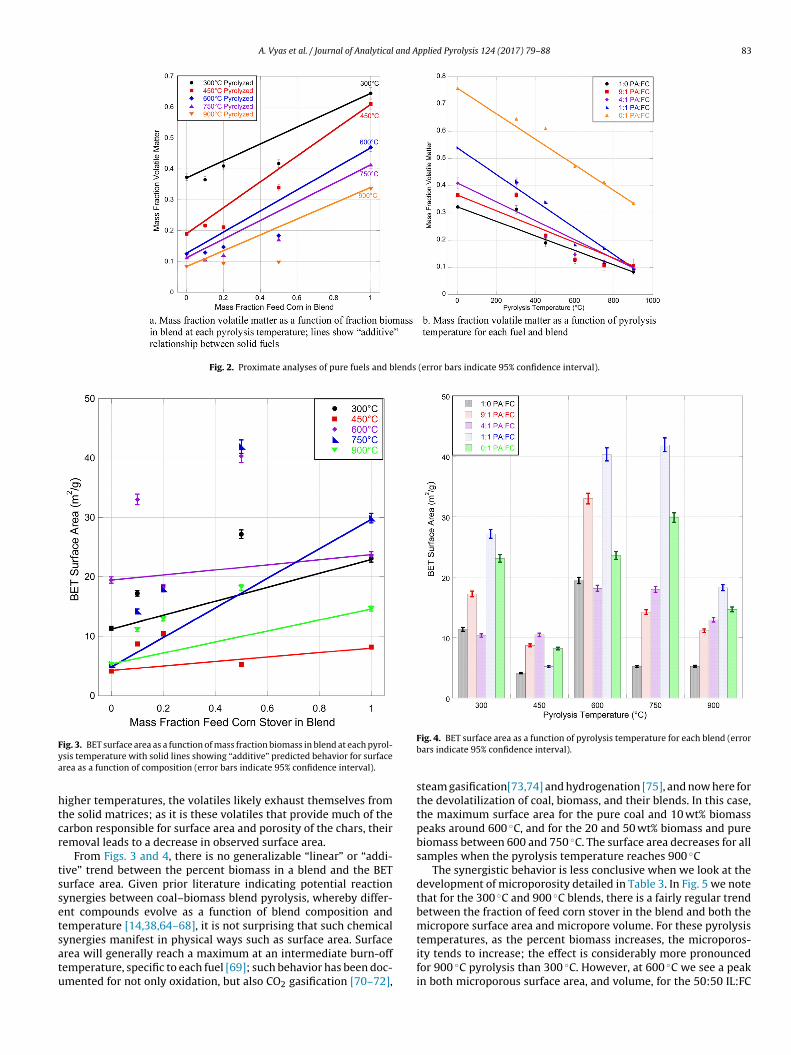
A. Vyas et al. / Journal of Analytical and Applied Pyrolysis 124 (2017) 79–88 83
Fig. 2. Proximate analyses of pure fuels and blends (error bars indicate 95% confidence interval).
Fya
htcr
tssetsatu
ig. 3. BET surface area as a function of mass fraction biomass in blend at each pyrol-sis temperature with solid lines showing “additive” predicted behavior for surfacerea as a function of composition (error bars indicate 95% confidence interval).
igher temperatures, the volatiles likely exhaust themselves fromhe solid matrices; as it is these volatiles that provide much of thearbon responsible for surface area and porosity of the chars, theiremoval leads to a decrease in observed surface area.
From Figs. 3 and 4, there is no generalizable “linear” or “addi-ive” trend between the percent biomass in a blend and the BETurface area. Given prior literature indicating potential reactionynergies between coal–biomass blend pyrolysis, whereby differ-nt compounds evolve as a function of blend composition andemperature [14,38,64–68], it is not surprising that such chemical
ynergies manifest in physical ways such as surface area. Surfacerea will generally reach a maximum at an intermediate burn-offemperature, specific to each fuel [69]; such behavior has been doc-mented for not only oxidation, but also CO2 gasification [70–72],Fig. 4. BET surface area as a function of pyrolysis temperature for each blend (errorbars indicate 95% confidence interval).
steam gasification[73,74] and hydrogenation [75], and now here forthe devolatilization of coal, biomass, and their blends. In this case,the maximum surface area for the pure coal and 10 wt% biomasspeaks around 600 ◦C, and for the 20 and 50 wt% biomass and purebiomass between 600 and 750 ◦C. The surface area decreases for allsamples when the pyrolysis temperature reaches 900 ◦C
The synergistic behavior is less conclusive when we look at thedevelopment of microporosity detailed in Table 3. In Fig. 5 we notethat for the 300 ◦C and 900 ◦C blends, there is a fairly regular trendbetween the fraction of feed corn stover in the blend and both themicropore surface area and micropore volume. For these pyrolysis
temperatures, as the percent biomass increases, the microporos-ity tends to increase; the effect is considerably more pronouncedfor 900 ◦C pyrolysis than 300 ◦C. However, at 600 ◦C we see a peakin both microporous surface area, and volume, for the 50:50 IL:FC
84 A. Vyas et al. / Journal of Analytical and Applied Pyrolysis 124 (2017) 79–88
Table 3Micropore surface area, volume and total pore volume for full isotherms for coal, biomass and blends pyrolyzed at 300, 600 and 900 ◦C (with NIST-calculated standarddeviations [79]).
Pyrolysistemperature, ◦C
Micropore surfacearea (m2/g)
Microporevolume (cm3/g)
Total porevolume (cm3/g)
Fraction microporousvolume
1:0 PA:FC 300 11.319 ± 0.340 4.00E−03 ± 1.20E−04 1.57E−02 ± 4.70E−04 0.255 ± 0.023600 16.404 ± 0.492 6.00E−03 ± 1.80E−04 2.15E−02 ± 6.46E−04 0.279 ± 0.025900 5.955 ± 0.179 2.00E−03 ± 6.00E−05 6.11E−03 ± 1.83E−04 0.328 ± 0.029
9:1 PA:FC 300 15.674 ± 0.470 6.00E−03 ± 1.80E−04 2.44E−02 ± 7.31E−04 0.246 ± 0.022600 15.011 ± 0.450 1.00E−02 ± 3.00E−04 3.60E−02 ± 1.08E−03 0.278 ± 0.025900 12.264 ± 0.368 5.00E−03 ± 1.50E−04 1.03E−02 ± 3.08E−04 0.487 ± 0.044
4:1 PA:FC 300 11.110 ± 0.333 4.00E−03 ± 1.20E−04 1.29E−02 ± 3.86E−04 0.311 ± 0.028600 12.264 ± 0.368 6.00E−03 ± 1.80E−04 1.35E−02 ± 4.06E−04 0.443 ± 0.040900 15.681 ± 0.470 4.00E−03 ± 1.20E−04 2.03E−02 ± 6.09E−04 0.197 ± 0.018
1:1 PA:FC 300 19.899 ± 0.597 7.00E−03 ± 2.10E−04 2.93E−02 ± 8.79E−04 0.239 ± 0.021600 58.998 ± 1.770 2.10E−02 ± 6.30E−04 3.60E−02 ± 1.08E−03 0.583 ± 0.052900 25.405 ± 0.762 9.00E−03 ± 2.70E−04 1.74E−02 ± 5.22E−04 0.517 ± 0.047
0:1 PA:FC 300 19.241 ± 0.577 7.00E−03 ± 2.10E−04 2.54E−02 ± 7.62E−04 0.276 ± 0.025600 29.395 ± 0.882 1.00E−02 ± 3.00E−04 2.95E−02 ± 8.85E−04 0.339 ± 0.031900 35.409 ± 1.062 1.30E−02 ± 3.90E−04 3.62E−02 ± 1.09E−03 0.359 ± 0.032
F nctioi
bov5ih4psmtc
3
o9taceai
ig. 5. Development of microporosity of IL coal, feed corn stover and blends as a fundicate 95% confidence interval).
lend. To compound this observation, Fig. 5b shows the microp-rous volume fraction (micropore volume divided by total poreolume, as given in Table 3). For the pure coal, 10 wt% biomass,0:50 blend and pure corn stover (though only statistically signif-
cant for the 10 and 50 wt% blends), the 900 ◦C pyrolyzed samplesave the highest percent microporous surface areas; upwards of5% for the 10 and 50 wt% blends. Interestingly, the 20 wt% blendyrolyzed at 600 ◦C has 44.3 ± 4.0% microporosity, which is con-iderably higher than the 900 ◦C pyrolyzed sample at 19.7 ± 1.8%icroporosity. The distribution of meso- and micropores within
hese solid fuels has potential consequences for the modeling ofoal–biomass co-firing.
.3. Thermal analysis
Derivative thermogravimetric curves of oxidation at 100 K/minf each solid fuel and blend, pyrolyzed at 300, 450, 600, 750 and00 ◦C, are shown in Fig. 6. In terms of overall reactivity, we pointhe reader to the scales of the y-axis in Fig. 6. Figs. 6a–d (pure coalnd blends) have a y-axis up to 0.005 s−1; the scale of the pure feed
orn DTG plot is up to 0.012 s−1. As this suggests, the pure feed corn,ven when pyrolyzed, is considerably more reactive than the coalnd blends. This is due to the higher carbon contents and remain-ng volatile matter available in the pure biomasses, especially at then of pyrolysis temperature and mass fraction feed corn stover in blend (error bars
lower pyrolysis temperatures. As the percent of biomass increasesin the blends, the reactivity clearly increases. This higher reactiv-ity, coupled with remaining high carbon content – even for FCpyrolyzed at 900 ◦C – suggests that the biochar remaining afterpyrolysis (i.e. extraction of bio-oil and pyrolysis gas as fuels) couldwell be used as a co-fired fuel with coal. For all the pure fuels andblends, the samples pyrolyzed at 300 and 450 ◦C are considerablymore reactive – seen through both lower peak temperatures andhigher peak reaction rates – than the samples pyrolyzed at 600 ◦Cand higher. Again this is attributed to the higher volatile mattercontent remaining in the solids fuels after pyrolysis at lower tem-peratures. Interestingly, for the 4−1 and 1−1 blends comprised of450 ◦C pyrolyzed biomass, there appears to be an increase in reac-tivity well beyond what might be expected for an additive scheme;the peak reaction rate of for these two blends is actually higher thanthe 300 ◦C blend (and for the 9–1 blend the 300 ◦C and 450 ◦C sam-ples appear to have the same peak reaction rate). The peak reactivityof the PA coal pyrolyzed at 300 ◦C is less than 0.003 s−1, and for the450 ◦C pyrolyzed sample is less than 0.002 s−1, yet the 9–1 blendspyrolyzed at these temperatures are both slightly above 0.003 s−1,
and the 4–1 and 1–1 blends have peak reactivities over 0.003 s−1for the 300 ◦C pyrolyzed samples, and over 0.004 s−1 for the 450 ◦Cpyrolyzed samples. The peak reactivity for the pure FC pyrolyzed atthese two temperatures is over 0.01 s−1. Therefore, it seems quite

A. Vyas et al. / Journal of Analytical and Applied Pyrolysis 124 (2017) 79–88 85
K/min
pptoba
asfaascbboc
3
appmfittle
Fig. 6. DTG curves for the oxidation, at 100
ossible that the biomass is synergistically reacting with the coal toromote the rate of decomposition beyond the coal’s inherent reac-ivity. Whether this is due to the pyrolyzed biomasses’ reactivities,r other confounding factors such as mineral matter content of theiomass catalyzing the reactivity [76–78] is unknown at present,nd warrants future investigation.
The DTG curves of oxidation at 100 K/min of the pure fuelsnd blends pyrolyzed at each temperature demonstrate non-egregated fuels, especially as compared to those shown in Fig. 1or the raw fuels. Even for the samples pyrolyzed at 300 ◦C, therere single peaks for each fuel and blend, suggesting that the fuelsre no longer segregating after this co-pyrolysis step. This hasignificant implications when it comes to utilizing biomass as ao-fired fuel. First, these results agree well with the recent studyy Haykiri-Acma et al. [51] on the potential to improve co-firingy first carbonizing biomass, even at low temperatures. Second,ur data suggest that the two fuels could be preheated – whenomingled – at low temperatures to improve the overall firing step.
.4. Summation – with qualitative evidence
The data presented here on the co-pyrolysis of feed corn stovernd Pennsylvania Coal demonstrate several important thermal andhysical characteristics that ought to be considered as transientroperties when employing Computational Fluid Dynamics (CFD)odels to co-fired fuel systems. From our proximate analyses, we
nd that the volatile matter content of pyrolyzed pure feed corn and
he 50:50 blends is fairly linear with respect to temperature, thoughhe 90 and 80 wt% coal blends loose considerably less than 1% at theowest pyrolysis temperature and thus the trend is not quite lin-ar for these materials. Conversely, this “additive” trend does not, of pyrolyzed solid fuels and their blends.
extend to surface area and porosity distributions in terms of compo-sition or pyrolysis temperature. Thermal analysis follows a generaltrend – that as the percent biomass in the blend increases, the reac-tivity increases (seen through higher reaction rates and lower peakreaction temperatures) – and the same trend holds for pyrolysistemperature. Finally, Fig. 7 shows SEM images of the pure fuelsand blends pyrolyzed at 900 ◦C, at 2000 and 10,000 magnifications(2k magnification scale bar = 2 �m, 10k magnification = 1 �m). Thefeed corn stover shows a highly structured microporous materialwith amorphous nanoscale deposits along the surface. Conversely,the 900 ◦C pyrolyzed coal shows amorphous, bulb-like formationsalong the surface of the char. From the proximate, thermal, sur-face area and qualitative analyses performed here, we see that thephysical blending of biomass and coal results in changes to variousphysical characteristics of the fuel blend, depending on the percentof each solid present, and the pyrolysis profile.
4. Conclusions
In this investigation, we demonstrate the impact of blend-ing ratio and pyrolysis temperature on the physical and thermalproperties of feed corn stover and Pennsylvania coal blends. Theoverarching goals were (1) to provide information on the poten-tial to model such blended fuel streams as additive functionsof the blends’ composition, versus the impact of any synergis-tic interactions between the blended fuels and (2) to explore theimpact of pyrolysis temperature on this behavior on blended fuel
streams. Overall, we find that these fuels are difficult to modelusing a simple additive scheme; the surface areas and micro-porosities of the blended streams are not a simple function ofthe materials present. Rather, it seems that the biomass and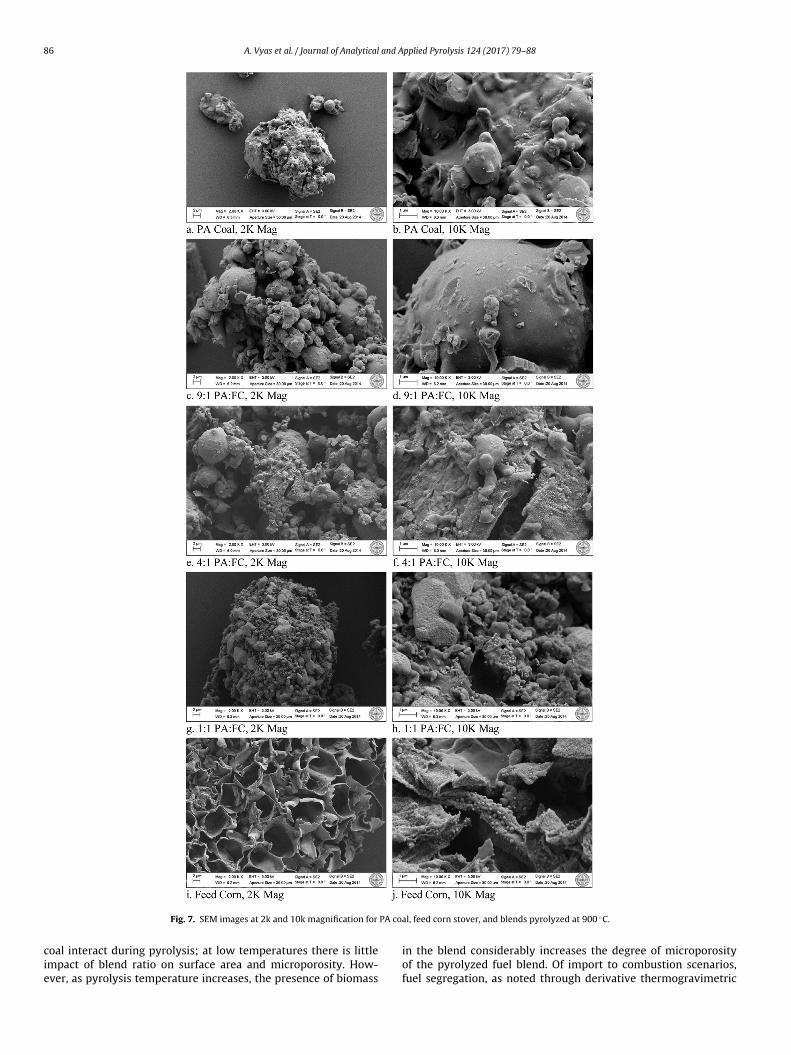
86 A. Vyas et al. / Journal of Analytical and Applied Pyrolysis 124 (2017) 79–88
PA co
cie
Fig. 7. SEM images at 2k and 10k magnification for
oal interact during pyrolysis; at low temperatures there is littlempact of blend ratio on surface area and microporosity. How-ver, as pyrolysis temperature increases, the presence of biomass
al, feed corn stover, and blends pyrolyzed at 900 ◦C.
in the blend considerably increases the degree of microporosityof the pyrolyzed fuel blend. Of import to combustion scenarios,fuel segregation, as noted through derivative thermogravimetric

and A
c3ottafncsfia
A
etamBCD
R
[
[
[
[
[
[
[
[
[
[
[
[
[
[
[
[
[
[
[
[
[
[
[
[
[
[
[
[
[
[
[
[
[
[
[
[
[
[
A. Vyas et al. / Journal of Analytical
urves, seemingly disappears at pyrolysis temperatures as low as00 ◦C. The evidence presented here suggests that CFD modelingf coal–biomass co-firing may be improved by including a dynamicerm for porosity development as a function of both blend ratio andemperature. Further studies are recommended to develop suchn algorithm that would enable prediction of such changes as aunction of time and temperature in industrially relevant firing sce-arios. The present work underscores that the co-firing of blendedoal–biomass streams cannot be modeled using a simple additivecheme, but rather synergistic interactions between the two soliduels suggest that the presence of biomass, with its greater reactiv-ty and higher volatile content, may promote the devolatilizationnd development of porosity in blended fuel streams.
cknowledgments
This material is based upon work supported by the National Sci-nce Foundation under Grant No. NSF CBET-1127774. The authorshank A. Patnaik for assistance with the SEM images. A. Vyascknowledges the Boston University College of Engineering Sum-er Term Alumni Research Scholars (STARS) Program and the
oston University Undergraduate Research Program (UROP). T.hellappa acknowledges the support of the CAPES Brazilian Post-octoral Fellowship Program.
eferences
[1] L. Baxter, Biomass-coal co-combustion: opportunity for affordable renewableenergy, Fuel 84 (10) (2005) 1295–1302.
[2] C. Wang, F. Wang, Q. Yang, R. Liang, Thermogravimetric studies of thebehavior of wheat straw with added coal during combustion, BiomassBioenergy 33 (1) (2009) 50–56.
[3] E. Biagini, F. Lippi, L. Petarca, L. Tognotti, Devolatilization rate of biomassesand coal–biomass blends: an experimental investigation, Fuel 81 (8) (2002)1041–1050.
[4] W. De Jong, G. Di Nola, B.C.H. Venneker, H. Spliethoff, M.A. Wójtowicz,TG-FTIR pyrolysis of coal and secondary biomass fuels: determination ofpyrolysis kinetic parameters for main species and NOx precursors, Fuel 86(15) (2007) 2367–2376.
[5] M. Sami, K. Annamalai, M. Wooldridge, Co-firing of coal and biomass fuelblends, Progress Energy Combust. Sci. 27 (2) (2001) 171–214.
[6] D. Vamvuka, E. Kakaras, E. Kastanaki, P. Grammelis, Pyrolysis characteristicsand kinetics of biomass residuals mixtures with lignite, Fuel 82 (15) (2003)1949–1960.
[7] D. Vamvuka, N. Pasadakis, E. Kastanaki, P. Grammelis, E. Kakaras, Kineticmodeling of coal/agricultural by-product blends, Energy Fuels 17 (3) (2003)549–558.
[8] Y. Guan, Y. Ma, K. Zhang, H. Chen, G. Xu, W. Liu, Y. Yang, Co-pyrolysisbehaviors of energy grass and lignite, Energy Conversion Manage. 93 (2015)132–140.
[9] S. Belosevic, Modeling approaches to predict biomass co-firing withpulverized coal, Open Thermodyn. J. 4 (2010) 50–70.
10] P. Gayan, J. Adanez, F. Luis, F. Garcııa-Labiano, A. Cabanillas, A. Bahillo, K.Veijonen, Circulating fluidised bed co-combustion of coal and biomass, Fuel83 (3) (2004) 277–286.
11] J. Porteiro, J. Collazo, D. Patino, E. Granada, J.C. Moran Gonzalez, J.L. Míguez,Numerical modeling of a biomass pellet domestic boiler, Energy Fuels 23 (2)(2009) 1067–1075.
12] P.R. Bonelli, E.L. Buonomo, A.L. Cukierman, Pyrolysis of sugarcane bagasse andco-pyrolysis with an Argentinean subbituminous coal, Energy Sources, Part A29 (8) (2007) 731–740.
13] A.M. Celaya, A.T. Lade, J.L. Goldfarb, Co-combustion of brewer’s spent grainsand Illinois No. 6 coal: impact of blend ratio on pyrolysis and oxidationbehavior, Fuel Process. Technol. 129 (2015) 39–51.
14] P. Yangali, A.M. Celaya, J.L. Goldfarb, Co-pyrolysis reaction rates andactivation energies of West Virginia coal and cherry pit blends, J. Analyt. Appl.Pyrol. 108 (2014) 203–211.
15] M.A. Abbassi, N. Grioui, K. Halouani, A. Zoulalian, B. Zeghmati, A practicalapproach for modelling and control of biomass pyrolysis pilot plant with heatrecovery from combustion of pyrolysis products, Fuel Process. Technol. 90(10) (2009) 1278–1285.
16] J. Cooper, W.L.H. Hallett, A numerical model for packed-bed combustion of
char particles, Chem. Eng. Sci. 55 (20) (2000) 4451–4460.17] A. Gungor, Simulation of co-firing coal and biomass in circulating fluidizedbeds, Energy Convers. Manage. 65 (2013) 574–579.
18] H. Zhou, A.D. Jensen, P. Glarborg, P.A. Jensen, A. Kavaliauskas, Numericalmodeling of straw combustion in a fixed bed, Fuel 84 (4) (2005) 389–403.
[
pplied Pyrolysis 124 (2017) 79–88 87
19] D. Shin, S. Choi, The combustion of simulated waste particles in a fixed bed,Combust. Flame 121 (1) (2000) 167–180.
20] N. Syred, K. Kurniawan, T. Griffiths, T. Gralton, R. Ray, Development offragmentation models for solid fuel combustion and gasification assubroutines for inclusion in CFD codes, Fuel 86 (14) (2007) 2221–2231.
21] Y.B. Yang, V.N. Sharifi, J. Swithenbank, Substoichiometric conversion ofbiomass and solid wastes to energy in packed beds, AIChE J. 52 (2) (2006)809–817.
22] S. Hermansson, H. Thunman, CFD modelling of bed shrinkage and channellingin fixed-bed combustion, Combust. Flame 158 (5) (2011) 988–999.
23] T. Beeley, Crelling, J. Gibbins, R. Hurt, M. Lunden, C. Man, J. Williamson, N.Y.C.Yang, Transient high-temperature thermal deactivation of monomaceral-richcoal chars, Twnenty-Sixth Symposium (International) on Combustion vol. 26(2) (1996) 3103–3110, Elsevier.
24] A. Gómez-Barea, P. Ollero, R. Arjona, Reaction-diffusion model of TGAgasification experiments for estimating diffusional effects, Fuel 84 (12) (2005)1695–1704.
25] S. Hu, J. Xiang, L. Sun, M. Xu, J. Qiu, P. Fu, Characterization of char from rapidpyrolysis of rice husk, Fuel Process. Technol. 89 (11) (2008) 1096–1105.
26] E.M. Ryan, A.M. Tartakovsky, C. Amon, Pore-scale modeling of competitiveadsorption in porous media, J. Contam. Hydrol. 120 (2011) 56–78.
27] C.B. Storlie, W.A. Lane, E.M. Ryan, J.R. Gattiker, D.M. Higdon, Calibration ofcomputational models with categorical parameters and correlated outputs viaBayesian smoothing spline ANOVA, J. Am. Stat. Assoc. 110 (509) (2015) 68–82.
28] I. Smith, The combustion rates of coal chars: a review, in: Symposium(International) on Combustion, vol. 19, No. 1, Elsevier, 1982, December, pp.1045–1065.
29] B. Peters, Validation of a numerical approach to model pyrolysis of biomassand assessment of kinetic data, Fuel 90 (6) (2011) 2301–2314.
30] C. Di Blasi, Heat, momentum and mass transport through a shrinking biomassparticle exposed to thermal radiation, Chem. Eng. Sci. 51 (7) (1996)1121–1132.
31] Y.B. Yang, V.N. Sharifi, J. Swithenbank, L. Ma, L.I. Darvell, J.M. Jones, A.Williams, Combustion of a single particle of biomass, Energy Fuels 22 (1)(2007) 306–316.
32] J. Pallarés, I. Arauzo, A. Williams, Integration of CFD codes and advancedcombustion models for quantitative burnout determination, Fuel 86 (15)(2007) 2283–2290.
33] M.A. Gómez, J. Porteiro, D. Patino, J.L. Miguez, CFD modelling of thermalconversion and packed bed compaction in biomass combustion, Fuel 117(2014) 716–732.
34] B. Peters, Classification of combustion regimes in a packed bed of particlesbased on the relevant time and length scales, Combust. Flame 116 (1) (1999)297–301.
35] J.J. Saastamoinen, M.J. Aho, V.L. Linna, Simultaneous pyrolysis and charcombustion, Fuel 72 (5) (1993) 599–609.
36] J. Saastamoinen, J.R. Richard, Simultaneous drying and pyrolysis of solid fuelparticles, Combust. Flame 106 (3) (1996) 288–300.
37] B. Peters, C. Bruch, A flexible and stable numerical method for simulating thethermal decomposition of wood particles, Chemosphere 42 (5) (2001)481–490.
38] A.O. Aboyade, J.F. Görgens, M. Carrier, E.L. Meyer, J.H. Knoetze,Thermogravimetric study of the pyrolysis characteristics and kinetics of coalblends with corn and sugarcane residues, Fuel Process. Technol. 106 (2013)310–320.
39] G. Agarwal, B. Lattimer, Physicochemical, kinetic and energetic investigationof coal–biomass mixture pyrolysis, Fuel Process. Technol. 124 (2014)174–187.
40] J.L. Goldfarb, S. Ceylan, Second-generation sustainability: application of thedistributed activation energy model to the pyrolysis of locally sourcedbiomass–coal blends for use in co-firing scenarios, Fuel 160 (2015) 297–308.
41] J.M. Jones, M. Kubacki, K. Kubica, A.B. Ross, A. Williams, Devolatilisationcharacteristics of coal and biomass blends, J. Analyt. Appl. Pyrol. 74 (1) (2005)502–511.
42] N.T. Weiland, N.C. Means, B.D. Morreale, Product distributions fromisothermal co-pyrolysis of coal and biomass, Fuel 94 (2012) 563–570.
43] S.L. Rowan, F. Wu, I.B. Celik, N.T. Weiland, Experimental investigation of chargenerated from co-pyrolysis of coal and Appalachian hardwoods, FuelProcess. Technol. 128 (2014) 354–358.
44] M. Van de Velden, J. Baeyens, A. Brems, B. Janssens, R. Dewil, Fundamentals,kinetics and endothermicity of the biomass pyrolysis reaction, RenewableEnergy 35 (1) (2010) 232–242.
45] K. Papadikis, A.V. Bridgwater, S. Gu, CFD modelling of the fast pyrolysis ofbiomass in fluidised bed reactors, Part a: Eulerian computation of momentumtransport in bubbling fluidised beds, Chem. Eng. Sci. 63 (16) (2008)4218–4227.
46] K. Papadikis, S. Gu, A.V. Bridgwater, CFD modelling of the fast pyrolysis ofbiomass in fluidised bed reactors, Part B: heat, momentum and masstransport in bubbling fluidised beds, Chem. Eng. Sci. 64 (5) (2009) 1036–1045.
47] K. Papadikis, S. Gu, A.V. Bridgwater, CFD modelling of the fast pyrolysis ofbiomass in fluidised bed reactors: modelling the impact of biomass shrinkage,
Chem. Eng. J. 149 (1–3) (2009) 417–427.48] H. Marsh, W.F.K. Wynne-Jones, The surface properties of carbon. I. The effectof activated diffusion in the determination of surface area, Carbon 1 (3)(1964) 267–279.

8 and A
[
[
[
[
[
[
[
[
[
[
[
[
[
[
[
[
[
[
[
[
[
[
[
[
[
[
[
[
[
8 A. Vyas et al. / Journal of Analytical
49] S.J. Gregg, K.S.W. Sing, Adsorption, Surface Area and Porosity, Academic Press,New York, 1982.
50] F.A. Rodríguez-Reinoso, Linares-Solano in Chemistry and Physics of Carbon,vol. 21, Thrower, P.A. Ed. Dekker, New York, 1989.
51] H. Haykiri-Acma, S. Yaman, S. Kucukbayrak, Does carbonization avoidsegregation of biomass and lignite during co-firing? Thermal analysis study,Fuel Process. Technol. 137 (2015) 312–319.
52] H. Haykiri-Acma, S. Yaman, Interaction between biomass and different rankcoals during co-pyrolysis, Renewable Energy 35 (1) (2010) 288–292.
53] C. Di Blasi, Numerical simulation of cellulose pyrolysis, Biomass Bioenergy 7(1) (1994) 87–98.
54] D.M. Quyn, H. Wu, J.I. Hayashi, C.Z. Li, Volatilisation and catalytic effects ofalkali and alkaline earth metallic species during the pyrolysis and gasificationof Victorian brown coal. Part IV. Catalytic effects of NaCl andion-exchangeable Na in coal on char reactivity, Fuel 82 (5) (2003) 587–593.
55] G.S. Miguel, G.D. Fowler, C.J. Sollars, Pyrolysis of tire rubber: porosity andadsorption characteristics of the pyrolytic chars, Ind. Eng. Chem. Res. 37 (6)(1998) 2430–2435.
56] W. Buss, O. Masek, M. Graham, D. Wüst, Inherent organic compounds inbiochar—their content, composition and potential toxic effects, J. Environ.Manage. 156 (2015) 150–157.
57] W. Buss, O. Masek, Mobile organic compounds in biochar—a potential sourceof contamination—phytotoxic effects on cress seed (Lepidium sativum)germination, J. Environ. Manage. 137 (2014) 111–119.
58] M. Cordella, C. Torri, A. Adamiano, D. Fabbri, F. Barontini, V. Cozzani, Bio-oilsfrom biomass slow pyrolysis: a chemical and toxicological screening, J.Hazard. Mater. 231 (2012) 26–35.
59] M.J. Gundale, T.H. DeLuca, Charcoal effects on soil solution chemistry andgrowth of Koeleria macrantha in the ponderosa pine/Douglas-fir ecosystem,Biol. Fertil. Soils 43 (3) (2007) 303–311.
60] K.A. Spokas, J.M. Novak, C.E. Stewart, K.B. Cantrell, M. Uchimiya, M.G. DuSaire,K.S. Ro, Qualitative analysis of volatile organic compounds on biochar,Chemosphere 85 (5) (2011) 869–882.
61] L. Fagernäs, E. Kuoppala, P. Simell, Polycyclic aromatic hydrocarbons in birchwood slow pyrolysis products, Energy Fuels 26 (11) (2012) 6960–6970.
62] D. Fabbri, A.G. Rombolà, C. Torri, K.A. Spokas, Determination of polycyclicaromatic hydrocarbons in biochar and biochar amended soil, J. Analyt. Appl.
Pyrol. 103 (2013) 60–67.63] S.E. Hale, J. Lehmann, D. Rutherford, A.R. Zimmerman, R.T. Bachmann, V.Shitumbanuma, A. O’Toole, K.L. Sundqvist, H.P.H. Arp, G. Cornelissen,Quantifying the total and bioavailable polycyclic aromatic hydrocarbons anddioxins in biochars, Environ. Sci. Technol. 46 (5) (2012) 2830–2838.
[
[
pplied Pyrolysis 124 (2017) 79–88
64] S. Krerkkaiwan, C. Fushimi, A. Tsutsumi, P. Kuchonthara, Synergetic effectduring co-pyrolysis/gasification of biomass and sub-bituminous coal, FuelProcess. Technol. 115 (2013) 11–18.
65] H. Haykiri-Acma, S. Yaman, Synergy in devolatilization characteristics oflignite and hazelnut shell during co-pyrolysis, Fuel 86 (3) (2007) 373–380.
66] C.A. Ulloa, A.L. Gordon, X.A. García, Thermogravimetric study of interactionsin the pyrolysis of blends of coal with radiata pine sawdust, Fuel Process.Technol. 90 (4) (2009) 583–590.
67] T. Sonobe, N. Worasuwannarak, S. Pipatmanomai, Synergies in co-pyrolysis ofThai lignite and corncob, Fuel Process. Technol. 89 (12) (2008) 1371–1378.
68] D.K. Park, S.D. Kim, S.H. Lee, J.G. Lee, Co-pyrolysis characteristics of sawdustand coal blend in TGA and a fixed bed reactor, Bioresource Technol. 101 (15)(2010) 6151–6156.
69] I. Aarna, E.M. Suuberg, Changes in reactive surface area and porosity duringchar oxidation, in: Symposium (International) on Combustion, vol. 27, No. 2,Elsevier, 1998, December, pp. 2933–2939.
70] S. Dutta, C.Y. Wen, R.J. Belt, Reactivity of coal and char. 1. In carbon dioxideatmosphere, Ind. Eng. Chem. Process Des. Dev. 16 (1) (1977) 20–30.
71] T. Adschiri, T. Furusawa, Relation between CO2-reactivity of coal char and BETsurface area, Fuel 65 (7) (1986) 927–931.
72] R.H. Hurt, A.F. Sarofim, J.P. Longwell, The role of microporous surface area inthe gasification of chars from a sub-bituminous coal, Fuel 70 (9) (1991)1079–1082.
73] Fundamental Issues in Control of Carbon Gasification Reactivity, in: K.H. vanHeek, H.-J. Mühlen, J. Lahaye, P. Ehrburger (Eds.), Kluwer, Boston, 1991.
74] K. Miura, K. Hashimoto, P.L. Silveston, Factors affecting the reactivity of coalchars during gasification, and indices representing reactivity, Fuel 68 (11)(1989) 1461–1475.
75] R. Cyprès, D. Planchon, C. Braekman-Danheux, Evolution of pore structure andactive surface areas of coal and char during hydrogenation, Fuel 64 (10)(1985) 1375–1378.
76] P.R. Patwardhan, J.A. Satrio, R.C. Brown, B.H. Shanks, Influence of inorganicsalts on the primary pyrolysis products of cellulose, Bioresource Technol. 101(12) (2010) 4646–4655.
77] S.W. Banks, D.J. Nowakowski, A.V. Bridgwater, Impact of potassium andphosphorus in biomass on the properties of fast pyrolysis bio-oil, EnergyFuels 30 (10) (2016) 8009–8018.
78] G. Dou, J.L. Goldfarb, In situ upgrading of pyrolysis biofuels by bentonite claywith simultaneous production of heterogeneous adsorbents for watertreatment, Fuel 195 (2017) 273–283.
79] NIST/SEMATECH e-Handbook of Statistical Methods, http://www.itl.nist.gov/div898/handbook, accessed 7 August 2015.