journal of contaminant hydrology - pc-progress · (e.g. gonçalves et al., 2006; ramos et al.,...
TRANSCRIPT

Journal of Contaminant Hydrology 142–143 (2012) 109–125
Contents lists available at SciVerse ScienceDirect
Journal of Contaminant Hydrology
j ourna l homepage: www.e lsev ie r .com/ locate / jconhyd
Inverse optimization of hydraulic, solute transport, and cation exchangeparameters using HP1 and UCODE to simulate cation exchange
Diederik Jacques a,⁎, Chris Smith b, Jiří Šimůnek c, David Smiles b
a Institute for Environment, Health, and Safety, Belgian Nuclear Research Centre (SCK•CEN), Mol, Belgiumb CSIRO Land and Water, Canberra, ACT, Australiac University of California Riverside, Riverside, CA, USA
a r t i c l e i n f o
⁎ Corresponding author.E-mail address: [email protected] (D. Jacque
0169-7722/$ – see front matter © 2012 Elsevier B.V. Adoi:10.1016/j.jconhyd.2012.03.008
a b s t r a c t
Article history:Received 21 November 2011Received in revised form 15 March 2012Accepted 30 March 2012Available online 5 April 2012
Reactive transport modeling is a powerful tool to evaluate systems with complex geochemicalrelations. However, parameters are not always directly measurable. This study represents oneof the first attempts to obtain hydrologic, transport and geochemical parameters from anexperimental dataset involving transient unsaturated water flow and solute transport, using anautomatic inverse optimization (or calibration) algorithm. The data come from previouslypublished, controlled laboratory experiments on the transport of major cations (Na, K, Mg, Ca)during water absorption into horizontal soil columns that were terminated at different times.Experimental data consisted of the depth profiles of water contents (θ), Cl concentrations, andtotal aqueous and sorbed concentrations of major cations. The dataset was used to optimizeseveral parameters using the reactive transport model, HP1 and the generic optimization code,UCODE. Although the soil hydraulic and solute transport parameters were also optimized, thestudy focused mainly on the geochemical parameters because the soil columns wereconstructed from disturbed soil. The cation exchange capacity and the cation exchangecoefficients for two exchange models (Gapon and Rothmund–Kornfeld) were optimized. Theresults suggest that both calibrated models satisfactorily described the experimental data,although the Rothmund–Kornfeld model fit was slightly better. However, information contentand surface response analyses indicated that parameters of the Gapon model are wellidentifiable, whereas those of the Rothmund–Kornfeld model were strongly correlated. Thecalibrated geochemical parameters were validated using an independent dataset. In agreementwith the identifiability analysis, the Gapon approach was better than the Rothmund–Kornfeldmodel at calculating the observed concentrations ofmajor cations in the soil solution and on theexchange sites.
© 2012 Elsevier B.V. All rights reserved.
Keywords:FertilizationCoupled reactive transportUnsaturated water flowCalibration
1. Introduction
Various human activities, such as irrigation of agricul-tural lands, may alter the geochemistry of soil systems(e.g. Gonçalves et al., 2006; Ramos et al., 2011). In this study,we evaluate data collected for the analysis of the wet flushsystem for intensive piggeries. Such systems produce large
s).
ll rights reserved.
volumes of effluent from the urine, feces and waste feed. InAustralia, irrigation with treated effluent is the most produc-tive way to utilize this waste product. In addition to highnutrient content, the effluents also contain high concentra-tions of K and Na (Smiles and Smith, 2004a,b). Potassium isbecoming the dominant monovalent ion released into theenvironment, as piggery operators, concerned about theeffects of Na on soil properties, have replaced Na with Ksalts in the feed. The use of the K-rich effluent for irrigationhas increased K concentrations in the soil solution and on thecation exchange sites (Smiles and Smith, 2004a).

110 D. Jacques et al. / Journal of Contaminant Hydrology 142–143 (2012) 109–125
In principle, the fate of cations in solution and sorbed bysoils under natural conditions can be predicted using modelsthat simulate variably-saturated water flow and solutetransport, while considering reaction chemistry and/or chro-matographic theory. Examples are LEACHM (Hutson andWagenet, 1992) and/or HP1 (Jacques et al., 2006), whichcouples HYDRUS-1D (Šimůnek et al., 2008a) with PHREEQC(Parkhurst and Appelo, 1999). However, the use of suchcomplex numerical models requires specification of a largenumber of soil hydraulic, solute transport, and biogeochem-ical reaction input parameters. In the application involvingirrigation with piggery effluent, cation exchange parametersare of particular interest. Several approaches exist to obtainthese parameters. For example, the competitive exchange ofNa, K, and Ca during absorption by initially homoionic soilswas studied by Bond and Phillips (1990a,b), Bond (1997), andBond and Verburg (1997). In other studies, cation exchangeparameters were estimated or calibrated using detailed infor-mation on binary sorption isotherms and then applied toternary (ormultication) transport experiments (e.g., Voegelinet al., 2000, 2001; Vulava et al., 2000). Alternately, Appelo andPostma (2005; pages 252–260) outlined an approach inwhich cation exchange can be modeled without the need ofprior knowledge of the adsorption isotherms for each pair ofcompeting cations in the presence of all the others.
In this study, we propose to obtain flow, transport, andgeochemical parameters by calibrating an appropriate modelagainst experimental data involving reactive transport underunsaturated transient conditions in natural soils. Suitabledatasets for such analysis are rarely available (e.g., Mansell etal., 1993). The experimental data of Smiles and Smith(2004b), involving water absorption with piggery effluentinto initially unsaturated soil columns, provided detailedprofiles of water contents and aqueous and sorbed concen-trations. This dataset gives us the opportunity to investigatethe use of inverse optimization to estimate geochemicalparameters.
The use of parameter estimation techniques is well-established for determining soil hydraulic properties (e.g.,Hopmans et al., 2002; Vrugt et al., 2008) or basic solutetransport and reaction parameters (e.g., Šimůnek et al., 2002,2008b; and references given there). This approach has beenwidely used for various laboratory and field experiments.Estimation of soil hydraulic properties typically requirestransient, variably-saturated flow experiments and numericalmodels such as HYDRUS-1D. On the other hand, solutetransport parameters are often derived from column experi-ments under steady-state water flow conditions (e.g., Nkedi-Kizza et al., 1984). Analytical solutions of the transportequations are then fitted to experimental breakthrough curvesby using parameter estimation codes such as CXTFIT (Toride etal., 1995) or STANMOD (Šimůnek et al., 2008b). Obtainingsolute transport parameters for conditions for which noanalytical solutions exist, such as for transient flow conditionsand/or nonlinear biogeochemical reactions such as adsorptionor cation exchange, can be accomplished only using numericalsolutions (Dai and Samper, 2004; Šimůnek et al., 2002, 2008b).
The current study represents one of the first attempts toobtain soil hydrologic, transport, and geochemical parame-ters with an automatic inverse optimization algorithm andexperimental data obtained under transient water flow
conditions. This is accomplished using the universal optimi-zation code UCODE (Poeter et al., 2005) with the numericalmodel HP1. The previously acquired experimental dataset ofSmiles and Smith (2004b) is used to calibrate: i) the soilhydraulic parameters of the van Genuchten–Mualem model(van Genuchten, 1980); ii) the solute transport parameters(dispersivity); and, most importantly, iii) the geochemicalparameters (major cation exchange coefficients). The iden-tifiability of the cation exchange parameters is investigatedfor the presented experimental setup by analyzing parametersensitivities and response surfaces.
2. Material and methods
2.1. Experimental setup
Two laboratory experimental datasets were used in thisstudy. In the first set of experiments, soil columns wereplaced in contact with an artificial piggery effluent (Smilesand Smith, 2004b). Because of the destructive nature ofutilized methods, three soil columns were prepared tomeasure concentration profiles at three different times.Data collected at these three columns were used to calibrateflow, transport, and exchange parameters. The seconddataset was obtained from a series of experiments, in whichtwo soil columns were placed in contact with gypsum-saturated solutions (Smiles and Smith, 2008). This datasetwas used to validate optimized parameters.
Details of the method used to produce the first dataset aregiven in Smiles and Smith (2004b). In brief, the topsoil(0–100 mm) from a Deep Red Chromosol [site 5 of Smilesand Smith, 2004a] was used. The soil had not previously beenirrigated with piggery effluent. The soil contains 15–20% clay(by mass) and has a cation exchange capacity (CEC) of46 mmolc/kg. This is equal to a CEC value of 0.077±0.002molc/dm3, providing the average soil bulk density was1.68±0.05 kg/dm3. More information on the soil is given inSmiles and Smith (2004a).
In the first set of laboratory experiments, sieved soil(b2-mm) with a water content (θi) of ≈0.05 g/g was packedinto acrylic columns with a 20-mm internal diameter and20 cm long. The columns were made from sections 4, 6, and10 mm long with the shortest sections close to the inflowend. The soil was added in increments of 2–3 g and packedusing a small drop hammer to ensure uniformity. Theresulting soil bulk density was 1.68±0.05 kg/dm3 through-out the column. A solution with a cation composition similarto piggery effluent, but with Cl− as the sole anion, wasapplied at zero water potential to one end of the horizontalcolumn. The artificial effluent had the following composition:Na=10 mmolc/L; K=20.1 mmolc/L; Ca=4.69 mmolc/L, andCl=35 mmolc/L (Smiles and Smith, 2004b). The pH of theartificial effluent was 7.7. Initial pore water concentrationsin the columns were: Na=5mmolc/L, K=2mmolc/L,Ca=40 mmolc/L, Mg=8mmolc/L, and Cl=4mmolc/L.
The experiments were terminated by sectioning thecolumns after 36, 106, and 144 min. Each moist section wasweighed and a water sample was removed by centrifuging inthe presence of 5 cm3 of 1,1,2-trichloro-1,2,2-trifluoro ethanethat had a specific gravity of 1.57 (Phillips and Bond, 1989).The soil sample was washed with glycerated alcohol to

111D. Jacques et al. / Journal of Contaminant Hydrology 142–143 (2012) 109–125
remove excess water-soluble cations, and then exchangeablecations were extracted with 1 M NH4Cl. After washing withalcohol, the CEC was estimated by measuring the remainingNH4
+ (Rayment and Higginson, 1992).Water-soluble cations were measured by inductively
coupled plasma spectroscopy (ICP) of the water sampleafter diluting a small volume of soil solution (0.2–0.5 cm3) to10 cm3. Exchangeable cations were measured in the NH4Clextract by atomic absorption spectroscopy (AAS). The NH4
+
representing the exchange capacity was measured using anautoanalyser (Rayment and Higginson, 1992). Dilutions weretracked gravimetrically and all quantities were referred tothe oven-dry weight of soil in each section, which wasmeasured by oven drying following all extractions.
The second dataset is from Smiles and Smith (2008).Briefly, the acrylic columns used in the first series ofexperiment were packed with potassic soil to a bulk densityof 1.76±0.2 kg/dm3. This soil was the same as the one usedto develop the optimized geochemical parameters, exceptthat it had been irrigated with K-rich piggery effluent andthus had a high exchangeable K ratio. A gypsum-saturatedsolution was then applied at one end of the horizontalcolumns from a Mariotte bottle set at a small suction(~5 mm), and the experiments were terminated after 200and 400 min. The gypsum solution consisted of 24 mmolc/Lof Ca and 24 mmolc/L of S(6). The initial soil solutionconcentrations were: 28 mmolc/L of Na, 30 mmolc/L of K,40 mmolc/L of Ca, 9 mmolc/L, and 13 mmolc/L of Cl. Theexperimental methods were the same as in the first set ofexperiments.
2.2. Model description
Modeling the transport of major cations through the soilcores involves modeling the following processes: a) waterflow; b) solute transport (advection and dispersion); andc) geochemical reactions (aqueous complexation and cationexchange).
Water absorption is modeled using a numerical solutionof the Richards equation, which requires knowledge of thewater retention curve (the relation between the watercontent θ [cm3 cm−3] and the pressure head h [cm]), andthe unsaturated hydraulic conductivity function (the relationbetween the hydraulic conductivity K [cm min−1] and thepressure head). These nonlinear relations are parameterizedusing the closed-form system of equations proposed by vanGenuchten (1980):
θ hð Þ ¼ θr þθs−θr
1þ αhj jnð Þm ð1Þ
K hð Þ ¼ KsSle 1− 1−S1=me
� �mh i2: ð2Þ
These equations have six adjustable parameters: thesaturated water content θs [cm3 cm−3], the residual watercontent θr [cm3 cm−3], two shape parameters α [cm−1] andn [−], the saturated hydraulic conductivity Ks [cmmin−1], anda pore-connectivity and tortuosity factor l [−]. The degree of
saturation Se and the parameterm are obtained from the otherparameters: Se=(θ−θr)/(θs−θr) and m=1−1/n.
Transport of the aqueous components (that is, the totalaqueous concentration of an element) is described with theadvection–dispersion equation:
∂θCi
∂t ¼ ∂∂x θDw ∂Ci
∂x
� �−∂qCi
∂x þ Ri ð3Þ
where t is time [min], x is spatial distance [cm], i (=1,…,Nm)is the aqueous component number (Nm is the total number ofaqueous components), Ci is the total aqueous concentrationof the ith component [mol cm−3], q is the volumetric fluxdensity [cm min−1], Dw is the dispersion coefficient in theliquid phase [cm2 min−1], and Ri is the general source/sinkterm due to geochemical reactions [cm cm−3 min−1]. Ingeneral, this sink/source term (Ri) contains heterogeneous(between different phases) equilibrium reactions and homo-geneous (within one phase) and heterogeneous kineticreactions. In the current study, only heterogeneous equilib-rium reactions are accounted for. The dispersion coefficient isdefined as:
θDw ¼ λ qj j þ θDw0τw ð4Þ
where Dw0 is the molecular diffusion of aqueous componentsin free water [cm2min−1], λ is the longitudinal dispersivity[cm], and τw is a tortuosity factor in the liquid phase [−],calculated using the model of Millington and Quirk (1961):
τw ¼ θ7=3
θ2s: ð5Þ
In the multicomponent transport model described above(Eqs. (3)–(5)), only one unknown transport parameter(i.e., the dispersivity, λ) is needed to characterize the flowfield.
Two geochemical processes were considered in thecurrent study: aqueous speciation reactions and cationexchange. The former is described by a set of aqueouscomplexation reactions and corresponding mass actionconstants. The phreeqc.dat database (Parkhurst and Appelo,1999) is used for the aqueous complexation reactions, themass action constants, and activity correction models.
The relation between the concentrations of ions in thepore water and on the surface exchange sites may bedescribed using the Gapon convention (Appelo and Postma,2005). The equation of the exchange reaction on surface siteX, involving cations N and M, with charges of n and mrespectively, is:
N1=nXþ 1=mMmþ ¼ M1=mXþ 1=nNnþ: ð6Þ
The selectivity coefficient KGMN is given:
KGMN ¼M1=mXh i
Nnþ� �1=nN1=nXh i
Mmþ½ �1=mð7Þ
where the square brackets [] represent activities. The activity ofeach exchangeable species is equal to its equivalent fraction.Here the subscript G refers to the Gapon formulation.
112 D. Jacques et al. / Journal of Contaminant Hydrology 142–143 (2012) 109–125
An alternative exchange convention is the Rothmund–Kornfeld equation (Bloom and Mansell, 2001; Bond, 1995).For exchange reactions written as:
mNXn þ nMm ¼ nMXm þmNn ð8Þ
the selectivity coefficient, KRKMN, is defined as:
KRKMN ¼ MXm½ �nNXn½ �m
Nn� �mMm½ �n
!NMN
ð9Þ
where NMN is an empirical exponent for the activity ratio ofthe aqueous species. This exponent enables the model todescribe sigmoidal shapes of binary isotherms, which reflectthe sorption of species to strong-binding sites when concen-trations of one of the species is low (Appelo and Postma,2005).
2.3. Simulation tool
The HP1 code (Jacques et al., 2006, 2008a,b; Šimůnek etal., 2006, 2009) was used as the simulator to solve thecoupled flow, transport, and geochemical problem. HP1(version 2.3) couples the water flow, multiple solutetransport and heat transport code HYDRUS-1D (Šimůnek etal., 2008a) with the geochemical equilibrium and kineticcode PHREEQC (version 2.17.5) (Parkhurst and Appelo,1999). The transport simulator solves the water flow andsolute transport equations, whereas the geochemical simu-lator calculates chemical speciation in the aqueous phase andon the exchange complexes.
The Gapon exchange reactions are defined as half re-actions (X−+1/m Mm+=M1/mX with a thermodynamicconstant KGM) relative to a reference half reaction (inPHREEQC; the half reaction with Na has log KGNa=0). Notethat each Gapon exchange reaction (Eq. (6)) can be writtenas a linear combination of the defined half reactions (given inAppendix 1). As such, the thermodynamic constants of thehalf reactions for the other cations are related to the Gaponselectivity coefficient as log KGMN=log KGM− logKGN. TheRothmund–Kornfeld equation is implemented followingexample 6.6 in Appelo and Postma (2005) (see alsoAppendix 1).
2.4. Inverse optimization
Unknown parameters of the described model are: θs, θr, α,n, Ks, l, λ, KGK, KGCa, KGMg, and CEC for the Gapon approach;and θs, θr, α, n, Ks, l, λ, KRKKNa, KRKCaNa, KRKMgNa, NKNa, NCaNa,NMgNa and CEC for the Rothmund–Kornfeld approach. Theseparameters are estimated using the measured profiles ofwater contents, Cl concentrations, aqueous Na, K, Ca, and Mgconcentrations, and sorbed Na, K, Ca, and Mg concentrations,by minimizing the sum of squared differences betweenobservations and corresponding simulated values.
A sequential parameter estimation procedure is used here.HYDRUS-1D alone is used first to estimate the soil hydraulicand solute transport parameters because the flow andtransport simulator of HP1 is essentially identical to theHYDRUS-1D code. The inverse optimization algorithm basedon the Levenberg–Marquardt nonlinear minimization method
(Marquardt, 1963) embedded within HYDRUS-1D is used forthis purpose. In the next step, the geochemical parameters areestimated by HP1 using the model-independent optimizationtool, UCODE (Poeter et al., 2005). The objective function isobtained as a weighted sum of squared differences (SSD)between observations and experimental data. Weights aredefined to minimize differences in weighting between differ-ent data types (Clausnitzer and Hopmans, 1995):
wj ¼1
njσ jð10Þ
wherewj is theweight for the jth data point, nj is the number ofobservations for a given data type and σj is the measurementvariance within a given data type. Twenty four different datatypes are used when optimizing cation exchange parameters:aqueous and sorbed concentration profiles of four cations atthree times.
The initial and boundary conditions used in the modelingexercise were as follows: the initial volumetric water contentwas 0.084 cm3cm−3, the volumetric water content at the inletof the column was set to 0.305 cm3 cm−3 (inferred from theexperimental data close to the inlet end of the horizontalcolumn), and the outlet boundary was set to free drainage. Theinitial estimate of CEC of the soil was 0.085 mol/dm3. In thisparticular example, the initial estimate of CEC is not criticalsince this parameter is well-defined, as discussed below in thesection “Response surface analysis of the objective function”.Cation exchange capacity was optimized since the bulk density(and thus CEC) varied slightly within and between soilcolumns. One additional optimization was also carried outwithout fitting CEC to evaluate if the use of the measured CEChas an effect on fitted selectivity coefficients. The initialestimates of the Gapon selective coefficients for Ca/Na, Ca/K,and Ca/Mg exchange were KGCaNa=2.9, KGCaK=0.2, andKGCaMg=1.2 respectively, as the middle values of the rangesgiven in MDH (2003). Because of the lack of additionalinformation, the same initial values were also used for theRothmund–Kornfeld selectivity coefficients and n was initiallyset at 0.7, 0.9 and 0.9 for nKNa, nCaNa, and nMgNa, respectively.
It is important to emphasize that the hydraulic and solutetransport parameters are fitted only to reproduce the waterflow and solute transport conditions so that the reactiveconstants could be determined from these transient exper-iments. Because the experiments were done for disturbedsoils, these parameters may not be representative ofundisturbed soil conditions. As such, uniqueness and corre-lation between the hydraulic and transport parameters (seeparameter identifiability) are not further assessed here. Thereader is referred to other studies on identifiability ofhydraulic and transport parameters (e.g., Šimůnek and vanGenuchten, 1996; Toorman et al., 1992).
2.5. Parameter identifiability
Identification of parameters using an inverse optimizationapproach requires that there is enough information in theexperimental data to obtain unique and/or well-definedparameters. Two types of analysis were performed in orderto investigate the identifiability of the cation exchangeparameters in this particular experimental set up. The first

Fig. 1. Simulated [lines] profiles of water contents (a) and chlorideconcentrations (b) compared to experimental data [symbols] from waterabsorption and solute transport experiments with piggery effluent (Smilesand Smith, 2004b).
113D. Jacques et al. / Journal of Contaminant Hydrology 142–143 (2012) 109–125
analysis uses dimensionless and composite scaled sensitivi-ties. The dimensionless scaled sensitivity of the ith observa-tion and jth parameter, dssji, is defined as (Hill and Tiedeman,2007):
dssji ¼∂yj∂bi
!b bij jw1=2
j
��� ð11Þ
where yj is the simulated value corresponding to a givenobservation, bi is the ith estimated parameter, b is the vector,which contains the parameter values at which the sensitiv-ities are evaluated, andwj is the weight of the jth observationpoint as defined above. The sensitivity is the derivative of thesimulated value with respect to the parameter bi. It providesinformation on the relative importance of an observation tothe estimation of a single parameter, compared to the otherobservations. Larger values of dssji indicate observationscontaining more information. Alternatively, the dimension-less scaled sensitivity also provides a measure that comparesthe relative importance of a given parameter for a givensimulated value. The information content of different sets ofdata types is quantified by taking the sum of the absolutevalues of the dimensionless scaled sensitivities. The averagevalue is used to compare the different data types (e.g., profilesat a given time of the aqueous or sorbed concentrations, orthe sum of the three profiles for a given aqueous or sorbedspecies).
The composite-scaled sensitivity for the ith parameter(cssi) is calculated as (Hill and Tiedeman, 2007):
cssi ¼XNobs
j¼1
dssji� �2
b=Nobs
�����#1=2"
ð12Þ
where Nobs is the number of observations.The composite-scaled sensitivity provides a means to
evaluate the amount of information in all experimental datato estimate a given parameter. For example, Friedel (2005)interpreted css for different combinations of data types in acoupled water–heat–solute transport model.
The second analysis is based on the evaluation of responsesurfaces (e.g., Šimůnek and van Genuchten, 1996; Toormanet al., 1992). A response surface is a two-dimensional plot ofthe objective function obtained by varying two parameters,usually on a regular grid (80×80 in this study), whilekeeping the other parameters at their fitted values. Sinceonly the cation exchange parameters are included in thisanalysis, there are 6 contour plots for the Gapon approachand 21 plots for the Rothmund–Kornfeld approach.
3. Result and discussion
Experimental data from Smiles and Smith (2004b) arepresented in Fig. 1 (water contents and chloride concentra-tions) and in Fig. 2 (aqueous and sorbed cation concentra-tions). Note that due to the large scatter in the 36-minute Kand Cl concentrations (attributed to the contamination of soilsamples), these data were discarded from the fittingprocedure. The data are plotted as a function of theBoltzmann variable (distance/time0.5) because, for the givenboundary conditions, water content and ion concentration
profiles should coalesce to a single curve when graphed interms of the Boltzmann variable (Smiles and Smith, 2004b).For a full interpretation of the experimental dataset, thereader is referred to that study. Only the key findings arelisted below in order to facilitate interpretation of modeledexperimental results. The piston front (the location in thecolumn where the infiltrating solution completely displacesthe initial water) is between 0.75 and 0.85 cm/min0.5 (seeSmiles and Smith, 2004b). Non-reactive solutes (such as Cl)should have the center of their diffusive front around thislocation (Fig. 1b). A change in aqueous concentrations of thereactive cations (Mg and Ca in Fig. 2c and d) around thepiston front occurs without any noticeable change in sorbedconcentrations. This is because of the concentration differ-ences between the initial solution (the total sum of cations isabout 35 mmolc/L) and the infiltrating solution (the totalsum of cations is about 60 mmolc/L). Across the piston front,the cation ratios are buffered by the exchange processes sothat the total concentration adjusts while the sorbed andaqueous cation ratios appear to stay constant. Concentrationchanges around the piston front are thus associated with the


Table 1Estimated parameter values and linear 95% confidence intervals (CI) for theGapon approach.
Parameter Finalvalue
Upper95% CI
Lower95% CI
Standarddeviation
Optimization with estimated CECLog KGK 0.91 0.96 0.85 0.027Log KGCa 0.56 0.59 0.53 0.015Log KGMg 0.16 0.19 0.12 0.018CEC (mol/dm³) 0.072 0.073 0.071 5.4×10⁻⁴
Optimization with fixed CECa
Log KGK 0.99 1.05 0.93 0.029Log KGCa 0.56 0.60 0.53 0.016Log KGMg 0.19 0.22 0.15 0.018
a The value of CEC was fixed at 0.077 mol/dm3.
Table 2Estimated parameter values and linear 95% confidence intervals (CI) for theRothmund–Kornfeld approach.
Parameter Finalvalue
Upper95% CI
Lower95% CI
Standarddeviation
Log KRKKNa 1.14 1.18 1.10 0.010Log KRKCaNa 1.85 1.98 1.72 0.069Log KRKMgNa 1.27 1.42 1.12 0.076NKNa 0.307 0.383 0.230 0.039NCaNa 0.717 0.784 0.647 0.035NMgNa 0.843 0.929 0.756 0.044CEC (mol/dm³) 0.079 0.081 0.079 7.9×10⁻⁴
115D. Jacques et al. / Journal of Contaminant Hydrology 142–143 (2012) 109–125
displacement of the initial solution. In the region where theBoltzmann variable is smaller than 0.25 cm/min0.5, typicalcation exchange reactions occur, during which Na and Kreplaces Ca and Mg. Since all experimental curves coalesce inthis region after applying the Boltzmann transformation, theexchange processes are in chemical equilibrium (i.e., time-scales for chemical reactions are short relative to time-scalesof solute movement).
3.1. Optimization results
Fig. 1 compares the water content (θ) and chlorideconcentration profiles measured during the experimentswith the optimized model predictions. Both the Richardsequation and the advection–dispersion equation were able toreproduce very well the experimental water content andchloride profiles, respectively. Note that the simulated Clprofiles are a slightly ahead of the experimental data aroundthe piston front. Fitted parameters are θs=0.307 cm3 cm−3,α=0.230 cm−1, n=1.45, Ks=0.157 cm min−1, l=0.99, andλ=0.0694 cm.
The modeled profiles of the major cations in the aqueousand sorbed phases for the three times are compared to themeasured data in Fig. 2. In general, both approaches are ableto describe the experimental data reasonably well, althougheach model missed some particularities of the experimentaldata.
Fitted parameters are given in Tables 1 and 2 for theGapon and the Rothmund–Kornfeld approaches, respectively.The weighted sum of squared differences (SSD) is about 20%lower for the Rothmund–Kornfeld approach than for theGapon approach. The lower SSD for the Rothmund–Kornfeldapproach is to be expected, because of the higher number ofadjustable parameters in the geochemical model (7 versus 4in the Gapon approach). Nevertheless, both the Akaike'sinformation criterion (AIC) and the Bayesian informationcriterion (BIC) (Hill and Tiedeman, 2007) are also lower forthe Rothmund–Kornfeld approach (−959 and −926 for AICand BIC, respectively) than for the Gapon approach (−875
Fig. 2. Simulated profiles of aqueous (a–d) and sorbed (e–h) cation concentrationsapproach [dashed lines] compared to experimental data [symbols] from water absSmith, 2004b).
and −855 for AIC and BIC, respectively). The differencebetween the two approaches is sufficiently large enough(Burnhum and Anderson, 2004) to give preference to theRothmund–Kornfeld model. Based on the SSD, AIC, and BIC,the Rothmund–Kornfeld model fits the experimental databetter than the Gapon model.
The Gapon approach was additionally used to optimizethe exchange constants while setting CEC equal to themeasured value (0.077 mol/dm3). Fitted values are againgiven in Table 1. The aqueous concentrations were almostidentical to those obtained when the CEC was optimized. Thelargest differences were in the initial sorbed Ca and Mgconcentrations, which were about 6.5 and 13% higher,respectively, when the CEC was not optimized. However,the 95% confidence intervals of the three exchange param-eters obtained using the two approaches (optimized andfixed CEC) overlap.
The fitted CEC was 0.072 and 0.079 mol/dm3 for theGapon and the Rothmund–Kornfeld approaches, respectively.These values are, respectively, slightly lower and greater thanthe measured CEC of 0.077±0.002 mol/dm3. The linear 95%confidence interval (CI) of the CEC is small, which indicates awell-defined value. Note that the measured CEC falls withinthe 95% confidence interval of the CEC estimated using theRothmund–Kornfeld approach, but not the Gapon approach.Correlation coefficients of the CEC with the other parametersare all less than 0.1 in both approaches (Table 3).
The correlation coefficients for other parameters in theGapon approach were also relatively small, with only onebeing larger than 0.75 (between log KGCa and log KGMg). Eachcorrelation coefficient between two log KGM was positive(Table 3). The parameters of the Gapon exchange equations,calculated from the fitted half-reaction constants, were:KGCaNa=3.55, KGCaK=0.46, and KGCaMg=2.51. Uncertaintyof the estimated parameters was slightly larger in theRothmund–Kornfeld approach, as evidenced by a greaternumber of correlation coefficients exceeding 0.75 (Table 4).Further analysis of the identifiability and uniqueness of thefitted parameters is given below using the response surfaceanalysis of the objective function.
The Gapon approach was able to describe Na in theaqueous and exchange phase within the scatter of the
obtained with the Gapon approach [solid lines] or the Rothmund–Kornfeldorption and solute transport experiments with piggery effluent (Smiles and

Table 3Correlation coefficients between parameters used in the Gapon approach.
Log KGK Log KGCa Log KGMg CEC (mol/dm³)
Log KGK 1Log KGCa 0.383 1Log KGMg 0.327 0.811 1CEC (mol/dm³) 0.206 6.41×10⁻² 0.241 1
116 D. Jacques et al. / Journal of Contaminant Hydrology 142–143 (2012) 109–125
experimental data. However, the exchangeable K (sorbed)concentration was under-predicted. The description ofexchangeable Ca was generally good, with the exception ofthe final predicted exchangeable Ca when the Boltzmannvariable is less than 0.2 cm min0.5. The description ofexchangeable Mg was generally within the variability in theexperimental data, although close inspection of the aqueousMg data suggests that the simulated concentration front isslightly ahead of the measured data between the piston frontand the region of cation exchange (i.e., between 0.25 and0.75 cm min−0.5; Fig. 2d). The Gapon approach seemed to beunable to describe sorbed K concentrations, especially whenthe K concentrations are low and the concentrations of thebivalent cations (in particular Ca) are high (initial condition).Thus, at low K concentrations, sorption is apparently strongerthan can be described by the Gapon approach. Although notinvestigated in detail here, a possible reason for high K sorptionat low concentrations may have been the presence of illite inthe soil sample (20% of the clay, Smiles and Smith, 2004b). Illitetypically has some high-preference sorption sites for K, that arerelated to the formation of K inner-sphere complexes betweenthe clay surfaces (Evangelou and Philipps, 2005).
As suggested earlier by the weighted sum of squareddifferences, the Akaike's information criterion, and theBayesian information criterion, the Rothmund–Kornfeldapproach appears to describe the experimental data betterthan the Gapon approach. While the overall description ofthe cations' behavior was similar between the Rothmund–Kornfeld and Gapon conventions, the simulated initial andfinal exchangeable K and Ca more closely matched measuredvalues when using the Rothmund–Kornfeld approach.
Another way of representing the data is to show thesorbed concentrations against the aqueous concentrations(Fig. 3). The redistribution of aqueous Ca and Mg without anyvisible changes in the cation exchange composition aroundthe piston front is clearly illustrated in this figure (vertical
Table 4Correlation coefficients between parameters used in the Rothmund–Kornfeld approach.
LogKGK
LogKGCa
LogKGMg
NKNa NCaNa NMgNa CEC
LogKGK
1
LogKGCa
0.268 1
LogKGMg
0.221 0.722 1
NKNa −0.422 0.467 0.354 1NCaNa −0.03 −0.926 −0.676 −0.556 1NMgNa −0.01 −0.739 −0.922 −0.478 0.825 1CEC 0.580 0.223 0.229 −0.490 −0.178 −0.174 1
Fig. 3. Simulated relations between sorbed and aqueous concentrationsobtained with the Gapon approach [solid lines] or the Rothmund–Kornfeldapproach [dashed lines] compared to experimental data [symbols] fromwater absorption and solute transport experiments with piggery effluent(Smiles and Smith, 2004b).

117D. Jacques et al. / Journal of Contaminant Hydrology 142–143 (2012) 109–125
lines in Fig. 3c, d) and nicely represented by both modelapproaches. Given the large scatter in the experimentaldata, it is impossible to make any conclusions about theadequacy of the two models when comparing their resultswith the Na, Mg, and Ca data. However, the Rothmund–Kornfeld approach performs much better in reproducingthe K isotherm than the Gapon approach. At high sorbed(and aqueous) K concentrations, both approaches performequally well. However, at low K concentrations, sorption inthe Rothmund–Kornfeld approach is larger than in theGapon approach, indicating some preferential sorption of Kat low concentrations.
3.2. Information content in experimental data
The composite-scaled sensitivity coefficients (css) for theGapon parameters are given in Table 5. The experimental datacontain the most information for the estimation of the cationexchange capacity (CEC), although the css for KGCa is also high.Less information is present in the experimental data to esti-mate KGK and KGMg. The sorbed data provide more informationthan the aqueous data, as indicated by higher values of theaverage dimensionless scaled sensitivity coefficients (dss)(Table 5), except for K. From the four cations, Ca has thelargest average dimensionless scaled sensitivity.
In many cases, identifiability of a particular parameterbenefits from a combination of different data types, because asingle parameter influences multiple output variables. Inaddition, the dimensionless scaled sensitivities change withobservations as a function of the Boltzmann variable. Let usprovide interpretation of dss for KGCa, which has high valuesfor aqueous Na and K concentrations around their movingfronts and for sorbed Ca concentrations (Fig. 4). While the Nafront with increasing aqueous Na concentrations passes closebehind the piston front, the K front, where K replaces Ca andMg on the exchange sites, is nearer to the inlet boundary.Higher KGCa will result in less K on the exchange complex,which explains the high dss for aqueous K between 0.25 and0.75 cm/min0.5. Similarly, a higher KGCa will result in more Nain the aqueous phase, which explains the high dss foraqueous Na concentrations. Also, the value of KGCa definesthe amount of the sorbed Ca, which explains the high css for
Table 5Composite-scaled sensitivities (css, top value in the second column), percentage ofthe averaged dimensionless scaled sensitivities (dss) for each measured cation forvalue of columns 3–6) for the Gapon approach.
Parameter css Na
Top value (Absolute value) (Aqueous)
Bottom value (% of max) (Sorbed)
Log KGK 0.65 0.2220.27 0.300
Log KGca 1.11 0.3570.46 0.709
Log KGMg 0.25 0.0230.10 0.124
CEC (mol/dm³) 2.4 0.3741.00 0.768
Bold values indicate the experimental dataset which provides the largest informati
the sorbed Ca for the whole profile. All other dss profiles canbe interpreted in a similar way.
This information content is similar for all aqueous data.Aqueous concentrations do not contribute to the informationcontent ahead of the piston flow (i.e., for the Boltzmannvariable larger than 0.75 cm/min0.5) where dss is close tozero. Aqueous Na concentrations provide useful informationbetween 0.25 and 0.75 cm/min0.5 where the Na front islocated. The three other cations provide the most informationaround the K front where sorbed K replaces sorbed Ca andMg (between 0 and 0.25 cm/min0.5). On the other hand, theinformation content of the sorbed concentrations is quiteindependent of the Boltzmann variable, at least when it islarger than 0.25 cm/min0.5, since in this region there are nochanges in sorbed concentrations of K, Ca, and Mg. However,the initial sorbed concentrations (especially Ca and Mg) haveimportant information for several parameters because theyconstrain the initial distribution of cations between aqueousand sorbed concentrations. Additional information is con-tained in sorbed concentrations at the inlet where theexchange between K, Ca, and Mg is complete (i.e., at smallBoltzmann variables). Additionally, the concentration pro-files measured at 144 min provide more information than theother two datasets since they contain more data points withhigher sensitivity.
A similar analysis was also done for the Rothmund–Kornfeld approach (Table 6 and Fig. 5). The css values for theRothmund–Kornfeld approach are larger than those for theGapon approach. In fact, css of the parameters involving Kexchange are smaller compared to those of the otherparameters. The profiles of the dimensionless scaled sensi-tivities of the observations for KRKKNa, KRKCaNa, KRKMgNa, andthe CEC (results not shown) are very similar to those for theGapon approach, except that they have higher absolutevalues. For the N coefficients in the Rothmund–Kornfeld ap-proach, sorbed Ca and Mg concentrations are the most infor-mative experimental data ahead of the piston front. ForBoltzmann variables smaller than 0.25 cm/min0.5, the aque-ous Ca and Mg concentrations provide similar amount ofinformation compared to the sorbed Ca and Mg concentra-tions. As expected from the css of NKNa, the dimensionlessscaled sensitivity for this parameter is small.
css compared to maximum values (bottom value in the second column) andboth the aqueous data (top value of columns 3–6) and sorbed data (bottom
K Ca Mg
(Aqueous) (Aqueous) (Aqueous)
(Sorbed) (Sorbed) (Sorbed)
0.504 0.241 0.0950.425 0.679 0.1870.266 0.119 0.2220.213 1.822 1.8140.011 0.030 0.0390.012 0.387 0.5380.423 0.226 0.1970.289 5.916 1.870
on for a given parameter.

Fig. 4. Profiles of dimensionless-scaled sensitivities (dss) for the parameters in the Gapon approach for the aqueous (left) and sorbed (right) data.
118 D. Jacques et al. / Journal of Contaminant Hydrology 142–143 (2012) 109–125
The above discussed information content can be usedwhen designing the experimental set up and procedures. Thehighest information content is in, and thus it should be
desirable to measure, initial sorbed concentrations andaqueous concentrations of different cations at differentcritical positions behind the piston front (i.e., around the Na
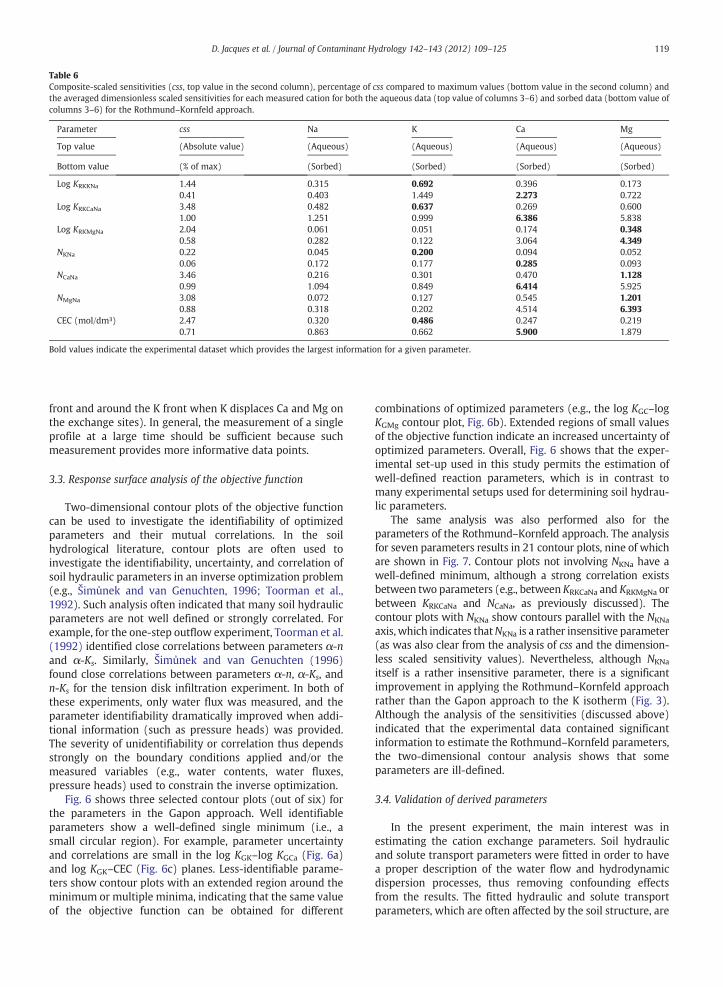
Table 6Composite-scaled sensitivities (css, top value in the second column), percentage of css compared to maximum values (bottom value in the second column) andthe averaged dimensionless scaled sensitivities for each measured cation for both the aqueous data (top value of columns 3–6) and sorbed data (bottom value ofcolumns 3–6) for the Rothmund–Kornfeld approach.
Parameter css Na K Ca Mg
Top value (Absolute value) (Aqueous) (Aqueous) (Aqueous) (Aqueous)
Bottom value (% of max) (Sorbed) (Sorbed) (Sorbed) (Sorbed)
Log KRKKNa 1.44 0.315 0.692 0.396 0.1730.41 0.403 1.449 2.273 0.722
Log KRKCaNa 3.48 0.482 0.637 0.269 0.6001.00 1.251 0.999 6.386 5.838
Log KRKMgNa 2.04 0.061 0.051 0.174 0.3480.58 0.282 0.122 3.064 4.349
NKNa 0.22 0.045 0.200 0.094 0.0520.06 0.172 0.177 0.285 0.093
NCaNa 3.46 0.216 0.301 0.470 1.1280.99 1.094 0.849 6.414 5.925
NMgNa 3.08 0.072 0.127 0.545 1.2010.88 0.318 0.202 4.514 6.393
CEC (mol/dm³) 2.47 0.320 0.486 0.247 0.2190.71 0.863 0.662 5.900 1.879
Bold values indicate the experimental dataset which provides the largest information for a given parameter.
119D. Jacques et al. / Journal of Contaminant Hydrology 142–143 (2012) 109–125
front and around the K front when K displaces Ca and Mg onthe exchange sites). In general, the measurement of a singleprofile at a large time should be sufficient because suchmeasurement provides more informative data points.
3.3. Response surface analysis of the objective function
Two-dimensional contour plots of the objective functioncan be used to investigate the identifiability of optimizedparameters and their mutual correlations. In the soilhydrological literature, contour plots are often used toinvestigate the identifiability, uncertainty, and correlation ofsoil hydraulic parameters in an inverse optimization problem(e.g., Šimůnek and van Genuchten, 1996; Toorman et al.,1992). Such analysis often indicated that many soil hydraulicparameters are not well defined or strongly correlated. Forexample, for the one-step outflow experiment, Toorman et al.(1992) identified close correlations between parameters α-nand α-Ks. Similarly, Šimůnek and van Genuchten (1996)found close correlations between parameters α-n, α-Ks, andn-Ks for the tension disk infiltration experiment. In both ofthese experiments, only water flux was measured, and theparameter identifiability dramatically improved when addi-tional information (such as pressure heads) was provided.The severity of unidentifiability or correlation thus dependsstrongly on the boundary conditions applied and/or themeasured variables (e.g., water contents, water fluxes,pressure heads) used to constrain the inverse optimization.
Fig. 6 shows three selected contour plots (out of six) forthe parameters in the Gapon approach. Well identifiableparameters show a well-defined single minimum (i.e., asmall circular region). For example, parameter uncertaintyand correlations are small in the log KGK–log KGCa (Fig. 6a)and log KGK–CEC (Fig. 6c) planes. Less-identifiable parame-ters show contour plots with an extended region around theminimum or multiple minima, indicating that the same valueof the objective function can be obtained for different
combinations of optimized parameters (e.g., the log KGC–logKGMg contour plot, Fig. 6b). Extended regions of small valuesof the objective function indicate an increased uncertainty ofoptimized parameters. Overall, Fig. 6 shows that the exper-imental set-up used in this study permits the estimation ofwell-defined reaction parameters, which is in contrast tomany experimental setups used for determining soil hydrau-lic parameters.
The same analysis was also performed also for theparameters of the Rothmund–Kornfeld approach. The analysisfor seven parameters results in 21 contour plots, nine of whichare shown in Fig. 7. Contour plots not involving NKNa have awell-defined minimum, although a strong correlation existsbetween two parameters (e.g., between KRKCaNa and KRKMgNa orbetween KRKCaNa and NCaNa, as previously discussed). Thecontour plots with NKNa show contours parallel with the NKNa
axis, which indicates thatNKNa is a rather insensitive parameter(as was also clear from the analysis of css and the dimension-less scaled sensitivity values). Nevertheless, although NKNa
itself is a rather insensitive parameter, there is a significantimprovement in applying the Rothmund–Kornfeld approachrather than the Gapon approach to the K isotherm (Fig. 3).Although the analysis of the sensitivities (discussed above)indicated that the experimental data contained significantinformation to estimate the Rothmund–Kornfeld parameters,the two-dimensional contour analysis shows that someparameters are ill-defined.
3.4. Validation of derived parameters
In the present experiment, the main interest was inestimating the cation exchange parameters. Soil hydraulicand solute transport parameters were fitted in order to havea proper description of the water flow and hydrodynamicdispersion processes, thus removing confounding effectsfrom the results. The fitted hydraulic and solute transportparameters, which are often affected by the soil structure, are

Fig. 5. Profiles of dimensionless-scaled sensitivities (dss) for selected parameters in the Rothmund–Kornfeld approach for the aqueous (left) and sorbed (right) data.
120 D. Jacques et al. / Journal of Contaminant Hydrology 142–143 (2012) 109–125
of minimal relevance to similar but undisturbed field soilbecause the laboratory experiments were carried out using ahighly disturbed soil material. In contrast, cation exchangeparameters estimated using the disturbed soil are assumed tobe applicable to other disturbed and undisturbed soils of thesame type and chemical composition, since these parametersare affected mainly by the soil texture and mineralogy. Thishypothesis was tested by applying the cation exchangeparameters derived from experimental data of Smiles andSmith (2004b) against a new experimental dataset (Smilesand Smith, 2008) that uses the same soil, with the exceptionthat it had been irrigated with K-rich effluent. In thisexperiment, water equilibrated with gypsum was absorbedinto a soil column that initially had a high exchangeable Kratio (Smiles and Smith, 2008).
The performance of the model and its optimized param-eters were evaluated by comparing calculated and measured
concentration profiles for major cations in the aqueous phaseand on the exchange sites (Fig. 8). The larger differencesbetween the initial sorbed measured and simulated concen-tration compared to the differences between the initialaqueous measured and simulated concentrations are becausethe initial sorbed concentrations are calculated with thegeochemical model, whereas the measured initial aqueousconcentrations are direct input in the model. The calculatedaqueous concentrations of Na, K, Ca, and Mg agree well withthe measured data when the Gapon coefficients are used. Incontrast, there were larger variations between the measuredand calculated data using the Rothmund–Kornfeld approach.In general, the Gapon exchange convention provides betteragreement between the simulated and measured datacompared to the Rothmund–Kornfeld convention. Althoughthe Rothmund–Kornfeld approach fitted the first set ofexperiments better (considering the Akaike criterion), a

Fig. 6. Contour plots of the objective function defined using the aqueous andsorbed concentrations for the Gapon approach. (a) logKGK–log KGCa, (b) logKGCa–log KGMg, and (c) log KGK–CEC.
121D. Jacques et al. / Journal of Contaminant Hydrology 142–143 (2012) 109–125
larger number of optimized parameters led to higheruncertainty and lower identifiability, as was shown usingthe analysis of the dimensionless scaled sensitivity coeffi-cients and response surfaces. That is, the Rothmund–Kornfeldmodel is slightly over–parameterized given the experimentalinformation content. This means that some optimizedparameters may not have physical meaning and may not bereliable when used in conditions other than those for which
they were calibrated. The Gapon convention, which usesfewer parameters, appears to be more robust.
Three different analyses discussed above (i.e., informationcontent analysis, response surfaces analysis, and validation)showed that under conditions involving the transport ofmultiple cations (i.e., Na, K, Ca, and Mg), the aqueous andsorbed concentrations are not sensitive to the NKNa param-eter of the monovalent exchange reaction. Predicted concen-trations are more sensitive to parameters describing theheterovalent exchange. However, PHREEQC calculations ofbinary monovalent exchange between K and Na showed thatthe K-isotherm in particular is quite sensitive to NKNa (resultsnot shown). It may be worthwhile to investigate if theinverse problem for the Rothmund–Kornfeld approach wouldbe better defined when independent measurements of binarymonovalent exchange for the K-isotherm (covering theentire range of the sorbed mole fraction) are included.
4. Summary and conclusions
Previously published laboratory experiments by Smilesand Smith (2004b) that examined the transport of major ionsduring water absorption in horizontal soil columns wereused here to estimate soil hydraulic, solute transport, andsolute reaction parameters. Soil hydraulic parameters wereestimated first using the measured water content profiles atthree different times with the inverse option of HYDRUS-1D.Solute transport parameters were then similarly identifiedusing the measured Cl profiles. Finally, the geochemicalparameters of the cation exchange were estimated usingliquid-phase and exchange-phase concentrations of fourmajor cations (Na, K, Mg, and Ca), the biogeochemical HP1code, and the universal optimization code, UCODE. The cationexchange parameters were identified for the Gapon andRothmund–Kornfeldmodels.While both approaches describedthe experimental data reasonably well, the Rothmund–Kornfeld model described the experimental data better thantheGaponmodel during the calibration stage. Both theAkaike'sinformation criterion and the Bayesian information criterionindicated that, despite having more parameters and conse-quently providing more flexibility in fitting experimental datathan the Gapon model, the Rothmund–Kornfeld model wassuperior.
The information content and response surface analysesindicated that while all parameters of the Gapon model werewell identifiable, there was a close correlation betweenseveral parameters of the Rothmund–Kornfeld model (Figs. 6and 7). Thus, using the Rothmund–Kornfeld convention, theseparameters cannot be identified simultaneously from theexperimental data and some need to be measured, orotherwise estimated, independently.
These findings were confirmed by a subsequent validationexercise, in which geochemical reaction parameters estimat-ed from the initial set of column experiments were used topredict liquid-phase and exchange-phase concentrations offour major cations from another set of experiments involvingabsorption of gypsum-saturated water into horizontal soilcolumns. While the parameters of the Gapon model allowedfor a good fit between the modeled and empirical aqueousdata, the parameters of the Rothmund–Kornfeld modelresulted in a poorer fit, attributed to the fact that not all

Fig. 7. Contour plots of the objective function defined using the aqueous and sorbed concentrations for the Rothmund–Kornfeld approach. First column: (top) logKK–log KCa, (middle) log KCa–log KMg, and (bottom) log KK–CEC; Second column: log KK–nK, log KCa–nCa, and log KK–nCa; Third column: log KK–nCa, log KCa–nK, andlog KK–nMg.
122 D. Jacques et al. / Journal of Contaminant Hydrology 142–143 (2012) 109–125
parameters were identifiable, as shown by the analysis of theinformation content and response surfaces.
The combined use of the flow and transport codeHYDRUS-1D, the biogeochemical code HP1, and the universaloptimization code UCODE proved to be a powerful tool foranalyzing experimental data involving transient variably-saturated water flow, solute transport, and geochemicalreactions. A flexible code, such as HP1, allows one to analyze
Fig. 8. Experimental [symbols] and simulated [solid lines for the Gapon approach andand exchangeable cations during the absorption of gypsum-saturated solution into
different geochemical conceptual models (in our case, theGapon and Rothmund–Kornfeld models) using one code. Akey element however, is that experimental data shouldcontain enough information to estimate all parameters. Forexample, the sensitivity analysis indicated that the currentexperimental data (Smiles and Smith, 2004b) does notcontain enough information to identify all parameters in theRothmund–Kornfeld model.
dashed lines for the Rothmund–Kornfeld approach] profiles of water solublea soil column.


124 D. Jacques et al. / Journal of Contaminant Hydrology 142–143 (2012) 109–125
Appendix 1
1. A section of the HP1 input file where the cation exchangeis defined using the Gapon convention:EXCHANGE_MASTER_SPECIES
G G-
EXCHANGE_SPECIES
G-=G-; log_k 0
G-+Na+=NaG; log_k 0
G-+K+=KG; log_k 1.16
G-+0.5 Ca+2=Ca0.5G; log_k 0.462
G-+0.5 Mg+2=Mg0.5G; log_k 0.383.
Where log_k is log K of the reaction (values given here arethe initial estimates). The reference half-reaction for eachexchanger is Na; the half reaction is Na++X−=NaX andit has a log K of 0.0.
2. A section of the HP1 input file where the cation exchangeis defined using the Rothmund–Kornfeld equations:EXCHANGE_MASTER_SPECIES
RR-
EXCHANGE_SPECIES
R-=R-; log_k 0
Na++R-=NaR; log_k 0
0.318 K++NaR=KR+.318 Na+; log_k 1.12;
-no_check; -mole_balance KR
0.736 Ca+2+2NaR=CaR2+1.472Na+;log_k
1.804; -no_check; -mole_balance CaR2
0.868 Mg+2+2NaR=MgR2+1.712 Na+;log_k 1.224;
-no_check; -mole_balance MgR2.
References
Appelo, C.A.J., Postma, D., 2005. Geochemistry, Groundwater and Pollution,2nd ed. AA Balkema Publishers, Leiden. The Netherlands a member ofTaylor & Francis Group plc.
Bloom, S.A., Mansell, R.S., 2001. An algorithm for generating cation exchangeisotherms from binary selectivity coefficients. Soil Science Society ofAmerica Journal 65, 1426–1429.
Bond, W.J., 1995. On the Rothmund–Kornfeld description of cation exchange.Soil Science Society of America Journal 59, 436–443.
Bond, W.J., 1997. Competitive exchange of K+, Na+ and Ca2+ duringtransport through soil. Australian Journal of Soil Research 35, 739–752.
Bond, W.J., Phillips, I.R., 1990a. Cation exchange isotherms obtained withbatch and miscible-displacement techniques. Soil Science Society ofAmerica Journal 54, 722–728.
Bond, W.J., Phillips, I.R., 1990b. Approximate solutions for cation transportduring unsteady, unsaturated soil water flow. Water Resources Research26, 2195–2205.
Bond, W.J., Verburg, K., 1997. Comparison of methods for predicting ternaryexchange from binary isotherms. Soil Science Society of America Journal61, 444–455.
Burnhum, K.P., Anderson, D.R., 2004. Multimodal inference: understandingAIC and BIC in model selection. Sociological Methods & Research 33,261–304.
Clausnitzer, V., Hopmans, J.W., 1995. Non-linear parameter estimation:LM_OPT. General purpose optimization code based on the Levenberg–Marquardt algorithm. Land, Air and Water Resources Paper No. 100032.University of California Davis, CA.
Dai, Z., Samper, J., 2004. Inverse problem of multicomponent reactivechemical transport in porous media: formulation and applications.Water Resources Research 40, W07407. doi:10.1029/2004WR003248.
Evangelou, V.P., Philipps, R.E., 2005. Cation exchange in soils. In: Tabatabai,M.A., Sparks, D.L. (Eds.), Chemical Processes in Soil. Soil Science Societyof America, pp. 343–410.
Friedel, M.J., 2005. Coupled inverse modeling of vadose zone water, heat, andsolute transport: calibration constraints, parameter nonuniqueness, andpredictive uncertainty. Journal of Hydrology 312, 148–175.
Gonçalves, M.C., Šimůnek, J., Ramos, T.B., Martins, J.C., Neves, M.J., Pires, F.P.,2006. Multicomponent solute transport in soil lysimeters irrigated withwaters of different quality. Water Resources Research 42, W08401.doi:10.1029/2006WR004802, 17 pp.
Hill, M.C., Tiedeman, C.R., 2007. Effective Groundwater Model Calibrationwith Analysis of Data, Sensitivities, Predictions and Uncertainty. JohnWiley & Sons, NJ, USA.
Hopmans, J.W., Šimůnek, J., Romano, N., Durner, W., 2002. Inverse modelingof transient water flow, In: Dane, J.H., Topp, G.C. (Eds.), Methods of SoilAnalysis, Part 1, Physical Methods, Chapter 3.6.2, Third ed. SSSA,Madison, WI, pp. 963–1008.
Hutson, J.L., Wagenet, R.J., 1992. LEACHM. A process based model of water andsolute movement, transformations, plant uptake and chemical reactions inthe unsaturated zone. Version 3. Cornell University Department of Soil,Crop and Atmospheric Sciences Research Series No. 92-3.
Jacques, D., Šimůnek, J., van Genuchten, M.Th., Mallants, D., 2006. Operator-splitting errors in coupled reactive transport codes for transient variablysaturated flow and contaminant transport in layered soil profiles.Journal of Contaminant Hydrology 88, 197–218.
Jacques, D., Šimůnek, J., Mallants, D., van Genuchten, M.Th., 2008a. Couplinghydrological and chemical processes in the vadose zone: a case study onlong term uranium migration following mineral P-fertilization. VadoseZone Journal 7, 698–711.
Jacques, D., Šimůnek, J., Mallants, D., van Genuchten, M.Th., 2008b. Modellingcoupled water flow, solute transport and geochemical reactions affectingheavy metal migration in a podzol soil. Geoderma 145, 449–461.
Mansell, R.S., Bloom, S.A., Bond, W.J., 1993. Simulating cation transport duringwater flow in soil: two approaches. Soil Science Society of America Journal57, 3–9.
Marquardt, D.W., 1963. An algorithm for least-squares estimation of nonlinearparameters. SIAM Journal on Applied Mathematics 11, 431–441.
MDH Engineered Solutions Corp., 2003. Evaluation of computer models forpredicting the fate and transport of salt in soil and groundwater. Phase IIReport.
Millington, R.J., Quirk, J.M., 1961. Permeability of porous solids. Transactionsof the Faraday Society 57, 1200–1207.
Nkedi-Kizza, P., Biggar, J.W., Selim, H.M., van Genuchten, M.Th., Wierenga, P.J.,Davidson, J.M., Nielsen, D.R., 1984. On the equivalence of two conceptualmodels for describing ion exchange during transport through anaggregated oxisol. Water Resources Research 20, 1123–1130.
Parkhurst, D.L., Appelo, C.A.J., 1999. User's guide to PHREEQC (version 2)—acomputer program for speciation, batch-reaction, one-dimensionaltransport and inverse geochemical calculations. Water ResourcesInvestigation, Report 99-4259, Denver, CO, USA.
Phillips, I.R., Bond, W.J., 1989. Extraction procedure for determining solutionand exchange ions in the same soil sample. Soil Science Society ofAmerica Journal 53, 1294–1297.
Poeter, E.P., Hill, M.C., Banta, E.R., Mehl, S., Steen, C., 2005. UCODE_2005 andsix other computer codes for universal sensitivity analysis, calibrationand uncertainty evaluation. U.S. Geological Survey Techniques andMethods 6-A11.
Ramos, T.B., Šimůnek, J., Gonçalves, M.C., Martins, J.C., Prazeres, A.,Castanheira, N.L., Pereira, L.S., 2011. Field evaluation of a multicompo-nent solute transport model in soils irrigated with saline waters. Journalof Hydrology 407 (1–4), 129–144 2011.
Rayment, G.E., Higginson, F.R., 1992. Australian Laboratory Handbook of Soiland Water Chemical Methods. Inkata Press, Melbourne.
Šimůnek, J., van Genuchten, M.Th., 1996. Estimating unsaturated soilhydraulic properties from tension disc infiltrometer data by numericalinversion. Water Resources Research 32, 2683–2696.
Šimůnek, J., Jacques, D., Hopmans, J.W., Inoue, M., Flury, M., van Genuchten,M.Th., 2002. Solute transport during variably-saturated flow—inversemethods, In: Dane, J.H., Topp, G.C. (Eds.), Methods of Soil Analysis, Part1, Physical Methods, Chapter 6.6, Third ed. SSSA, Madison, WI, pp.1435–1449.
Šimůnek, J., Jacques, D., van Genuchten, M.Th., Mallants, D., 2006. Multi-component geochemical transport modeling using HYDRUS-1D and HP1.Journal of the American Water Research Association 46, 1537–1547.
Šimůnek, J., Šejna, M., Saito, H., Sakai, M., van Genuchten, M.Th., 2008a. TheHydrus-1D Software Package for Simulating the One-dimensionalMovement of Water, Heat, and Multiple Solutes in Variably-saturatedMedia. Department of Environmental Sciences, University of CaliforniaRiverside, Riverside, California.
Šimůnek, J., van Genuchten, M.Th., Šejna, M., 2008b. Development andapplications of the HYDRUS and STANMOD software packages, andrelated codes. Vadose Zone Journal. doi:10.2136/VZJ2007.0077, SpecialIssue “Vadose Zone Modeling”.7, 587–600.

125D. Jacques et al. / Journal of Contaminant Hydrology 142–143 (2012) 109–125
Šimůnek, J., Jacques, D., Twarakavi, N.K.C., van Genuchten, M.Th., 2009.Selected HYDRUS modules for modeling subsurface flow and contam-inant transport as influenced by biological processes at various scales.Biologia 64, 465–469.
Smiles, D.E., Smith, C.J., 2004a. A survey of the cation content of piggeryeffluents and some chemical consequences of their use to irrigate soils.Australian Journal of Soil Research 42, 231–246.
Smiles, D.E., Smith, C.J., 2004b. Absorption of artificial piggery effluent bysoil: a laboratory study. Australian Journal of Soil Research 42, 96–975.
Smiles, D.E., Smith, C.J., 2008. Absorption of gypsum solution by a potassicsoil: a data set. Australian Journal of Soil Research 46, 67–75.
Toorman, A.F., Wierenga, P.J., Hills, R.G., 1992. Parameter estimation ofhydraulic properties from one-step outflow data. Water ResourcesResearch 28, 3021–3028.
Toride, N., Leij, F.J., van Genuchten, M.Th., 1995. The CXTFIT code forestimating transport parameters from laboratory or field tracer exper-iments. Version 2.0, Research Report No. 137. U. S. Salinity Laboratory,USDA, ARS, Riverside, CA.
van Genuchten, M.Th., 1980. A closed-form equation for predicting thehydraulic conductivity of unsaturated soils. Soil Science Society ofAmerica Journal 44, 892–898.
Voegelin, A., Vulava, V.M., Kuhnen, F., Kretzschmar, R., 2000. Multicompo-nent transport of major cations predicted from binary adsorptionexperiments. Journal of Contaminant Hydrology 46, 319–338.
Voegelin, A., Vulava, V.M., Kretzschmar, R., 2001. Reaction-based modeldescribing competitive sorption and transport of Cd, Zn and Ni in anacidic soil. Environmental Science & Technology 35, 1651–1657.
Vrugt, J.A., Stauffer, P.H., Wöhling, T., Robinson, B.A., Vesselinov, V.V., 2008.Inverse modeling of subsurface flow and transport properties: a reviewwith new developments. Vadose Zone Journal 7, 843–864.
Vulava, V.M., Kretzschmar, R., Rusch, U., Grolimund, D., Westall, J.C.,Borkovec, M., 2000. Cation competition in a natural subsurface material:modelling of sorption equilibria. Environmental Science & Technology34, 2149–2155.