journal of financial economics - universidade nova de...
TRANSCRIPT

Contents lists available at SciVerse ScienceDirect
Journal of Financial Economics
Journal of Financial Economics ] (]]]]) ]]]–]]]
0304-40
http://d
$ For
Acharya
Ferreira
Bill Sc
Univers
at the 2
Finance
Marketsn Corr
E-m
PleasEcon
journal homepage: www.elsevier.com/locate/jfec
Why are US firms using more short-term debt?$
Claudia Custodio a, Miguel A. Ferreira b,n, Luıs Laureano c
a Arizona State University, AZ, USAb Nova School of Business and Economics, Lisboa, Portugalc Instituto Universitario de Lisboa, ISCTE-IUL, Lisboa, Portugal
a r t i c l e i n f o
Article history:
Received 2 August 2011
Received in revised form
16 May 2012
Accepted 12 June 2012
JEL classification:
G20
G30
G32
Keywords:
Corporate debt maturity
Information asymmetry
Agency costs
New listings
Supply effects
5X/$ - see front matter & 2012 Elsevier B.V
x.doi.org/10.1016/j.jfineco.2012.10.009
helpful comments, we thank an anony
, Tom Bates, Sreedhar Bharath, Murillo Cam
, Zhiguo He, Victoria Ivashina, Jo~ao Santos,
hwert (the editor); seminar participants
ity and Nova School of Business and Econom
011 Financial Management Association m
Association meeting, and London School of
Group 25th Anniversary Conference.
esponding author. Tel.: þ351 21 3801631.
ail address: [email protected] (M.A
e cite this article as: Custodio, C.omics (2012), http://dx.doi.org/10.
a b s t r a c t
We show that corporate use of long-term debt has decreased in the US over the past
three decades and that this trend is heterogeneous across firms. The median percentage
of debt maturing in more than 3 years decreased from 53% in 1976 to 6% in 2008 for the
smallest firms but did not decrease for the largest firms. The decrease in debt maturity
was generated by firms with higher information asymmetry and new firms issuing public
equity in the 1980s and 1990s. Finally, we show that demand-side factors do not fully
explain this trend and that public debt markets’ supply-side factors play an important
role. Our findings suggest that the shortening of debt maturity has increased the
exposure of firms to credit and liquidity shocks.
& 2012 Elsevier B.V. All rights reserved.
1. Introduction
The structure of debt maturity is an important com-ponent of the firm’s financial policy that can have sig-nificant effects on real corporate behavior in the presenceof credit and liquidity shocks. A firm that uses more short-term debt faces more frequent renegotiations and, there-fore, is more likely to be affected by a credit supplyshock and to face financial constraints. The debt maturity
. All rights reserved.
mous referee, Viral
pello, Isil Erel, Daniel
Alessio Saretto, and
at Arizona State
ics; and participants
eeting, 2011 French
Economics-Financial
. Ferreira).
, et al., Why are US fi1016/j.jfineco.2012.10
structure had important real effects for industrial firmsduring the 2007–2008 financial crisis (Almeida, Campello,Laranjeira and Weisbenner, 2011).
This paper studies the evolution of debt maturity in USindustrial firms from 1976 to 2008. We find a seculardecrease in debt maturity in the typical firm. This trend iseconomically important, with the median percentage ofdebt maturing in more than 3 years decreasing from 64%in 1976 to 49% in 2008. Over this period, the medianpercentage hit a record low of 21% in 2000 and has alwaysbeen below the 1976 level. There is an even larger drop inlonger-term debt maturities, with the median percentageof debt maturing in more than 5 years decreasing from44% in 1976 to nearly zero in 2008. This trend was uniqueto debt maturity as leverage was fairly stable over thesample period.
We investigate the causes of this decrease in debtmaturity. We have four primary empirical findings. First,firms with higher information asymmetry are the ones
rms using more short-term debt? Journal of Financial.009

1 Harford, Klasa, and Maxwell (2011) find that liquidity risk (proxied
by debt maturity) is important in explaining this increase in cash
holdings.
C. Custodio et al. / Journal of Financial Economics ] (]]]]) ]]]–]]]2
responsible for the decrease in debt maturity, andagency costs (Myers, 1977), signaling, and liquidity risk(Flannery, 1986; Diamond, 1991) theories do not seem tobe consistent with the decrease. Second, firm-specificdemand-side factors account for part of the trend in debtmaturity but they do not fully explain it. Third, theevolution of debt maturity is explained by the fact thatthe typical firm has changed over the sample period. Theoverall composition of publicly traded firms has changedsignificantly over the last few decades due to riskier firmslisting publicly in the 1980s and the 1990s (Fama andFrench, 2004). We find no significant trend in debtmaturity after accounting for the listing year of firms.Finally, we show that factors related to the supply ofcredit (i.e., investor demand) contribute to explain theevolution of debt maturity.
To investigate the increase in corporate use of shorter-term debt, we first examine the evolution of debt matur-ity for different groups of firms. We find that the decreasein maturity is driven by small firms. For small firms, themedian percentage of debt maturing in more than 3 yearsdecreased from 53% in 1976 to 6% in 2008. For large firms,the median percentage is about 70% over the sampleperiod, even though there is some cyclical behavior. Thisheterogeneity of debt maturity across firms of differentsize suggests that agency costs or asymmetric informationcould have contributed to the greater use of short-term debt.
We find that firms with lower agency costs of debt (asproxied by leverage, market-to-book ratio, and capitalexpenditures) experience significant decreases in debtmaturity. When we categorize firms by proxies of man-agerial agency costs (governance index, board indepen-dence, and managerial ownership), we do not seedifferent patterns across groups of firms. These findingsdo not support the idea that conflicts of interest betweenshareholders and debt-holders or between managers andshareholders explain the evolution of debt maturity.A caveat is that the proxies of managerial agency costsare available only for the 1990–2008 period, which limitsour ability to test this hypothesis in the 1980s.
We then investigate the role of information asymme-try. Debt maturity falls significantly more for low tangi-bility and research and development (R&D)-intensivefirms, which suggests that firms with higher levels ofinformation asymmetry are operating with larger quan-tities of short-term debt. The evolution of debt maturityfor firms with low information asymmetry is markedlydifferent. When we use more dynamic proxies or marketmicrostructure measures of adverse selection, we findconsistent results. Firms with low institutional ownershipand analyst coverage and high dispersion of analystforecasts, volatility, and illiquidity experience a morepronounced increase in the use of short-term debt.
Finally, we do not find evidence consistent with otherdebt maturity theories explaining the trend in debtmaturity, including maturity matching, taxes, signaling,or liquidity risk. High-quality firms, as proxied by abnor-mal earnings or credit quality, do not experience asignificantly different evolution of debt maturity fromlow-quality firms. Macroeconomic factors have a limited
Please cite this article as: Custodio, C., et al., Why are US fiEconomics (2012), http://dx.doi.org/10.1016/j.jfineco.2012.10
success in explaining the trend in debt maturity. Themagnitude of the time trend coefficient is also notaffected when we use a system of two simultaneousequations that recognizes that maturity is determinedendogenously with leverage.
The decrease in debt maturity seems to be related tothe disappearing dividends and new listings phenomenashown by Fama and French (2001, 2004). They show thatthe proportion of firms paying dividends fell dramaticallyin the 1980s and 1990s because of changing character-istics of new publicly listed firms: small firms with lowprofitability and strong growth opportunities. We findthat firms that do not pay dividends use more short-termdebt than firms that pay dividends. More interesting, weobserve a decrease in debt maturity among nondividendpayers, but not among dividend payers. The decrease indebt maturity is significant among the less profitablefirms, but insignificant among the more profitable firms.To demonstrate the importance of the listing year, wecategorize firms by decades according to the listing year.We find that the most recent listing groups have a shortermedian debt maturity than older listing year groups andthat there is no trend in debt maturity within each listingyear group. The shortening of a firm’s debt maturityseems also to be related to the increase in corporate cashholdings (Bates, Kahle, and Stulz, 2009).1 The decrease indebt maturity is significant in the group of firms withhigher cash holdings, while there is not a significant trendamong firms with lower cash holdings.
We next investigate whether the decrease in debtmaturity is a result of demand-side factors or a result ofchanges that are not related to firm characteristics, usingmultivariate regression tests. We find that changes in firmcharacteristics explain part of the trend in debt maturitybut they cannot fully explain it. Unobserved firm hetero-geneity and changes in the elasticities between debtmaturity and firm characteristics also have limited powerin explaining the evolution of debt maturity. Thus, firmsare using more short-term debt, irrespective of theircharacteristics. The expected debt maturity, generatedby a regression model estimated using the earlier part ofthe sample period, systematically overestimates theactual maturity and consequently fails to fully capturethe decrease in maturity.
While the most common demand-side determinants ofdebt maturity cannot account for a significant part of theincrease in the use of short-term debt, the new listingeffect is able to do it. There is no significant trend inmaturity after accounting for a firm’s listing year. More-over, the explanatory power of listing groups remainsmostly unchanged once we control for the most commondeterminants of debt maturity choice, including firm age.We conclude that a fundamental change in the composi-tion and nature of publicly listed firms that have beenlisted over the last few decades is responsible for thedecline in debt maturity.
rms using more short-term debt? Journal of Financial.009

C. Custodio et al. / Journal of Financial Economics ] (]]]]) ]]]–]]] 3
We corroborate the finding of a decline in debtmaturity using new debt issues. While balance sheet dataare an aggregation of historical debt issuances, the newdebt issues data allow us to take the view of a prospectivecreditor who analyzes the characteristics of the firm thatwill determine the maturity of new debt. Using thesample of bond issues, we are also able to rule outdemand-based explanations of debt maturity by condi-tioning on firms’ raising new debt financing (Becker andIvashina, 2011).
We find a dramatic decrease in the initial maturity ofbond issues. The median maturity dropped from 25 yearsin 1976 to less than 10 years in the 2000s. In contrast, wedo not observe a significant trend in the median maturityof new syndicated bank loans. The evidence provided byregression models from public debt issues controlling forchanges in firm characteristics is consistent with adecrease in maturity, while no evidence exists of a declinein maturity in private debt markets. In addition, we use afirm-year fixed effects estimator to isolate the impact ofcredit supply shocks on maturity. We find that firmheterogeneity explains little of the trend in the maturityof bond issues, which is consistent with the idea thatsupply-side factors play an important role in explainingthe evolution of debt maturity.
Syndicated loans, however, are just a fraction ofprivate debt markets and we cannot directly observe thecharacteristics of small (nonsyndicated) bank loans. Usingdata from the Flow of Funds Accounts from the FederalReserve, we see that the fraction of public debt in totalcorporate debt financing grew from 50% in the 1980s tomore than 65% in the 2000s. Taken together, the resultssuggest that the decrease in debt maturity has mainlytaken place in public debt markets instead of in privatedebt markets. Moreover, it is not the case that an increasein the use of bank loans (which have lower maturity thanbonds) explains the decrease in debt maturity.
The decrease in the maturity of bond issues suggeststhat debt maturity has decreased for rated firms, whichare the ones with access to public debt markets. Further-more, a negative and significant trend exists in thematurity of bond issues of all size groups, and the listingyear is not able to fully explain the trend in the maturityof bond issues. These findings differ from the ones usingbalance sheet data in which small and unrated firmsexperience a more pronounced decrease in debt maturitythan large and rated firms, and the listing year is able tofully explain the debt maturity trend. This can beexplained by the fact that large, old, and rated firms issuemuch longer maturity debt than small, new, and unratedfirms. These long-term debt issues will remain on thebalance sheet for a longer period, smoothing the decreasein the balance sheet debt maturity variable (i.e., percen-tage of debt maturing in more than 3 years) for thesegroup of firms. Furthermore, firms that issue shortermaturity debt (such as small firms) are overrepresentedin the sample of new bond issues as they need to accessthe bond market more frequently than firms that issuelonger maturity debt (such as large firms).
Finally, we show how debt maturity is affected bysupply-side factors using exogenous shocks to the supply
Please cite this article as: Custodio, C., et al., Why are US fiEconomics (2012), http://dx.doi.org/10.1016/j.jfineco.2012.10
of credit. The collapse of Drexel Burnham Lambert and thesubsequent regulatory changes (Lemmon and Roberts,2010) led to an exogenous contraction in the supply ofspeculative-grade credit after 1989. We find that after1989 speculative-grade firms significantly reduced theiruse of long-term bonds relative to investment-gradefirms. The 2007–2008 financial crisis (e.g., Campello,Graham, and Harvey, 2010; Duchin, Ozbas, and Sensoy,2010; Ivashina and Scharfstein, 2010) led to an exogenouscontraction in the supply of bank loans. We find thatunrated firms (which are more bank-dependent as theyhave limited access to bond markets) significantlyreduced debt maturity relative to rated firms during thefinancial crisis. Overall, the evidence suggests that supply-side factors affect debt maturity. This is consistent withrecent evidence that shifting equity and credit marketconditions play an important role in dictating corporatefinance decisions; see Baker (2009) for a survey.
One important implication of the secular shortening indebt maturity is that the proportion of firms with asignificant fraction of its debt maturing in a given yearhas increased. The percentage of firms with more than20% of debt maturing in a given year increased from 14%in the early 1980s to more than 20% in the 2000s.Similarly, the Herfindahl Index of the debt maturitystructure increased from 0.4 to 0.6 over the sampleperiod.
Our findings suggest that the decrease in debt matur-ity could have exacerbated the effects of the 2007–2008financial crisis on the real economy because the typicalfirm was more exposed to liquidation and refinancing riskat the beginning of the crisis than it had been historically.However, some evidence exists that firms extended debtmaturity in the 2000s. This is consistent with the findingsby Mian and Santos (2011) that firms engage in maturitystructure management by extending the maturity of loansduring normal times. The downward-sloping yield curvein 2005–2007 also played a role in the extension of debtmaturities in the 2000s.
2. Sample and data description
We draw our sample of US firms from the CompustatIndustrial Annual database. The sample period rangesfrom 1976 to 2008. We exclude financial firms [standardindustrial classification (SIC) codes 6000–6999] and uti-lities (SIC codes 4900–4999) because these firms tend tohave significantly different capital structures due toregulation. We drop any observation with negative totalassets. The final sample has a total of 97,215 observationsfrom 12,938 unique firms.
2.1. Debt maturity
We use the percentage of debt maturing in more than3 years (debt maturity 3) as our main dependent variable(see Table A.1 in Appendix A for detailed variable defini-tions) following the literature on debt maturity (e.g.,Barclay and Smith, 1995). We also present some resultsusing the proportion of total debt maturing in more than5 years (debt maturity 5). We drop observations for which
rms using more short-term debt? Journal of Financial.009
C. Custodio et al. / Journal of Financial Economics ] (]]]]) ]]]–]]]4
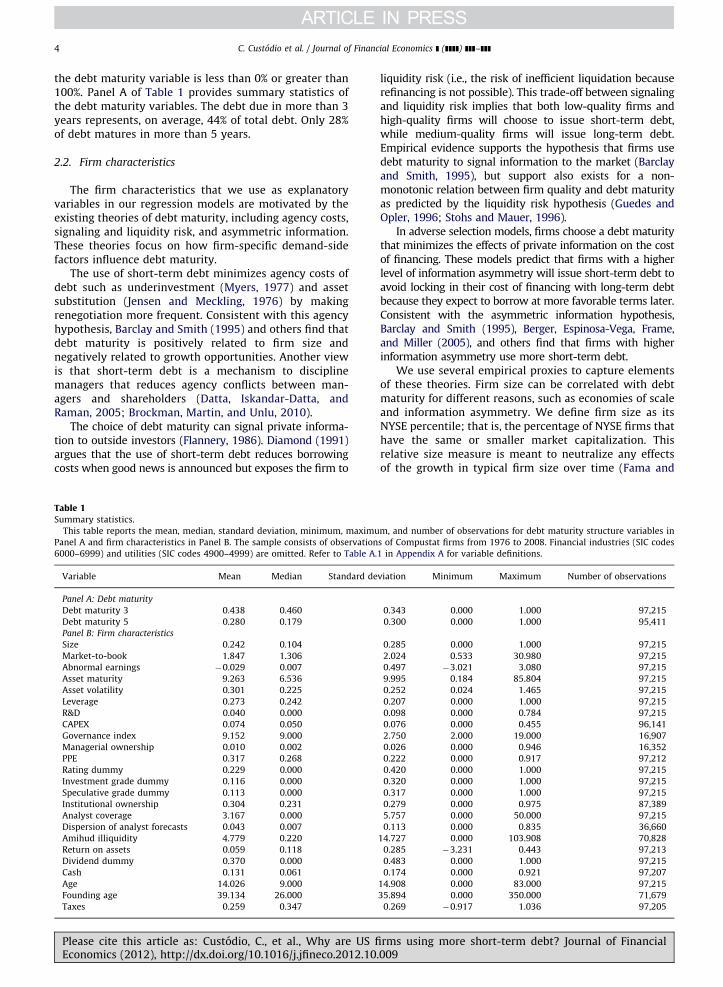
the debt maturity variable is less than 0% or greater than100%. Panel A of Table 1 provides summary statistics ofthe debt maturity variables. The debt due in more than 3years represents, on average, 44% of total debt. Only 28%of debt matures in more than 5 years.
2.2. Firm characteristics
The firm characteristics that we use as explanatoryvariables in our regression models are motivated by theexisting theories of debt maturity, including agency costs,signaling and liquidity risk, and asymmetric information.These theories focus on how firm-specific demand-sidefactors influence debt maturity.
The use of short-term debt minimizes agency costs ofdebt such as underinvestment (Myers, 1977) and assetsubstitution (Jensen and Meckling, 1976) by makingrenegotiation more frequent. Consistent with this agencyhypothesis, Barclay and Smith (1995) and others find thatdebt maturity is positively related to firm size andnegatively related to growth opportunities. Another viewis that short-term debt is a mechanism to disciplinemanagers that reduces agency conflicts between man-agers and shareholders (Datta, Iskandar-Datta, andRaman, 2005; Brockman, Martin, and Unlu, 2010).
The choice of debt maturity can signal private informa-tion to outside investors (Flannery, 1986). Diamond (1991)argues that the use of short-term debt reduces borrowingcosts when good news is announced but exposes the firm to
Table 1Summary statistics.
This table reports the mean, median, standard deviation, minimum, maximu
Panel A and firm characteristics in Panel B. The sample consists of observation
6000–6999) and utilities (SIC codes 4900–4999) are omitted. Refer to Table A.
Variable Mean Median Standard de
Panel A: Debt maturity
Debt maturity 3 0.438 0.460
Debt maturity 5 0.280 0.179
Panel B: Firm characteristics
Size 0.242 0.104
Market-to-book 1.847 1.306
Abnormal earnings �0.029 0.007
Asset maturity 9.263 6.536
Asset volatility 0.301 0.225
Leverage 0.273 0.242
R&D 0.040 0.000
CAPEX 0.074 0.050
Governance index 9.152 9.000
Managerial ownership 0.010 0.002
PPE 0.317 0.268
Rating dummy 0.229 0.000
Investment grade dummy 0.116 0.000
Speculative grade dummy 0.113 0.000
Institutional ownership 0.304 0.231
Analyst coverage 3.167 0.000
Dispersion of analyst forecasts 0.043 0.007
Amihud illiquidity 4.779 0.220
Return on assets 0.059 0.118
Dividend dummy 0.370 0.000
Cash 0.131 0.061
Age 14.026 9.000
Founding age 39.134 26.000
Taxes 0.259 0.347
Please cite this article as: Custodio, C., et al., Why are US fiEconomics (2012), http://dx.doi.org/10.1016/j.jfineco.2012.10
liquidity risk (i.e., the risk of inefficient liquidation becauserefinancing is not possible). This trade-off between signalingand liquidity risk implies that both low-quality firms andhigh-quality firms will choose to issue short-term debt,while medium-quality firms will issue long-term debt.Empirical evidence supports the hypothesis that firms usedebt maturity to signal information to the market (Barclayand Smith, 1995), but support also exists for a non-monotonic relation between firm quality and debt maturityas predicted by the liquidity risk hypothesis (Guedes andOpler, 1996; Stohs and Mauer, 1996).
In adverse selection models, firms choose a debt maturitythat minimizes the effects of private information on the costof financing. These models predict that firms with a higherlevel of information asymmetry will issue short-term debt toavoid locking in their cost of financing with long-term debtbecause they expect to borrow at more favorable terms later.Consistent with the asymmetric information hypothesis,Barclay and Smith (1995), Berger, Espinosa-Vega, Frame,and Miller (2005), and others find that firms with higherinformation asymmetry use more short-term debt.
We use several empirical proxies to capture elementsof these theories. Firm size can be correlated with debtmaturity for different reasons, such as economies of scaleand information asymmetry. We define firm size as itsNYSE percentile; that is, the percentage of NYSE firms thathave the same or smaller market capitalization. Thisrelative size measure is meant to neutralize any effectsof the growth in typical firm size over time (Fama and
m, and number of observations for debt maturity structure variables in
s of Compustat firms from 1976 to 2008. Financial industries (SIC codes
1 in Appendix A for variable definitions.
viation Minimum Maximum Number of observations
0.343 0.000 1.000 97,215
0.300 0.000 1.000 95,411
0.285 0.000 1.000 97,215
2.024 0.533 30.980 97,215
0.497 �3.021 3.080 97,215
9.995 0.184 85.804 97,215
0.252 0.024 1.465 97,215
0.207 0.000 1.000 97,215
0.098 0.000 0.784 97,215
0.076 0.000 0.455 96,141
2.750 2.000 19.000 16,907
0.026 0.000 0.946 16,352
0.222 0.000 0.917 97,212
0.420 0.000 1.000 97,215
0.320 0.000 1.000 97,215
0.317 0.000 1.000 97,215
0.279 0.000 0.975 87,389
5.757 0.000 50.000 97,215
0.113 0.000 0.835 36,660
14.727 0.000 103.908 70,828
0.285 �3.231 0.443 97,213
0.483 0.000 1.000 97,215
0.174 0.000 0.921 97,207
14.908 0.000 83.000 97,215
35.894 0.000 350.000 71,679
0.269 �0.917 1.036 97,205
rms using more short-term debt? Journal of Financial.009

C. Custodio et al. / Journal of Financial Economics ] (]]]]) ]]]–]]] 5
French, 2001). Firm size squared captures the nonlinearrelation between debt maturity and firm size as predictedby Diamond (1991), and it is expected to have a negativecoefficient.
Market-to-book is a proxy for investment opportu-nities. We expect firms with more growth options to havemore short-term debt because this alleviates the under-investment problem. Firms with better-quality projects,as proxied by abnormal earnings, are more likely to issueshort-term debt according to the signaling hypothesis.We expect a positive relation between asset maturity anddebt maturity if the firm matches the maturity of itsliabilities with the maturity of its assets. We expect assetvolatility to be negatively correlated with debt maturity.Firms with more asset volatility have a higher probabilityof default and, therefore, might be excluded from thelong-term debt market. We expect to find a positiverelation between leverage and debt maturity. Firms withmore R&D expenses are also expected to hold moreshort-term debt according to the information asymmetryhypothesis.
Finally, the difference between long-term and short-term government bond yields (term spread) proxies forthe cost of borrowing at different maturities, which caninfluence the choice of debt maturity. Barclay and Smith(1995) and others find that debt maturity is negativelyrelated to the term spread. The interpretation is thatmanagers time the market and prefer to issue short-term debt when short-term interest rates are lowcompared with long-term rates. In contrast, the taxhypothesis suggests a positive correlation between theterm spread and debt maturity (see Brick and Ravid,1985; Barclay and Smith, 1995).
We report summary statistics for firm characteristicsin Panel B of Table 1. We winsorize variables at the topand bottom 1% levels. Firms, on average, have a highermarket value of assets (about 85% more) than book valueof assets and show negative future abnormal earnings.On average, total debt represents 27% of total assets, assetmaturity is about 9 years, and asset volatility (annualized)is 30%.
2 In unreported results, we find a strong negative relation between
the de-trended median debt maturity and the term spread after 2003.
However, this relation is statistically insignificant over the whole sample
period.3 Untabulated results using NYSE, Amex, and Nasdaq percentiles or
real assets percentiles are similar to those using NYSE market capitaliza-
tion percentiles.
3. The decrease in debt maturity and firm characteristics
Table 2 shows the evolution of debt maturity andleverage of US industrial firms from 1976 to 2008.We present the evolution of the ratio of debt maturingin more than 3 years to total debt (debt maturity 3).The aggregate ratio was 73% in 1976 and only 63% in2008. The average ratio, which was 57% in 1976, droppedto 46% in 2008, with a low of 35% in 2000. The medianratio shows a similar pattern. Over the 1976–2000 period,the median ratio dropped from 64% to 21% and thenincreased to 49% in 2008, which was still below the levelsof maturity at the beginning of the sample period. Table 2also reports the evolution of the ratio of debt maturing inmore than 5 years to total debt (debt maturity 5). Theaverage ratio drops from 42% in 1976 to 22% in 2008, andthe median drops even more, from 44% in 1976 to nearlyzero in 2008. This evidence indicates that the decline in
Please cite this article as: Custodio, C., et al., Why are US fiEconomics (2012), http://dx.doi.org/10.1016/j.jfineco.2012.10
debt maturity is stronger at longer maturities than atintermediate maturities.
We test whether there is a significant time trend indebt maturity variables. The estimated time trend coeffi-cient and associated p-value of a regression of debtmaturity variables on an intercept and a time trend arepresented at the bottom of Table 2. We find a statisticallysignificant downward trend in all debt maturity variables.The coefficient for the median debt maturity 3 is stronglystatistically significant and indicates a decrease in theproportion of debt maturing in more than 3 years of 0.61%per year.
The average and median leverage ratios reported inTable 2 also present a negative time trend coefficient, but themagnitude of the decrease is substantially smaller than thatin debt maturity. During the sample period, the leverage ratioseems to be stable at about 27% of total assets, suggestingthat the shift from long-term to short-term debt is notrelated to a structural change in the leverage ratios.
In the most recent period of the sample we observe apartial reversal in the downward trend of debt maturity.This increase in corporate use of long-term debt can berelated to the downward-sloping yield curve in the 2005–2007 period or maturity structure management by firms.Mian and Santos (2011) find that firms, especially high-quality firms, tend to favor early refinancing in normaltimes, thereby reducing their need to refinance duringtight credit conditions.2
3.1. Firm size
We examine the time trend in debt maturity acrossfirms of different sizes. Following Fama and French (2001),we use NYSE percentiles to prevent the growing popula-tion of Nasdaq firms from changing the meaning of small,medium-size, and large firms over the sample period.3 Afirm is classified as a small firm if its market capitalizationis below the 20th percentile, as a medium-size firm if itsmarket capitalization is between the 20th and 50th per-centiles, and as a large firm if its market capitalization isabove the 50th percentile in each year. Panel A of Fig. 1shows the number of firms in each size group. While thenumber of firms in the large and medium-size groups isstable at around 600 over the sample period, the number offirms in the small group increases from about 1,100 in1976 to more than 2,500 in 1997. Panel B of Fig. 1 showsthe yearly evolution of the median debt maturity for eachfirm size group. Table 3 reports 5-year subperiods (theinitial and final subperiods have only 4 years) and full-period averages of the median debt maturity for the small,medium-size, and large firms groups.
Debt maturity is significantly shorter for small firmsthan for medium-size and large firms. The full sample
rms using more short-term debt? Journal of Financial.009

Table 2Debt maturity and leverage by year.
This table reports the aggregate, average, median, and number of observations of debt maturity variables and leverage by year. Debt maturity 3 is the
percentage of debt maturing in more than 3 years, and debt maturity 5 is the percentage of debt maturing in more than 5 years. Leverage is the ratio of
total debt to total assets. The sample consists of observations of Compustat firms from 1976 to 2008. Financial industries (SIC codes 6000–6999) and
utilities (SIC codes 4900–4999) are omitted. Refer to Table A.1 in Appendix A for variable definitions.
Year Aggregate debt
maturity 3
Average debt
maturity 3
Median debt
maturity 3
Aggregate debt
maturity 5
Average debt
maturity 5
Median debt
maturity 5
Average
leverage
Median
leverage
Number of
observations
1976 0.731 0.568 0.635 0.622 0.419 0.444 0.267 0.247 2,339
1977 0.721 0.570 0.634 0.609 0.420 0.441 0.274 0.257 2,385
1978 0.714 0.561 0.621 0.590 0.403 0.425 0.282 0.269 2,520
1979 0.689 0.535 0.593 0.571 0.385 0.396 0.288 0.273 2,582
1980 0.700 0.530 0.592 0.572 0.379 0.387 0.281 0.258 2,613
1981 0.689 0.510 0.568 0.553 0.358 0.357 0.274 0.248 2,724
1982 0.693 0.503 0.564 0.553 0.347 0.346 0.281 0.251 2,765
1983 0.709 0.487 0.543 0.571 0.336 0.332 0.262 0.225 2,995
1984 0.664 0.459 0.497 0.511 0.308 0.277 0.272 0.236 3,051
1985 0.687 0.455 0.480 0.529 0.315 0.269 0.285 0.251 3,032
1986 0.694 0.443 0.464 0.548 0.308 0.246 0.291 0.261 3,134
1987 0.697 0.440 0.461 0.532 0.299 0.217 0.297 0.269 3,272
1988 0.583 0.420 0.427 0.442 0.280 0.182 0.299 0.268 3,179
1989 0.545 0.405 0.397 0.414 0.268 0.161 0.306 0.276 3,037
1990 0.507 0.384 0.353 0.372 0.244 0.124 0.303 0.268 3,011
1991 0.549 0.381 0.342 0.419 0.234 0.093 0.284 0.252 3,018
1992 0.526 0.372 0.331 0.385 0.227 0.074 0.266 0.232 3,207
1993 0.522 0.380 0.329 0.387 0.238 0.077 0.252 0.223 3,338
1994 0.559 0.383 0.320 0.401 0.233 0.067 0.257 0.228 3,527
1995 0.553 0.384 0.320 0.372 0.229 0.052 0.262 0.235 3,630
1996 0.575 0.394 0.323 0.389 0.232 0.046 0.253 0.217 3,849
1997 0.585 0.409 0.345 0.392 0.241 0.041 0.265 0.229 3,815
1998 0.588 0.409 0.352 0.402 0.233 0.032 0.289 0.253 3,676
1999 0.564 0.381 0.312 0.404 0.222 0.019 0.282 0.252 3,425
2000 0.529 0.346 0.212 0.372 0.201 0.008 0.266 0.237 3,287
2001 0.562 0.363 0.251 0.382 0.209 0.005 0.269 0.231 2,931
2002 0.575 0.381 0.313 0.393 0.218 0.011 0.267 0.229 2,699
2003 0.573 0.423 0.419 0.422 0.252 0.053 0.250 0.215 2,461
2004 0.578 0.459 0.485 0.421 0.275 0.070 0.240 0.202 2,442
2005 0.604 0.481 0.520 0.437 0.286 0.071 0.240 0.202 2,398
2006 0.636 0.506 0.584 0.434 0.292 0.087 0.247 0.211 2,355
2007 0.651 0.499 0.565 0.434 0.267 0.030 0.259 0.222 2,316
2008 0.627 0.456 0.494 0.411 0.224 0.009 0.285 0.245 2,202
1976–1979 0.713 0.558 0.621 0.598 0.407 0.427 0.278 0.262
1980–1984 0.691 0.498 0.553 0.552 0.346 0.340 0.274 0.244
1985–1989 0.641 0.433 0.446 0.493 0.294 0.215 0.295 0.265
1990–1994 0.532 0.380 0.335 0.393 0.235 0.087 0.272 0.241
1995–1999 0.573 0.396 0.331 0.392 0.231 0.038 0.270 0.237
2000–2004 0.563 0.394 0.336 0.398 0.231 0.030 0.259 0.223
2005–2008 0.630 0.485 0.541 0.429 0.267 0.049 0.258 0.220
1976–2008 0.617 0.445 0.444 0.462 0.284 0.165 0.273 0.242
Trend�100 �0.441 �0.348 �0.610 �0.680 �0.524 �1.424 �0.085 �0.140
p-Value 0.000 0.002 0.004 0.000 0.000 0.000 0.006 0.000
C. Custodio et al. / Journal of Financial Economics ] (]]]]) ]]]–]]]6
period average of the median debt maturity 3 for smallfirms is 26%, and for medium-size and large firms it is 63%and 69% respectively. The decrease in debt maturity ismuch stronger for small firms. The median debt maturity 3
drops from 53% in 1976–1979 to less than one-third ofthis figure in 1990–1994 and less than one-fifth in 2000–2004. Some increase is evident in debt maturity amongsmall firms in recent years, but the median is 6% in 2008,which is well below the median in the late 1970s of morethan 50%. Large and medium-size firms exhibit somedecrease in debt maturity until the early 1990s, but it ismuch less pronounced than among small firms.
The final two columns of Table 3 present the estimatedtime trend coefficient and its p-value for the median debt
maturity 3 for each size group. The time trend coefficient
Please cite this article as: Custodio, C., et al., Why are US fiEconomics (2012), http://dx.doi.org/10.1016/j.jfineco.2012.10
is negative and significant only in the group of smallfirms. The coefficient indicates a decrease of 1.4% per yearamong small firms and is strongly statistically significant.The evidence on firm size groups is consistent with theinformation asymmetry theory explaining the decline indebt maturity, but also with the agency costs theory.
3.2. Agency costs
The agency costs of debt are expected to be higher forfirms with more leverage and investment opportunities.Table 3 shows the average debt maturity for high- andlow-levered firms and firms with high and low market-to-book ratio of assets, which proxies for firms’ growthoptions. A firm is classified as low if it is below the
rms using more short-term debt? Journal of Financial.009

0
500
1000
1500
2000
2500
3000
1976 1978 1980 1982 1984 1986 1988 1990 1992 1994 1996 1998 2000 2002 2004 2006 2008
1976 1978 1980 1982 1984 1986 1988 1990 1992 1994 1996 1998 2000 2002 2004 2006 2008
Num
ber
of
firm
s
Small Medium Large
0
0.1
0.2
0.3
0.4
0.5
0.6
0.7
0.8
0.9
Per
centa
ge
of
deb
t m
aturi
ng i
n m
ore
than
thre
e yea
rs
Small Medium Large
Fig. 1. Debt maturity and number of firms by size group. Panel A plots the number of firms; Panel B, the median debt maturity, defined as the percentage
of debt maturing in more than 3 years, of each size group. The breakpoints for the size groups are the 20th and 50th percentiles of NYSE market
capitalization in each year. The sample consists of observations of Compustat firms from 1976 to 2008. Financial industries (SIC codes 6000–6999) and
utilities (SIC codes 4900–4999) are omitted.
C. Custodio et al. / Journal of Financial Economics ] (]]]]) ]]]–]]] 7
median and as high if it is above the median of a givenfirm characteristic in each year.
We do not find evidence consistent with the mitigationof underinvestment problems helping to explain thedecline in debt maturity. In fact, we find that less-levered firms are the ones holding more short-term debt,and we observe a negative trend in the debt maturity ofonly this group of firms. While low-levered firms’ averagedebt maturity 3 drops from 61% in the 1976–1979 periodto 36% in the 2005–2008 period, high-levered firms have a
Please cite this article as: Custodio, C., et al., Why are US fiEconomics (2012), http://dx.doi.org/10.1016/j.jfineco.2012.10
much less pronounced decrease (it is even higher in the2005–2008 period than at the beginning of the sampleperiod).
The results from splitting the sample according togrowth options are also inconsistent with the agency costsof debt hypothesis. Low market-to-book firms show a higherproportion of long-term debt (50%) than high market-to-book firms (38%), but both groups present a negative andsignificant trend in the median debt maturity 3. The trendsare also negative and significant in both groups based on
rms using more short-term debt? Journal of Financial.009

Table 3Debt maturity by group of firms.
This table reports the time series average by groups of firms of the median debt maturity, defined as the percentage of debt maturing in more than 3 years. The breakpoints for the three size groups are the
20th and 50th percentiles of NYSE market capitalization in each year. The breakpoint for the low and high groups is the yearly 50th percentile of each firm characteristic with exception of R&D in which the
breakpoint is the 75th percentile. The sample consists of observations of Compustat firms from 1976 to 2008. Financial industries (SIC codes 6000–6999) and utilities (SIC codes 4900–4999) are omitted. Refer to
Table A.1 in Appendix A for variable definitions.
Variable 1976–1979 1980–1984 1985–1989 1990–1994 1995–1999 2000–2004 2005–2008 1976–2008 Trend�100 p-Value
Size
Small 0.525 0.439 0.282 0.165 0.157 0.093 0.172 0.256 �1.387 0.000
Medium 0.681 0.646 0.614 0.536 0.592 0.588 0.782 0.628 0.100 0.560
Large 0.721 0.688 0.700 0.654 0.674 0.685 0.722 0.690 �0.029 0.647
Leverage
Low 0.612 0.521 0.384 0.226 0.176 0.148 0.357 0.338 �1.309 0.000
High 0.630 0.591 0.527 0.505 0.594 0.586 0.752 0.592 0.305 0.059
Market-to-book
Low 0.616 0.582 0.494 0.409 0.433 0.394 0.581 0.495 �0.421 0.030
High 0.628 0.518 0.382 0.249 0.216 0.252 0.486 0.380 �0.867 0.001
CAPEX
Low 0.569 0.513 0.362 0.245 0.216 0.228 0.420 0.357 �0.886 0.000
High 0.663 0.589 0.518 0.424 0.439 0.420 0.620 0.518 �0.433 0.021
Governance index
Low 0.615 0.647 0.611 0.692 0.638 0.394 0.047
High 0.637 0.687 0.653 0.691 0.666 0.222 0.084
Managerial ownership
Low 0.649 0.661 0.638 0.698 0.661 0.292 0.121
High 0.582 0.618 0.604 0.702 0.627 0.699 0.005
Asset maturity
Low 0.539 0.453 0.277 0.176 0.131 0.146 0.351 0.287 �1.005 0.000
High 0.682 0.627 0.568 0.487 0.513 0.487 0.647 0.567 �0.348 0.021
R&D
Low 0.626 0.571 0.496 0.413 0.457 0.463 0.624 0.515 �0.210 0.201
High 0.605 0.486 0.261 0.113 0.038 0.006 0.054 0.217 �2.097 0.000
PPE
Low 0.540 0.460 0.270 0.151 0.098 0.098 0.261 0.260 �1.302 0.000
High 0.683 0.626 0.570 0.506 0.548 0.516 0.676 0.584 �0.214 0.123
Rating
Unrated 0.581 0.497 0.327 0.221 0.159 0.090 0.194 0.290 �1.595 0.000
Rated 0.724 0.703 0.749 0.732 0.792 0.754 0.805 0.750 0.285 0.000
Speculative grade 0.671 0.692 0.769 0.797 0.876 0.830 0.878 0.788 0.738 0.000
Investment grade 0.747 0.707 0.730 0.685 0.700 0.675 0.708 0.706 �0.170 0.148
Institutional ownership
Low 0.429 0.239 0.142 0.111 0.081 0.190 0.199 �1.073 0.000
High 0.644 0.611 0.532 0.578 0.587 0.721 0.608 0.156 0.311
Analyst coverage
Low 0.592 0.491 0.334 0.218 0.198 0.132 0.237 0.308 �1.424 0.000
High 0.689 0.638 0.592 0.491 0.514 0.574 0.717 0.596 �0.113 0.493
Dispersion of analyst forecasts
Low 0.714 0.668 0.655 0.600 0.645 0.673 0.737 0.667 0.045 0.601
High 0.694 0.637 0.560 0.427 0.301 0.324 0.554 0.492 �1.008 0.000
Asset volatility
Low 0.650 0.609 0.566 0.522 0.576 0.550 0.692 0.590 0.002 0.989
High 0.582 0.476 0.280 0.143 0.084 0.053 0.215 0.254 �1.607 0.000
Ple
ase
citeth
isa
rticlea
s:C
usto
dio
,C
.,e
ta
l.,W
hy
are
US
firm
su
sing
mo
resh
ort-te
rmd
eb
t?Jo
urn
al
of
Fina
ncia
lE
con
om
ics(2
01
2),
http
://dx
.do
i.org
/10
.10
16
/j.jfin
eco
.20
12
.10
.00
9
C.
Cu
stod
ioet
al.
/Jo
urn
al
of
Fina
ncia
lE
con
om
ics]
(]]]])]]]–
]]]8

Am
ihu
dil
liq
uid
ity
Low
0.7
26
0.6
82
0.6
48
0.5
51
0.5
67
0.5
86
0.7
25
0.6
27
�0
.49
10
.00
2
Hig
h0
.56
90
.57
50
.41
00
.23
50
.14
90
.10
00
.19
30
.32
7�
2.0
84
0.0
00
Ab
no
rma
le
arn
ing
s
Low
0.6
04
0.5
24
0.4
23
0.3
08
0.3
06
0.3
32
0.4
95
0.4
20
�0
.62
50
.00
6
Hig
h0
.63
60
.58
00
.47
20
.36
10
.36
00
.32
90
.57
60
.46
5�
0.6
33
0.0
04
Div
ide
nd
du
mm
y
No
np
ay
er
0.4
69
0.3
91
0.2
90
0.2
02
0.1
96
0.1
92
0.3
70
0.2
94
�0
.60
30
.00
2
Pa
ye
r0
.67
10
.64
30
.62
30
.56
60
.61
60
.60
00
.67
90
.62
5�
0.0
62
0.4
25
Re
turn
on
ass
ets
Low
0.5
92
0.4
86
0.3
08
0.2
07
0.1
52
0.1
28
0.3
29
0.3
06
�1
.25
20
.00
0
Hig
h0
.64
70
.60
70
.54
80
.45
80
.49
20
.51
20
.65
10
.55
4�
0.1
98
0.1
62
Ca
sh Low
0.5
85
0.5
30
0.4
48
0.3
91
0.4
72
0.4
71
0.6
61
0.5
01
0.0
76
0.6
61
Hig
h0
.65
40
.58
00
.44
50
.27
20
.16
60
.14
60
.30
40
.36
0�
1.6
48
0.0
00
List
ing
ye
ar
o1
98
00
.62
10
.59
30
.57
00
.52
00
.57
00
.59
00
.64
10
.58
40
.03
90
.62
3
19
80
–1
98
90
.28
70
.27
00
.25
00
.36
20
.34
90
.49
60
.33
00
.77
40
.00
0
19
90
–1
99
90
.16
80
.15
90
.19
60
.47
80
.23
81
.83
90
.00
1
20
00
–2
00
80
.05
80
.42
70
.22
26
.58
10
.00
3
Ag
e Ne
wli
st0
.50
70
.34
30
.26
40
.16
50
.14
00
.08
10
.44
50
.26
6�
0.6
86
0.0
16
Old
list
0.6
51
0.6
05
0.5
43
0.4
38
0.4
69
0.4
31
0.5
52
0.5
22
�0
.54
30
.00
0
Please cite this article as: Custodio, C., et al., Why are US fiEconomics (2012), http://dx.doi.org/10.1016/j.jfineco.2012.10
C. Custodio et al. / Journal of Financial Economics ] (]]]]) ]]]–]]] 9
the ratio of capital expenditures-to-assets (CAPEX), butmore pronounced in the low-CAPEX group than in thehigh-CAPEX group.4
Previous studies find a link between corporate govern-ance and debt maturity. Harford, Li, and Zhao (2006)argue that firms with better corporate governance,namely, firms with more independent boards, hold moreshort-term debt. Datta, Iskandar-Datta, and Raman (2005)and Brockman, Martin, and Unlu (2010) find that firmswith higher managerial ownership use more short-termdebt. This is consistent with the notion that managers usemore long-term debt than they normally would when theinterests of managers and shareholders are not properlyaligned.
We test if managerial agency costs can explain thetrend in debt maturity by looking at groups of firms basedon corporate governance characteristics. Table 3 reportsthe trend in debt maturity for firms with a high and lowgovernance index (Gompers, Ishii, and Metrick, 2003). Thegovernance index is a cumulative index of 24 antitakeoverprovisions obtained from RiskMetrics and is availablefrom 1990 to 2008. We do not see a significant differencein the median debt maturity 3 between the low- and high-governance index groups (64% versus 67%). Moreover, wefind no clear difference in the debt maturity trends acrossthese two groups. The evidence does not support the ideathat less shareholder-friendly firms (high-governanceindex) drive down debt maturity.
We find similar results using managerial ownershipobtained from ExecuComp. Managerial ownership dataare available only since 1992. Therefore, our sampleperiod is restricted to 1992–2008. The managerial own-ership measure is defined as the percentage of shares heldby the five highest-paid executives in the firm. We findthat firms with more managerial ownership, in which theinterests between managers and shareholders are betteraligned, hold more short-term debt. However, we do notobserve a difference in the evolution of maturity betweenthe two groups.5
In summary, agency costs do not seem to explain thedecline in debt maturity over time. This is true for bothagency costs of debt and managerial agency costs.A caveat is the fact that governance measures are avail-able only for a subsample of large firms (essentiallyStandard & Poor’s 1,500 firms) and years (1990–2008),which limits our analysis. This could explain why we donot find a clear decrease in debt maturity in any of thegroups when using governance measures.
3.3. Asymmetric information
We investigate if firms with higher information asym-metry are responsible for the decrease in debt maturityover time. So far, we find that smaller firms display a
4 We also reach similar conclusions using asset growth as a proxy
for growth opportunities.5 Untabulated results using chief executive officer (CEO) ownership
are similar to those using managerial ownership. We also reach similar
conclusions using board independence as a proxy for corporate govern-
ance quality.
rms using more short-term debt? Journal of Financial.009

C. Custodio et al. / Journal of Financial Economics ] (]]]]) ]]]–]]]10
stronger decline in debt maturity, which seems to supportthe information asymmetry hypothesis because theextent of the asymmetry is typically higher among smal-ler firms. We further test this hypothesis using alternativeproxies, including R&D expenditures, tangibility of assets,and bond rating.
Table 3 shows the evolution of debt maturity for high-and low-R&D firms. We classify firms whose R&D-to-assets ratio is above the 75th percentile as high-R&Dfirms and those whose R&D-to-assets ratio is below the75th percentile as low-R&D firms.6 The change in debtmaturity is dramatically different between these twogroups over the 1976–2008 period. In 1976–1979, therewas no significant difference in debt maturity betweenthe two groups. In the following years, however, the high-R&D group experienced a striking decrease in debtmaturity. The median debt maturity 3 fell from 61% in1976–1979 to 5% in 2005–2008 for more R&D-intensivefirms, and for less R&D-intensive firms the median did notdrop over the same period. We see a similar pattern whenwe use asset tangibility (property, plant and equipment,PPE) as a proxy for the degree of information asymmetrybetween insiders and outside investors. We find that low-PPE firms use more short-term debt and contribute moreto the trend in debt maturity than high-PPE firms. Thus,low tangibility firms and R&D-intensive firms are usingmore short-term debt than they used to, which isconsistent with the asymmetric information hypothesis.
We then split the sample between firms with andwithout a bond rating. Unrated firms are expected to havea higher degree of information asymmetry and, therefore,to use more short-term debt. The median debt maturity 3
is more than two times greater for rated firms (75%) thanfor unrated firms (29%). In addition, we find that debtmaturity increases for rated firms, and for unrated firmswe find a negative and significant trend.7
We find similar results when using more dynamicproxies of asymmetric information (institutional owner-ship, analyst coverage, dispersion of analyst forecasts, andasset volatility) and market microstructure measures ofadverse selection (illiquidity measure of Amihud, 2002).We use these variables to classify firms into low- andhigh-information asymmetry groups using the yearlymedian as a breakpoint. Table 3 shows that the drop indebt maturity is explained by firms with high informationasymmetry as proxied by low institutional ownership andanalyst coverage and high dispersion of analyst forecasts,volatility, and illiquidity. There is a negative and signifi-cant trend in debt maturity in the groups with highinformation asymmetry, and there is no trend in thegroups with low information asymmetry.8
6 The 75th percentile corresponds to roughly the median for firms
with positive R&D expenditures as only 40% of the observations have
positive R&D.7 Untabulated results suggest that the decrease in debt maturity is
mainly driven by firms not listed on the NYSE and firms that are not part
of the Standard & Poor’s 500 index. This is consistent with firms with
higher information asymmetry being responsible for the decline in debt
maturity.8 In untabulated results we obtain similar findings using alternative
measures of adverse selection, including the effective bid-ask spread
Please cite this article as: Custodio, C., et al., Why are US fiEconomics (2012), http://dx.doi.org/10.1016/j.jfineco.2012.10
In short, the cross-sectional evidence shows that firmswith more information asymmetry use more short-termdebt. Moreover, the evolution of debt maturity for groupsof firms with high information asymmetry suggests thatthese firms play a key role in explaining the decline indebt maturity.
3.4. Signaling and liquidity risk
We test the signaling hypothesis using abnormal earn-ings as a proxy. Table 3 reports the median debt maturityfor groups of firms with high and low abnormal earnings,based on the yearly median. According to the signalinghypothesis of debt maturity, firms with higher abnormalearnings have better projects and are expected to issueshort-term debt as a signal of good quality. We do not findcross-sectional variation that is consistent with thishypothesis. The median debt maturity 3 is 42% in thegroup with low abnormal earnings and 47% in the groupwith high abnormal earnings. If signaling explains thedecline in debt maturity, we should see the debt maturityof firms with high abnormal earnings decrease more thanthat of firms with low abnormal earnings. We do notobserve this pattern. There is a similar negative andsignificant trend in both groups.
We then use credit quality to test the signalinghypothesis. There is no significant increase in the use ofshort-term debt by firms with investment-grade ratings.In addition, firms with speculative-grade ratings havebeen using more long-term debt over time, as we observea positive and significant trend in debt maturity. Thus,patterns in debt maturity across credit quality groups donot seem to be consistent with signaling as an explana-tion for the decrease in debt maturity.
3.5. Dividends, profitability, and cash
We investigate whether the decrease in debt maturityis related to the disappearing dividends phenomenon(Fama and French, 2001). Table 3 shows the results fornondividend and dividend-paying firms. Firms that do notpay dividends are more likely to be financially con-strained and less likely to use long-term debt. Nondivi-dend payers have shorter debt maturity relative todividend-paying firms. Median debt maturity 3 is 29%and 63%, respectively. A much more pronounced decreasein debt maturity is evident among nondividend payersthan among dividend payers. The median debt maturity 3of nondividend payers fell from 47% in 1976–1979 to 19%in 2000–2004, while for dividend payers it fell onlyslightly from 67% to 60%.
(footnote continued)
(Roll, 1984), probability of informed trading (Easley, Hvidkjaer, and
O’Hara, 2002), the Amivest liquidity ratio (Cooper, Groth, and Avera,
1985), and the reversal coefficient (gamma) of Pastor and Stambaugh
(2003). The estimates of the probability of informed trading (PIN) are
obtained from Soeren Hvidkjaer’s website: https://sites.google.com/site/
hvidkjaer/. The Amivest liquidity ratio, gamma measure, Amihud illi-
quidity, and effective bid-ask spread are obtained from Joel Hasbrouck’s
website: http://people.stern.nyu.edu/jhasbrou/.
rms using more short-term debt? Journal of Financial.009

C. Custodio et al. / Journal of Financial Economics ] (]]]]) ]]]–]]] 11
Profitability also seems to be related to the decrease inthe use of long-term debt. When we split the sample intolow- and high-return on assets firms using the yearlymedian, we observe that firms with lower accountingprofitability have a significantly shorter debt maturitythan firms with higher accounting profitability. A cleardifference also emerges in the observed evolution of debtmaturity between the two profitability groups. The trendin debt maturity for low return on assets firms is negativeand significant; for high return on assets firms, the trendis insignificant.9
We also find a link between shorter debt maturity andthe increase in cash holdings of US industrial firms (Bates,Kahle, and Stulz, 2009). When we split the sample intolow- and high-cash firms using the yearly median, we seethat firms with higher cash holdings use more short-termdebt than firms with lower cash holdings. Moreover, thetrend in debt maturity is negative and significant in thegroup of firms with higher cash holdings, but not in thegroup of firms with lower cash holdings.
3.6. Listing vintage
Fama and French (2004) show a surge in new stockexchange listings in the 1980s and 1990s and a change inthe characteristics of the new listings. They argue that thechange in the characteristics of new listings was due to adecline in the cost of equity that allowed firms with moredistant expected cash flows to issue public equity. Brownand Kapadia (2007) find that the increase in idiosyncraticrisk in the US stock market, first shown by Campbell, Lettau,Malkiel, and Xu (2001), is driven by newly listed firms.
Panel A of Fig. 2 shows the number of new firms listedon major US stock markets (NYSE, Amex, and Nasdaq) in oursample for the 1976–2008 period. We define a new listingas a firm that appears for the first time in the Center forResearch in Security Prices (CRSP). New listings surged fromabout 100 per year in the late 1970s to nearly 600 in 1983.Over the 1980–2000 period, there was no single year withfewer than 200 new listings. After 2000, a dramatic declinewas evident in the number of new listings to fewer than 100per year, and this number remained below 200 until 2008,which could explain the increase in debt maturity in the2000s. The surge in the number of new listings in the 1980sand 1990s is consistent with the evidence in Fama andFrench (2004).10
We test if the new listing groups can explain thedecrease in corporate use of long-term debt. We definelisting groups according to a firm’s listing year. The firstgroup includes firms listed before 1980; the second group,firms listed between 1980 and 1989; the third group, firmslisted between 1990 and 1999; and the final group, firmslisted after 1999. Table 3 reports the median debt maturityratios by listing group, and Panel B of Fig. 2 shows the yearlyevolution of the median debt maturity for the listing groups.
9 Untabulated results using positive and negative net income to
identify high- and low-profit groups are similar.10 The number of newly listed firms in Panel A of Fig. 2 is slightly
different from that in Fama and French (2004) because our sample
contains only firms in Compustat.
Please cite this article as: Custodio, C., et al., Why are US fiEconomics (2012), http://dx.doi.org/10.1016/j.jfineco.2012.10
We find that firms in the most recent listing groups usemore short-term debt. Within each group there is nonegative trend in debt maturity. The median debt maturityin the pre-1980 group does not display a significant timetrend, and the other groups display a positive and significanttrend. This evidence is consistent with the downward trendin maturity being generated by new firms in the sample ofpublicly traded firms.
Finally, we investigate whether the listing groups find-ings are directly related to firm age. We measure firm ageusing the CRSP listing date and classify a firm as a newlisting if it was listed in the prior 5-year period and as an oldlisting otherwise. We find that new listings use more short-term debt. However, we observe a significant decrease indebt maturity for both old and new listings. The decline isgreater for new listings, but there is also a significantnegative trend for old listings. We conclude that the declinein debt maturity is not fully explained by firm age. Instead,we argue that a change in the composition of firms isresponsible for the decline in debt maturity.
To confirm that a change in the composition of firms isa key factor in explaining the trend in debt maturity, weestimate the time trend coefficient (untabulated) of debtmaturity for each firm in our sample with at least 5 yearlyobservations. If the sample composition was relevant, wewould expect to find that the trend coefficient is insignif-icant for the majority of the firms in our sample. We findthat for 70% of the firms (4,830 firms out of a total of6,877 firms) the trend coefficient is insignificant (2,322have a positive trend and 2,508 a negative trend).Furthermore, 11% of firms have a positive and significanttrend in debt maturity and 19% of firms have a negativeand significant trend coefficient.
The individual time trend coefficients might be esti-mated imprecisely for some firms due to a low number ofobservations. If we require that a firm has at least 10yearly observations we find similar results—65% of thefirms have an insignificant trend coefficient (1,082 have apositive trend and 1,199 have a negative trend). We alsolook at the evolution of debt maturity for a balanced panelof firms (i.e., firms that exist in every year over the sampleperiod) by definition, the balanced panel excludes newlistings. Fig. 3 shows no trend in debt maturity for thebalanced panel, but a clear downward trend emerges inthe full sample of firms.
In summary, we find that firms with higher informa-tion asymmetry are responsible for the decrease in debtmaturity, while agency costs, signaling, and liquidity risktheories do not seem to be consistent with the decrease indebt maturity. In addition, we find that the disappearingdividends, decline in profitability, and increase in cashholdings phenomena seem to be associated with a greateruse of short-term debt among US industrial firms.The surge in new listings in 1980s and 1990s and achange in the composition of firms are also related tothe decrease in debt maturity.
3.7. Industry structure
A natural question about the newly public companies ishow they affect the overall industry composition of the US
rms using more short-term debt? Journal of Financial.009

0
100
200
300
400
500
600
700
800
Num
ber
of
new
lis
ts
0
0.1
0.2
0.3
0.4
0.5
0.6
0.7
1976 1978 1980 1982 1984 1986 1988 1990 1992 1994 1996 1998 2000 2002 2004 2006 2008
1976 1978 1980 1982 1984 1986 1988 1990 1992 1994 1996 1998 2000 2002 2004 2006 2008
Per
cen
tage
of
deb
t m
aturi
ng i
n m
ore
than
thre
e yea
rs
pre-1980 1980-1989 1990-1999 2000-2008
Fig. 2. Debt maturity by listing decade and number of new listings. Panel A plots the number of new listings; Panel B, the median debt maturity, defined
as the percentage of debt maturing in more than 3 years, of each listing decade. The sample consists of observations of Compustat firms from 1976 to
2008. Financial industries (SIC codes 6000–6999) and utilities (SIC codes 4900–4999) are omitted.
C. Custodio et al. / Journal of Financial Economics ] (]]]]) ]]]–]]]12
stock market. In this section, we examine the industrycomposition and the evolution of debt maturity over timeby industry. The industry breakdown is based on the 49industry group classification by Fama and French (1997).11
If riskier industries have increased in size because ofnewly listed companies, this could cause a decrease in
11 Detailed results on debt maturity and market capitalization
weights by industry are available upon request.
Please cite this article as: Custodio, C., et al., Why are US fiEconomics (2012), http://dx.doi.org/10.1016/j.jfineco.2012.10
debt maturity. The industry composition has changedsubstantially over the sample period, with pharmaceuti-cal products, retail, electronic equipment, and medicalequipment experiencing the largest increase in marketcapitalization weight. Pharmaceutical products and med-ical equipment are also among the industries that had thelargest increase in the number of firms. Industries withthe largest decrease in market capitalization weightinclude chemicals, automobiles and trucks, and petroleumand natural gas.
rms using more short-term debt? Journal of Financial.009
0
0.1
0.2
0.3
0.4
0.5
0.6
0.7
0.8
1976 1978 1980 1982 1984 1986 1988 1990 1992 1994 1996 1998 2000 2002 2004 2006 2008
Per
centa
ge
of
deb
t m
aturi
ng i
n m
ore
than
thre
e yea
rs
Full sample Balanced panel
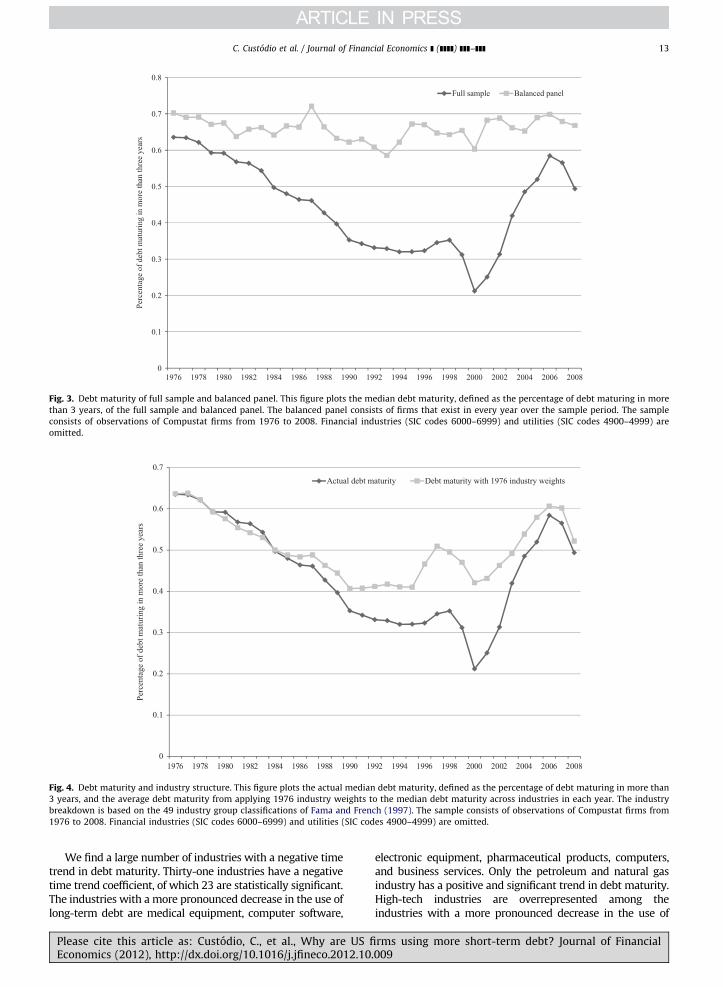
Fig. 3. Debt maturity of full sample and balanced panel. This figure plots the median debt maturity, defined as the percentage of debt maturing in more
than 3 years, of the full sample and balanced panel. The balanced panel consists of firms that exist in every year over the sample period. The sample
consists of observations of Compustat firms from 1976 to 2008. Financial industries (SIC codes 6000–6999) and utilities (SIC codes 4900–4999) are
omitted.
0
0.1
0.2
0.3
0.4
0.5
0.6
0.7
1976 1978 1980 1982 1984 1986 1988 1990 1992 1994 1996 1998 2000 2002 2004 2006 2008
Per
centa
ge
of
deb
t m
aturi
ng i
n m
ore
than
thre
e yea
rs
Actual debt maturity Debt maturity with 1976 industry weights
Fig. 4. Debt maturity and industry structure. This figure plots the actual median debt maturity, defined as the percentage of debt maturing in more than
3 years, and the average debt maturity from applying 1976 industry weights to the median debt maturity across industries in each year. The industry
breakdown is based on the 49 industry group classifications of Fama and French (1997). The sample consists of observations of Compustat firms from
1976 to 2008. Financial industries (SIC codes 6000–6999) and utilities (SIC codes 4900–4999) are omitted.
C. Custodio et al. / Journal of Financial Economics ] (]]]]) ]]]–]]] 13
We find a large number of industries with a negative timetrend in debt maturity. Thirty-one industries have a negativetime trend coefficient, of which 23 are statistically significant.The industries with a more pronounced decrease in the use oflong-term debt are medical equipment, computer software,
Please cite this article as: Custodio, C., et al., Why are US fiEconomics (2012), http://dx.doi.org/10.1016/j.jfineco.2012.10
electronic equipment, pharmaceutical products, computers,and business services. Only the petroleum and natural gasindustry has a positive and significant trend in debt maturity.High-tech industries are overrepresented among theindustries with a more pronounced decrease in the use of
rms using more short-term debt? Journal of Financial.009

0.35
0.4
0.45
0.5
0.55
0.6
0.65
0.7
0.75
0.8
1990 1991 1992 1993 1994 1995 1996 1997 1998 1999 2000 2001 2002 2003 2004 2005 2006 2007 2008
Per
centa
ge
of
deb
t m
aturi
ng i
n m
ore
than
one
yea
r
US Non-US Japan UK Germany France
Fig. 5. Debt maturity: international evidence. This figure plots the average debt maturity, defined as the percentage of debt maturing in more than 1 year,
for US and non-US firms, and for four other major countries. The sample consists of observations of Worldscope firms in 23 developed countries from
1990 to 2008. Financial industries (SIC codes 6000�6999) and utilities (SIC codes 4900–4999) are omitted.
C. Custodio et al. / Journal of Financial Economics ] (]]]]) ]]]–]]]14
long-term debt. The debt maturing in less than 3 yearsrepresents 49% of the total debt for firms in high-techindustries, but only 24% for firms in low-tech industries,which is consistent with the idea that high-tech firmsexperience higher information asymmetry. Although bothgroups show a decline in debt maturity, the trend is muchmore pronounced for high-tech firms.12
Our industry results show that changes in industrycomposition are important to explain the decrease in debtmaturity. We find that the industries with a stronger declinein maturity have a stronger increase in market capitalizationweight (e.g., pharmaceutical products). To gain additionalunderstanding of the importance of industry effects, Fig. 4shows the evolution of the actual median debt maturity andthe value-weighted average of the median debt maturityacross industries keeping the industry weights constant attheir 1976 level. The lines in Fig. 4 start to diverge in 1985,with the actual debt maturity decreasing significantly morethan the average debt maturity using 1976 industry weights.The difference increases to more than 20% in 2000. Thissuggests that changes in industry weights play an importantrole in explaining the decline in debt maturity. Moreover, theaverage debt maturity using 1976 weights also presents adownward trend up to 2000, which indicates that a change inthe composition of firms within an industry also plays a role.
3.8. International evidence
One important question is whether there is also adecrease in debt maturity outside of the US. We draw data
12 Industries are classified in the high-tech or low-tech industry
groups using the Loughran and Ritter (2004) classifications scheme.
Please cite this article as: Custodio, C., et al., Why are US fiEconomics (2012), http://dx.doi.org/10.1016/j.jfineco.2012.10
on debt maturity structure for non-US firms (excludingutilities and financial firms) from Worldscope for the1990–2008 period. The analysis is restricted to the1990–2008 period because the Worldscope coverage ispoor for most countries before 1990. The sample includes184,727 observations from 28,501 unique firms in 23developed countries. Worldscope does not contain asdetailed information on the debt maturity structure asCompustat, and we can observe only the amount of short-term and long-term debt. We calculate the ratio of long-term debt to total debt as a proxy for debt maturity (i.e.,the percentage of debt maturing in more than a year).
Fig. 5 shows the average debt maturity ratio for non-US and US firms, as well as for firms from four other majorcountries (Japan, UK, Germany, and France). While evi-dence exists of a decrease in debt maturity in the US, noevidence shows a decrease outside of the US. The averageratio of long-term debt to total debt has remained stableat about 52% over the sample period outside of the US,while it has decreased from about 75% to 65% in the US.Interestingly, there is no indication of a decrease in debtmaturity in the UK, Germany, or France, but there is adecline in debt maturity in Japan, which could be relatedto extremely low levels of short-term interest rates in thiscountry over the sample period.
4. Did the demand function for debt maturity change?
In this section, we use the existing models on thedeterminants of debt maturity to analyze if the decreasein debt maturity can be attributed to a change in firm-specific demand-side factors or to a change in the sensi-tivities of debt maturity to its determinants.
rms using more short-term debt? Journal of Financial.009

C. Custodio et al. / Journal of Financial Economics ] (]]]]) ]]]–]]] 15
4.1. Regression estimates
We first address the question whether firm character-istics have changed over time by running a set of regres-sions that relate debt maturity to firm characteristics.We use the percentage of debt maturing in more than 3years (debt maturity 3) as the dependent variable in allregression models.
Table 4 shows estimates of panel regressions of debtmaturity. Column 1 shows the estimates of an ordinaryleast squares (OLS) regression. The coefficients of all thevariables have the predicted sign, with the exception ofabnormal earnings. As expected, the coefficient of firm sizeis positive and significant, and the coefficient of firm sizesquared is negative and significant. These estimates areconsistent with the nonlinear relation between debtmaturity and credit quality predicted by Diamond (1991).The coefficient of market-to-book is negative and signifi-cant, consistent with the notion that firms with moregrowth opportunities use more short-term debt to mitigatethe agency costs of debt. The coefficient on abnormalearnings is positive and significant, which does not supportthe signaling hypothesis. Evidence shows that firms matchthe maturities of their assets and liabilities, as the assetmaturity coefficient is positive and significant. As expected,
Table 4Panel regression of debt maturity.
This table reports the estimates of OLS and firm fixed effects regressions of d
years. The sample consists of observations of Compustat firms from 1976 to 2
4900–4999) are omitted. Refer to Table A.1 in Appendix A for variable definition
OLS OLS OLS OLS
Variable (1) (2) (3) (4)
Trend�100
Size 1.111 1.092 1.102 1.10
(51.72) (51.74) (51.40) (51.3
Size2�0.852 �0.851 �0.846 �0.84
(�32.25) (�32.67) (�32.99) (�31.9
Market-to-book �0.018 �0.017 �0.017 �0.01
(�22.51) (�22.51) (�21.93) (�22.1
Abnormal earnings 0.024 0.023 0.023 0.02
(11.78) (11.91) (11.44) (10.8
Asset maturity 0.003 0.002 0.003 0.00
(13.44) (9.05) (13.34) (13.2
Asset volatility �0.165 �0.146 �0.155 �0.14
(�27.05) (�23.86) (�25.45) (�22.9
Leverage 0.398 0.385 0.401 0.40
(44.15) (42.66) (44.41) (45.0
R&D �0.185 �0.166 �0.180 �0.17
(�12.26) (�10.40) (�11.91) (�11.7
Term spread �1.261 �1.228 �0.868
(�15.06) (�14.81) (�10.28)
1980s dummy �0.032
(�7.86)
1990s dummy �0.074
(�15.13)
2000s dummy �0.039
(�7.21)
Intercept 0.259 0.296
(51.35) (50.57)
Industry dummies No Yes No N
Year dummies No No No Y
Number of observations 97,215 97,215 97,215 97,21
R2 0.304 0.320 0.309 0.31
Please cite this article as: Custodio, C., et al., Why are US fiEconomics (2012), http://dx.doi.org/10.1016/j.jfineco.2012.10
the asset volatility coefficient is negative and significant.Consistent with the results in Johnson (2003) and others,leverage is positive and significant, indicating that debtmaturity increases with leverage. The R&D coefficient isnegative and significant, indicating that R&D-intensivefirms use more short-term debt, which is consistent withthe asymmetric information hypothesis. The term spread isnegative and significant, which is consistent with thenotion that managers time the market and prefer to issueshort-term debt when short-term interest rates are lowcompared with long-term rates. Column 2 estimates themodel in Column 1, including industry dummies. Thecoefficients are similar to those in Column 1.
The model in Column 3 includes three dummy vari-ables that allow the intercept to shift in the 1980s, 1990s,and 2000s with respect to the 1970s (i.e., 1976–1979).This enables us to test if the intercepts of the modelchange over time in a significant way and also if thechanges in debt maturity are explained by the changes inthe variables included in the regression model. Thedecade dummies are negative and highly significant,which is consistent with the changes in firm character-istics in the regression model not fully explaining thedecrease in debt maturity. The coefficient of the 1990s isgreater in absolute terms than the coefficient of the 1980s
ebt maturity, defined as the percentage of debt maturing in more than 3
008. Financial industries (SIC codes 6000–6999) and utilities (SIC codes
s. Robust t-statistics adjusted for firm-level clustering are in parentheses.
FE OLS OLS OLS FE
(5) (6) (7) (8) (9)
�0.376 �0.115 �0.095 �0.122
(�15.73) (�5.98) (�4.95) (�4.13)
0 0.713 1.109 1.091 0.675
6) (20.91) (51.51) (51.54) (19.67)
4 �0.505 �0.850 �0.849 �0.478
5) (�12.98) (�32.03) (�32.49) (�12.16)
7 �0.012 �0.017 �0.017 �0.012
1) (�12.68) (�22.53) (�22.55) (�12.42)
1 0.016 0.023 0.023 0.018
4) (8.19) (11.51) (11.69) (8.89)
2 0.000 0.003 0.002 0.000
4) (1.19) (13.31) (8.97) (0.78)
5 �0.019 �0.160 �0.143 �0.030
3) (�2.94) (�26.29) (�23.40) (�4.77)
9 0.350 0.399 0.385 0.333
3) (29.26) (44.10) (42.58) (27.91)
7 �0.097 �0.176 �0.159 �0.113
0) (�3.94) (�11.54) (�9.93) (�4.51)
�1.133 �1.124 �0.916
(�13.50) (�13.51) (�10.56)
0.502 0.275
(111.84) (47.13)
o No No No Yes No
es Yes No No No No
5 97,215 97,215 97,215 97,215 97,215
5 0.605 0.010 0.305 0.321 0.599
rms using more short-term debt? Journal of Financial.009

C. Custodio et al. / Journal of Financial Economics ] (]]]]) ]]]–]]]16
and 2000s, suggesting that during the 1990s a bigger partof the decrease in maturity is not explained by thevariables in the model.
The model in Column 4 estimates the model in Column 1,including year dummies. The year dummies coefficients alsoprovide an indication of whether there is a negative andsignificant trend in debt maturity after controlling forchanges in firm-specific demand-side factors. We find thatthe year dummies coefficients (coefficients not shown) arenegative and significant in 27 years out of a total of 33 years.A F-test statistic of 30.23 strongly rejects the hypothesis thatthe year dummies coefficients are jointly equal to zero.
The model in Column 5 includes firm fixed effects thatcontrol for unobserved sources of firm heterogeneity andsolve joint determination problems in which an unobservedtime-invariant variable simultaneously determines debtmaturity and firm characteristics. The coefficients on thefirm characteristics are similar to those in Column 1 exceptfor asset maturity, which is not statistically significant.
Column (6) estimates the debt maturity regressionusing a linear time trend as the only explanatory variable.The time trend coefficient indicates a significant decreasein debt maturity of 0.38% per year. Columns 7–9 presentestimates that replicate the models in Columns 1, 2, and 5but include a linear time trend, which allows us to testwhether there is a significant trend after controlling for
Table 5Panel regression of debt maturity: robustness.
This table reports the estimates of several alternative regression models of d
years. The sample consists of observations of Compustat firms from 1976 to 2
4900–4999) are omitted. Refer to Table A.1 in Appendix A for variable definition
Alternative models
Estimate Interactio
OLS log Tobit Changes 1976–
1979
1980s
Variable (1) (2) (3) (4) (5)
Trend�100 �1.992 �0.179 �0.104
(�11.65) (�7.85) (�11.87)
Size 5.260 1.300 0.332 0.699 0.34
(28.84) (52.89) (11.84) (16.22) (7.5
Size2�4.005 �1.003 �0.199 �0.513 �0.30
(�21.93) (�34.02) (�5.97) (�10.77) (�5.9
Market-to-book �0.125 �0.026 �0.006 �0.025 0.01
(�5.10) (�18.31) (�7.86) (�5.59) (2.1
Abnormal earnings 0.116 0.028 0.011 0.046 �0.01
(2.85) (10.88) (7.47) (5.88) (�1.8
Asset maturity 0.014 0.003 0.000 0.004 �0.00
(7.05) (11.17) (1.32) (6.46) (�3.2
Asset volatility �1.247 �0.221 �0.003 �0.130 �0.04
(�8.99) (�25.27) (�0.79) (�4.72) (�1.4
Leverage 1.733 0.494 0.189 0.171 0.07
(18.54) (44.48) (16.56) (6.06) (2.7
R&D �1.499 �0.338 �0.098 �0.136 �0.09
(�3.75) (�13.30) (�5.39) (�1.00) (�0.7
Term spread �4.694 �1.279 �0.386 0.152 �0.16
(�4.24) (�12.76) (�5.41) (1.02) (�0.8
Lagged debt maturity �0.246
(�77.80)
Intercept �1.891 0.240 0.124 0.408 �0.09
(�32.16) (33.59) (53.02) (31.59) (�6.8
Number of
observations
80,561 97,215 78,718
R2 0.057 0.3052 0.130
Please cite this article as: Custodio, C., et al., Why are US fiEconomics (2012), http://dx.doi.org/10.1016/j.jfineco.2012.10
changes in firm characteristics. We find a negative andsignificant trend coefficient in all models but the magni-tude of the coefficient is significantly smaller than inColumn 6, where we do not control for changes indemand-side factors. The trend coefficient in Column 7indicates a decrease in debt maturity of 0.12% per year.The magnitude of the time trend coefficient is similarwhen we include industry dummies or firm fixed effectsin Columns 8 and 9.
4.2. Robustness
In this subsection we investigate the robustness of theregression estimates in Table 4 in several ways. We use theOLS specification in Column 7 of Table 4 as a benchmark.
Because debt maturity is bounded at zero and one, weestimate the model using the logarithm of debt maturity 3 asthe dependent variable and a Tobit model of debt maturity 3.The results in Columns 1 and 2 of Table 5 are consistentwith the ones in Table 4. Column 3 presents the estimates ofa model that uses yearly changes of the dependent andindependent variables. This approach allows us to eliminatethe impact of time-invariant unobserved firm characteristicson debt maturity. The results are consistent with those inTable 4. More important, the time trend coefficient isnegative and significant in all models.
ebt maturity, defined as the percentage of debt maturing in more than 3
008. Financial industries (SIC codes 6000–6999) and utilities (SIC codes
s. Robust t-statistics adjusted for firm-level clustering are in parentheses.
OLS Fama and Macbeth
n Interaction Interaction 1976– 1980– 1990– 2000–
1990s 2000s 1979 1989 1999 2008
(6) (7) (8) (9) (10) (11)
4 0.444 0.531 0.695 1.017 1.142 1.204
3) (8.48) (9.34) (12.45) (20.53) (39.24) (31.54)
0 �0.358 �0.436 �0.510 �0.792 �0.872 �0.923
7) (�6.02) (�6.78) (�7.03) (�19.15) (�24.69) (�15.96)
0 0.008 0.006 �0.026 �0.016 �0.019 �0.023
9) (1.68) (1.37) (�11.10) (�10.40) (�9.76) (�10.04)
6 �0.027 �0.027 0.044 0.036 0.021 0.011
4) (�3.16) (�3.19) (4.67) (5.97) (8.88) (0.98)
2 �0.002 �0.001 0.004 0.002 0.003 0.003
3) (�2.16) (�1.66) (11.10) (8.58) (23.69) (18.25)
1 �0.015 �0.002 �0.141 �0.174 �0.147 �0.110
5) (�0.53) (�0.08) (�7.19) (�19.55) (�27.93) (�9.30)
9 0.292 0.347 0.168 0.251 0.456 0.553
4) (9.41) (10.64) (8.87) (15.94) (14.26) (26.16)
8 �0.011 �0.022 �0.125 �0.161 �0.151 �0.155
2) (�0.08) (�0.16) (�3.67) (�6.78) (�7.00) (�8.25)
7 �1.887 �1.584
8) (�7.80) (�7.25)
1 �0.204 �0.200 0.411 0.320 0.189 0.190
0) (�13.90) (�12.84) (36.58) (16.11) (28.90) (10.69)
97,215 9,826 29,802 34,496 23,091
0.316 0.175 0.251 0.326 0.344
rms using more short-term debt? Journal of Financial.009

13 In untabulated results, we check that other macroeconomic
factors, including aggregate risk (Acharya, Almeida, and Campello,
2011), do not explain the decrease in corporate use of long-term debt.
C. Custodio et al. / Journal of Financial Economics ] (]]]]) ]]]–]]] 17
In the model in Columns 4–7 of Table 5, we interactthe 1980s, 1990s, and 2000s dummies with firm char-acteristics, allowing the slopes of these variables tochange over time. Column 4 of this model reports theestimates for the base period (1976–1979), and theinteraction terms with the 1980s, 1990s, and 2000sdecades are reported in Columns 5–7, respectively. Sig-nificant changes are evident in the slopes of the coeffi-cient of size, market-to-book, abnormal earnings, assetmaturity, and leverage. However, only the changes in theslope of abnormal earnings and asset maturity explain thedecrease in debt maturity as its sensitivity drops duringthe 1980s, 1990s, and 2000s. Nevertheless, this model isnot able to explain the decrease in debt maturity becausethe intercepts are still negative and highly statisticallysignificant. The improvement in the R2 from the model inColumn 3 of Table 4 to this model that allows for changesin slopes is small (less than 1%).
We further investigate if there is a change in thesensitivities of debt maturity to firm characteristics. Weestimate cross-sectional regressions using the Fama andMacBeth procedure for four different subperiods. Column8 presents the estimates for the first subperiod (1976–1979); Column 9 the estimates for the second subperiod(1980–1989); Column 10 the estimates for the thirdsubperiod (1990–1999); and Column 11 for the finalsubperiod (2000–2008). The results in all models areconsistent with the OLS and fixed effects regressions,and all the variables have the expected impact on debtmaturity, with the exception of abnormal earnings. All thecoefficients maintain the same sign across the subperiods,suggesting no dramatic changes in the sensitivities ofdebt maturity to its determinants.
Table 6 presents estimates of the debt maturity regres-sion including additional explanatory variables. The mod-els in Panel A of Table 6 introduce several additional firmcharacteristics as explanatory variables that are used lessoften in the debt maturity literature: rating dummy,taxes, profitability (return on assets), cash, tangibility(PPE), and dividends. The models in Panel A of Table 6also include proxies for information asymmetry as expla-natory variables: institutional ownership, analyst cover-age, and Amihud illiquidity.
The rating dummy, taxes, return on assets, cash, PPE,and dividend dummy coefficients are positive and sig-nificant. The institutional ownership and analyst coveragecoefficients are positive and significant, and the Amihudilliquidity coefficient is negative and significant, which isconsistent with firms with higher information asymmetryusing less long-term debt. More important to our analysis,the trend coefficient is still negative and significant in allthese models, although some of these variables are able tocapture part of the trend left unexplained in Table 4.In particular, the trend is lower relative to Column 7 ofTable 4 (but still significant) in the models that control fortaxes, tangibility, and dividends. We conclude thatchanges in additional firm characteristics are not able tosignificantly explain the trend in debt maturity relative toTable 4.
The models in Panel B of Table 6 include additionalmacroeconomic factors as explanatory variables. The effect
Please cite this article as: Custodio, C., et al., Why are US fiEconomics (2012), http://dx.doi.org/10.1016/j.jfineco.2012.10
of macroeconomic conditions on debt maturity can beexplained both by demand-based explanations, in whichless information-sensitive securities are issued during poorconditions, and by supply-based ones, in which suppliers ofcapital require a shorter maturity during poor conditions.Erel, Julio, Kim and Weisbach (2012) show that firms aremore likely to use bonds and loans with shorter maturitywhen financial conditions are poor.
We include the short-term rate, inflation, the realshort-term rate, and default spread as additional macro-economic variables, as a firm might react to changes indebt market conditions by adjusting its debt maturity(Baker, Greenwoood and Wurgler, 2003). We also con-sider a National Bureau of Economic Research (NBER)-recession dummy to proxy for the overall business con-ditions and a bank stock index market-adjusted return toproxy for the conditions in the bank loan market.The short-term rate, inflation, and real short-term ratecoefficients are positive, which indicate that firms usemore short-term debt when it is cheaper to do so. Thedefault spread and the bank stock index return arenegative and significant, which indicates that firms usemore short-term debt when conditions in the debt marketdeteriorate.
Greenwood, Hanson and Stein (2010) argue that asubstitution effect exists between corporate debt andgovernment debt maturities and suggest that the timevariation in the maturity of corporate debt arises becausefirms act as macro liquidity providers, issuing more long-term debt when the government issues more short-termdebt and vice versa. In Column 7 we add the long-termgovernment share variable, defined as the fraction ofgovernment debt with a maturity of 1 year or more. Thecoefficient of government share is negative and statisti-cally significant, which is consistent with the predictionsand results of Greenwood, Hanson and Stein (2010).
More important to our analysis, the coefficient of thetime trend remains negative and significant for all themodels that include additional macroeconomic variables,suggesting that these variables do not explain the trend indebt maturity. The magnitude of the time trend coeffi-cient is similar to that of Table 4. The macroeconomicfactor that is more successful in explaining the trend indebt maturity is inflation but a significant part of thetrend is still left unexplained in Column 2.13
We also address the concern that the choice of leverageand debt maturity is likely to be simultaneous. FollowingJohnson (2003) and Billett, King and Mauer (2007), weestimate a system that models leverage and debt maturityas jointly endogenous using three-stage least squares (3SLS).In untabulated results, we obtain similar estimates to thoseobtained in Table 4. In particular, the magnitude of the timetrend coefficient is not affected.
Finally, we run the regressions in Table 4 in the sampleof non-US firms over the 1990–2008 period. The depen-dent variable is the ratio of long-term debt to total debt.
rms using more short-term debt? Journal of Financial.009

Table 6Panel regression of debt maturity: additional firm characteristics and macroeconomic variables.
This table reports the estimates of OLS regressions of debt maturity, defined as the percentage of debt maturing in more than 3 years. The regressions
include the same firm characteristics (coefficients not shown) as in Table 4. The sample consists of observations of Compustat firms from 1976 to 2008.
Financial industries (SIC codes 6000–6999) and utilities (SIC codes 4900–4999) are omitted. Refer to Table A.1 in Appendix A for variable definitions.
Robust t-statistics adjusted for firm-level clustering are in parentheses.
Panel A: Firm characteristics
Variable (1) (2) (3) (4) (5) (6) (7) (8) (9)
Trend x 100 �0.203 �0.074 �0.112 �0.125 �0.078 �0.059 �0.234 �0.305 �0.141
(�10.54) (�3.84) (�5.82) (�6.47) (�4.01) (�3.02) (�9.54) (�11.54) (�7.07)
Rating dummy 0.159
(30.24)
Taxes 0.082
(17.09)
Return on assets 0.068
(10.87)
Cash 0.070
(6.09)
PPE 0.176
(15.29)
Dividend dummy 0.056
(12.33)
Institutional ownership 0.173
(17.36)
Analyst coverage 0.002
(5.16)
Amihud illiquidity �0.002
(�19.32)
Intercept 0.295 0.240 0.262 0.269 0.245 0.242 0.298 0.260 0.278
(51.06) (40.87) (44.53) (45.58) (39.44) (39.56) (40.71) (40.01) (47.43)
Number of observations 97,215 97,205 97,213 97,207 97,212 97,215 70,828 87,389 97,215
R2 0.327 0.308 0.307 0.306 0.312 0.309 0.326 0.315 0.306
Panel B: Macroeconomic factors
Variable (1) (2) (3) (4) (5) (6) (7)
Trend�100 �0.089 �0.065 �0.132 �0.095 �0.117 �0.126 �0.080
(�3.79) (�2.95) (�6.85) (�5.00) (�6.09) (�6.49) (�4.15)
Term spread �1.005 �0.829 �1.214 �1.235 �1.117 �1.073 �0.805
(�8.52) (�7.98) (�13.93) (�14.41) (�13.11) (�12.86) (�9.88)
Short-term rate 0.110
(1.68)
Inflation 0.287
(4.84)
Real short-term rate �0.324
(�5.11)
Default spread �1.659
(�7.94)
Recession dummy �0.003
(�1.19)
Bank stock index return �0.108
(�7.03)
Government share �0.381
(�19.47)
Intercept 0.262 0.252 0.284 0.254 0.276 0.278 0.499
(28.87) (33.15) (47.88) (41.14) (47.40) (47.49) (39.95)
Number of observations 97,215 97,215 97,215 97,215 97,215 97,215 97,215
R2 0.305 0.305 0.305 0.306 0.305 0.305 0.312
C. Custodio et al. / Journal of Financial Economics ] (]]]]) ]]]–]]]18
In untabulated results, we find that the trend coefficient isstatistically insignificant even if we control for observedand unobserved firm heterogeneity. We also estimate asimilar regression for the sample of US firms over the1990–2008 period and using the ratio of long-term debtto total debt as a dependent variable. We find that thetrend coefficient is negative and significant, which isconsistent with results using Compustat data on the ratioof debt maturing in more than 3 years to total debt overthe 1976–2008 period.
Please cite this article as: Custodio, C., et al., Why are US fiEconomics (2012), http://dx.doi.org/10.1016/j.jfineco.2012.10
4.3. Predicted and unexpected debt maturity
The previous subsections show that changes in firmcharacteristics are not the only reason that make firmsuse more short-term debt. This subsection quantifies theeffect of changes in firm characteristics in predicted debtmaturity and the (unexpected) component of debt matur-ity that is not explained by changes in firm characteristics.We first estimate Fama and MacBeth regressions forthe 1976–1979 period. The coefficients are the average
rms using more short-term debt? Journal of Financial.009

C. Custodio et al. / Journal of Financial Economics ] (]]]]) ]]]–]]] 19
coefficients from the annual cross-sectional regressions,and they are reported in Column 5 of Table 5. We thencompute how actual debt maturity over the 1980–2008period differs from that predicted by the model. Becausethe debt maturity associated with firm characteristics isfixed at its base period values, variation in the predicteddebt maturity after 1980 is due to changing character-istics among the sample firms. The difference betweenpredicted and actual debt maturity measures the changein debt maturity that it is not related to changes in firmcharacteristics.14
Table 7 shows the results for all firms and for thesubsamples of small, medium-size, and large firms.In the panel for each subsample, the first column reportsthe actual (average) debt maturity for the whole sample;the second column, the predicted debt maturity. The thirdand fourth columns report the difference between actualand predicted debt maturity and the t-statistic of thedifference, respectively. When the average regressionfunction for 1976–1979 is applied to the sample of firmcharacteristics for 1980, the predicted percentage of debtmaturing in more than 3 years (debt maturity 3) is 53%;the actual percentage for 1980 is also 53%.
Over the 1980�2000 period, the predicted debt matur-
ity 3 dropped from 53% to 45% and then increased to 51%in 2008. The model consistently overpredicts debt matur-ity in the 1980–2008 period (2006 is the only exception).Over time, the difference between the actual andexpected debt maturity increased in the 1980s and1990s. The greatest differences between the actual andpredicted debt maturity ratio are during the early 1990s,when the model overpredicts debt maturity by nearly12%. After 2002, the difference between actual and pre-dicted debt maturity is smaller in magnitude. We con-clude that changes in firm characteristics explain part ofthe decrease in debt maturity as predicted debt maturitydecreases over time, but the actual debt maturitydecreases significantly more than predicted by the model.
The remaining panels in Table 7 examine the differ-ences between actual and predicted debt maturity for thesubsamples of small, medium-size, and large firms.As expected, the model performs particularly poorly forthe subsample of small firms. The difference between theactual and the predicted debt maturity 3 increases to morethan 14% in the early 1990s, and the model systematicallyoverpredicts debt maturity in the 1980–2008 period. In2008, the actual debt maturity 3 is 31% and the predictedone is 43%. Thus, we again conclude that changes in firmcharacteristics do not fully explain the observed decreasein the debt maturity of small firms.
Finally, we can observe that the model performs muchbetter for the subsamples of medium-size and large firms.Over the whole sample period, the effect of changes infirm characteristics is small, as predicted debt maturityfor large firms was 65% in 1980 and 64% in 2008. Thedifferences between actual and predicted debt maturity
14 In untabulated results, we obtain similar findings if we add to the
model control variables included in Table 6. We also obtain similar
findings if we estimate the Fama and MacBeth regression in the 1976–
1984 or 1976–1989 periods.
Please cite this article as: Custodio, C., et al., Why are US fiEconomics (2012), http://dx.doi.org/10.1016/j.jfineco.2012.10
for large firms are only negative and statistically signifi-cant in 1981–1982, 1984, and 1988–1995, and the mag-nitude of the differences is much smaller than for thesubsample of small firms. In the most recent period, themodel even underpredicts debt maturity for medium-sizeand large firms.
Overall, the results in Section 4 are consistent with thechanges in firm-specific demand-side factors explainingpart of the decrease in debt maturity as the magnitudeof the trend coefficient drops to one-third after control-ling for firm characteristics. This finding is robust acrossseveral different specifications such as recognizingthat maturity is determined endogenously with leverage.However, a statistically and economically significantnegative trend in debt maturity still is not explained byobservable or unobservable (time-invariant) demand-sidefactors. In fact, firm characteristics or changes in thesensitivities of debt maturity to firm characteristics donot fully explain the decrease in debt maturity. Macro-economic factors also have a limited ability in explainingthe trend in debt maturity.
5. New listings effects
We find that new firms entering the sample of publiclytraded firms in the 1980s and 1990s play a key role inexplaining the decrease in corporate use of long-termdebt. The median debt maturity is increasingly shorterfor the groups of most recently listed companies. Inaddition, no statistically significant negative time trendexists within groups.
To show the importance of the listing year in explain-ing the time trend in debt maturity, we define four groupsof firms based on listing years and estimate debt maturityregressions at the firm level with dummy variables foreach group. The first group contains firms listed before1980, the second group contains firms listed between1980 and 1989, the third group contains firms listedbetween 1990 and 1999, and the final group containsfirms listed after 1999. The results of this analysis arereported in Table 8.15
The coefficient of the time trend in a regression with-out additional controls is �0.376 (see Column 6 ofTable 4). Column 1 of Table 8 shows that the time trendcoefficient turns positive (and significant) when the list-ing group dummy variables are included. As expected, thegroup dummy variables coefficients decrease over timeand are statistically significant. The pre-1980 groupdummy coefficient is 0.510, and the 1980–1989 groupdummy variable coefficient is 0.341. The differencebetween these two coefficients is statistically significant.The 1990–1999 group dummy coefficient is even lower, at0.319. The 2000–2008 listing group dummy coefficient isslightly higher, at 0.346.
Firm characteristics are important in explaining thecross-sectional variation in debt maturity, but they arenot able to fully explain the time evolution in debt
15 In untabulated results, we obtain similar findings using groups
of listings over a period of 5 years.
rms using more short-term debt? Journal of Financial.009

Table 7Predicted debt maturity and deviations from actual debt maturity by year.
This table reports the differences between the actual and predicted average debt maturity, defined as the percentage of debt maturing in more than 3 years, by year. The predicted values are obtained using the
coefficients of the explanatory variables for the sample period prior to 1980. Estimates of this regression are as follows: Debt maturity 3¼0.411þ0.695 Size – 0.510 Size2 –0.026 Market-to-bookþ0.044 Abnormal
earningsþ0.004 Asset maturity – 0.141 Asset volatilityþ0.168 Leverage – 0.125 R&D. t-Statistics on the differences between actual and predicted debt maturity are also presented. The sample consists of
observations on Compustat firms from 1976 to 2008. Financial industries (SIC codes 6000–6999) and utilities (SIC codes 4900–4999) are omitted.
All firms Small firms Medium firms Large firms
Year Actual Predicted Actual—predicted t-
Statistic
Actual Predicted Actual—predicted t-
Statistic
Actual Predicted Actual—predicted t-
Statistic
Actual Predicted Actual—predicted t-
Statistic
1980 0.530 0.529 0.001 0.28 0.455 0.453 0.002 0.26 0.596 0.586 0.010 1.01 0.642 0.650 �0.008 �0.89
1981 0.510 0.530 �0.020 �4.14 0.429 0.457 �0.028 �3.98 0.602 0.593 0.009 0.95 0.631 0.658 �0.027 �3.14
1982 0.503 0.518 �0.015 �3.13 0.425 0.448 �0.023 �3.27 0.591 0.582 0.009 0.87 0.633 0.651 �0.018 �2.04
1983 0.487 0.500 �0.013 �2.69 0.408 0.430 �0.022 �3.33 0.573 0.571 0.002 0.22 0.645 0.645 0.000 0.03
1984 0.459 0.510 �0.051 �10.92 0.376 0.443 �0.067 �10.74 0.562 0.588 �0.026 �2.56 0.627 0.651 �0.024 �2.61
1985 0.455 0.500 �0.045 �9.10 0.369 0.431 �0.063 �9.61 0.559 0.580 �0.022 �1.96 0.641 0.650 �0.009 �0.88
1986 0.443 0.497 �0.054 �10.84 0.347 0.430 �0.082 �12.46 0.558 0.576 �0.018 �1.66 0.643 0.642 0.001 0.15
1987 0.440 0.491 �0.051 �10.15 0.347 0.427 �0.080 �12.28 0.570 0.571 �0.001 �0.06 0.639 0.637 0.002 0.21
1988 0.420 0.499 �0.078 �15.28 0.335 0.434 �0.099 �15.20 0.543 0.587 �0.044 �3.67 0.619 0.655 �0.036 �3.24
1989 0.405 0.498 �0.093 �17.57 0.314 0.432 �0.117 �17.78 0.547 0.591 �0.045 �3.45 0.605 0.653 �0.048 �4.22
1990 0.384 0.500 �0.116 �22.21 0.295 0.437 �0.142 �21.79 0.519 0.581 �0.062 �5.01 0.571 0.649 �0.078 �6.57
1991 0.381 0.490 �0.109 �20.78 0.285 0.427 �0.141 �21.04 0.483 0.548 �0.064 �5.58 0.588 0.638 �0.050 �4.33
1992 0.372 0.491 �0.119 �23.26 0.278 0.422 �0.144 �21.81 0.451 0.556 �0.104 �9.43 0.591 0.644 �0.053 �4.65
1993 0.380 0.488 �0.107 �21.62 0.272 0.416 �0.144 �23.13 0.491 0.555 �0.064 �5.57 0.603 0.641 �0.038 �3.52
1994 0.383 0.493 �0.111 �22.53 0.277 0.422 �0.144 �23.71 0.516 0.574 �0.058 �4.96 0.596 0.648 �0.052 �4.74
1995 0.384 0.481 �0.097 �19.53 0.287 0.415 �0.128 �21.00 0.494 0.548 �0.054 �4.49 0.598 0.633 �0.035 �3.17
1996 0.394 0.469 �0.075 �15.49 0.301 0.405 �0.104 �17.20 0.507 0.543 �0.035 �2.98 0.610 0.625 �0.015 �1.39
1997 0.409 0.461 �0.051 �10.10 0.315 0.397 �0.082 �13.39 0.562 0.551 0.011 0.86 0.627 0.619 0.008 0.74
1998 0.409 0.464 �0.055 �10.56 0.321 0.406 �0.085 �13.20 0.558 0.552 0.006 0.45 0.600 0.600 �0.001 �0.05
1999 0.381 0.454 �0.073 �13.60 0.304 0.408 �0.104 �15.18 0.470 0.517 �0.046 �3.67 0.520 0.530 �0.010 �0.86
2000 0.346 0.451 �0.105 �19.38 0.258 0.396 �0.138 �20.88 0.414 0.514 �0.100 �7.70 0.555 0.562 �0.007 �0.56
2001 0.363 0.450 �0.088 �15.06 0.248 0.380 �0.132 �18.55 0.480 0.533 �0.053 �3.75 0.627 0.603 0.024 1.84
2002 0.381 0.493 �0.111 �18.19 0.259 0.423 �0.165 �21.74 0.523 0.574 �0.051 �3.35 0.635 0.635 0.000 �0.01
2003 0.423 0.487 �0.063 �9.95 0.305 0.402 �0.097 �11.60 0.551 0.569 �0.018 �1.17 0.613 0.631 �0.019 �1.51
2004 0.459 0.491 �0.032 �4.87 0.338 0.408 �0.071 �8.10 0.625 0.575 0.050 3.19 0.630 0.630 �0.001 �0.06
2005 0.481 0.494 �0.013 �1.93 0.357 0.410 �0.053 �5.58 0.631 0.567 0.064 4.06 0.646 0.632 0.014 1.14
2006 0.506 0.495 0.010 1.51 0.380 0.408 �0.029 �2.98 0.671 0.580 0.090 5.70 0.672 0.635 0.037 3.15
2007 0.499 0.503 �0.004 �0.55 0.371 0.419 �0.048 �4.82 0.651 0.583 0.068 4.38 0.671 0.633 0.039 3.16
2008 0.456 0.513 �0.058 �7.99 0.307 0.425 �0.118 �11.52 0.577 0.577 0.000 �0.01 0.650 0.637 0.014 1.11
Ple
ase
citeth
isa
rticlea
s:C
usto
dio
,C
.,e
ta
l.,W
hy
are
US
firm
su
sing
mo
resh
ort-te
rmd
eb
t?Jo
urn
al
of
Fina
ncia
lE
con
om
ics(2
01
2),
http
://dx
.do
i.org
/10
.10
16
/j.jfin
eco
.20
12
.10
.00
9
C.
Cu
stod
ioet
al.
/Jo
urn
al
of
Fina
ncia
lE
con
om
ics]
(]]]])]]]–
]]]2
0

Table 8Panel regression of debt maturity with listing groups.
This table reports the estimates of OLS regressions of debt maturity, defined as the percentage of debt maturing in more than 3 years. The explanatory
variables include listing group dummy variables defined by decades. The sample consists of observations of Compustat firms from 1976 to 2008.
Financial industries (SIC codes 6000–6999) and utilities (SIC codes 4900–4999) are omitted. Refer to Table A.1 in Appendix A for variable definitions.
Robust t-statistics adjusted for firm-level clustering are in parentheses.
Variable (1) (2) (3) (4) (5) (6) (7)
Trend�100 0.139 �0.032 �0.439 �0.131 �0.042 �0.109 �0.050
(4.83) (�1.33) (�18.31) (�6.64) (�1.33) (�4.79) (�1.78)
Pre-1980 listing dummy 0.510 0.278 0.277 0.251
(112.58) (47.05) (43.41) (30.81)
1980–1989 listing dummy 0.341 0.241 0.241 0.227
(52.01) (34.10) (33.35) (27.32)
1990–1999 listing dummy 0.319 0.233 0.234 0.217
(37.82) (28.64) (26.23) (23.46)
2000–2008 listing dummy 0.346 0.284 0.287 0.261
(23.49) (23.80) (21.73) (19.05)
Size 1.093 1.111 1.093 1.030 1.018
(49.93) (51.26) (49.66) (40.99) (40.15)
Size2�0.849 �0.875 �0.852 �0.785 �0.780
(�31.66) (�31.85) (�30.50) (�26.36) (�26.11)
Market-to-book �0.017 �0.017 �0.017 �0.019 �0.018
(�21.78) (�22.11) (�21.74) (�16.60) (�16.14)
Abnormal earnings 0.022 0.023 0.022 0.023 0.023
(11.30) (11.44) (11.31) (9.25) (9.14)
Asset maturity 0.002 0.002 0.002 0.003 0.003
(12.57) (12.80) (12.53) (11.86) (11.46)
Asset volatility �0.144 �0.151 �0.144 �0.136 �0.128
(�23.40) (�24.42) (�23.29) (�17.31) (�16.40)
Leverage 0.405 0.402 0.405 0.470 0.474
(44.54) (44.14) (44.47) (42.00) (42.26)
R&D �0.179 �0.176 �0.179 �0.179 �0.187
(�11.70) (�11.57) (�11.71) (�9.86) (�10.20)
Term spread �1.065 �1.141 �1.067 �1.020 �1.003
(�12.75) (�13.60) (�12.76) (�10.47) (�10.34)
Age�100 0.527 0.078 0.011
(31.37) (4.81) (0.48)
Founding age�100 0.039 0.026
(5.02) (2.93)
Intercept 0.439 0.266 0.242
(99.03) (44.65) (32.13)
Number of observations 97,215 97,215 97,215 97,215 97,215 71,679 71,679
R2 0.642 0.736 0.062 0.306 0.736 0.317 0.751
C. Custodio et al. / Journal of Financial Economics ] (]]]]) ]]]–]]] 21
maturity. As shown in Column 7 of Table 4, the time trendcoefficient in an OLS regression of debt maturity on firmcharacteristics is negative and significant (�0.115 with at-statistic of �5.98). Column 2 of Table 8 shows resultsincluding both listing group dummy variables and firmcharacteristics. The time trend coefficient is negative butstatistically insignificant. The results also show that thegroup dummy variables are significant and decrease overtime (with the exception of the 2000–2008 group dummyvariable) after controlling for firm characteristics. Theseresults show that the new listing effect is necessary andsufficient to explain the negative trend in debt maturity,whereas firm characteristics are insufficient to explain it.
One could argue that the new listing effect justcaptures the fact that younger firms use more short-term debt than older firms and that as firms grow oldertheir use of long-term debt will increase. Our finding thatno consistent increase exists in debt maturity withinlisting groups does not support this hypothesis. Thissuggests that the trend in debt maturity is not solely theresult of a decline in the average age of firms going public.
Please cite this article as: Custodio, C., et al., Why are US fiEconomics (2012), http://dx.doi.org/10.1016/j.jfineco.2012.10
To more directly examine the role of firm age, we includeit as an additional explanatory variable in a regressionwith and without other firm characteristics. Columns 3and 4 report the results using the age of the firm,measured as the number of years since the CRSP listingyear, as an explanatory variable. A positive relation existsbetween debt maturity and firm age as shown by thepositive and significant coefficient. However, accountingfor firm age does not have any effect on the magnitude ofthe time trend in debt maturity. The time trend coefficientis negative and significant at �0.439 (t-statistic is�18.31) without further controls and �0.131 (t-statisticis ––6.64) with additional firm-level controls. Column 5shows that, when we include firm characteristics and thelisting group dummy variables as explanatory variables,the coefficient of age becomes insignificant. The timetrend coefficient is also insignificant in Column 5.
To test whether listing groups variables are justcapturing the fact that firms are going public earlier intheir life cycle, we replicate the models in Columns 4 and5 using firm age since foundation, as described in
rms using more short-term debt? Journal of Financial.009

C. Custodio et al. / Journal of Financial Economics ] (]]]]) ]]]–]]]22
Jovanovic and Rousseau (2001) and Loughran and Ritter(2004).16 In Column 6 we run a regression in which wecontrol for the founding age of the firm and additionalfirm characteristics. We still find a negative and signifi-cant trend in debt maturity. In Column 7 we add thelisting group variables to the model in Column 6. Thecoefficient of the trend variable drops to half and it isstatistically insignificant. The coefficient of the foundingage is positive and significant, which suggests that firmsincrease debt maturity as they grow older when we takeinto account the founding age, instead of the listing age.The magnitude of this effect is small as the increase indebt maturity over the life of a firm since foundation isless than 0.03% per year.
The interpretation of these results is that the variationin firm age not correlated with listing vintage is notimportant in explaining the trend in debt maturity.Although firms are listing earlier in their life cycle, thisis not sufficient to explain the time trend in debtmaturity. The listing vintage is the crucial effect. A youngfirm that was listed in the 1980s and 1990s uses on averagemore short-term debt than a young firm (of comparablesize, growth opportunities, and other characteristics) thatwas listed in the 1970s. Our findings suggest that thedecrease in use of long-term debt seems to be concentratedin the part of the economy that has been able to accesspublic equity and debt markets because of greater financialmarket development in the 1980s and 1990s (Rajan andZingales, 2003; Fama and French, 2004).17
Overall, the new listing groups capture the effect of thetime trend in the debt maturity regressions. We argue thatfirms with riskier fundamentals have listed over time,leading to a decrease in observed debt maturity as well asto trends in observable firm-specific factors. In unreportedanalysis, we show that time trends in firm characteristics(firm size, market-to-book, asset volatility, R&D, return onassets, tangibility, cash and dividends) can be largelyexplained by the firm listing year. A trend toward smaller,higher-growth, less-profitable, and lower-tangibility firmsis likely the result of the new listing effect. However,changes in observable firm characteristics are insufficientto explain the decrease in debt maturity, whereas the newlisting effect is both necessary and sufficient. Whetherlisting groups are just capturing unobserved firm-specificdemand-side factors or supply-side factors is still an openquestion.
6. New debt issues and supply-side effects
In this section, we examine the evolution of thematurity of new debt issues and address the possibility
16 The age data are obtained from Boyan Jovanovic’s and Jay Ritter’s
websites: http://www.nyu.edu/econ/user/jovanovi/whywait.xls and
http://bear.warrington.ufl.edu/ritter/. The age variable is defined as the
difference between the calendar year of the observation and the earliest
available date of incorporation or foundation.17 Consistent with the new listing effect explaining the decrease in
debt maturity, we find an insignificant trend coefficient when we
estimate the debt maturity regressions using a balanced panel of firms
(untabulated).
Please cite this article as: Custodio, C., et al., Why are US fiEconomics (2012), http://dx.doi.org/10.1016/j.jfineco.2012.10
that the evolution of debt maturity is explained by supply-side effects.
6.1. Evidence from new debt issues
In this subsection, we examine the evolution of thematurity of new debt issues—an incremental approach.Guedes and Opler (1996) argue that some issues regard-ing the choice of debt maturity could be better answeredusing an incremental approach rather than a balancesheet approach. The time series of debt maturity usingbalance sheet data is an aggregation of historical debtissuances.18 Furthermore, to isolate movements in thesupply of debt, we examine debt maturity at the firm levelconditional on firms’ raising new debt financing (Beckerand Ivashina, 2011). By revealed preferences, if a firm getsnew debt financing, then the firm must have a positivedemand for debt. Thus, by studying new debt issues, weare able to rule out that demand-side factors explain theevolution of debt maturity.19 For these reasons, we studythe maturity of new bond issues and syndicated loans.
We obtain bond issues from the Mergent Fixed IncomeSecurities Database (FISD). Our sample consists of bondissues by (nonutility) industrial firms with Compustatidentifiers.20 The sample contains 12,821 issues from1,986 unique firms over the 1976–2008 period. Panel Aof Table 9 shows the evolution of the initial maturity ofbond issues from 1976 to 2008. The average initial bondmaturity is 14.9 years and the median is 13.1 years. Overtime, there was a striking decrease in the maturity of newbond issues. The median maturity dropped from 25 yearsin 1976 to 7.5 years in 2008, with a low of 7.0 years in2000. The time trend coefficients of the average andmedian maturity are negative and strongly significant.The median maturity time trend coefficient correspondsto a yearly decrease of about 0.5 years. Thus, strongevidence exists of an economically important decreasein the maturity of new public debt issues.
The next columns of Panel A of Table 9 show themedian bond maturity for groups of firms based on sizeand listing year as defined in Table 3. We find that largefirms issue longer maturity bonds than small firms. Overtime, there is a decrease in bond maturity in all sizegroups. There is a negative and significant trend in thematurity of issues of all size groups, including large firms.Furthermore, a significant decrease is evident in bondmaturity in the pre-1980 and 1980–1989 listing groups.
These findings differ from the ones using balancesheet data in which we observe a significant decline inthe debt maturity of small firms, but no decline in thedebt maturity of large firms and any of the listing groups.
18 Guedes and Opler (1996) argue that the new debt issue data
provide stronger tests in situations in which the determinants of debt
maturity fluctuate substantially over time (e.g., macroeconomic factors),
while the balance sheet data provide stronger tests in situations in
which the determinants move slowly (e.g., asset maturity, information
asymmetry, growth opportunities).19 In contrast, if we study a firm that does not receive new financing,
we could not be sure if this is because the firm does not need new
financing or because it is not able to raise new financing.20 We link Mergent FISD to Compustat by issuer CUSIP and name.
rms using more short-term debt? Journal of Financial.009

Table 9Initial maturity of new bond issues and syndicated loans by year.
This table reports the average and median initial maturity (in years) of new bond issues and syndicated loans by year. The table also contains a breakdown of new issues and loans by size and listing group. In
Panel A, the sample consists of Mergent Fixed Income Securities Database (FISD) bond issues by firms with Compustat identifiers from 1976 to 2008. In Panel B, the sample consists of Loan Pricing Corporation’s
Dealscan loan facilities by firms with Compustat identifiers from 1987 to 2008. Financial industries (SIC codes 6000–6999) and utilities (SIC codes 4900–4999) are omitted. Refer to Table A.1 in Appendix A for
variable definitions.
Panel A: Bond issues
Year Number of issues Average maturity Median maturity Median maturity Percent of issues
Small Medium Large Pre-1980 1980–1989 1990–1999 2000–2008 Small Medium Large
1976 36 25.6 25.0 25.0 25.0 25.0 0.0 2.8 97.2
1977 29 24.1 25.0 15.0 20.0 25.0 25.0 6.9 13.8 79.3
1978 28 24.3 22.5 15.0 20.0 30.0 22.5 10.7 21.4 67.9
1979 32 24.0 25.0 20.0 20.0 25.0 25.0 6.3 25.0 68.8
1980 76 19.6 20.0 17.5 20.0 20.0 20.0 20.0 2.6 9.2 88.2
1981 57 20.1 20.0 20.0 18.0 20.0 20.0 15.0 7.0 14.0 78.9
1982 78 18.1 19.5 20.0 20.0 18.0 20.0 15.0 3.8 10.3 85.9
1983 78 18.3 20.0 13.5 20.0 20.0 20.0 20.0 15.4 16.7 67.9
1984 87 16.7 15.0 12.0 16.5 15.0 15.0 10.0 4.6 16.1 79.3
1985 202 16.3 12.0 12.0 15.0 12.0 12.0 20.0 8.9 16.3 74.8
1986 321 16.6 13.0 11.0 20.0 10.0 12.0 15.0 9.3 16.8 73.8
1987 365 14.6 12.0 10.0 20.0 11.0 12.0 24.0 6.6 11.0 82.5
1988 172 13.7 10.0 10.0 12.0 10.0 10.0 10.0 6.4 15.1 78.5
1989 252 14.6 12.0 10.0 12.0 12.5 12.0 16.0 3.2 9.5 87.3
1990 357 15.1 14.0 7.5 25.0 14.0 14.0 15.0 1.7 2.2 96.1
1991 426 14.6 11.0 8.5 10.0 11.0 12.0 10.0 1.4 3.5 95.1
1992 548 13.8 10.0 10.0 10.0 10.0 10.0 10.0 10.0 2.4 10.0 87.6
1993 651 13.0 10.0 10.0 10.0 10.0 10.0 10.0 10.0 5.8 10.8 83.4
1994 441 9.5 8.0 9.5 9.0 8.0 8.0 10.0 10.0 2.7 10.2 87.1
1995 626 10.5 9.0 9.5 10.0 9.0 8.0 10.0 10.0 3.8 11.2 85.0
1996 541 13.4 10.0 10.0 10.0 10.0 10.0 10.0 10.0 13.5 19.0 67.5
1997 724 14.5 10.0 9.0 10.0 10.0 10.0 10.0 10.0 18.0 24.3 57.7
1998 920 11.6 10.0 10.0 10.0 10.0 10.0 10.0 10.0 16.3 14.8 68.9
1999 616 10.5 10.0 10.0 10.0 10.0 10.0 10.0 10.0 8.4 13.6 77.9
2000 451 9.0 7.0 7.0 8.0 7.0 6.0 7.0 7.0 9.5 5.1 12.0 82.9
2001 659 10.1 8.0 8.0 7.0 8.0 7.0 10.0 8.0 8.0 7.1 20.3 72.5
2002 677 9.5 8.0 7.0 8.5 8.0 7.0 7.0 9.0 9.0 10.0 16.5 73.4
2003 810 11.6 10.0 8.0 10.0 10.0 10.0 10.0 10.0 8.5 11.2 23.2 65.6
2004 669 12.2 10.0 10.0 10.0 10.0 10.0 10.0 10.0 10.0 21.1 24.8 54.1
2005 466 11.7 10.0 8.0 9.0 10.0 10.0 10.0 9.0 10.0 19.7 22.7 57.5
2006 447 11.8 10.0 7.0 10.0 10.0 10.0 10.0 8.0 10.0 13.2 18.1 68.7
2007 593 11.9 9.0 7.0 8.0 10.0 10.0 9.0 8.0 7.0 17.0 16.2 66.8
2008 386 10.9 7.5 7.0 7.0 8.5 7.0 9.0 10.0 7.0 6.5 12.2 81.3
1976–1979 24.5 24.4 16.7 21.3 26.3 24.4 6.0 15.7 78.3
1980–1984 18.6 18.9 16.6 18.9 18.6 19.0 16.0 6.7 13.3 80.1
1985–1989 15.1 11.8 10.6 15.8 11.1 11.6 17.0 6.9 13.8 79.4
1990–1994 13.2 10.6 9.1 12.8 10.6 10.8 11.0 10.0 2.8 7.4 89.8
1995–1999 12.1 9.8 9.7 10.0 9.8 9.6 10.0 10.0 12.0 16.6 71.4
Ple
ase
citeth
isa
rticlea
s:C
usto
dio
,C
.,e
ta
l.,W
hy
are
US
firm
su
sing
mo
resh
ort-te
rmd
eb
t?Jo
urn
al
of
Fina
ncia
lE
con
om
ics(2
01
2),
http
://dx
.do
i.org
/10
.10
16
/j.jfin
eco
.20
12
.10
.00
9
C.
Cu
stod
ioet
al.
/Jo
urn
al
of
Fina
ncia
lE
con
om
ics]
(]]]])]]]–
]]]2
3

Table 9 (continued )
Panel A: Bond issues
Year Number of issues Average maturity Median maturity Median maturity Percent of issues
Small Medium Large Pre-1980 1980–1989 1990–1999 2000–2008 Small Medium Large
2000–2004 10.5 8.6 8.0 8.7 8.6 8.0 8.8 8.8 9.0 10.9 19.4 69.7
2005–2008 11.6 9.1 7.3 8.5 9.6 9.3 9.5 8.8 8.5 14.1 17.3 68.6
1976–2008 14.9 13.1 10.9 13.6 13.2 13.0 12.1 9.4 8.8 8.4 14.7 76.9
Trend �0.419 �0.492 �0.381 �0.485 �0.482 �0.499 �0.356 �0.086 �0.158
p-Value 0.000 0.000 0.000 0.000 0.000 0.000 0.000 0.081 0.351
Panel B: Syndicated loans
Year Number of loans Average maturity Median maturity Median maturity Percent of loans
Small Medium Large pre-1980 1980–1989 1990–1999 2000–2008 Small Medium Large
1987 1,663 4.2 4.0 2.8 4.0 4.0 4.0 3.1 27.2 32.1 40.7
1988 3,968 4.0 4.0 3.0 4.2 4.4 4.0 3.5 38.1 29.2 32.7
1989 3,167 4.5 4.6 3.0 4.6 5.0 5.0 3.1 45.0 27.7 27.3
1990 3,304 4.2 3.8 3.0 3.8 5.0 4.6 3.0 5.0 42.7 32.2 25.1
1991 2,833 3.5 3.0 2.9 3.0 3.4 3.0 3.0 3.1 43.1 34.8 22.1
1992 4,265 3.8 3.0 3.0 3.2 3.5 3.1 3.0 3.6 42.1 31.7 26.2
1993 5,039 3.6 3.0 3.0 3.1 3.0 3.0 3.0 3.0 36.0 34.0 30.0
1994 6,474 3.9 3.5 3.0 3.8 4.9 3.9 3.1 3.9 37.2 28.5 34.3
1995 5,474 4.0 4.1 3.0 4.0 5.0 4.0 4.0 4.8 37.7 28.2 34.1
1996 7,409 4.0 4.0 3.0 5.0 5.0 4.3 3.1 4.0 47.9 27.0 25.1
1997 8,558 4.2 4.9 3.0 5.0 5.0 5.0 4.7 4.8 46.2 27.2 26.6
1998 7,275 4.2 4.8 3.1 5.0 5.0 4.9 4.9 4.4 54.0 21.6 24.4
1999 6,263 3.9 3.9 3.0 5.0 3.0 3.0 4.0 4.0 44.0 27.9 28.1
2000 5,513 3.4 3.0 3.0 4.0 3.0 2.7 3.0 3.0 5.0 38.8 25.6 35.6
2001 5,907 3.0 3.0 3.0 3.0 2.3 2.9 3.0 3.0 3.0 36.6 25.2 38.3
2002 6,001 3.0 3.0 3.0 3.5 3.0 3.0 3.0 3.0 3.0 43.3 21.8 34.9
2003 5,489 3.2 3.0 3.0 3.1 3.0 3.0 3.0 3.0 3.0 35.9 24.9 39.2
2004 6,166 4.0 5.0 3.5 5.0 5.0 5.0 5.0 4.9 4.9 37.0 24.1 38.9
2005 6,168 4.5 5.0 5.0 5.0 5.0 5.0 5.0 5.0 5.0 32.7 26.3 41.0
2006 5,010 4.5 5.0 5.0 5.0 5.0 5.0 5.0 5.0 5.0 33.7 28.4 37.9
2007 4,600 4.6 5.0 5.0 5.0 5.0 5.0 5.0 5.0 5.0 35.8 24.6 39.5
2008 2,548 3.8 4.2 4.4 4.0 4.2 3.0 4.9 4.7 4.0 41.0 25.9 33.1
1987–1989 4.2 4.2 2.9 4.3 4.5 4.3 3.2 36.8 29.7 33.6
1990–1994 3.8 3.3 3.0 3.4 4.0 3.5 3.0 3.7 40.2 32.2 27.6
1995–1999 4.1 4.3 3.0 4.8 4.6 4.3 4.1 4.4 46.0 26.4 27.7
2000–2004 3.3 3.4 3.1 3.7 3.3 3.3 3.4 3.4 3.8 38.3 24.3 37.4
2005–2008 4.3 4.8 4.9 4.8 4.8 4.5 5.0 4.9 4.8 35.8 26.3 37.9
1987–2008 3.9 3.9 3.4 4.1 4.2 3.9 3.7 4.1 4.2 39.8 27.7 32.5
Trend �0.004 0.036 0.081 0.036 �0.002 0.006 0.086 0.042 0.133
p-Value 0.792 0.175 0.000 0.176 0.955 0.837 0.002 0.239 0.314
Ple
ase
citeth
isa
rticlea
s:C
usto
dio
,C
.,e
ta
l.,W
hy
are
US
firm
su
sing
mo
resh
ort-te
rmd
eb
t?Jo
urn
al
of
Fina
ncia
lE
con
om
ics(2
01
2),
http
://dx
.do
i.org
/10
.10
16
/j.jfin
eco
.20
12
.10
.00
9
C.
Cu
stod
ioet
al.
/Jo
urn
al
of
Fina
ncia
lE
con
om
ics]
(]]]])]]]–
]]]2
4

C. Custodio et al. / Journal of Financial Economics ] (]]]]) ]]]–]]] 25
This can be explained by the fact that large and old firmsissue longer maturity bonds than small and new firms.These long-term bonds remain on the balance sheet oflarge and old firms for a long period. Thus, we do notobserve a significant decrease in the ratio of debt matur-ing in more than 3 years to total debt (debt maturity 3) forlarge and old firms using balance sheet data. In addition,small firms are overrepresented in the sample of newbond issues because they issue shorter maturity debtand, therefore, they need to issue bonds more frequentlythan large firms.
Using balance sheet data, we have shown that thedecrease in debt maturity is explained by smaller firms or,more generally, by firms with higher information asym-metry. Using the sample of new bond issues, we examinethe composition of the sample of bond issuers by size.We expect to find that the importance of small firms hasincreased in public debt markets. Panel A of Table 9 showsan increase in the relative importance of small firms inbond issues. Small firms represent 14% of the issues in2005–2008, but only 6% of the issues in 1976–1979. Weconclude that a change in the composition of public debtissues helps to explain the decrease in debt maturity,which is consistent with our previous findings.21
Our data on private debt are from the Loan PricingCorporation’s Dealscan database, which contains issuance-level information on syndicated bank loans. Each loan canhave multiple facilities, each with different characteristics.Our sample consists of loan facilities by (nonutility)industrial firms with Compustat identifiers.22 Panel B ofTable 9 shows the evolution of the initial maturity ofsyndicated loans from 1987 to 2008. The sample contains113,094 loan facilities from 5,114 unique firms. Theaverage and median initial maturity of syndicated loansis 3.9 years, which is much lower than the initial maturityof bond issues. Over time, some cyclical variation emergesin the maturity of new loans, but no evidence exists of atime trend. The time trend coefficients are statisticallyinsignificant. Also, no evidence exists of a decrease in loanmaturity in any of the size and listing year groups. There iseven some evidence of a positive and significant trend inthe maturity of loans among small firms. Using the sampleof syndicated loans, we also examine the composition ofthe sample of borrowers by size. Some evidence showsthat the relative importance of small firms increased inthe 1990s.
The syndicated loan market is just a fraction of theprivate debt market because it does not include smallnonsyndicated loans. We examine total nonfarm nonfi-nancial corporate debt using the Flow of Funds Accountsdata reported by the Federal Reserve to have a complete
21 In unreported results, we obtain similar findings for new and old
listings. In particular, the weight of new firms in the total number of
issues increases from 2% in 1976–1979 to nearly 25% in 1995–1999.
There is a decrease in the relative importance of new firms in the 2000s
(but to figures higher than those from the beginning of the sample) that
could explain the increase in corporate use of longer-term debt
after 2002.22 We thank Michael Roberts for providing us with the match
between Dealscan and Compustat, used in Chava and Roberts (2008).
Please cite this article as: Custodio, C., et al., Why are US fiEconomics (2012), http://dx.doi.org/10.1016/j.jfineco.2012.10
picture of the volume of private debt versus public debt.We construct the yearly time series of private (bank) debtand public debt. For bank debt, we combine the Flow ofFunds components Other Loans and Advances and BanksLoans Not Elsewhere Classified. For public debt, we addup the Flow of Funds components Commercial PaperIssued by Nonfinancial Firms and Corporate Bonds. Fig. 6shows the fraction of public debt in total debt financingfrom 1976 to 2008. The fraction of public debt grew from50% in the 1980s to more than 65% in the 2000s. Thisincrease was mainly due to corporate bonds, with thefraction of corporate bonds increasing from 50% in 1980to about 65% in the 2000s. The increase in the share ofpublic debt together with the decrease in the maturity ofpublic debt supports the view that the decrease in debtmaturity has taken place mainly in public debt markets,not in private debt markets. Moreover, it is not the casethat an increase in the use of bank loans (which havemuch lower maturity than bonds) explains the decreasein debt maturity.23
Overall, the time series of the maturity of new debtissues shows that public debt markets seem to be themain contributors to the decline in debt maturity. Noevidence exists of a decline in the maturity of bank loans.These findings differ from the ones using balance sheetdata in which we observe a much stronger decline in thedebt maturity of unrated firms (i.e., firms without accessto public debt markets) than of rated firms (i.e., firms withaccess to public debt markets). This is because public debthas much longer maturity than private debt and, there-fore, remains on the balance sheet of rated firms for amuch longer period when compared with unrated firms.
We next estimate the regressions in Table 4 using thelogarithm of the initial maturity of new bond issues andsyndicated loans as dependent variables. Table 10 pre-sents the results. We include the same set of explanatoryvariables used in Table 4. In addition, we include issuetype dummies, as well as loan purpose and type dummiesas controls.
Column 1 in Panel A presents the estimates of an OLSregression of bond initial maturity on a time trend. Thetime trend is negative and significant and indicates that,on average, maturity decreases by 2.5% per year. Column2 includes firm characteristics as explanatory variables.We find that the coefficients on the determinants of bondmaturity are generally consistent with those obtained inTable 4. The coefficient of firm size is positive, and thecoefficient of firm size squared is negative, consistentwith a nonlinear relation between debt maturity andcredit quality. The coefficients of asset volatility andR&D are negative, consistent with the notion that firmswith more growth opportunities and higher informationasymmetry use more short-term debt. The coefficients onasset maturity and abnormal earnings are insignificant.There are also some differences. For example, the leveragecoefficient is negative in the sample of bond issues but
23 Becker and Ivashina (2011) find that bank debt is more volatile
and cyclical than public debt. This evidence is consistent with the idea
that the public debt market is the responsible for long-term trends in
debt markets.
rms using more short-term debt? Journal of Financial.009

40%
45%
50%
55%
60%
65%
70%
75%
1976 1978 1980 1982 1984 1986 1988 1990 1992 1994 1996 1998 2000 2002 2004 2006 2008
(Corporate bonds + Commercial paper) / Total debt financing Corporate bonds / Total debt financing
Fig. 6. Share of public debt in total corporate debt financing. This figure plots the volume of public debt as a fraction of total debt financing by nonfarm
nonfinancial corporate debt compiled from annual Flow of Funds Accounts (Federal Reserve) data from 1976 to 2008. Total debt financing is the sum of
bank debt and public debt. Bank debt is the sum of the Flow of Funds components Other Loans and Advances and Banks Loans Not Elsewhere Classified.
Public debt is the sum of the Flow of Funds components Commercial Paper Issued by Nonfinancial Firms and Corporate Bonds.
C. Custodio et al. / Journal of Financial Economics ] (]]]]) ]]]–]]]26
positive in Table 4. The term spread is insignificant in thesample of bond issues but negative and significant inTable 4.24 More important, the time trend coefficient isnegative and significant in the sample of bond issueswhen we control for firm characteristics.
Column 3 controls for unobserved firm heterogeneityusing firm fixed effects. We also find that the time trendcoefficient is unchanged. Finally, in Column 4 we intro-duce firm-year fixed effects (i.e., estimates are driven bybond issues with different maturities but from the sameissuer in a given year) to isolate the impact of creditsupply shocks (Khwaja and Mian, 2008). The magnitudeof the time trend coefficient is slightly reduced, but westill find the coefficient to be negative and stronglysignificant at 1.7% per year. This indicates that supply-side effects are important in explaining the decrease inthe maturity of bond issues. The final two columns showthat listing groups coefficients are significant but are notable to account for the decline in the maturity of newbond issues, which again indicates that supply-sideeffects are important.
Panel B of Table 10 present the estimates of the loanmaturity regressions. The most important finding is thatthe time trend coefficient is positive and significant,
24 The new debt issues data allow for a more powerful test of the
sensitivity of debt maturity to macroeconomic factors than balance
sheet data, which are an aggregation of historical debt issuances and,
therefore, are not directly related to current macroeconomic factors.
In untabulated results, we find that inflation, real short-term rate, and
default spread are important in explaining the maturity of new debt
issues, but they are not able to explain the negative trend in maturity.
Please cite this article as: Custodio, C., et al., Why are US fiEconomics (2012), http://dx.doi.org/10.1016/j.jfineco.2012.10
which indicates that the decrease in debt maturity isnot driven by bank loans. The coefficients on the deter-minants of maturity are mostly consistent with those inTable 4.
In summary, the evidence provided by regressionmodels from public debt issues controlling for changesin firm characteristics is consistent with a decrease inmaturity. In contrast, no evidence exists of a decline inmaturity in private debt markets. Moreover, observed orunobserved firm heterogeneity and sample compositioneffects are not able to explain the decrease in the maturityof bond issues. This suggests that supply-side effects playan important role in explaining the decrease in debtmaturity.
6.2. Supply-side effects
Recent studies demonstrate that credit supply condi-tions (i.e., fundamental investor demand) influence firms’capital structure. For example, Faulkender and Petersen(2006) find that firms with access to bond markets(proxied by bond rating) have access to a greater supplyof debt and, thus, are more highly levered. Leary (2009)studies the change in bank credit supply caused by the1961 emergence of the market for certificates of depositand the 1966 credit crunch. Sufi (2009) studies theintroduction of ratings for syndicated loans. Lemmonand Roberts (2010) study the supply shock in the junkbond market precipitated by the collapse of Drexel Burn-ham Lambert and subsequent regulatory changes in 1989.
So far we have shown that demand-side effects onlypartially explain the downward trend in debt maturity.
rms using more short-term debt? Journal of Financial.009

Table 10Regression of initial maturity of new bond issues and syndicated loans.
This table reports the estimates of OLS and fixed effects regressions of the logarithm of the initial maturity (in years) of new bond issues and syndicated
loans. In Panel A, the sample consists of Mergent Fixed Income Securities Database (FISD) bond issues by firms with Compustat identifiers from 1976 to
2008. In Panel B, the sample consists of Loan Pricing Corporation’s Dealscan loan facilities by firms with Compustat identifiers from 1987 to 2008.
Financial industries (SIC codes 6000–6999) and utilities (SIC codes 4900–4999) are omitted. Refer to Table A.1 in Appendix A for variable definitions.
Robust t-statistics adjusted for firm-level clustering are in parentheses.
Panel A: Maturity of bond issues
OLS OLS FE FE OLS OLS
Variable (1) (2) (3) (4) (5) (6)
Trend�100 �2.483 �2.323 �2.333 �1.704 �2.489 �2.546
(�15.88) (�14.22) (�10.85) (�2.53) (�12.62) (�13.26)
Pre-1980 listing dummy 2.822 2.858
(78.51) (51.35)
1980-1989 listing dummy 2.807 2.904
(56.91) (43.45)
1990–1999 listing dummy 2.795 2.943
(53.05) (42.10)
2000–2008 listing dummy 2.928 3.077
(40.57) (36.83)
Size 0.237 �0.379 �0.314 0.291
(1.02) (�1.65) (�1.12) (1.29)
Size2�0.179 0.606 0.517 �0.184
(�0.77) (2.54) (1.70) (�0.81)
Market-to-book 0.025 0.017 0.025 0.024
(2.04) (0.97) (1.25) (1.93)
Abnormal earnings �0.001 0.006 0.008 0.001
(�0.07) (0.25) (0.37) (0.08)
Asset maturity 0.003 0.001 0.004 0.003
(2.26) (0.76) (1.33) (2.28)
Asset volatility �0.488 �0.504 �0.336 �0.552
(�6.12) (�4.79) (�2.69) (�6.99)
Leverage �0.327 �0.314 �0.353 �0.350
(�5.25) (�3.26) (�2.51) (�5.51)
R&D �0.768 �0.080 0.078 �0.747
(�3.56) (�0.19) (0.17) (�3.54)
Term spread �0.157 0.615 2.477 �0.069
(�0.15) (0.58) (1.59) (�0.07)
Intercept 2.816 2.851
(78.80) (49.85)
Issue type dummies Yes Yes Yes Yes Yes Yes
Firm-year dummies No No No Yes No No
Number of observations 12,821 12,821 12,821 12,821 12,821 12,821
R2 0.065 0.087 0.348 0.500 0.925 0.927
Panel B: Maturity of loans
OLS OLS FE FE OLS OLS
Variable (1) (2) (3) (4) (5) (6)
Trend�100 1.431 1.494 1.093 1.472 1.552 1.432
(15.23) (16.67) (9.73) (7.92) (16.25) (15.56)
Pre-1980 listing dummy �0.314 �0.492
(�9.87) (�13.75)
1980–1989 listing dummy �0.391 �0.500
(�11.79) (�13.88)
1990–1999 listing dummy �0.402 �0.488
(�12.37) (�13.48)
2000–2008 listing dummy �0.366 �0.450
(�9.52) (�10.85)
Size 0.906 0.654 0.592 0.900
(18.29) (6.70) (5.03) (18.12)
Size2�0.625 �0.401 �0.309 �0.616
(�11.70) (�3.97) (�2.46) (�11.44)
Market-to-book �0.010 �0.008 �0.007 �0.011
(�2.93) (�1.45) (�0.98) (�3.04)
Abnormal earnings 0.023 0.013 0.016 0.023
(2.77) (1.25) (1.24) (2.77)
Asset maturity 0.001 �0.002 �0.001 0.001
(1.49) (�1.98) (�0.95) (1.48)
Asset volatility �0.282 �0.174 �0.188 �0.285
Please cite this article as: Custodio, C., et al., Why are US firms using more short-term debt? Journal of FinancialEconomics (2012), http://dx.doi.org/10.1016/j.jfineco.2012.10.009
C. Custodio et al. / Journal of Financial Economics ] (]]]]) ]]]–]]] 27

Table 10 (continued )
Panel B: Maturity of loans
OLS OLS FE FE OLS OLS
Variable (1) (2) (3) (4) (5) (6)
(�10.51) (�4.58) (�4.16) (�10.58)
Leverage 0.210 0.042 0.034 0.210
(8.63) (1.15) (0.75) (8.56)
R&D �0.537 0.466 0.724 �0.538
(�6.26) (2.44) (3.23) (�6.25)
Term spread �3.995 �4.126 �4.450 �4.570 �4.131
(�11.49) (�12.45) (�13.13) (�11.44) (�12.44)
Intercept �0.285 �0.506
(�8.97) (�14.44)
Loan purpose and type dummies Yes Yes Yes Yes Yes Yes
Firm-year dummies No No No Yes No No
Number of observations 113,094 113,094 113,094 113,094 113,094 113,094
R2 0.555 0.598 0.744 0.794 0.877 0.889
C. Custodio et al. / Journal of Financial Economics ] (]]]]) ]]]–]]]28
New listing groups capture the effect of the time trend inthe debt maturity regressions. However, the new listingeffect can be linked to both demand- and supply-sideexplanations. We have already provided evidence sup-porting that supply-side factors are important in explain-ing debt maturity. We find a negative and significanttrend in the maturity of new bond issues, which isconsistent with the idea that investor demand in publicdebt markets plays an important role. In addition, theinternational evidence shows that the trend in debtmaturity is limited to US firms. This is consistent withthe idea that public debt markets play an important rolebecause the US has the most developed corporate bondmarket in the world.
In this subsection, we run additional tests to addressthe possibility that the evolution of debt maturity isexplained by supply-side effects. A first approach consistsof estimating the average treatment effect on the treated(ATT) by matching firms in the post-1980 listing group(treated firms) with firms in the pre-1980 listing group(control firms). For every post-1980 listing firm weidentify a matching pre-1980 listing firm that has thesame predicted probability. We use a probit model inwhich the dependent variable is a dummy that takes thevalue of one if a firm was listed before 1980 and the sameexplanatory variables as in Table 4. If credit supply wereto be constant over time and the decrease in maturity isdriven by firm-specific demand factors, we should find nodifference in maturity between the treated and controlfirms. We run the matching estimator ATT for debt
maturity 3, maturity of bond issues, and maturity ofsyndicated loans. In untabulated results, we find thattreated firms have significantly shorter debt maturity 3and maturity of bond issues, while there is no differencein terms of syndicated loans maturity. Post-1980 firmshave a ratio of debt maturing in more than 3 years to totaldebt that is 4% lower than pre-1980 firms. The maturity ofbond issues by post-1980 firms is 2 years shorter thanthat of bond issues by pre-1980 firms. These findings areconsistent with the supply of credit not being constantover time and supply effects playing a role in explainingthe decrease in debt maturity.
Please cite this article as: Custodio, C., et al., Why are US fiEconomics (2012), http://dx.doi.org/10.1016/j.jfineco.2012.10
A second approach consists of using exogenous eventsto the firms that directly affect credit market conditions.Following Lemmon and Roberts (2010), we use thecollapse of Drexel Burnham Lambert, the passage of theFinancial Institutions Reform, Recovery, and EnforcementAct of 1989, and the regulatory changes in the insuranceindustry as an exogenous contraction in the supply ofbelow investment-grade credit after 1989 to study theimpact of supply factors in debt maturity. We run adifference-in-differences test in which the treatmentgroup consists of speculative-grade bond issues and thecontrol group consists of investment-grade bond issues.We expect to find a decrease in the maturity of bondsissues after 1989 for speculative-grade bonds but notfor investment-grade bonds, because credit conditionsbecame tighter for the former group.
We restrict the sample period to 1986–1993 for this test.Panel A of Table 11 shows the results. The dependentvariable in these regressions is the initial maturity of abond issue. To perform the difference-in-differences analy-sis, we include a speculative-grade dummy variable, a post-1989 dummy variable, and an interaction term between thetwo variables. All specifications include the same firm-levelcontrols as in Table 4. Model 2 uses industry dummies,Model 3 uses industry and year dummies, and Model 4 usesfirm fixed effects. We find that the coefficient of theinteraction term between the post-1989 dummy and thespeculative grade dummy is negative and significant acrossall specifications. The interpretation is that the contractionin investor demand for speculative-grade bonds in the post-1989 period had a negative impact on the maturity ofspeculative-grade bond issues relative to the maturity ofinvestment-grade bond issues.
The second exogenous event is the 2007–2008 financialcrisis and the contraction in the supply of bank loans(Ivashina and Scharfstein, 2010; Santos, 2011). In this casewe estimate the difference-in-differences estimator of debtmaturity using balance sheet data. The treatment groupconsists of unrated firms and the control group consists ofrated firms. Unrated firms do not have access to public debtmarkets and, therefore, they cannot substitute bonds forbank loans at the time of a shock to the supply of bank
rms using more short-term debt? Journal of Financial.009

Table 11Difference-in-differences estimator of debt maturity.
This table reports the estimates of OLS and fixed effects regressions of the logarithm of the initial maturity (in years) of bond issues (Panel A) and debt
maturity (Panel B), defined as the percentage of debt maturing in more than 3 years. In Panel A, the sample consists of Mergent Fixed Income Securities
Database (FISD) bond issues by firms with Compustat identifiers from 1986 to 1993, which is the period around the collapse of the Drexel Burnham
Lambert in 1989. In Panel B, the sample consists of observations of Compustat firms from 2006 to 2008, which is the period around the 2007–2008
financial crisis. Financial industries (SIC codes 6000–6999) and utilities (SIC codes 4900–4999) are omitted. Refer to Table A.1 in Appendix A for variable
definitions. Robust t-statistics adjusted for firm-level clustering are in parentheses.
Panel A: Maturity of bond issues (1986–1993)
OLS OLS OLS FE
Variable (1) (2) (3) (4)
Speculative-grade dummy 0.173 0.175 0.159 0.332
(2.08) (2.03) (2.09) (2.19)
Post-1989 dummy 0.021 0.019 0.098 0.080
(0.13) (0.11) (1.27) (0.83)
Speculative-grade dummy �0.367 �0.366 �0.349 �0.334
x Post-1989 dummy (�4.31) (�3.94) (�4.59) (�3.29)
Size 0.697 0.458 0.435 0.010
(1.95) (1.57) (1.48) (0.01)
Size2�0.385 �0.188 �0.165 0.759
(�1.06) (�0.64) (�0.57) (0.92)
Market-to-book �0.055 �0.043 �0.046 �0.122
(�1.15) (�1.06) (�1.15) (�1.12)
Abnormal earnings �0.166 �0.133 �0.106 �0.163
(�1.97) (�1.90) (�1.64) (�1.01)
Asset maturity 0.003 0.007 0.007 0.000
(0.85) (2.04) (2.00) (0.02)
Asset volatility 0.199 0.255 0.473 0.680
(0.75) (1.02) (1.60) (0.97)
Leverage �0.063 0.031 0.058 �0.146
(�0.48) (0.27) (0.47) (�0.44)
R&D �0.045 �0.116 �0.184 �0.796
(�0.06) (�0.14) (�0.22) (�0.24)
Term spread 1.759 2.155
(0.28) (0.34)
Intercept 2.168
(21.72)
Industry dummies No Yes Yes No
Year dummies No No Yes Yes
Number of observations 2,959 2,959 2,959 2,959
R2 0.052 0.118 0.128 0.366
Panel B: Debt maturity (2006–2008)
No rating dummy �0.125 �0.113 �0.113 �0.131
(�6.17) (�5.90) (�5.90) (�2.43)
Post-2007 dummy �0.028 �0.025
(�2.13) (�1.96)
No rating dummy �0.025 �0.027 �0.027 �0.036
x Post-2007 dummy (�2.03) (�2.26) (�2.26) (�2.02)
Size 1.108 1.123 1.123 0.540
(17.13) (18.03) (18.03) (2.89)
Size2�0.957 �0.985 �0.985 �0.341
(�15.13) (�15.96) (�15.96) (�1.72)
Market-to-book �0.019 �0.020 �0.020 �0.015
(�5.65) (�6.15) (�6.15) (�2.30)
Abnormal earnings 0.030 0.029 0.029 0.030
(4.43) (4.21) (4.21) (2.92)
Asset maturity 0.002 0.000 0.000 �0.002
(2.66) (0.45) (0.45) (�1.12)
Asset volatility �0.112 �0.114 �0.114 �0.030
(�3.86) (�3.86) (�3.86) (�0.75)
Leverage 0.493 0.486 0.486 0.378
(10.16) (9.28) (9.28) (4.48)
R&D �0.163 �0.144 �0.144 �0.157
(�3.10) (�4.15) (�4.15) (�1.10)
Term spread �1.791 �1.856
(�2.54) (�2.62)
Intercept 0.378 0.515 0.455 0.486
(9.72) (10.12) (8.63) (8.87)
Industry dummies No Yes Yes No
Year dummies No No Yes Yes
Number of observations 6,873 6,873 6,873 6,873
R2 0.349 0.370 0.370 0.805
Please cite this article as: Custodio, C., et al., Why are US firms using more short-term debt? Journal of FinancialEconomics (2012), http://dx.doi.org/10.1016/j.jfineco.2012.10.009
C. Custodio et al. / Journal of Financial Economics ] (]]]]) ]]]–]]] 29

Table A.1Variable definitions.
Variable Definition
Debt maturity 3 Ratio of long-term debt (DLTT) minus debt maturing in 2 and 3 years (DD2þDD3) to total debt. Total debt is defined as
debt in current liabilities (DLC) plus long-term debt (DLTT).
Debt maturity 5 Ratio of long-term debt (DLTT) minus debt maturing in 2, 3, 4, and 5 years (DD2þDD3þDD4þDD5) to total debt.
Size Percent of NYSE firms that have the same or smaller market capitalization, defined as number of shares outstanding
(CSHO) times stock price at the fiscal year-end (PRCC_F).
Market-to-book Ratio of market value of assets (ATþCSHO�PRCC_F—CEQ) to total assets (AT).
Abnormal earnings Ratio of difference between the income before extraordinary items, adjusted for common or ordinary stock (capital)
equivalents (IBADJ) for time t and t�1 over the market value of equity used to calculate earnings per share
(PRCC_F�CSHPRI).
Assets maturity Ratio of property, plant and equipment (PPEGT) over depreciation and amortization (DP) times the proportion of property,
plant, and equipment in total assets (PPEGT/AT), plus the ratio of current assets (ACT) over the cost of goods sold (COGS)
times the proportion of current assets in total assets (ACT/AT).
Assets volatility Standard deviation of stock return during the fiscal year times market value of equity (CSHO�PRCC_F) divided by market
value of assets (ATþCSHO�PRCC_F—CEQ).
Leverage Ratio of total debt to total assets (AT).
R&D Ratio of research and development expenditures (XRD) to total assets (AT).
CAPEX Ratio of capital expenditures (CAPX) to total assets (AT).
Governance index Governance index of Gompers, Ishii and Metrick (2003), which is based on 24 antitakeover provisions (Investor
Responsibility Research Center).
Managerial ownership Number of shares held by top five managers divided by the number of shares outstanding (ExecuComp).
PPE Ratio of net property, plant, and equipment (PPNT) to total assets (AT).
Rating dummy Dummy variable that takes the value of one if a firm has a Standard & Poor’s domestic long-term issuer credit rating
(SPLTICRM).
Investment-grade
dummy
Dummy variable that takes the value of one if a firm has a credit rating BBB� or above.
Speculative-grade
dummy
Dummy variable that takes the value of one if a firm has credit rating BBþ or below.
Institutional ownership Number of shares held by institutions divided by the number of shares outstanding (Thomson CDA/Spectrum 13F
Holdings).
Analyst coverage Number of analysts covering a firm (I/B/E/S).
Dispersion of analyst
forecasts
Standard deviation of analyst forecasts (STDEV�00) over total assets (AT).
Amihud illiquidity Average of the ratio of the absolute stock return over the dollar volume (Amihud, 2002).
Return on assets Ratio of earnings before interest, taxes, depreciation, and amortization (EBITDA) to total assets (AT).
Dividend dummy Dummy variable that takes the value of one if the firm pays dividends (DVC).
Cash Ratio of cash and short-term investments (CHE) to total assets (AT).
Age Number of years between fiscal year and CRSP listing year (LISTYEAR).
Founding age Number of years since foundation (Jovanovic and Rousseau, 2001; Loughran and Ritter, 2004).
Taxes Ratio of total income taxes (TXT) to pretax income (PI).
Term spread Difference between the yield on 10-year government bonds and the yield on 1-year government bonds (Federal Reserve).
Short-term rate Yield on 1-year government bonds (Federal Reserve).
Inflation Annual percentage change in the consumer price index (Bureau of Labor Statistics).
Real short-term rate Difference between the 3-month Treasury bill rate (Federal Reserve) and inflation.
Default spread Difference between BAA- and AAA-rated corporate bond yields (Federal Reserve).
Recession dummy Dummy variable that takes the value of one if there are at least 1 month in a year designated as recession by the NBER.
Bank stock index return Market-adjusted return for the bank industry using the 48 Fama and French industry classification.
Government share Share of government debt and coupon payments with maturity of 1 year or more (Greenwood, Hanson and Stein, 2010).
C. Custodio et al. / Journal of Financial Economics ] (]]]]) ]]]–]]]30
loans. In contrast, rated firms have access to public debtmarkets and are less bank-dependent than unrated firms.
We restrict the sample period to 2006–2008 for thistest. Panel B of Table 11 shows the results. We use thesame specifications as in Panel A of Table 11.The coefficient of interest is the interaction term betweenthe post-2007 dummy and the no-rating dummy. We findthat the coefficient of the interaction term is negative andsignificant in all specifications. This implies that nonratedfirms decreased debt maturity after 2007 significantlymore than rated firms. We find that the 2007–2008financial crisis had a different impact on the debt matur-ity of unrated and rated firms. Overall, these findingshighlight the important role of supply-side factors inexplaining the evolution of debt maturity.
Please cite this article as: Custodio, C., et al., Why are US fiEconomics (2012), http://dx.doi.org/10.1016/j.jfineco.2012.10
7. Conclusion
We find a secular decrease in corporate debt maturityof US industrial firms from 1976 to 2008. We show thatthis decrease is concentrated among small firms, with themedian percentage of debt maturing in more than 3 years,decreasing from 53% in 1976 to 6% in 2008. For largefirms, however, debt maturity did not decline over thesame period. We find that firms with a higher degree ofinformation asymmetry are responsible for the decreasein corporate use of longer-term debt. Agency conflicts andsignaling and liquidity risk theories do not help explainthe decrease in debt maturity. In particular, new firmsissuing public equity in the 1980s and 1990s are respon-sible for the decrease in corporate debt maturity. Firms
rms using more short-term debt? Journal of Financial.009

C. Custodio et al. / Journal of Financial Economics ] (]]]]) ]]]–]]] 31
listed in recent decades use much more short-term debtthan older firms do. We also find that there is no trend indebt maturity when the firm’s listing vintage is taken intoaccount. The decrease in debt maturity, however, cannotbe fully explained by demand-side factors. We show thatdebt maturity is affected by credit-market supply-sidefactors. In addition, we find that the decrease in debtmaturity took place mainly in public debt markets, not inprivate debt markets.
Our findings suggest that the decrease in corporatedebt maturity is concentrated in the part of the economythat has been able to access public equity and debtmarkets because of greater financial market developmentand of a decrease in the cost of capital. The shortening ofcorporate debt maturity has increased the exposure offirms to credit and liquidity shocks. In fact, the concen-tration of debt maturities has increased and there is ahigher fraction of firms with a substantial share of debtmaturing in a given year. These facts could have exacer-bated the effects of the 2007–2008 financial crisis on thereal sector.
Appendix A
For detailed variable definitions see Table A.1.
References
Acharya, V., Almeida, H., Campello, M., 2011. Aggregate risk and thechoice between cash and lines of credit. Working Paper. Universityof Illinois, Urbana-Champaign, unpublished.
Almeida, H., Campello, M., Laranjeira, B., Weisbenner, S., 2011. Corporatedebt maturity and the real effects of the 2007 credit crisis. CriticalFinance Review 1, 3–58.
Amihud, Y., 2002. Illiquidity and stock returns: cross-section and time-series effects. Journal of Financial Markets 5, 31–56.
Baker, M., 2009. Capital market-driven corporate finance. Annual Reviewof Financial Economics 1, 181–205.
Baker, M., Greenwood, R., Wurgler, J., 2003. The maturity of debt issuesand predictable variation in bond returns. Journal of FinancialEconomics 70, 261–291.
Barclay, M., Smith, C., 1995. The maturity structure of corporate debt.Journal of Finance 50, 609–631.
Bates, T., Kahle, K., Stulz, R., 2009. Why do US firms hold so much morecash than they used to? Journal of Finance 64, 1985–2021.
Becker, B., Ivashina, V., 2011. Cyclicality of credit supply: firm levelevidence. Working Paper. Harvard Business School, Cambridge,unpublished.
Berger, A., Espinosa-Vega, M., Frame, W., Miller, N., 2005. Debt maturity,risk, and asymmetric information. Journal of Finance 60, 2895–2923.
Billett, M., King, T., Mauer, D., 2007. Growth opportunities and the choiceof leverage, debt maturity, and covenants. Journal of Finance 62,697–730.
Brick, I., Ravid, S., 1985. On the relevance of debt maturity structure.Journal of Finance 40, 1423–1437.
Brockman, P., Martin, X., Unlu, E., 2010. Executive compensation and thematurity of corporate debt. Journal of Finance 65, 1123–1161.
Brown, G., Kapadia, N., 2007. Firm-specific risk and equity marketdevelopment. Journal of Financial Economics 84, 358–388.
Campbell, J., Lettau, M., Malkiel, B., Xu, Y., 2001. Have individual stocksbecome more volatile? An empirical exploration of idiosyncraticrisk. Journal of Finance 56, 1–43.
Campello, M., Graham, J., Harvey, C., 2010. The real effects of financialconstraints: evidence from a financial crisis. Journal of FinancialEconomics 97, 470–487.
Chava, S., Roberts, M., 2008. How does financing impact investment? Therole of debt covenants. Journal of Finance 63, 2085–2121.
Please cite this article as: Custodio, C., et al., Why are US fiEconomics (2012), http://dx.doi.org/10.1016/j.jfineco.2012.10
Cooper, S., Groth, J., Avera, W., 1985. Liquidity, exchange listing, andstock return performance. Journal of Economics and Business 37,19–33.
Datta, S., Iskandar-Datta, M., Raman, K., 2005. Managerial stock owner-ship and the maturity structure of corporate debt. Journal of Finance60, 2333–2350.
Diamond, D., 1991. Debt maturity structure and liquidity risk. QuarterlyJournal of Economics 106, 709–737.
Duchin, R., Ozbas, O., Sensoy, B., 2010. Costly external finance, corporateinvestment, and the subprime mortgage credit crisis. Journal ofFinancial Economics 97, 418–435.
Easley, D., Hvidkjaer, S., O’Hara, M., 2002. Is information risk a determi-nant of asset returns? Journal of Finance 57, 2185–2221.
Erel, I., Julio, B., Kim, W., Weisbach, M., 2012. Macroeconomic conditionsand capital raising. Review of Financial Studies 12, 341–376.
Fama, E., French, K., 1997. Industry costs of equity. Journal of FinancialEconomics 43, 153–193.
Fama, E., French, K., 2001. Disappearing dividends: changing firmcharacteristics or lower propensity to pay? Journal of FinancialEconomics 60, 3–43.
Fama, E., French, K., 2004. New lists: fundamentals and survival rates.Journal of Financial Economics 73, 229–269.
Faulkender, M., Petersen, M., 2006. Does the source of capital affect thecapital structure? Review of Financial Studies 19, 45–79.
Flannery, M., 1986. Asymmetric information and risky debt maturitychoice. Journal of Finance 41, 19–37.
Gompers, P., Ishii, J., Metrick, A., 2003. Corporate governance and equityprices. Quarterly Journal of Economics 118, 107–155.
Greenwood, R., Hanson, S., Stein, J., 2010. A gap-filling theory ofcorporate debt maturity choice. Journal of Finance 65, 993–1028.
Guedes, J., Opler, T., 1996. The determinants of the maturity of corporatedebt issues. Journal of Finance 51, 1809–1833.
Harford, J., Klasa, S., Maxwell, W., 2011. Refinancing risk and cash holdings.Working Paper. University of Washington, Seattle, unpublished.
Harford, J., Li, K., Zhao, X., 2006. Corporate boards and the leverage anddebt maturity choices. Working Paper. University of Washington,Seattle, unpublished.
Ivashina, V., Scharfstein, D., 2010. Bank lending during the financial crisisof 2008. Journal of Financial Economics 97, 319–338.
Jensen, M., Meckling, W., 1976. Theory of the firm: managerial behavior,agency costs, and ownership structure. Journal of Financial Econom-ics 3, 305–360.
Johnson, S., 2003. Debt maturity and the effects of growth opportunitiesand liquidity risk on leverage. Review of Financial Studies 16,209–236.
Jovanovic, B., Rousseau, P., 2001. Why wait? A century of life before IPO.American Economic Review 91, 336–341.
Khwaja, A., Mian, A., 2008. Tracing the impact of bank liquidity shocks:evidence from an emerging market. American Economic Review 98,1413–1442.
Leary, M., 2009. Bank loan supply, lender choice, and corporate capitalstructure. Journal of Finance 64, 1143–1185.
Lemmon, M., Roberts, M., 2010. The response of corporate financing andinvestment to changes in the supply of credit. Journal of Financialand Quantitative Analysis 45, 555–587.
Loughran, T., Ritter, J., 2004. Why has IPO underpricing changed overtime? Financial Management 33, 5–37.
Mian, A., Santos, J., 2011. Liquidity risk, maturity management, and thebusiness cycle. Working Paper. University of California, Berkeley, CA,unpublished.
Myers, S., 1977. Determinants of corporate borrowing. Journal ofFinancial Economics 5, 147–175.
Pastor, L., Stambaugh, R., 2003. Liquidity risk and expected stock returns.Journal of Political Economy 111, 642–685.
Rajan, R., Zingales, L., 2003. The great reversals: the politics of financialdevelopment in the 20th century. Journal of Financial Economics 69,5–50.
Roll, R., 1984. A simple implicit measure of the effective bid-ask spreadin an efficient market. Journal of Finance 39, 1127–1139.
Santos, J., 2011. Bank corporate loan pricing following the subprimecrisis. Review of Financial Studies 24, 1916–1943.
Stohs, M., Mauer, D., 1996. The determinants of corporate debt maturitystructure. Journal of Business 69, 279–312.
Sufi, A., 2009. The real effects of debt certification: evidence from theintroduction of bank loan ratings. Review of Financial Studies 22,1659–1691.
rms using more short-term debt? Journal of Financial.009