journal of rock mechanics and geotechnical · pdf fileof rock mechanics and geotechnical...
TRANSCRIPT
Pi
Ra
b
c
a
ARR1A
KMFBFI
1
oubs
(PA
1Sh
Journal of Rock Mechanics and Geotechnical Engineering 6 (2014) 13–25
Journal of Rock Mechanics and Geotechnical Engineering
Journal of Rock Mechanics and GeotechnicalEngineering
journa l homepage: www.rockgeotech.org
ractical application of failure criteria in determining safe mud weight windowsn drilling operations
. Gholamia,∗, A. Moradzadeha, V. Rasoulib, J. Hanachic
Department of Mining, Petroleum and Geophysics, Shahrood University of Technology, Shahrood, IranDepartment of Petroleum Engineering, Curtin University, Perth, AustraliaGeological Division, Iranian Offshore Oilfield Company, Tehran, Iran
r t i c l e i n f o
rticle history:eceived 13 September 2013eceived in revised form2 November 2013ccepted 20 November 2013
eywords:ud weight windows
ailure criterionreakoutracturingntermediate principal stress
a b s t r a c t
Wellbore instability is reported frequently as one of the most significant incidents during drilling oper-ations. Analysis of wellbore instability includes estimation of formation mechanical properties and thestate of in situ stresses. In this analysis, the only controllable parameter during drilling operation is themud weight. If the mud weight is larger than anticipated, the mud will invade into the formation, causingtensile failure of the formation. On the other hand, a lower mud weight can result in shear failures ofrock, which is known as borehole breakouts. To predict the potential for failures around the wellboreduring drilling, one should use a failure criterion to compare the rock strength against induced tangen-tial stresses around the wellbore at a given mud pressure. The Mohr–Coulomb failure criterion is oneof the commonly accepted criteria for estimation of rock strength at a given state of stress. However,the use of other criteria has been debated in the literature. In this paper, Mohr–Coulomb, Hoek–Brownand Mogi–Coulomb failure criteria were used to estimate the potential rock failure around a wellborelocated in an onshore field of Iran. The log based analysis was used to estimate rock mechanical proper-ties of formations and state of stresses. The results indicated that amongst different failure criteria, theMohr–Coulomb criterion underestimates the highest mud pressure required to avoid breakouts around
the wellbore. It also predicts a lower fracture gradient pressure. In addition, it was found that the resultsobtained from Mogi–Coulomb criterion yield a better comparison with breakouts observed from thecaliper logs than that of Hoek–Brown criterion. It was concluded that the Mogi–Coulomb criterion is abetter failure criterion as it considers the effect of the intermediate principal stress component in thefailure analysis.© 2013 Institute of Rock and Soil Mechanics, Chinese Academy of Sciences. Production and hosting by
2assbisa
. Introduction
Maintaining a stable borehole is one of the major tasks in theil and gas industry as it can induce high costs on drilling sched-le (Chen et al., 2003). Wellbore stability analysis has thereforeeen included at the well planning stage and been studied exten-ively (Bradley, 1979; Bell, 2003; Zhang et al., 2003; Gentzis et al.,
∗ Corresponding author. Tel.: +98 9112450994; fax: +60 85 443 837.E-mail addresses: [email protected], [email protected]
R. Gholami).eer review under responsibility of Institute of Rock and Soil Mechanics, Chinesecademy of Sciences.
674-7755 © 2013 Institute of Rock and Soil Mechanics, Chinese Academy ofciences. Production and hosting by Elsevier B.V. All rights reserved.ttp://dx.doi.org/10.1016/j.jrmge.2013.11.002
tspmab1BJttt
Elsevier B.V. All rights reserved.
009; Zhang et al., 2009; Ding, 2011). In drilling engineering task, linear poro-elasticity stress model in conjunction with a rocktrength criterion is used to determine the optimum mud pres-ure required to stabilize the wellbore. During the drilling, boreholereakout and drilling induced fractures are the two main instabil-
ty problems which may lead to stuck pipe, reaming operations,idetracking, and loss of circulation. These problems can be oftenddressed by selecting a suitable mud weight for drilling. This isypically carried out using a constitutive model to estimate thetresses around the wellbore coupled with a failure criterion toredict the ultimate strength of reservoirs rocks. Therefore, theain aspect of wellbore stability analysis is the selection of an
ppropriate rock strength criterion. Numerous triaxial criteria haveeen proposed, which are easy to use and very common (Mohr,900; Fairhurst, 1964; Hobbs, 1964; Murrell, 1965; Franklin, 1971;ieniawski, 1974; Hoek and Brown, 1980; Yudhbir et al., 1983;
ohnston, 1985; Ramamurthy et al., 1985; Sheorey et al., 1989). Theriaxial criteria show good agreement with the results from triaxialests and are frequently used in stability analyses of rock struc-ures. However, they ignore the influence of intermediate principal
1 cs and
socmlaetiatstoHpcpb
tyRZtitsonZ
tDhdtprvaetsnrrpauewbafsTd
pbwut(
2
iidaefAtpa
tiarwrgp
w
�
�
�
wiabi(
�
�
�
at0voctsvto happen at the point of maximum tangential stress where therock is under maximum compression. Tensile failure known as
4 R. Gholami et al. / Journal of Rock Mechani
tress on ultimate strength of rocks, causing unrealistic predictionf stability for structures. For instance, Mohr–Coulomb strengthriterion is the most commonly used triaxial criterion for deter-ination of rocks strength. This criterion suffers from two major
imitations: (a) it ignores the non-linearity of strength behavior,nd (b) the effect of intermediate principal stress is not consid-red in its conventional form. Thus, the criterion overestimateshe minimum mud pressure due to neglecting the effect of thentermediate principal stress (McLean and Addis, 1990). Verniknd Zoback (1992) found that Mohr–Coulomb criterion is not ableo provide realistic results to relate the borehole breakout dimen-ion to the in situ stresses in crystalline rocks. Zhou (1994) foundhat the Mohr–Coulomb criterion predicts larger breakouts becausef ignoring the effect of intermediate principal stress. Song andaimson (1997) concluded that the Mohr–Coulomb criterion did aoor job in prediction of breakout dimensions. Ewy (1999) con-luded that the Mohr–Coulomb criterion is too conservative inrediction of minimum mud pressure required to stabilize the well-ore.
Hoek–Brown triaxial failure criterion is another well-known cri-erion successfully applied to a wide range of rocks for almost 30ears (Carter et al., 1991; Douglas, 2002; Cai, 2010). Zhang andadha (2010) used Hoek–Brown criterion developed by Zhang andhu (2007) for wellbore stability analysis. They concluded thathe predicted minimum mud pressure by Hoek–Brown criterions in a better agreement with observed incidents compared tohose obtained by the Mohr–Coulomb criterion. However, despiteuccessful applications of the Hoek–Brown criterion in a numberf cases, it was indicated that the intermediate principal stresseeds to be included in the wellbore stability analysis (Al-Ajmi andimmerman, 2006).
Thus, many true triaxial or polyaxial failure criteria, such ashose by Drucker and Prager (1952), Mogi (1967, 1971), Lade anduncan (1975), Zhou (1994), Benz et al. (2008), and You (2009),ave been developed to account for the effect of the interme-iate principal stress in rock failure response. However, most ofhese criteria mathematically subject to some limitations and yieldhysically unreasonable solutions. For instance, the Mogi crite-ion (Mogi, 1971) yields two values of �1 at failure for the samealue of �2 (You, 2009; Colmenares and Zoback, 2002). Wiebolsnd Cook (1968) derived a failure criterion based on shear strainnergy associated with microcracks. However, this model requireshe knowledge of the coefficient of sliding friction between crackurfaces which should be obtained experimentally. Furthermore,umerical methods are required for implementation of this crite-ion. Desai and Salami (1987) introduced a 3D failure criterion thatequires more than six input parameters, and Michelis (1987) pro-osed another criterion in which four constants are involved (Pannd Hudson, 1988; Hudson and Harrison, 1997). In general, 3D fail-re criteria that contain numerous parameters or require numericalvaluation are difficult to be applied in practice, particularly forellbore stability problems. Due to all of the above problems faced
y 3D failure criteria, Al-Ajmi and Zimmerman (2005) introduced new 3D failure criterion known as Mogi–Coulomb criterion. Thisailure criterion has two parameters which can be related to cohe-ion and internal friction angle of Coulomb strength parameters.he Mogi–Coulomb criterion does not ignore the effect of interme-iate principal stress and avoids predicting unrealistic results.
In this study, to investigate the influence of the intermediaterincipal stress on rock failure prediction related to drilling insta-ility, Mogi–Coulomb, Hoek–Brown and Mohr–Coulomb criteriaere used. An onshore well located in southern part of Iran wassed as the case study. The rock mechanical properties and magni-
ude of stresses were estimated from mechanical earth modelingMEM) which is a log based analysis.hp
Geotechnical Engineering 6 (2014) 13–25
. Stable mud weight window for drilling
To evaluate the stability of a wellbore, a constitutive models required to compute the stresses around the borehole. Var-ous constitutive models have been proposed during the pastecades. Westergaard (1940) was poineer on stress distributionsround a borehole using elasto-plastic model. After that, variouslasto-plastic as well as linear-elastic models have been presentedor wellbore stability problems (Gnirk, 1972; Risnes et al., 1982;adnoy et al., 1987; Mitchell et al., 1987; Crook et al., 2002). Among
he various constitutive models have been proposed, the linearoroelasticity stress model is usually used for wellbore stabilitynalysis as it needs fewer input parameters to be determined.
Drilling process alters the states of in situ principal stresses ofhe formations, i.e. vertical stress (�v) and the maximum and min-mum horizontal stresses (�H and �h), so drilling-induced stressesre introduced around the wellbore wall whose magnitudes willevert back to the in situ stresses as moving away from the wellboreall. For isotropic elastic homogeneous rocks, borehole stresses are
epresented by the classical elastic solution (Kirsch, 1898), or itseneralized version for nonaligned borehole and stress directionsroposed by Hiramatsu and Oka (1962, 1968) and Fairhurst (1968).
Tangential, radial and axial stresses in any point around theellbore can be defined from Kirsch’s equations as
� = 12
(�H − �h)
(1 + R2
r2
)
− 12
(�H − �h)
(1 + 3R4
r4
)cos(2�) − Pw
R2
r2(1)
r = 12
(�H − �h)
(1 − R2
r2
)
+ 12
(�H − �h)
(1 − 4
R2
r2+ 3R4
r4
)cos(2�) − Pw
R2
r2(2)
z = �v − 2�(�H − �h) cos(2�) (3)
here �� is the tangential (hoop) stress, �r is the radial stress, �z
s the axial stress induced around the wellbore at the distance rway from a wellbore with a radius of R, Pw is the internal well-ore pressure, � is the Poisson’s ratio of the rock, and the angle �
s measured clockwise from the �H direction. At the wellbore walli.e. when r = R), Kirsch’s equations are simplified to
� = (�H + �h) − 2(�H − �h) cos(2�) − Pw (4)
r = Pw (5)
z = �v − 2�(�H − �h) cos(2�) (6)
According to Eqs. (4) and (6), the tangential and axial stressesre functions of the angle �. This angle indicates the orientation ofhe stresses around the wellbore circumference, and varies from◦ to 360◦. Consequently, the tangential and axial stresses willary sinusoidally. The tangential and radial stresses are functionsf the pressure Pw, but the vertical stress is not. Therefore, anyhange in the mud pressure will only influence �r and �� . Inspec-ion of these two equations reveals that both tangential and axialtresses reach a maximum value at � = ±(�/2) and a minimumalue at � = 0, �. The shear failure known as breakouts is expected
ydraulic or induced fracture, however, is expected to occur at theoint where minimum tangential stress is applied to the rock: an
cs and Geotechnical Engineering 6 (2014) 13–25 15
otctctiti
t
�
�
�
A
B
a
�
�
�
D
E
bc
3
stiwsv
3
epsc
�
wo
w
�
N
wtce
Table 1Mohr–Coulomb criterion for determination of breakout pressure in verticalwellbores.
�1≥�2≥�3 Wellbore failure will occur if Pw ≤ Pw(BO)
�z≥��≥�r Pw(BO) = (E − �c)/N��≥�z≥�r Pw(BO) = (D − �c)/(1 + N)��≥�r≥�z Pw(BO) = D − �c − NE
Table 2Mohr–Coulomb criterion for determination of fracture pressure in verticalwellbores.
�1≥�2≥�3 Wellbore fracture will occur if Pw≥Pw(Frac)
�r≥��≥�z Pw(Frac) = �c + NB
aft
owheam(
splb
P
tmrcT
tabtc
tTtm2
�
wiwst
R. Gholami et al. / Journal of Rock Mechani
rientation 90◦ away from the location of shear failures aroundhe wellbore. Reduction of mud pressure, corresponding to loweronfining pressures, increases the potential for shear failure. Onhe other hand, increasing the mud pressure above a certain limitauses the tensile failure to happen. This discussion indicates thathere is a stable window for the mud weight to drill the wellboren a stable condition. The lower limit for this window correspondso shear failure (breakouts) with its upper limit being the fracturenitiation pressure.
The magnitudes of three principal stresses around the wellboreo analyze the initiation of induced fracture can be obtained as
min� = A − Pw (7)
r = Pw (8)
z = B (9)
= 3�h − �H (10)
= �v − 2�(�H − �h) (11)
For shear failure or breakouts to occur the magnitude of stressesround the wellbore are estimated as
max� = D − Pw (12)
r = Pw (13)
z = E (14)
= 3�H − �h (15)
= �v + 2�(�H − �h) (16)
For wellbore instability analysis, consequently, stresses at theorehole wall are the ones that should be compared against a failureriterion.
. Rock failure criteria
In this section, a brief review of three failure criteria used in thistudy for estimation of mud weight windows in drilling applica-ions are presented. It should be noted that in equations developedn this section for wellbore stability analysis, the pore pressure term
as discarded since the stresses obtained through well log analy-is will be effective stresses. Also, in this study we only considerertical wellbores.
.1. Mohr–Coulomb criterion
Mohr–Coulomb shear failure criterion is mostly used in differ-nt engineering applications. In this criterion, shear failure takeslace across a plane when the normal stress �n and the sheartress � across this plane are associated with a functional relationharacteristic of the material (Mohr, 1900):
= c + ��n (17)
here c is the cohesion and � is the coefficient of internal frictionf the material.
The linearized form of the Mohr failure criterion may also beritten in the principal stress space as
1 = �c + N�3 (18)
= [(�2 + 1)1/2 + �]
2= tan2
(�4
+ ϕ
2
)(19)
here �1 is the major principal effective stress at failure, �3 ishe minimum principal effective stress at failure, �c is the uniaxialompressive strength (UCS), and ϕ is the angle of internal frictionquivalent to arctan �. As it was mentioned, this failure criterion
wp
P
�r≥�z≥�� Pw(Frac) = (�c + NA)/(1 + N)�z≥�r≥�� Pw(Frac) = (�c − B)/N + A
ssumes that the intermediate principal stress has no influence onailure and considers a linear model for obtaining the strength ofhe materials.
The mode of shear failure may be different depending on therder of magnitude of three principal stresses around the wellboreall. These stresses are �� , �r and �z presented in Eqs. (4)–(6). Itas been found that the case of �� > �z > �r is the most commonlyncountered stress state corresponding to borehole breakout forll in situ stresses regimes. On the other hand, �r > �z > �� is theost commonly stress regime corresponding to borehole fracture
Al-Ajmi and Zimmerman, 2005).In shear failure case, considering �� = �1, �z = �2 and �r = �3,
ubstituting these values in the Mohr–Coulomb failure criterionresented in Eq. (18), and introducing Eqs. (12) and (13), the lower
imit of the mud pressure in order to avoid breakouts, Pw(BO), wille
w(BO) = D − �c
1 + N(20)
If the well pressure falls below Pw(BO), borehole collapse willake place. Following the same procedure, the minimum allowable
ud pressure to avoid breakouts around the wellbore wall cor-esponding to the other two possible orders of stress magnitudesan be calculated. The results of such calculations are presented inable 1.
As discussed previously, borehole fracturing, corresponding toensile failure of formation, will occur if the well pressure risesbove the fracture initiation pressure, Pw(Frac). Thus, the upperound for mud weight windows can be calculated. Consideringhe order of stress magnitudes around the wellbore, Pw(Frac) wasalculated and the results are summarized in Table 2.
It is well known that the Mohr–Coulomb criterion overestimateshe tensile strength of rocks (Al-Ajmi and Zimmerman, 2005).herefore, to use this criterion for tensile strength determination, aensile cut-off should be considered. The tensile cut-off is defined as
inimum tangential stress around the wellbore wall (Zhang et al.,010):
3 = T (21)
here T is the uniaxial tensile strength of rock. This equationmplies that if tensile failure occurs, the wellbore pressure, i.e. mud
eight, should exceed the minimum tangential stress plus the ten-ile strength of the formation. In vertical wellbores, it is assumedhat the tangential stress is the only tensile stress at the borehole
all. Introducing Eq. (7) into Eq. (21), the upper limit of the mudressure for the tensile cut-off is obtained asw(cut-off) = 3�h − �H − T (22)
16 R. Gholami et al. / Journal of Rock Mechanics and Geotechnical Engineering 6 (2014) 13–25
Table 3Ranges of m-values recommended for different rock types.
m-values Rock types
5 < m < 8 Carbonate rocks with well-developedcrystal cleavage (e.g. dolomite,limestone, marble)
4 < m < 10 Lithified argillaceous rocks (e.g.mudstone, siltstone, shale, slate)
15 < m < 24 Arenaceous rocks with strong crystalsand poorly developed crystal cleavage(e.g. sandstone, quartzite)
16 < m < 19 Fine-grained polyminerallic igneouscrystalline rocks (e.g. andesite,dolerite, diabase, rhyolite)
22 < m < 33 Coarse-grained polyminerallic igneousand metamorphic rocks (e.g.
cpsi
3
Buto21t(mletp
�
wrfvr
dd
rMa
stiroe
p
q
Table 4Hoek–Brown criterion for determination of breakout pressure in vertical wellbores.
�1≥�2≥�3 Wellbore failure will occur if Pw ≤ Pw(BO)
�z≥��≥�r Pw(BO) =(2D+p)−
√(2E+p)2−4E2+q
2
��≥�z≥�r Pw(BO) =(4D+p)−
√(4D+p)2+16q−16D2
8
3
fpb
�
wrs
�
�
C2f
�
w
a
b
M
bs
I
I
√1 2 1 2
where
a′ = 2c cos ϕ (35)
Table 5Hoek–Brown criterion for determination of fracture pressure in vertical wellbores.
�1≥�2≥�3 Wellbore fracture will occur if Pw≥Pw(Frac)
�r≥��≥�z Pw(Frac) = 2B+√
4B2−4(B2−pB+q)2√
amphibolite, gabbro, gneiss, granite,norite, quartz-diorite)
The mud pressure estimated from this equation should beompared with the value obtained for Pw(Frac) given from thoseresented in Table 2. The smaller one of these values should be con-idered as the maximum allowable mud pressure to avoid tensilenduced fracture in the formation.
.2. Hoek–Brown criterion
The Hoek–Brown empirical rock failure criterion (Hoek andrown, 1980) was developed in the early 1980s for prediction ofltimate strength of intact rock and rock masses. Over the years,he Hoek–Brown rock mass failure criterion has undergone numer-us revisions (Hoek and Brown, 1988, 1997; Hoek et al., 1992, 1995,002). It has even been adapted to specific rock masses (Hoek et al.,998). A summary of the changes to the Hoek–Brown failure cri-erion throughout its development is given by Hoek and Marinos2007). This empirical criterion uses the UCS of the intact rock
aterial as a scaling parameter, and introduces two dimension-ess strength parameters, m and s. After studying a wide range ofxperimental data, Hoek and Brown (1980) stated that the rela-ionship between the maximum and the minimum stresses at theoint of failure is
1 = �3 + �c
(m
�3
�c+ 1
)1/2(23)
here m and s are constants dependent of the properties of theock. The Hoek–Brown failure criterion was originally developedor estimating the strength of rock masses for applications in exca-ation design, but it has then been developed and used for intactocks too.
According to Hoek and Brown (1980, 1997), the parameter mepends on rock types. Table 3 gives the ranges of m-values forifferent rock types.
In underground space applications, Hoek–Brown failure crite-ion has widely been accepted as a better criterion compared toohr–Coulomb criterion since it fits a non-linear model to the data,
s well as provides better estimation of rock strength.Similar calculation procedures described in the previous sub-
ection can be used to calculate mud pressures, correspondingo the lower and upper, stable mud weight windows by assum-ng Hoek–Brown failure criterion. Tables 4 and 5 summarize theesults. In equations presented in these tables, p and q dependn the UCS (�c) of rocks and can be obtained using the following
quations:= m�c (24)
= �2c (25)
��≥�r≥�z Pw(BO) =2(D−E)−
√4(D−E)2−4(D−E−pE−q)
2
.3. Mogi–Coulomb criterion
In polyaxial stress states, Mogi (1971) indicated that brittleracture always occurs along a plane striking in the intermediaterincipal stress direction. He suggested a new failure criterion aselow:
oct = f (�m,2) (26)
here f is a nonlinear, power-law function; �m,2 and �oct are,espectively, the effective mean stress and the octahedral sheartress defined by
m,2 = �1 + �3
2(27)
oct = 13
√(�1 − �2)2 + (�2 − �3)2 + (�3 − �1)2 (28)
Parameters of this failure function cannot be easily related to theoulomb strength parameters, c and ϕ (Colmenares and Zoback,002). Thus, Al-Ajmi and Zimmerman (2005) proposed that theunction f can be considered to be a linear function as follows:
oct = a + b�m,2 (29)
here
= 2√
23
c cos ϕ (30)
= 2√
23
c sin ϕ (31)
Eq. (29) is an extension of the linear Coulomb criterion into theogi stress domain referred as Mogi–Coulomb failure criterion.The strengthening effect of the intermediate principal stress can
e considered by applying the Mogi–Coulomb law. The first andecond stress invariants, I1 and I2, are defined by
1 = �1 + �2 + �3 (32)
2 = �1�2 + �2�3 + �3�1 (33)
Using the Mogi–Coulomb criterion, we will have
I2 − 3I2 = a′ + b′(I − � ) (34)
�r≥�z≥�� Pw(Frac) =(4A−p)+ (4A−p)2−16(A2−pA−q)
8
�z≥�r≥�� Pw(Frac) =2(A−B)+
√[2(B−A)+p]2−4[(B−A)2−pA−q]
2

R. Gholami et al. / Journal of Rock Mechanics and
Table 6Mogi–Coulomb criterion for determination of breakout pressure in verticalwellbores.
�1≥�2≥�3 Wellbore failure will occur if Pw ≤ Pw(BO)
�z≥��≥�r Pw(BO) = 16−2b′2
[(3D + 2b′K) +
√H + 12(K2 + b′DK)
]
��≥�z≥�r Pw(BO) = 12 D − 1
6
√12(a′ + b′D)2 − 3(D − 2E)2
��≥�r≥�z Pw(BO) = 1
[(3D − 2b′G) +
√H + 12(G2 − b′DG)
]
b
(r(t
I
I
acci
McaimM
4
pmmemreopitlp
TMw
opimp
4
mc2ots2bt
4
iwiuuc
4
bshϕwsm1i
(a
ϕ
w
6−2b′2
H = D2(4b′2 − 3) + (E2 − DE)(4b′2 − 12), K = a′ + b′E, G = K + b′D
′ = sin ϕ (36)
The principal stresses at the borehole wall given by Eqs.12)–(14) represent the highest stress concentration that mayesult in compressive failure. Introducing these equations into Eqs.32) and (33), the first and second stress invariants will be changedo
1 = D + E (37)
2 = DE + DPw − P2w (38)
To determine the mud pressures corresponding to the lowernd upper bounds of mud weight windows, we follow similar cal-ulation procedures used in the two previous subsections, here,onsidering the Mogi–Coulomb criterion. The results are presentedn Tables 6 and 7.
It is noted that the uniaxial tensile strength estimated byogi–Coulomb criterion is identical to that of Mohr–Coulomb
riterion, since both criteria are equivalent in the state of uni-xial tension. Therefore, a tensile cut-off should also be introducednto Mogi–Coulomb failure criterion. Thus, the upper limit of the
ud pressure defined by Eq. (22) should be introduced into theogi–Coulomb borehole failure criterion.
. Mechanical earth model (MEM)
It is well known that there are correlations between rock’shysical properties obtained from petrophysical logs and its elasto-echanical properties. For example, the larger the sonic velocityeasured from DSI tool is, the larger the elastic and strength prop-
rties of the rock will be. Also, different formations with differentechanical properties subjected to a similar state of stresses may
espond differently. The MEM uses this basis and extracts rocklasto-mechanical properties as well as state of stresses from databtained in one or few wells in a field (Rasouli et al., 2011). Therocess includes construction of elastic property logs from phys-
cal equations, strength properties from existing correlations andhen magnitude of three principal stresses in field. The extractedogs will be calibrated against core data or field test data, for exam-le, elastic and strength properties will be checked against uniaxial
able 7ogi–Coulomb criterion for determination of fracture pressure in verticalellbores.
�1≥�2≥�3 Wellbore fracture will occur if Pw≥Pw(Frac)
�r≥��≥�z Pw(Frac) = 16−2b′2
[(3A + 2b′N) +
√J + 12(N2 + b′AN)
]
�r≥�z≥�� Pw(Frac) = 12 A + 1
6
√12(a′ + b′A)2 − 3(2AB)2
�z≥�r≥�� Pw(Frac) = 16−2b′2
[(3A + 2b′M) +
√J + 12(M2 − b′AM)
]J = D2(4b′2 − 3) + (E2 − DE)(4b′2 − 12), M = N + b′D, N = a′ + b′(E − 2P0)
s
V
wr
4
sffp
P
Geotechnical Engineering 6 (2014) 13–25 17
r triaxial tests data on few cores. Magnitude of minimum princi-al stress can also be compared against leak-off test (LOT) data
f available. The logs can be calibrated, a good representative ofechanical properties and state of stresses in field. A review of the
rocess involved in construction of MEM is given below.
.1. Elastic properties
Elastic properties including Young’s modulus, shear and bulkoduli and Poisson’s ratio can be estimated from three logs of
ompression and shear sonic (Vp, Vs) and density (�) (Fjaer et al.,008). However, these elastic parameters are dynamic propertiesbtained from log data and need to be converted to static parame-ers using available correlations since they are usually larger thantatic properties due to small strain of logging device (Fjaer et al.,008). Numerous correlations based on various rock types haveeen proposed to convert dynamic to static properties, and one ofhem will be presented and used for the purpose of this study.
.2. Uniaxial compressive strength
Several correlations have been proposed based on studiesn different fields where the UCS of rocks has been correlated
ith different physical properties from logs or elastic propertiesntroduced in the previous subsection (Chang et al., 2006). One canse the correlation obtained in field which is closer to the fieldnder study to estimate the UCS of formations. The produced logan be calibrated against core test data if any available.
.3. Internal friction angle
There have been relatively few attempts to find relationshipsetween the angle of internal friction (ϕ) and geophysical mea-urements because of the fact that even weak rocks have relativelyigh ϕ, and there are relatively complex relationships between
and micro-mechanical features of rock such as rock’s stiffness,hich largely depends on cementation and porosity. Nonetheless,
ome experimental evidences show that shale with higher Young’sodulus generally tends to possess a higher ϕ (Lama and Vutukuri,
978). It is relatively straight forward to show that the value of ϕn wellbore stability analysis is much less significant than UCS.
Among various correlations, the correlation proposed by Plumb1994) was used in this study to determine the internal frictionngel of formations:
= 26.5 − 37.4(1 − NPHI − Vshale) + 62.1(1 − NPHI − Vshale)2 (39)
here NPHI is the notation of porosity, and Vshale is the volume ofhale obtained by
shale = GR − GRmin
GRmax − GRmin(40)
here GR is the value of gamma ray log, and GRmin and GRmax areespectively the minimum and maximum values of gamma ray log.
.4. Pore pressure
Eaton equation is conventionally used to estimate the pore pres-ure. While these equations were obtained from studies on shaleormations, they are applied to estimate pore pressure in otherormations due to the difficulty in direct measurement of pore
ressure in other formations. The Eaton equation is formulated aspg = OBG − (OBG − Ppn)(
NCT
t
)3
(41)
1 cs and
wsh(
o
8 R. Gholami et al. / Journal of Rock Mechani
here Ppg is the pore pressure gradient, OBG is the overburden
tress gradient, Ppn is the normal pore pressure (also known asydrostatic pressure), t is the compressional wave transit timealso called slowness), and NCT is the normal compacted trend linew
s
Well BScale : 1 : 1000DEPTH (4310.02MDB : DQ 10 (2)
GR
CGR0. 100.DEPTH
(M)
Compression Transit Time
DTCO (US/F)40. 120.
Shear Transit Time
DTSM (US/F)40. 300
4400
4500
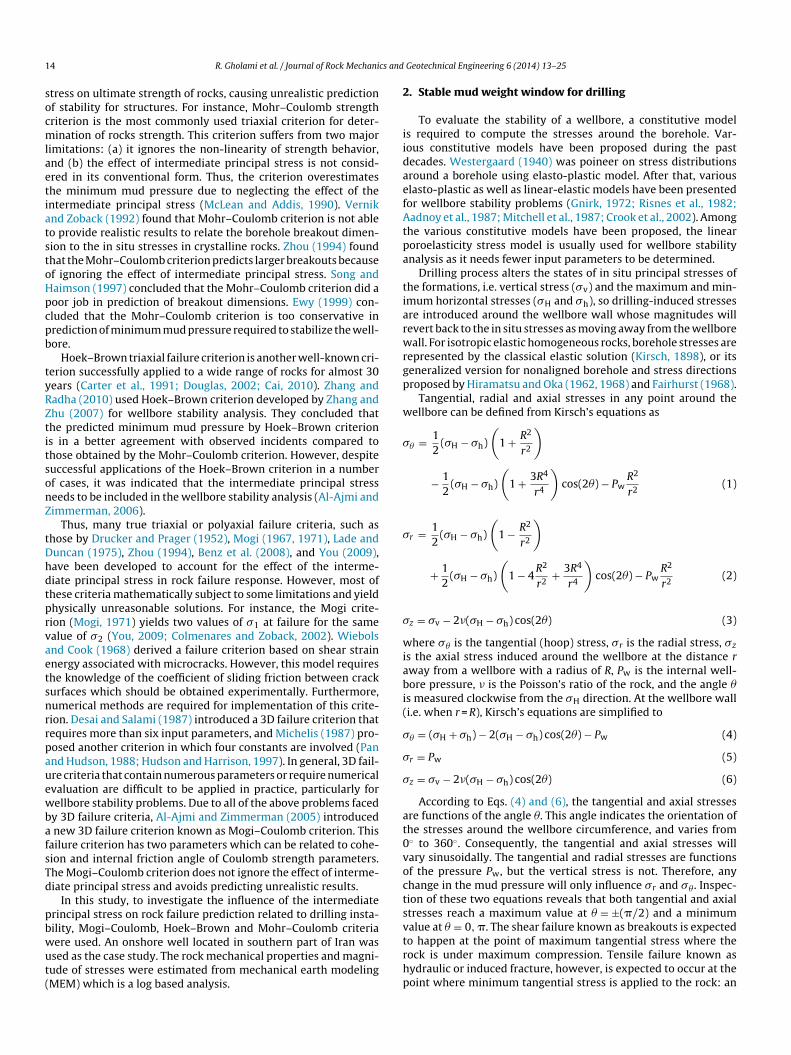
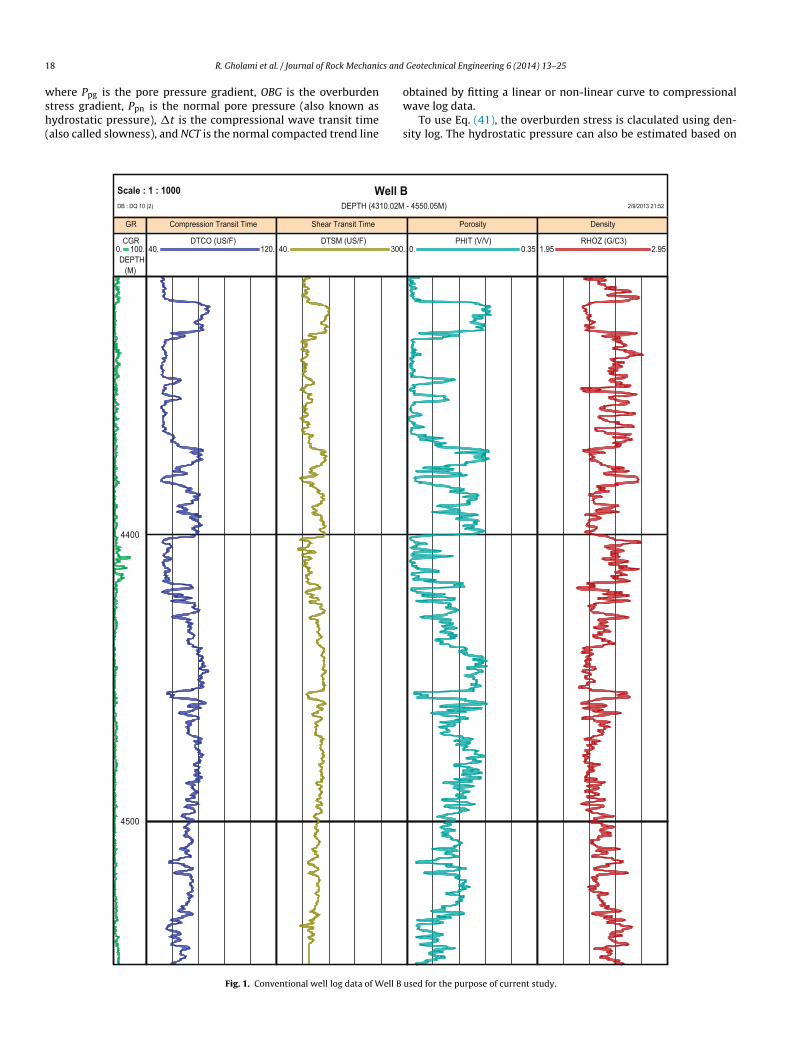
Fig. 1. Conventional well log data of Well B
Geotechnical Engineering 6 (2014) 13–25
btained by fitting a linear or non-linear curve to compressional
ave log data.To use Eq. (41), the overburden stress is claculated using den-ity log. The hydrostatic pressure can also be estimated based on
- 4550.05M) 2/9/2013 21:52
.
Porosity
PHIT (V/V)0. 0.35
Density
RHOZ (G/C3)1.95 2.95
used for the purpose of current study.

cs and
ade
4
ci
�
wgsiiiAea
mtezmF
�
�
lllpwtfmia
5
cdSdo
5
IIcwoBctoCctttmc
totGobbiloit
R. Gholami et al. / Journal of Rock Mechani
ssumation of brine density since after reaching an approximateepth of 90 m, brine is replaced with fresh water in subsurface lay-rs due to decomposition and solution of minerals (Zhang, 2011).
.5. In situ stresses
Vertical stress is assumed to be a principal stress, and is usuallyonsidered to be solely due to the weight of the overburden. Thats:
v = �gh (42)
here � represents the average mass density of the overlying rock, is the acceleration due to gravity, and h is the depth. If the den-ity varies with the depth, the vertical stress is determined byntegrating the densities of the overlaying rocks. At the depths ofnterest in petroleum exploration, the vertical stress has a gradientn the range of 18.1–22.6 kPa/m (0.8–1.0 psi/ft) (Fjaer et al., 2008).s the density log is usually acquired across the reservoir interval,xtrapolation of this log toward the surface is performed to haven estimation of densities for overlying layers.
In isotropically and tectonically relaxed areas, the minimum andaximum horizontal stresses are the same. However, the horizon-
al stresses are not equal where major faults or active tectonicsxist, which is likely the case. In this study, the poroelastic hori-ontal strain model (Fjaer et al., 2008) was used to determine theagnitudes of the minimum and maximum horizontal stresses.
ormulations of this model are expressed as
h = �
1 − �(�v − ˛Pp) + ˛Pp + Esta
1 − �2(εx + �εy) (43)
H = �
1 − �(�v − ˛Pp) + ˛Pp + Esta
1 − �2(εy + �εx) (44)
The minimum horizontal stress obtained from above formu-ae can be calibrated against direct measurements of extendedeak-off test (XLOT), standard LOT, or mini-frac test with a wire-ine tool (Yamamoto, 2003; Zoback et al., 2003). LOTs are typicallyerformed at each casing shoe to determine the maximum mudeight possible for the next drilling interval. These LOTs, if under-
aken correctly, are inexpensive but will provide calibration points
or log-derived minimum horizontal stress. In fact, this test is theost commonly used method to interpret and calibrate the min-mum stress magnitude (Baumgartner and Zoback, 1989; De Breend Walters, 1989; Sarda et al., 1992; Addis et al., 1998).
awsf
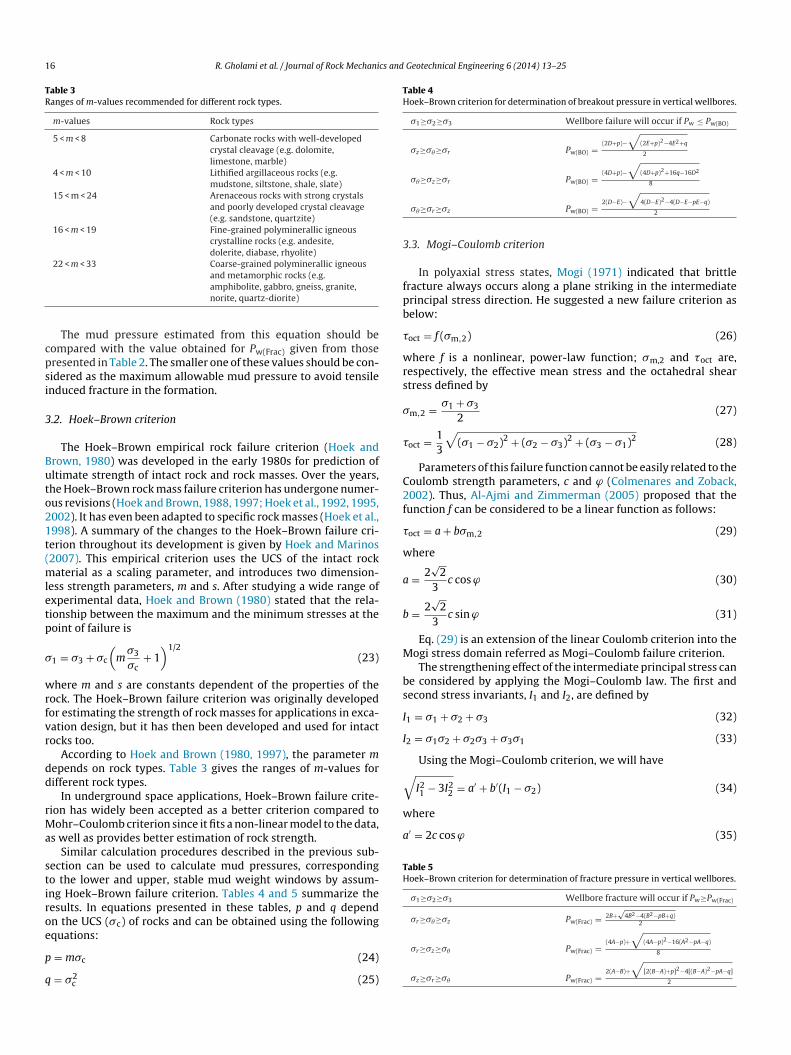
Fig. 2. View of bulk sample from Well B used to
Geotechnical Engineering 6 (2014) 13–25 19
. Case study
In this section, the data corresponding to a well is used toonstruct the MEM and then the stable mud weight window isetermined using three different failure criteria mentioned inection 3. This well, Well B, is an onshore well and due to confi-entiality purposes, we are unable to release the name of the fieldr well. However, this well is located in southern part of Iran.
.1. Geology of the study area
This study uses the data belonging to an oilfield located in theranian Province of Kuzestan, onshore of the Ahwaz region, near theran–Iraq frontier. The field is a north–south oriented gentle anti-line, located in the Dezful Embayment, which is a sector associatedith the closing of the Neo-Tethys Sea and the Tertiary formation
f the Zagros-Taurus Mountains. The oilfield is close west to theasrah area. The structures in the Basrah area consist of gentle anti-lines showing a north–south general trend which is the same tohis field. The trend of these anticlines follows the old north–southriented basement lines. The presence of Precambrian and earlyambrian salt in Northern Persian Gulf area and Saudi Arabia isonsidered as a reason to explain the possible origin of these struc-ures. However, the development of these anticlines seems relatedo the reactivation of basement faults which can be responsible forheir structural evolution. The structural growth of the field area
ay have already started during the Mesozoic Era or earlier andontinue through the time.
The Fahliyan formation is well exposed in the Zagros Moun-ains in Fars Province (James and Wynd, 1965). At the same timef the sedimentation of the Fahliyan, in the area located betweenhe oilfield and the Khuzestan Province, the intra-shelf basin of thearau formation takes place. The current oilfield area at the timef the Fahliyan sedimentation must belong to an articulate car-onate ramp complex, partly controlled by local tectonics, partlyy sea level changes, probably limited eastward by a more subsid-
ng area that has undergone a deeper sedimentation. Argillaceousimestones and shales of deep environment are also developed inffshore Kuwait, suggesting that this area belongs to the samentra-shelf basin. The sedimentation of these units is related tohe significant sea level rise that started during the late Tithonian
nd continued to the early Berriasian (Sadooni, 1993). The shallowater sequences of Fahliyan and equivalent units of northern Per-ian Gulf underlay the shale and bioclastic limestone of the Ratawiormation.
acquire plugs for rock mechanical tests.
2 cs and
5
s
0 R. Gholami et al. / Journal of Rock Mechani
.2. Onshore well
Complete well log datasets, including compressional and shearonic log, density log, neutron porosity log, caliper log as well as
rwbp
Well BScale : 1 : 1000DEPTH (4310.02MDB : DQ 10 (2 )
GR
CGR0. 100.DEPTH
(M)
Young's Modulu s
ESta (GPa)0. 60.
E_Core (GPa)0. 60.
Poissons' Ratio
Poisson's Rati ()0. 0.5
4400
4500
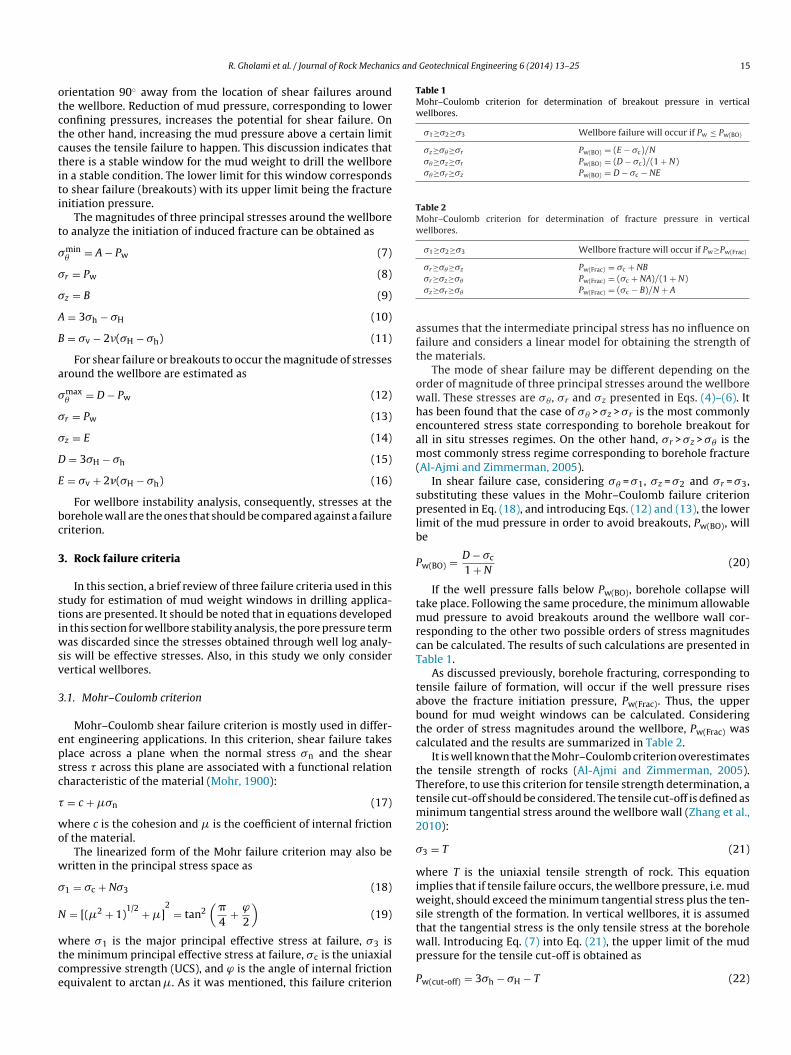
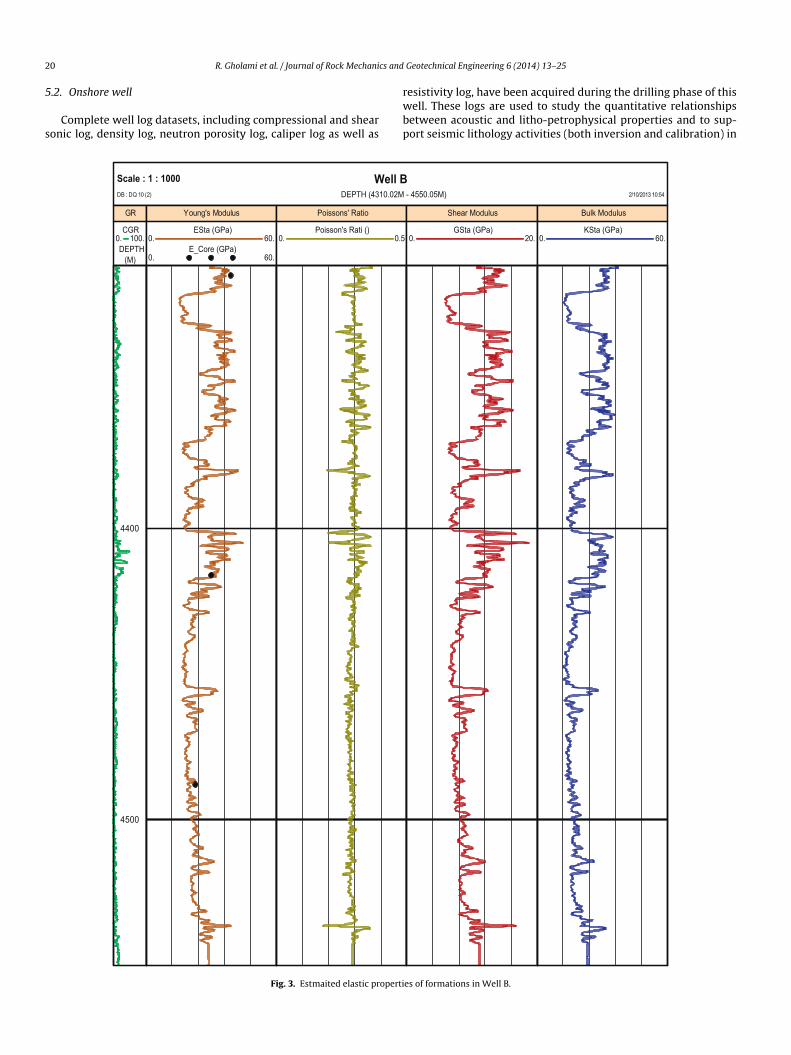
Fig. 3. Estmaited elastic properti
Geotechnical Engineering 6 (2014) 13–25
esistivity log, have been acquired during the drilling phase of thisell. These logs are used to study the quantitative relationships
etween acoustic and litho-petrophysical properties and to sup-ort seismic lithology activities (both inversion and calibration) in
- 4550.05M) 2/10/2013 10:54
Shear Modulus
GSta (GPa)0. 20.
Bulk Modulus
KSta (GPa)0. 60.
es of formations in Well B.
cs and
fiiwltigstl
hcsbt
5
tmd
uva
wtibtr(
ba
�
tp1rdtc
C
wLto
wwud
(mwFiUtivsis
as
R. Gholami et al. / Journal of Rock Mechani
eld. At the same time, a set of acoustic and petrophysical curves,ncluding the generated synthetic seismograms, is used to correlate
ell and seismic information. However, in this study, we used theseogs to estimate the optimum safe mud window for drilling wells inhis field using MEM. Fig. 1 shows the conventional well logs usedn this study. In this figure, the first track shows the depth and theamma ray (GR) log. The second and third tracks include compres-ion (DTCO) and shear (DTSM) sonic logs, respectively. These arehe inverse of velocities. Total porosity (PHIT) and density (RHOZ)ogs are presented in the last two tracks.
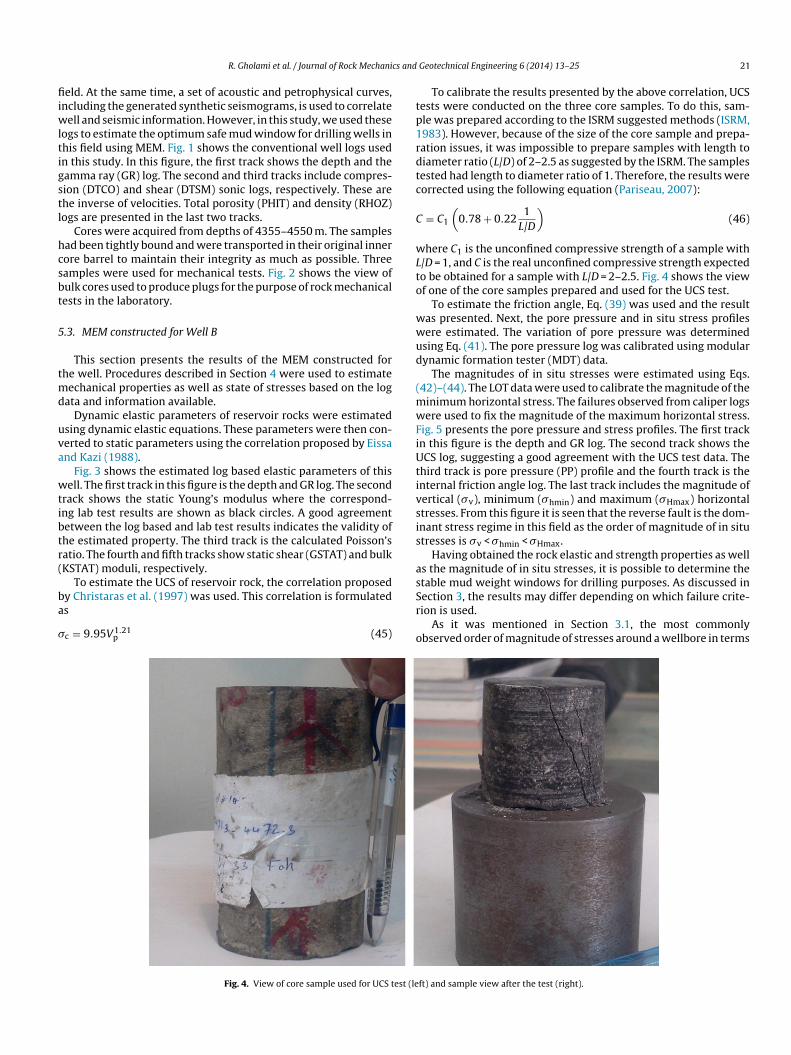
Cores were acquired from depths of 4355–4550 m. The samplesad been tightly bound and were transported in their original innerore barrel to maintain their integrity as much as possible. Threeamples were used for mechanical tests. Fig. 2 shows the view ofulk cores used to produce plugs for the purpose of rock mechanicalests in the laboratory.
.3. MEM constructed for Well B
This section presents the results of the MEM constructed forhe well. Procedures described in Section 4 were used to estimate
echanical properties as well as state of stresses based on the logata and information available.
Dynamic elastic parameters of reservoir rocks were estimatedsing dynamic elastic equations. These parameters were then con-erted to static parameters using the correlation proposed by Eissand Kazi (1988).
Fig. 3 shows the estimated log based elastic parameters of thisell. The first track in this figure is the depth and GR log. The second
rack shows the static Young’s modulus where the correspond-ng lab test results are shown as black circles. A good agreementetween the log based and lab test results indicates the validity ofhe estimated property. The third track is the calculated Poisson’satio. The fourth and fifth tracks show static shear (GSTAT) and bulkKSTAT) moduli, respectively.
To estimate the UCS of reservoir rock, the correlation proposed
y Christaras et al. (1997) was used. This correlation is formulatedsc = 9.95V1.21p (45)
Sr
o
Fig. 4. View of core sample used for UCS test (le
Geotechnical Engineering 6 (2014) 13–25 21
To calibrate the results presented by the above correlation, UCSests were conducted on the three core samples. To do this, sam-le was prepared according to the ISRM suggested methods (ISRM,983). However, because of the size of the core sample and prepa-ation issues, it was impossible to prepare samples with length toiameter ratio (L/D) of 2–2.5 as suggested by the ISRM. The samplesested had length to diameter ratio of 1. Therefore, the results wereorrected using the following equation (Pariseau, 2007):
= C1
(0.78 + 0.22
1L/D
)(46)
here C1 is the unconfined compressive strength of a sample with/D = 1, and C is the real unconfined compressive strength expectedo be obtained for a sample with L/D = 2–2.5. Fig. 4 shows the viewf one of the core samples prepared and used for the UCS test.
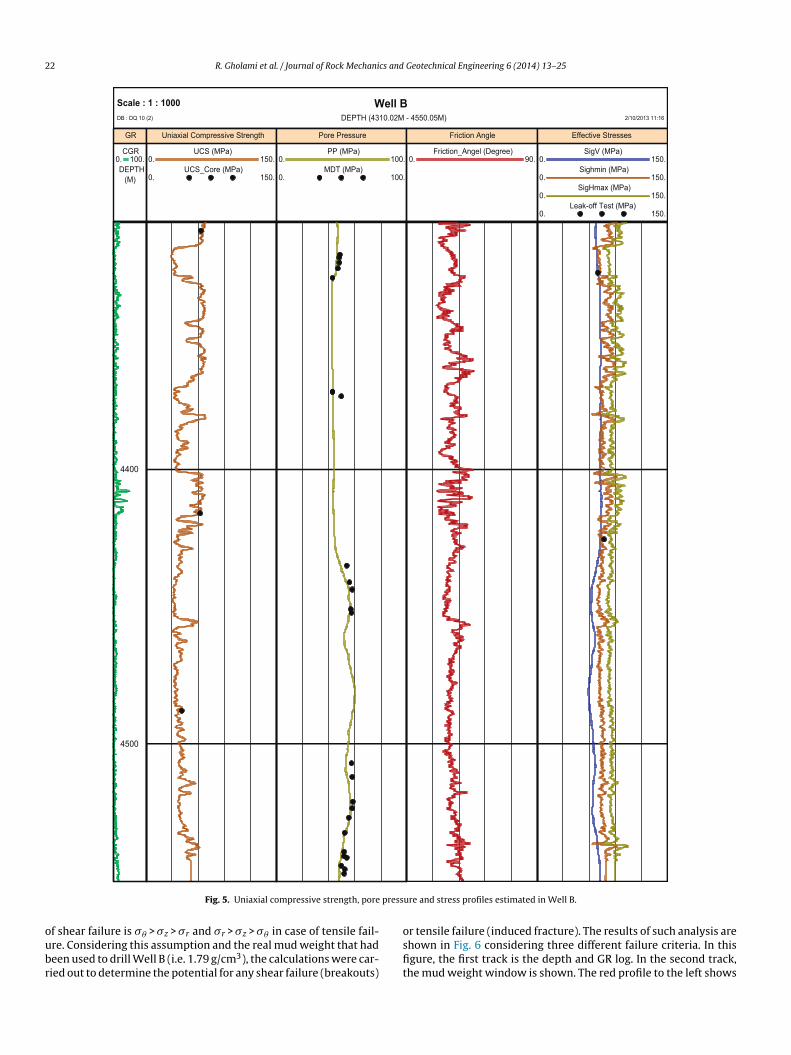
To estimate the friction angle, Eq. (39) was used and the resultas presented. Next, the pore pressure and in situ stress profilesere estimated. The variation of pore pressure was determinedsing Eq. (41). The pore pressure log was calibrated using modularynamic formation tester (MDT) data.
The magnitudes of in situ stresses were estimated using Eqs.42)–(44). The LOT data were used to calibrate the magnitude of the
inimum horizontal stress. The failures observed from caliper logsere used to fix the magnitude of the maximum horizontal stress.
ig. 5 presents the pore pressure and stress profiles. The first trackn this figure is the depth and GR log. The second track shows theCS log, suggesting a good agreement with the UCS test data. The
hird track is pore pressure (PP) profile and the fourth track is thenternal friction angle log. The last track includes the magnitude ofertical (�v), minimum (�hmin) and maximum (�Hmax) horizontaltresses. From this figure it is seen that the reverse fault is the dom-nant stress regime in this field as the order of magnitude of in situtresses is �v < �hmin < �Hmax.
Having obtained the rock elastic and strength properties as wells the magnitude of in situ stresses, it is possible to determine thetable mud weight windows for drilling purposes. As discussed in
ection 3, the results may differ depending on which failure crite-ion is used.As it was mentioned in Section 3.1, the most commonlybserved order of magnitude of stresses around a wellbore in terms
ft) and sample view after the test (right).
22 R. Gholami et al. / Journal of Rock Mechanics and Geotechnical Engineering 6 (2014) 13–25
Well BScale : 1 : 1000DEPTH (4310.02M - 4550.05M) 2/10/2013 11:16DB : DQ 10 (2)
GR
CGR0. 100.DEPTH
(M)
Uniaxial Compressive Strength
UCS (MPa)0. 150.
UCS_Core (MPa)0. 150.
Pore Pressure
PP (MPa)0. 100.
MDT (MPa)0. 100.
Friction Angle
Friction_Angel (Degree)0. 90.
Effective Stresses
SigV (MPa)0. 150.
Sighmin (MPa)0. 150.
SigHmax (MPa)0. 150.
Leak-off Test (MPa)0. 150.
4400
4500
press
oubr
o
Fig. 5. Uniaxial compressive strength, pore
f shear failure is � > � > � and � > � > � in case of tensile fail-
� z r r z �re. Considering this assumption and the real mud weight that hadeen used to drill Well B (i.e. 1.79 g/cm3), the calculations were car-ied out to determine the potential for any shear failure (breakouts)
sfit
ure and stress profiles estimated in Well B.
r tensile failure (induced fracture). The results of such analysis are
hown in Fig. 6 considering three different failure criteria. In thisgure, the first track is the depth and GR log. In the second track,he mud weight window is shown. The red profile to the left shows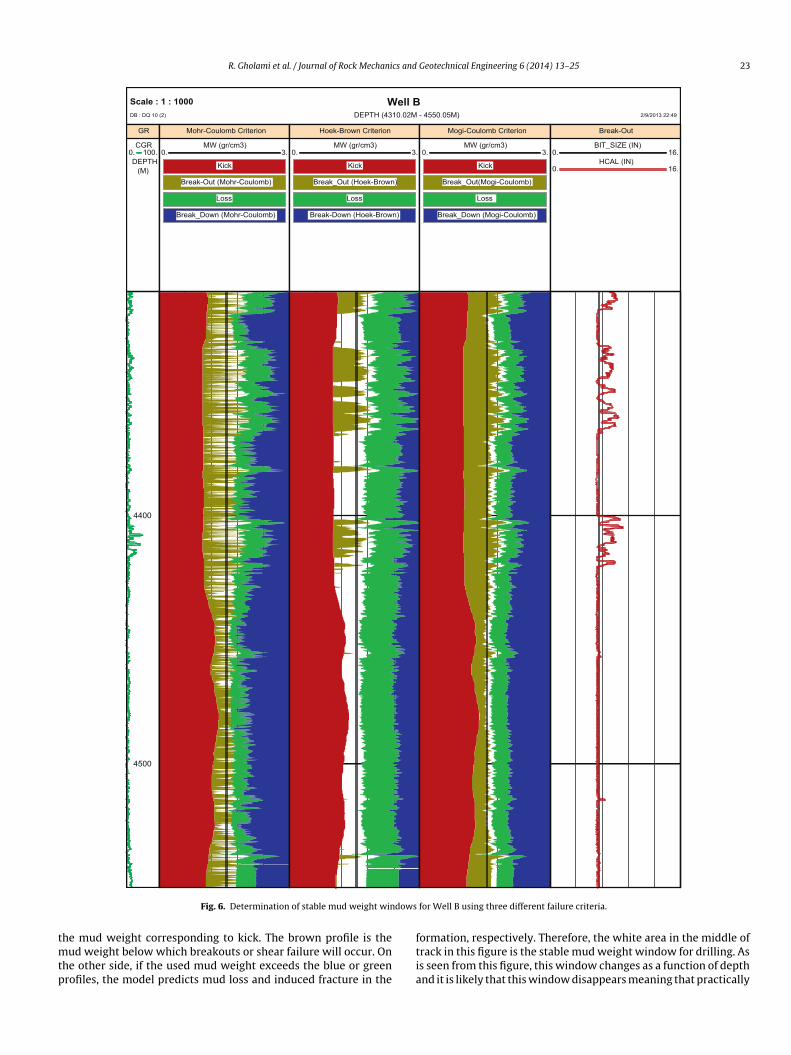
R. Gholami et al. / Journal of Rock Mechanics and Geotechnical Engineering 6 (2014) 13–25 23
Well BScale : 1 : 1000DEPTH (4310.02M - 4550.05M) 2/9/2013 22:49DB : DQ 10 (2)
GR
CGR0. 100.DEPTH
(M)
Mohr-Coulomb Criterion
MW (gr/cm3)0. 3.
Kick
Break-Out (Mohr-Coulomb)
Loss
Break_Down (Mohr-Coulomb)
Hoek-Brown Criterion
MW (gr/cm3)0. 3.
Kick
Break_Out (Hoek-Brown)
Loss
Break-Down (Hoek-Brown)
Mogi-Coulomb Criterion
MW (gr/cm3)0. 3.
Kick
Break_Out(Mogi-Coulomb)
Loss
Break_Down (Mogi-Coulomb)
Break-Out
BIT_SIZE (IN)0. 16.
HCAL (IN)0. 16.
4400
4500
dows
tmtp
Fig. 6. Determination of stable mud weight win
he mud weight corresponding to kick. The brown profile is theud weight below which breakouts or shear failure will occur. On
he other side, if the used mud weight exceeds the blue or greenrofiles, the model predicts mud loss and induced fracture in the
ftia
for Well B using three different failure criteria.
ormation, respectively. Therefore, the white area in the middle ofrack in this figure is the stable mud weight window for drilling. Ass seen from this figure, this window changes as a function of depthnd it is likely that this window disappears meaning that practically

2 cs and
tatfmiiisa
awbdciwtts
6
ufupptMfmocaMco
C
R
A
A
A
A
B
B
B
B
B
C
C
C
C
C
C
C
D
D
D
D
D
E
E
F
F
F
FG
G
H
H
H
HH
H
H
H
H
4 R. Gholami et al. / Journal of Rock Mechani
here is no safe window to drill so the drill should take actions suchs excessive hole cleaning when drilling in this zone. In this paper,he conclusion is different predictions obtained when using dif-erent failure criteria to determine the stable windows. In fact, a
odel which provides the most comparable prediction with real-ty is the most reliable model. The observation regarding wellborenstability or failure during drilling is captured using caliper logs ormage logs such as FMI. From the caliper logs shown in this figure,evere breakouts are observed with the intervals of 4306–4314 mnd 4322–4358 m as well as 4400–4421 m.
The Mohr–Coulomb criterion overestimates the rock strengthnd results in a larger value for the lower bound of the stable mudeight windows compared to other two failure criteria. This could
e linked to the fact that in this criterion, the effect of the interme-iate principal stress is ignored. Hoek–Brown and Mogi–Coulombriteria predict the breakouts observed from caliper data more real-stically; however, the latter criterion appears to give a better match
ith the observed failures from calipers. Thus, Mogi–Coulomb cri-erion perhaps is a better failure criterion to be considered forhis application as it considers the effect of intermediate principaltress.
. Conclusions
This study aimed at comparing the applicability of three fail-re criteria of Mohr–Coulomb, Hoek–Brown and Mogi–Coulombor prediction of rock failures during drilling a wellbore. The MEMsed to estimate continuous profiles of formations’ mechanicalroperties and the state of in situ stresses is found to be a veryractical and reliable tool. It was seen how the rock mechanicalest data as well as field test data would help in calibration of the
EM. Determination of stable mud weight windows presentedor two wells indicated that Mohr–Coulomb criterion overesti-
ates the predicted mud weight for safe drilling. The resultsbtained from Mogi–Coulomb failure criterion are found to be inloser agreement with field observation compared to Hoek–Brownnd Mohr–Coulomb criteria. This was related to the fact thatogi–Coulomb criterion considers the effect of intermediate prin-
ipal stress on failure prediction and this is a better representationf failure occurring in real situation.
onflicts of interest
There are no known conflicts of interest.
eferences
adnoy BS, Rogaland U, Chenevert ME. Stability of highly inclined boreholes. SPEDrilling Engineering 1987;2(4):364–74.
ddis MA, Hanssen TH, Yassir N, Willoughby DR, Enever J. A comparison of leak-off test and extended leak-off test data for stress estimation. In: ProceedingsSPE/ISRM Eurock 98; 1998. p. 131–40.
l-Ajmi AM, Zimmerman RW. Relationship between the Mogi and the Coulombfailure criteria. International Journal of Rock Mechanics and Mining Sciences2005;42(3):431–9.
l-Ajmi AM, Zimmerman RW. Stability analysis of vertical boreholes using theMogi–Coulomb failure criterion. International Journal of Rock Mechanics andMining Sciences 2006;43(8):1200–11.
aumgartner J, Zoback MD. Interpretation of hydraulic fracturing pressuretime records using interactive analysis methods. International Journalof Rock Mechanics and Mining Sciences and Geomechanics Abstracts1989;26(6):461–9.
ell JS. Practical methods for estimating in situ stresses for borehole stability appli-cations in sedimentary basins. Journal of Petroleum Science and Engineering2003;38(3):111–9.
enz T, Schwab R, Kauther RA, Vermeer PA. A Hoek–Brown criterion with intrinsicmaterial strength factorization. International Journal of Rock Mechanics andMining Sciences 2008;45(2):210–22.
ieniawski ZT. Estimating the strength of rock materials. Journal of the SouthernAfrican Institute of Mining and Metallurgy 1974;74(8):312–20.
H
H
Geotechnical Engineering 6 (2014) 13–25
radley WB. Failure of inclined boreholes. Journal of Energy Resources Technology,Transactions of ASME 1979;101:232–9.
ai M. Practical estimates of tensile strength and Hoek–Brown strength parame-ter mi of brittle rocks. Rock Mechanics and Rock Engineering 2010;43(2):167–84.
arter BJ, Scott Duncan EJ, Lajtai EZ. Fitting strength criteria to intact rock. Geotech-nical and Geological Engineering 1991;9(1):73–81.
hang C, Zoback MD, Khaksar A. Empirical relations between rock strength andphysical properties in sedimentary rocks. Journal of Petroleum Science andEngineering 2006;51(3/4):223–37.
hen X, Tan CP, Detournay C. A study on wellbore stability in fractured rock masseswith impact of mud infiltration. Journal of Petroleum Science and Engineering2003;38(3/4):145–54.
hristaras B, Mariolakos I, Fountoulis J, Athanasias S, Dimitriou A. Geotechnicalinput for the protection of some Macedonian Tombs in Northern Greece. In:The 4th international symposium on the conservation of monuments in theMediterranean Basin; 1997. p. 125–32.
olmenares LB, Zoback MD. A statistical evaluation of intact rock failurecriteria constrained by polyaxial test data for five different rocks. Inter-national Journal of Rock Mechanics and Mining Sciences 2002;39(6):695–729.
rook AJL, Yu JG, Willson SM. Development of an orthotropic 3D elastoplastic mate-rial model for shale. In: Proceedings of the SPE/ISRM rock mechanics conference;2002.
e Bree P, Walters JV. Micro/minifrac test procedures and interpretation for in situstress determination. International Journal of Rock Mechanics and Mining Sci-ences and Geomechanics Abstracts 1989;26(6):515–21.
esai CS, Salami MR. A constitutive model and associated testing for soft rock. Inter-national Journal of Rock Mechanics and Mining Sciences and GeomechanicsAbstracts 1987;24(5):299–307.
ing DY. Coupled simulation of near-wellbore and reservoir models. Journal ofPetroleum Science and Engineering 2011;76(1/2):21–36.
ouglas KJ. The shear strength of rock masses. Sydney: The University of New SouthWales; 2002 [PhD dissertation].
rucker DC, Prager W. Soil mechanics and plastic analysis or limit design. Quarterlyof Applied Mathematics 1952;10(2):157–65.
issa A, Kazi A. Relation between static and dynamic Young’s moduli of rocks. Inter-national Journal of Rock Mechanics and Mining Sciences and GeomechanicsAbstracts 1988;25(6):479–82.
wy RT. Wellbore-stability predictions by use of a modified Lade criterion. SPEDrilling & Completion 1999;14(2):85–91.
airhurst C. On the validity of the ‘Brazilian’ test for brittle materials. InternationalJournal of Rock Mechanics and Mining Sciences and Geomechanics Abstracts1964;1(4):535–46.
airhurst C. Methods of determining in situ rock stresses at great depths. Technicalreport TRI-68. US Army Corps of Engineers; 1968.
jaer E, Holt RM, Horsrud P, Raaen AM, Risnes R. Petroleum related rock mechanics.2nd ed. Amsterdam, Netherlands: Elsevier; 2008.
ranklin JA. Triaxial strength of rock material. Rock Mechanics 1971;3:86–98.entzis T, Deisman N, Chalaturnyk RJ. A method to predict geomechanical properties
and model well stability in horizontal boreholes. International Journal of CoalGeology 2009;78(2):149–60.
nirk PF. The mechanical behavior of uncased wellbores situated in elastic/plasticmedia under hydrostatic stress. Society of Petroleum Engineers Journal1972;12(1):49–59.
iramatsu Y, Oka Y. Stress around a shaft or level excavated in ground with athree-dimensional stress state. Memoirs of the Faculty of Engineering, KyotoUniversity 1962;24:56–76.
iramatsu Y, Oka Y. Determination of the stress in rock unaffected byboreholes or drifts, from measured strains or deformations. International Jour-nal of Rock Mechanics and Mining Sciences and Geomechanics Abstracts1968;5(6):337–53.
obbs DW. The strength and the stress–strain characteristics of coal in triaxialcompression. Journal of Geology 1964;72(2):214–31.
oek E, Brown ET. Underground excavations in rock. London: E & FN Spon; 1980.oek E, Brown ET. The Hoek–Brown failure criterion—a 1988 update. In: Curran
JC, editor. Proceedings of the 15th Canadian rock mechanics symposium, rockengineering for underground excavations. Toronto: University of Toronto; 1988.p. 31–8.
oek E, Brown ET. Practical estimates or rock mass strength. International Journalof Rock Mechanics and Mining Sciences 1997;34(8):1165–86.
oek E, Carranza-Torres CT, Corkum B. Hoek–Brown failure criterion—2002 edition.In: Proceedings of the 5th North American rock mechanics symposium; 2002.p. 267–73.
oek E, Kaiser PK, Bawden WF. Support of underground excavations in hard rock.Rotterdam: A.A. Balkema; 1995.
oek E, Marinos P, Benissi M. Applicability of the geological strength index(GSI) classification for very weak and sheared rock masses. The case of theAthens Schist formation. Bulletin of Engineering Geology and the Environment1998;57(2):151–60.
oek E, Marinos P. A brief history of the development of the Hoek–Brown failure
criterion; 2007 http://www.rocscience.com/hoek/references/H2007.pdfoek E, Wood D, Shah S. A modified Hoek–Brown failure criterion for jointed rockmasses. In: Hudson JA, editor. Proceedings of the international ISRM symposiumon rock characterization. London: British Geological Society; 1992. p. 209–14.
cs and
H
I
J
J
K
L
L
M
M
M
M
M
M
M
P
P
P
R
R
R
S
S
S
S
V
W
W
Y
Y
Y
Z
Z
Z
Z
Z
Z
R. Gholami et al. / Journal of Rock Mechani
udson JA, Harrison JP. Engineering rock mechanics: an introduction to the princi-ples. Oxford: Pergamon; 1997.
SRM. Suggested methods for determining the strength of rock materials in triax-ial compression: revised version. International Journal of Rock Mechanics andMining Sciences and Geomechanics Abstracts 1983;20(6):285–90.
ames GA, Wynd JG. Stratigraphic nomenclature of the Iranian oil consortium agree-ment area. AAPG Bulletin 1965;71.
ohnston IW. Strength of intact geomechanical materials. Journal of GeotechnicalEngineering 1985;111(6):730–49.
irsch EG. Die Theorieder Elastizit at unddie Bedurfnisse der Festigkeitslehre. Z VerDtsch Ing 1898;42(29):797–807.
ade P, Duncan J. Elasto-plastic stress–strain theory for cohesionless soil. Journal ofthe Geotechnical Engineering Division, ASCE 1975;101(10):1037–53.
ama RD, Vutukuri VS. Handbook on mechanical properties of rocks. Clausthal,Germany: Trans. Tech. Publications; 1978.
cLean MR, Addis MA. Wellbore stability: the effect of strength criteria on mudweight recommendations. In: Proceedings of the 65th annual technical confer-ence and exhibition of SPE. New Orleans: SPE; 1990.
ichelis P. True triaxial yielding and hardening of rock. Journal of the GeotechnicalEngineering Division, ASCE 1987;113(6):616–35.
itchell RF, Goodman MA, Wood ET. Borehole stresses: plasticity and the drilledhole effect. In: Proceedings of IADC/SPE drilling conference; 1987.
ogi K. Effect of the intermediate principal stress on rock failure. Journal of Geo-physical Research 1967;72(20):5117–31.
ogi K. Fracture and flow of rocks under high triaxial compression. Journal of Geo-physical Research 1971;76(5):1255–69.
ohr O. Welcheumstande bedingendieelastizita tsgrenze unddenbruch eines mate-rials? VDI-Zeitschrift 1900;44:1524.
urrell SAF. The effect of triaxial stress systems on the strength of rock at atmo-spheric temperature. Geophysical Journal of the Royal Astronomical Society1965;10(3):231–81.
an XD, Hudson JA. A simplified three dimensional Hoek–Brown yield criterion. In:Romana M, editor. Rock mechanics and power, plants. Rotterdam: A.A. Balkema;1988. p. 95–103.
ariseau GW. Design analysis in rock mechanics. Leiden, Netherlands: Taylor &Fransis; 2007.
lumb RA. Influence of composition and texture on the failure properties of clasticrocks. In: Eurocks 94, rock mechanics in petroleum engineering conference;1994. p. 13–20.
amamurthy T, Rao GV, Rao KS. A strength criterion for rocks. In: Proceedings of theIndian geotechnical conference, vol. 1; 1985. p. 59–64.
asouli V, Palllikathekathil ZJ, Mawuli E. The influence of perturbed stresses
near faults on drilling strategy: a case study in Blacktip field, NorthAustralia. Journal of Petroleum Science and Engineering 2011;76(1/2):37–50.isnes R, Bratli RK, Horsrud P. Sand stresses around a wellbore. Society of PetroleumEngineers Journal 1982;22(6):883–98.
Z
Z
Geotechnical Engineering 6 (2014) 13–25 25
adooni NF. Stratigraphic sequence, MICROFACIES, and petroleum prospect of theYamama formation, lower cretaceous, southern Iraq. AAPG Bulletin 1993;77.
arda JP, Detienne JL, Lassus-Dessus J. Recommendations for microfracturing imple-mentations and the interpretation of micro- and pre-fracturing. Oil and GasScience and Technology—Revue d’IFP 1992;47(2):179–204.
heorey PR, Biswas AK, Choubey VD. An empirical failure criterion for rocks andjointed rock masses. Engineering Geology 1989;26(2):141–59.
ong I, Haimson BC. Polyaxial strength criteria and their use in estimating in situstress magnitudes from borehole breakout dimensions. International Journal ofRock Mechanics and Mining Sciences 1997;34(3/4), 116.e1–16.
ernik L, Zoback MD. Estimation of maximum horizontal principal stress magnitudefrom stress-induced well bore breakouts in the Cajon Pass scientific researchborehole. Journal of Geophysical Research 1992;97(B4):5109–19.
estergaard HM. Plastic state of stress around a deep well. Journal of the BostonSociety of Civil Engineers 1940;27:387–91.
iebols GA, Cook NGW. An energy criterion for the strength of rock in polyaxialcompression. International Journal of Rock Mechanics and Mining Sciences andGeomechanics Abstracts 1968;5(6):529–49.
amamoto K. Implementation of the extended leak-off test in deep wells in Japan.In: Sugawra K, editor. Proceedings of the 3rd international symposium on rockstress. Rotterdam: A.A. Balkema; 2003. p. 225–9.
ou MQ. True-triaxial strength criteria for rock. International Journal of RockMechanics and Mining Sciences 2009;46(1):115–27.
udhbir RK, Lemanza W, Prinzl F. An empirical failure criterion for rock masses. In:Proceedings of the 5th ISRM congress. Rotterdam: A.A. Balkema; 1983. p. B1–8.
hang J, Bai M, Roegiers JC. Dual-porosity poroelastic analyses of wellborestability. International Journal of Rock Mechanics and Mining Sciences2003;40(4):473–83.
hang J, Lang J, Standifird W. Stress, porosity, and failure-dependent compressionaland shear velocity ratio and its application to wellbore stability. Journal ofPetroleum Science and Engineering 2009;69(3/4):193–202.
hang J. Pore pressure prediction from well logs: methods, modifications, and newapproaches. Earth-Science Reviews 2011;108(1/2):50–63.
hang L, Cao P, Radha KC. Evaluation of rock strength criteria for wellbore sta-bility analysis. International Journal of Rock Mechanics and Mining Sciences2010;47(8):1304–16.
hang L, Radha KC. Stability analysis of vertical boreholes using a three-dimensionalHoek–Brown strength criterion. In: Proceedings of the GeoFlorida 2010; 2010.p. 283–92.
hang L, Zhu H. Three-dimensional Hoek–Brown strength criterion forrocks. Journal of Geotechnical and Geoenvironmental Engineering, ASCE2007;133(9):1128–35.
hou S. A program to model the initial shape and extent of borehole breakout.Computers and Geosciences 1994;20(7/8):1143–60.
oback MD, Barton CA, Brudy M, Castillo DA, Finkbeiner T, Grollimund BR, et al.Determination of stress orientation and magnitude in deep wells. InternationalJournal of Rock Mechanics and Mining Sciences 2003;40(7/8):1049–76.