journal of structural geology - … · 2 m.h. anders et al. / journal of structural geology xxx...
TRANSCRIPT
lable at ScienceDirect
Journal of Structural Geology xxx (2014) 1e18
Contents lists avai
Journal of Structural Geology
journal homepage: www.elsevier .com/locate/ jsg
Microfractures: A review
Mark H. Anders a, *, Stephen E. Laubach b, Christopher H. Scholz a
a Department of Earth and Environmental Sciences, Lamont-Doherty Earth Observatory of Columbia University, Palisades, NY 10964, USAb Bureau of Economic Geology, The University of Texas at Austin, Austin, TX 78713, USA
Keywords:FaultFluid-inclusion planesFractureMicrofracturesPaleostressScaling
* Corresponding author.E-mail addresses: [email protected] (M
beg.utexas.edu (S.E. Laubach).
http://dx.doi.org/10.1016/j.jsg.2014.05.0110191-8141/© 2014 The Authors. Published by Elsevier
Please cite this article in press as: Anders, Mj.jsg.2014.05.011
a b s t r a c t
Microfractures are small, high-aspect-ratio cracks in rock that result from application of differentialstresses. Although the term has been used to refer to larger features in the petroleum engineering andgeophysics literature, in geologic parlance the term refers to fractures visible only under magnification,having lengths of millimeters or less and widths generally less than 0.1 mm. Nevertheless, populations ofthese structures typically encompass a wide size range and in some cases they form the small-sizefraction of fracture arrays that include much larger factures. In geologic settings, microfracturescommonly form as Mode I (opening) fractures where the minimum principal stress exceeds the elastictensile strength creating a narrow opening displacement; in isotropic rocks such fractures mark theplane perpendicular to the least compressive principal stress during fracture growth. These planar orcurviplanar openings provide an opportunity for fluids and/or gases to enter the created cavity. Cementdeposits or crack closure may trap fluids or gases, leaving mineral precipitates and a track of enclosedfluids and gases. In transmitted light these precipitates frequently manifest as fluid-inclusion planes(FIPs). Cathodoluminescence (CL) images show that many are cement-filled microveins. Microfracturescan be used to assess the paleostress history or fluid movement history of a rock body. Also, becausesudden opening produces acoustic emissions, microfractures created in the laboratory can be used toassess the rock-failure process. Here we review recent discoveries made using microfractures, includingfracture patterns, strain, fracture growth and size-scaling, evolution of stresses around propagating faults(process zones), far-field tectonic stresses, and insights into the state of stress leading to earthquakes.
© 2014 The Authors. Published by Elsevier Ltd. This is an open access article under the CC BY-NC-SAlicense (http://creativecommons.org/licenses/by-nc-sa/3.0/).
1. Introduction
Microfractures are lens-shaped or tabular opening-mode (ModeI) high-aspect-ratio fractures with dimensions so small that theyusually require microscopy to detect. Microfractures can governphysical rock properties such as strength, elastic wave velocities,and permeability. As we describe below, microfractures are usefulin providing evidence for temperature of fracturing, fluid condi-tions, and timing. In sedimentary basins they provide key evidenceof the processes of compaction, consolidation, and the patterns offluid flow. Experimentally produced microfractures (microcracks)provide insight to the process of rock failure and the causes ofseismic anisotropy. Studies of microfracture orientations providecritical information on the growth and development of fault zones,the evolution of regional stress fields, and the earthquake cycle.
.H. Anders), steve.laubach@
Ltd. This is an open access article u
.H., et al., Microfractures: A re
Amicrofracture review by Kranz (1983) summarized a decade ofintense work, primarily in the laboratory, that revealed howmicrofractures govern physical rock properties such as strength,elastic wave velocities, and permeability. But major reviews of(macro) fracture growth and attributes from that time (e.g.,Hancock, 1985; Pollard and Aydin, 1988) largely or entirely ignoremicrofractures. Although experimental (and theoretical) workemphasized the role of microfractures (for example, as nucleationsites for larger fractures), microfractures were missing frommainstream accounts of fracture patterns, despite e as we will seee the existence of petrographic tools capable of detecting micro-fractures and an older (separate) literature that documented the co-existence of microfracture and macrofracture populations. Inretrospect, this circumstance may have resulted from the almostcomplete lack of microfractures associated with large, barrenopening-mode fractures formed near the Earth's surface (i.e.,joints), the principal focus of macrofracture studies from the 1960sto 1980s. But there is no evidence that such microfractures weresought; and their absence, which is probably significant, was notremarked. This lack of scrutiny suggests a gap in theories of fracture
nder the CC BY-NC-SA license (http://creativecommons.org/licenses/by-nc-sa/3.0/).
view, Journal of Structural Geology (2014), http://dx.doi.org/10.1016/
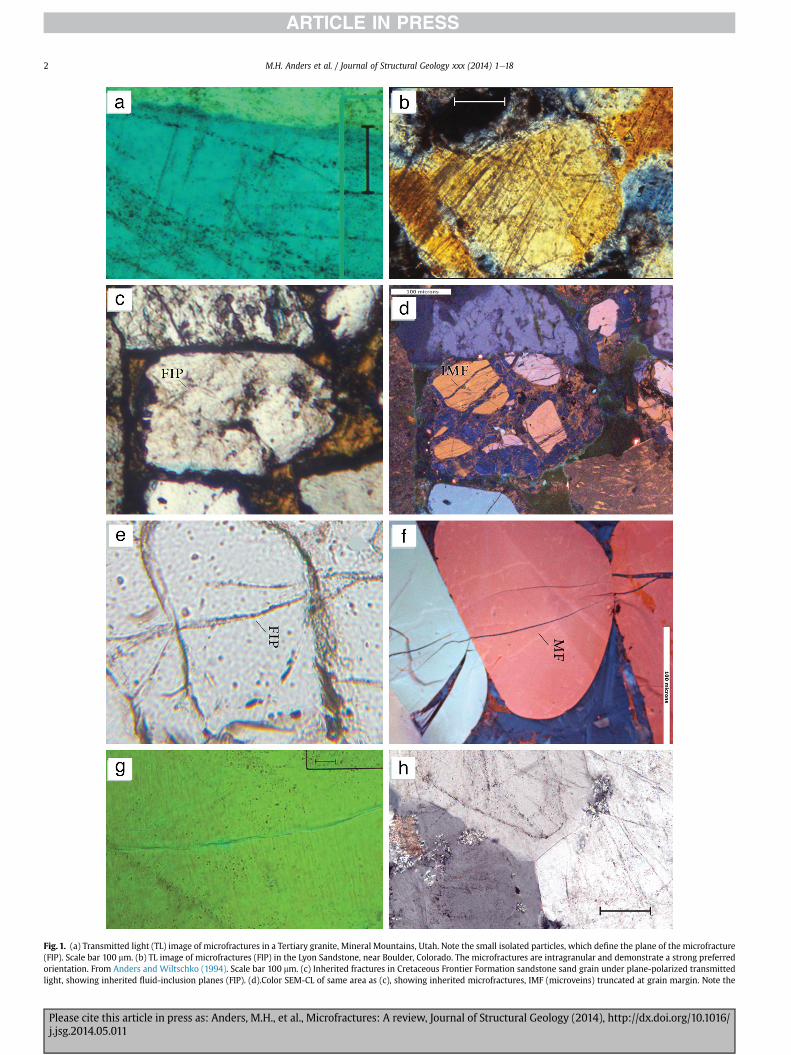
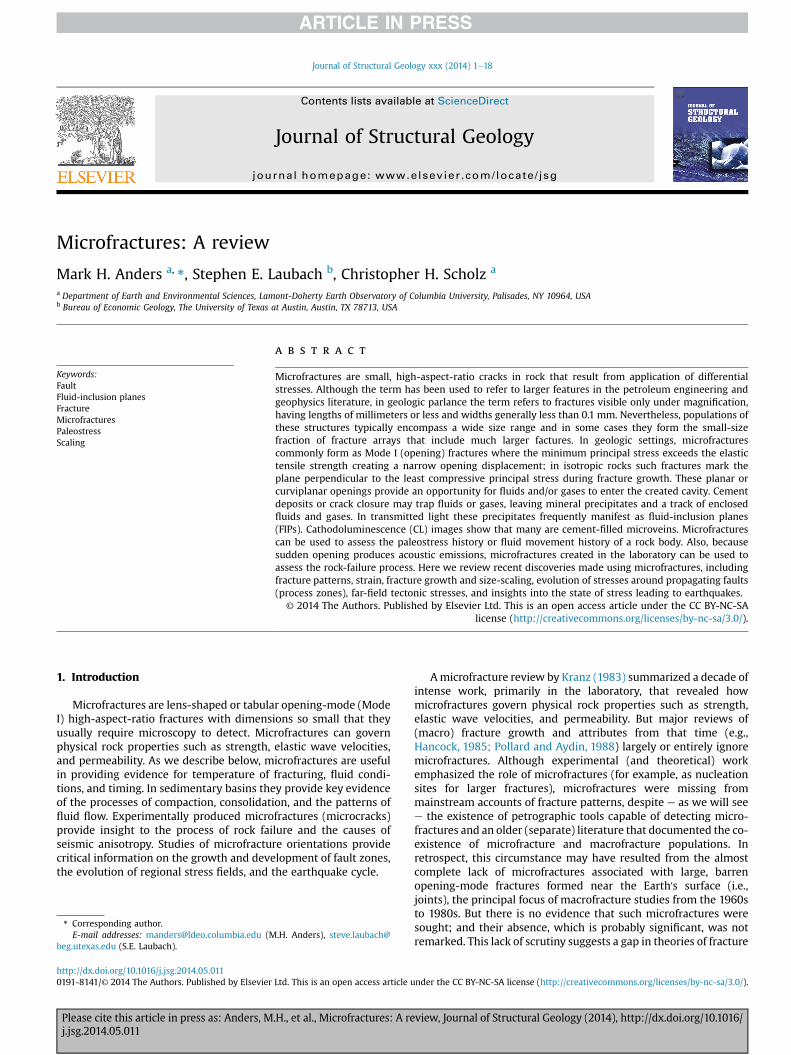
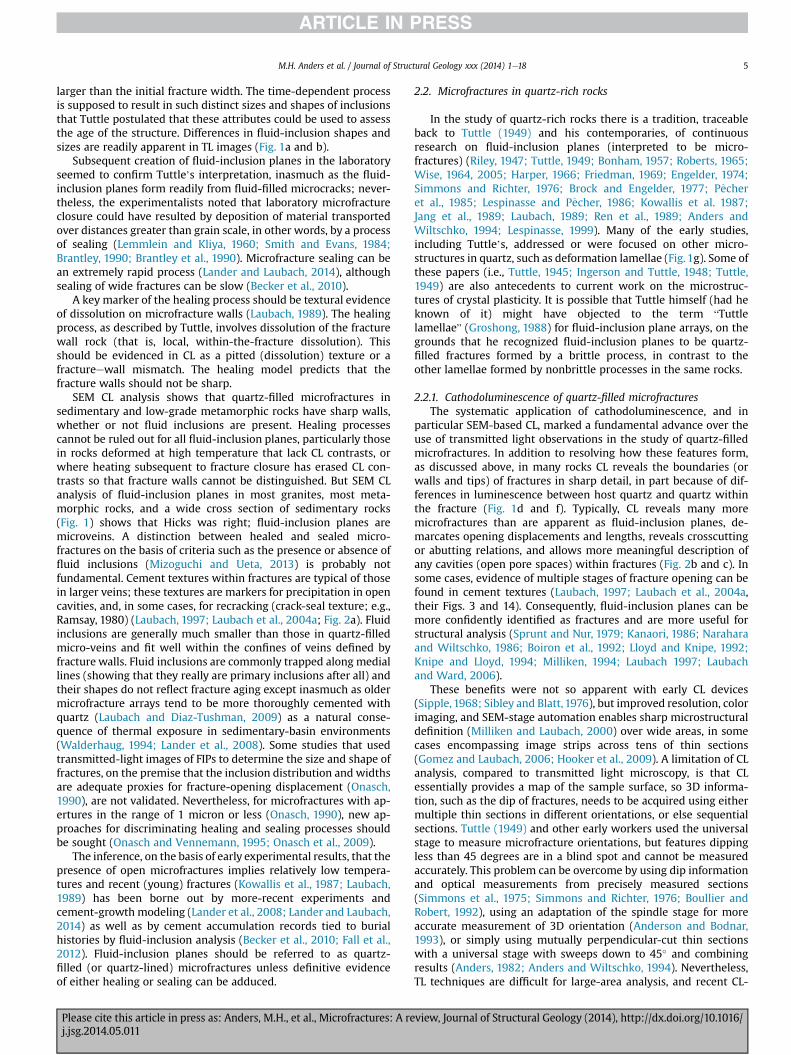
Fig. 1. (a) Transmitted light (TL) image of microfractures in a Tertiary granite, Mineral Mountains, Utah. Note the small isolated particles, which define the plane of the microfracture(FIP). Scale bar 100 mm. (b) TL image of microfractures (FIP) in the Lyon Sandstone, near Boulder, Colorado. The microfractures are intragranular and demonstrate a strong preferredorientation. From Anders and Wiltschko (1994). Scale bar 100 mm. (c) Inherited fractures in Cretaceous Frontier Formation sandstone sand grain under plane-polarized transmittedlight, showing inherited fluid-inclusion planes (FIP). (d).Color SEM-CL of same area as (c), showing inherited microfractures, IMF (microveins) truncated at grain margin. Note the
M.H. Anders et al. / Journal of Structural Geology xxx (2014) 1e182
Please cite this article in press as: Anders, M.H., et al., Microfractures: A review, Journal of Structural Geology (2014), http://dx.doi.org/10.1016/j.jsg.2014.05.011
M.H. Anders et al. / Journal of Structural Geology xxx (2014) 1e18 3
growth. By the late 1980s a community of research on naturalmicrofractures existed, but these workers were already separatefrom the macrofractures/joints community.
Our aim here is to provide the historical context of microfractureresearch that can help guide future work and to provide com-mentary and examples that will direct the hitherto disparatecommunities studying microfractures to problems of common in-terest. We review recent discoveries made using microfractures,including fracture patterns, strain, fracture growth and size-scaling,evolution of stresses around propagating faults (process zones), far-field tectonic stresses, and insights from microfractures into thestate of stress leading to earthquakes.
2. Historical context
Systematic observation of natural microfractures can be dividedinto an era dominated by transmitted light (TL) microscopy from ca.1850 and an era after ca. 1960 when scanning electron microscopy(SEM) became a widespread tool. Another milestone was theapplication of cold cathode cathodoluminescence (Sipple, 1968)and SEM-based cathodoluminescence (CL) (Pagel et al., 2000) to thestudy of sealed microfractures.
In the early days of transmitted light microscopy, naturalmicrofractures partly filled with mineral deposits were recognizedin quartz-rich rocks (Fig. 1a). Sorby (1858) correctly inferred thatalignments of minute inclusions in quartz-rich rocks are the relictsof small fractures. In a petrographic study of a conglomerate, Hicks(1884, p. 194) noted that “fracture-lines across the pebbles” wereidentifiable as “well-marked lines…formed in the presence ofabundant vapours.” He also noted that some “lines of fractures arealso traceable from one fragment to another by thin strings of thesesecondary minerals,” the first instance of the use of this basiccrosscutting relationship to show that fractures or fluid-inclusionplanes postdate the grains that contain them and are not featuresinherited from the source of the grain (Fig. 1b).
On scales visible to the unaided eye, inherited fractures areobvious, for example, to anyone observing veins in modern beachcobbles. So Hicks' comment likely reflects an appreciation thatfractures in clastic rocks can be inherited. But on the microscale insiliciclastic rocks, relationships like the abrupt termination of veinmaterial at rounded clast margins typically requires CL to detect(Fig. 1c and d; Laubach, 1997). Inherited fractures and inheritedstructural relations are, in fact, ubiquitous in sand grains and arereadily documented with SEM CL (e.g., Boggs and Krinsley, 2006, p.90). Particularly if coupled with inherited fluideinclusion assem-blage analysis, such microstructural indicators for paleotectonicsand provenance have potential that has been largely neglected(Hooker and Laubach, 2007), probably partly because of earlyproblems with color CL as a provenance indicator. But anotherreason may be a lack of appreciation within the provenance com-munity of the value of the structural information that can begleaned from the preserved crosscutting relations and otherinherited structural features.
Following up these initial microfracture descriptions, the field ofsandstone petrology has made productive use of microfractureobservations. Grain fracturing was reproduced in compaction ex-periments (Borg and Maxwell, 1956; Maxwell, 1960; Borg et al.,
crosscutting relationships. After Hooker and Laubach (2007); see Laubach (1997) for classificlight. (f) Color SEM-CL of same area of (e), microfractures (MF), quartz cement (blue; red), TulCounty, Oklahoma. Both (e and f) are cut normal to bedding and the right-hand side is up fimaging 2005.Fracture walls are sharp; there is no evidence of the local dissolution step. (gfaint, thin subparallel features with a preferred up/down orientation. Also, a small numberimage of grain overgrowths from the Cambrian Tapeats Sandstone in southern Nevada. Maindicating they are inherited (from Anders et al., 2013).
Please cite this article in press as: Anders, M.H., et al., Microfractures: A rej.jsg.2014.05.011
1960; Friedman, 1963; 1969) and explained using grain-scalemodels (Gallegher et al., 1974; Wong et al., 1992; David et al.,1994). The advent of high-resolution CL (e.g., Fig. 1e and f) revi-talized this research direction (Burley et al., 1989), helping toexplain compaction, pressure solution, and the location and con-trols on cement distribution (Milliken, 1994; Dickenson andMilliken, 1995; Milliken and Laubach, 2000; Mork and Moen,2007). CL revealed many more grain-contact microfractures thanwere visible using TL and showed that some features, such aslamellae and undulatory extinction and indented grains hithertoascribed to crystal plasticity or pressure solution, were the result ofmicrofracture, particle rotation, and quartz cementation (e.g.,Milliken and Laubach, 2000, their Figs. 3e6). Most of these studiesfocus on issues of diagenesis rather than of structure. But grain-fracture and cementation ideas and imaging techniques devel-oped in the sandstone diagenesis community are being applied todeformation bands where grain fracturing and concurrentcementation can occur (Milliken et al., 2005; Eichhubl et al., 2010)as well as to fault-rock studies (Fisher and Knipe, 1998; Fisher et al.,2003), as we discuss below.
Another closely related strand that can be traced back to earlytransmitted-light observations is the work within the fluid-inclusion community. Under transmitted light microscopy, somemicrofractures in quartz-rich rocks are marked by arrays of fluidinclusions (fluid-inclusion planes, FIPs) that can be analyzed asfluid-inclusion assemblages (Goldstein and Reynolds, 1994). Clas-sified as secondary inclusions because they supposedly postdatethe crystallization of the minerals that they crosscut, these featuresare widely used to recover temperature, pressure, salinity, andother compositional data (Roedder, 1984; Crawford, 1992). Fluid-inclusion-analysis methods have proven useful when adapted tostructural analysis needs (Anderson and Bodnar, 1993). But thiscommunity tends to focus on geochemical challenges posed by theuse of fluid inclusions, placing less emphasis on structural appli-cations. Nevertheless, there is strong and increasingly active use offluid-inclusion planes as structures and paleostress-direction in-dicators and as temperature and geochemical probes for unravelingfluid composition and migration/stagnation patterns in variousburial settings in the context of structure and tectonics (Batzle andSimmons, 1976; Pecher et al., 1985; Hay et al., 1988; Lespinasse andCathelineau, 1995; Meere, 1995; Evans, 1995; Boullier, 1999;Lespinasse, 1999; Lespinasse et al., 2005; Hilgers et al., 2006;Trav�e et al., 2007; Fischer et al., 2009; Laubach and Diaz-Tushman, 2009; Becker et al., 2010; Fall et al., 2012).
2.1. Healed versus sealed microfractures
Hicks (1884, p. 195) concluded that microfractures were “…
closed up by a secondary deposition of quartz”. In his interpreta-tion, the fluid-inclusion planes are merely small quartz-sealedveins, small versions of a type of structure familiar since the timeof Hutton (Lyell and Deshayes, 1830). The challenge, however, isthat under transmitted-light observation, fracture walls typicallyare invisible in microfractures filled mostly with quartz. In retro-spect, this absence of discernibility is the result of the accumulationof quartz deposits exhibiting crystallographic and optical continu-ity with the quartz substrate e the same process that makes the
ation criteria. (e) Transgranular fluid-inclusion plane (FIP), plane-polarized transmittedip Creek Sandstone, Ordovician Simpson Group, 4,085.5 m (13,404 ft) core depth, Gradyor both images. Adapted from R. Reed and S. Laubach, 1996, and R. Reed, unpublished) TL image of deformation lamellae from the same location as (a). The lamellae are theof FIP exist that dip at a low angle to the viewing direction in this photograph. (h) TLny of the microfractures stop at the dust lines that define the original grain boundary,
view, Journal of Structural Geology (2014), http://dx.doi.org/10.1016/
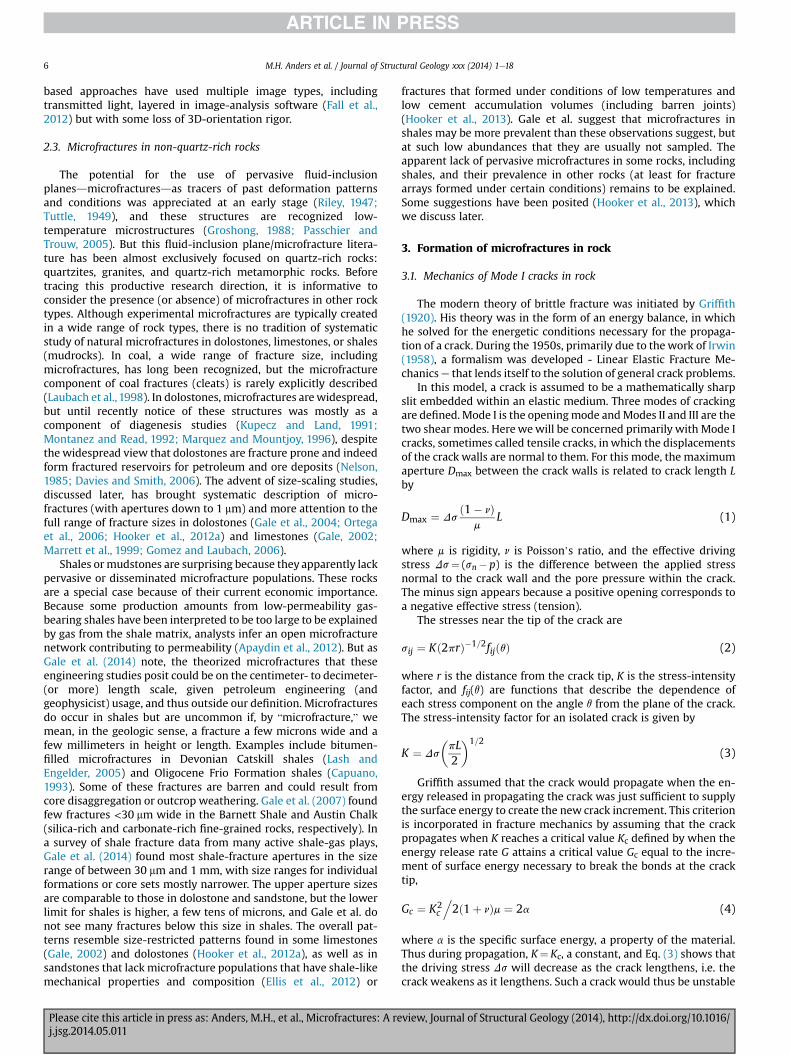
Fig. 2. (a) Crack-seal texture in microfractures. Panchromatic CL image, Pennsylvanian Pottsville Formation, Black Warrior Basin, Alabama, depth 1052.5 m. From Laubach et al.(2004a) (their Fig. 16b). (b) Crosscutting relations, sets FA, FB, and FCom [compaction]. (G) grain. (c) Microfractures aligned with macrofractures and crosscutting relations, setsFA, FD, Cambrian Eriboll Formation sandstone, from Laubach and Diaz-Tushman (2009), 2b and 2c are their Figs 5a and 4b. (P) indicates preserved fracture porosity. In (c), (B) is aquartz bridge partially filling a microfracture. SEM-CL images, sections parallel to bedding (plan view; N, north direction). In sandstones, microfractures filled with quartz typicallyhave lengths of a few to tens of millimeters and opening displacements (kinematic apertures) of 0.001 or less to 0.1 mm (Hooker et al., 2014). Width:length ratios (aspect ratios)vary considerably. (d) Microfractures (FIP) from a Tertiary Granite in the Mineral Mountains, west-central Utah, in transmitted light. Sample 200 m from the Cave Canyondetachment fault. The majority of microfractures are intragranular. Small tick marks are 100 mm. (e) Microfractures in the same granite as (d), located 12 m from the detachment.Note grain size reduction as the granite approaches the core of the fault. Scale bar is 360 mm. In transmitted light. (f). Microfractures (FIP) radiating from an impact point with anadjacent grain. Sample from the Fountain Formation near Boulder, Colorado. Scale bar is 100 mm. In transmitted light. From Anders and Wiltschko (1994).
M.H. Anders et al. / Journal of Structural Geology xxx (2014) 1e184
boundaries between detrital quartz grains and quartz overgrowthcements difficult to distinguish in many sandstones (Fig. 1h). Thusthe ambiguous appearance of fluid-inclusion planes permittedother interpretations. In granites, there was the possibility thatprimary crystallization played a role (Dale,1923), an explanation forsome microfractures borne out by subsequent work (e.g., Bouchezet al., 1992; Mancktelow and Pennacchioni, 2013).
Tuttle (1949) offered another explanatione crack healinge thatremains the standard explanation for fluid-inclusion planes(Groshong, 1988, p. 1333; Passchier and Trouw, 2005, p. 284), but,
Please cite this article in press as: Anders, M.H., et al., Microfractures: A rej.jsg.2014.05.011
as we will see, problems exist with this model. According to Tuttle,the starting point is a liquid-filled fracture. But the next step of thepostulated healing process involves local-scale (that is, within thefracture walls) dissolution, diffusive mass transfer, and nearbydendritic precipitation of quartz. The “process of solution anddeposition” results in large, thin, sheet like inclusions having anextremely irregular outline: “…continued differential solution anddeposition of silica gradually change the shape of the individualinclusions from thin sheets to more nearly equant bodies.” Even-tually individual inclusions grow, and they may have diameters
view, Journal of Structural Geology (2014), http://dx.doi.org/10.1016/
M.H. Anders et al. / Journal of Structural Geology xxx (2014) 1e18 5
larger than the initial fracture width. The time-dependent processis supposed to result in such distinct sizes and shapes of inclusionsthat Tuttle postulated that these attributes could be used to assessthe age of the structure. Differences in fluid-inclusion shapes andsizes are readily apparent in TL images (Fig. 1a and b).
Subsequent creation of fluid-inclusion planes in the laboratoryseemed to confirm Tuttle’s interpretation, inasmuch as the fluid-inclusion planes form readily from fluid-filled microcracks; never-theless, the experimentalists noted that laboratory microfractureclosure could have resulted by deposition of material transportedover distances greater than grain scale, in other words, by a processof sealing (Lemmlein and Kliya, 1960; Smith and Evans, 1984;Brantley, 1990; Brantley et al., 1990). Microfracture sealing can bean extremely rapid process (Lander and Laubach, 2014), althoughsealing of wide fractures can be slow (Becker et al., 2010).
A key marker of the healing process should be textural evidenceof dissolution on microfracture walls (Laubach, 1989). The healingprocess, as described by Tuttle, involves dissolution of the fracturewall rock (that is, local, within-the-fracture dissolution). Thisshould be evidenced in CL as a pitted (dissolution) texture or afractureewall mismatch. The healing model predicts that thefracture walls should not be sharp.
SEM CL analysis shows that quartz-filled microfractures insedimentary and low-grade metamorphic rocks have sharp walls,whether or not fluid inclusions are present. Healing processescannot be ruled out for all fluid-inclusion planes, particularly thosein rocks deformed at high temperature that lack CL contrasts, orwhere heating subsequent to fracture closure has erased CL con-trasts so that fracture walls cannot be distinguished. But SEM CLanalysis of fluid-inclusion planes in most granites, most meta-morphic rocks, and a wide cross section of sedimentary rocks(Fig. 1) shows that Hicks was right; fluid-inclusion planes aremicroveins. A distinction between healed and sealed micro-fractures on the basis of criteria such as the presence or absence offluid inclusions (Mizoguchi and Ueta, 2013) is probably notfundamental. Cement textures within fractures are typical of thosein larger veins; these textures are markers for precipitation in opencavities, and, in some cases, for recracking (crack-seal texture; e.g.,Ramsay, 1980) (Laubach, 1997; Laubach et al., 2004a; Fig. 2a). Fluidinclusions are generally much smaller than those in quartz-filledmicro-veins and fit well within the confines of veins defined byfracture walls. Fluid inclusions are commonly trapped along mediallines (showing that they really are primary inclusions after all) andtheir shapes do not reflect fracture aging except inasmuch as oldermicrofracture arrays tend to be more thoroughly cemented withquartz (Laubach and Diaz-Tushman, 2009) as a natural conse-quence of thermal exposure in sedimentary-basin environments(Walderhaug, 1994; Lander et al., 2008). Some studies that usedtransmitted-light images of FIPs to determine the size and shape offractures, on the premise that the inclusion distribution and widthsare adequate proxies for fracture-opening displacement (Onasch,1990), are not validated. Nevertheless, for microfractures with ap-ertures in the range of 1 micron or less (Onasch, 1990), new ap-proaches for discriminating healing and sealing processes shouldbe sought (Onasch and Vennemann, 1995; Onasch et al., 2009).
The inference, on the basis of early experimental results, that thepresence of open microfractures implies relatively low tempera-tures and recent (young) fractures (Kowallis et al., 1987; Laubach,1989) has been borne out by more-recent experiments andcement-growth modeling (Lander et al., 2008; Lander and Laubach,2014) as well as by cement accumulation records tied to burialhistories by fluid-inclusion analysis (Becker et al., 2010; Fall et al.,2012). Fluid-inclusion planes should be referred to as quartz-filled (or quartz-lined) microfractures unless definitive evidenceof either healing or sealing can be adduced.
Please cite this article in press as: Anders, M.H., et al., Microfractures: A rej.jsg.2014.05.011
2.2. Microfractures in quartz-rich rocks
In the study of quartz-rich rocks there is a tradition, traceableback to Tuttle (1949) and his contemporaries, of continuousresearch on fluid-inclusion planes (interpreted to be micro-fractures) (Riley, 1947; Tuttle, 1949; Bonham, 1957; Roberts, 1965;Wise, 1964, 2005; Harper, 1966; Friedman, 1969; Engelder, 1974;Simmons and Richter, 1976; Brock and Engelder, 1977; Pecheret al., 1985; Lespinasse and Pecher, 1986; Kowallis et al. 1987;Jang et al., 1989; Laubach, 1989; Ren et al., 1989; Anders andWiltschko, 1994; Lespinasse, 1999). Many of the early studies,including Tuttle’s, addressed or were focused on other micro-structures in quartz, such as deformation lamellae (Fig. 1g). Some ofthese papers (i.e., Tuttle, 1945; Ingerson and Tuttle, 1948; Tuttle,1949) are also antecedents to current work on the microstruc-tures of crystal plasticity. It is possible that Tuttle himself (had heknown of it) might have objected to the term “Tuttlelamellae” (Groshong, 1988) for fluid-inclusion plane arrays, on thegrounds that he recognized fluid-inclusion planes to be quartz-filled fractures formed by a brittle process, in contrast to theother lamellae formed by nonbrittle processes in the same rocks.
2.2.1. Cathodoluminescence of quartz-filled microfracturesThe systematic application of cathodoluminescence, and in
particular SEM-based CL, marked a fundamental advance over theuse of transmitted light observations in the study of quartz-filledmicrofractures. In addition to resolving how these features form,as discussed above, in many rocks CL reveals the boundaries (orwalls and tips) of fractures in sharp detail, in part because of dif-ferences in luminescence between host quartz and quartz withinthe fracture (Fig. 1d and f). Typically, CL reveals many moremicrofractures than are apparent as fluid-inclusion planes, de-marcates opening displacements and lengths, reveals crosscuttingor abutting relations, and allows more meaningful description ofany cavities (open pore spaces) within fractures (Fig. 2b and c). Insome cases, evidence of multiple stages of fracture opening can befound in cement textures (Laubach, 1997; Laubach et al., 2004a,their Figs. 3 and 14). Consequently, fluid-inclusion planes can bemore confidently identified as fractures and are more useful forstructural analysis (Sprunt and Nur, 1979; Kanaori, 1986; Naraharaand Wiltschko, 1986; Boiron et al., 1992; Lloyd and Knipe, 1992;Knipe and Lloyd, 1994; Milliken, 1994; Laubach 1997; Laubachand Ward, 2006).
These benefits were not so apparent with early CL devices(Sipple,1968; Sibley and Blatt,1976), but improved resolution, colorimaging, and SEM-stage automation enables sharp microstructuraldefinition (Milliken and Laubach, 2000) over wide areas, in somecases encompassing image strips across tens of thin sections(Gomez and Laubach, 2006; Hooker et al., 2009). A limitation of CLanalysis, compared to transmitted light microscopy, is that CLessentially provides a map of the sample surface, so 3D informa-tion, such as the dip of fractures, needs to be acquired using eithermultiple thin sections in different orientations, or else sequentialsections. Tuttle (1949) and other early workers used the universalstage to measure microfracture orientations, but features dippingless than 45 degrees are in a blind spot and cannot be measuredaccurately. This problem can be overcome by using dip informationand optical measurements from precisely measured sections(Simmons et al., 1975; Simmons and Richter, 1976; Boullier andRobert, 1992), using an adaptation of the spindle stage for moreaccurate measurement of 3D orientation (Anderson and Bodnar,1993), or simply using mutually perpendicular-cut thin sectionswith a universal stage with sweeps down to 45� and combiningresults (Anders, 1982; Anders and Wiltschko, 1994). Nevertheless,TL techniques are difficult for large-area analysis, and recent CL-
view, Journal of Structural Geology (2014), http://dx.doi.org/10.1016/
M.H. Anders et al. / Journal of Structural Geology xxx (2014) 1e186
based approaches have used multiple image types, includingtransmitted light, layered in image-analysis software (Fall et al.,2012) but with some loss of 3D-orientation rigor.
2.3. Microfractures in non-quartz-rich rocks
The potential for the use of pervasive fluid-inclusionplanesdmicrofracturesdas tracers of past deformation patternsand conditions was appreciated at an early stage (Riley, 1947;Tuttle, 1949), and these structures are recognized low-temperature microstructures (Groshong, 1988; Passchier andTrouw, 2005). But this fluid-inclusion plane/microfracture litera-ture has been almost exclusively focused on quartz-rich rocks:quartzites, granites, and quartz-rich metamorphic rocks. Beforetracing this productive research direction, it is informative toconsider the presence (or absence) of microfractures in other rocktypes. Although experimental microfractures are typically createdin a wide range of rock types, there is no tradition of systematicstudy of natural microfractures in dolostones, limestones, or shales(mudrocks). In coal, a wide range of fracture size, includingmicrofractures, has long been recognized, but the microfracturecomponent of coal fractures (cleats) is rarely explicitly described(Laubach et al., 1998). In dolostones, microfractures arewidespread,but until recently notice of these structures was mostly as acomponent of diagenesis studies (Kupecz and Land, 1991;Montanez and Read, 1992; Marquez and Mountjoy, 1996), despitethe widespread view that dolostones are fracture prone and indeedform fractured reservoirs for petroleum and ore deposits (Nelson,1985; Davies and Smith, 2006). The advent of size-scaling studies,discussed later, has brought systematic description of micro-fractures (with apertures down to 1 mm) and more attention to thefull range of fracture sizes in dolostones (Gale et al., 2004; Ortegaet al., 2006; Hooker et al., 2012a) and limestones (Gale, 2002;Marrett et al., 1999; Gomez and Laubach, 2006).
Shales ormudstones are surprising because they apparently lackpervasive or disseminated microfracture populations. These rocksare a special case because of their current economic importance.Because some production amounts from low-permeability gas-bearing shales have been interpreted to be too large to be explainedby gas from the shale matrix, analysts infer an open microfracturenetwork contributing to permeability (Apaydin et al., 2012). But asGale et al. (2014) note, the theorized microfractures that theseengineering studies posit could be on the centimeter- to decimeter-(or more) length scale, given petroleum engineering (andgeophysicist) usage, and thus outside our definition. Microfracturesdo occur in shales but are uncommon if, by “microfracture,” wemean, in the geologic sense, a fracture a few microns wide and afew millimeters in height or length. Examples include bitumen-filled microfractures in Devonian Catskill shales (Lash andEngelder, 2005) and Oligocene Frio Formation shales (Capuano,1993). Some of these fractures are barren and could result fromcore disaggregation or outcrop weathering. Gale et al. (2007) foundfew fractures <30 mm wide in the Barnett Shale and Austin Chalk(silica-rich and carbonate-rich fine-grained rocks, respectively). Ina survey of shale fracture data from many active shale-gas plays,Gale et al. (2014) found most shale-fracture apertures in the sizerange of between 30 mm and 1 mm, with size ranges for individualformations or core sets mostly narrower. The upper aperture sizesare comparable to those in dolostone and sandstone, but the lowerlimit for shales is higher, a few tens of microns, and Gale et al. donot see many fractures below this size in shales. The overall pat-terns resemble size-restricted patterns found in some limestones(Gale, 2002) and dolostones (Hooker et al., 2012a), as well as insandstones that lack microfracture populations that have shale-likemechanical properties and composition (Ellis et al., 2012) or
Please cite this article in press as: Anders, M.H., et al., Microfractures: A rej.jsg.2014.05.011
fractures that formed under conditions of low temperatures andlow cement accumulation volumes (including barren joints)(Hooker et al., 2013). Gale et al. suggest that microfractures inshales may be more prevalent than these observations suggest, butat such low abundances that they are usually not sampled. Theapparent lack of pervasive microfractures in some rocks, includingshales, and their prevalence in other rocks (at least for fracturearrays formed under certain conditions) remains to be explained.Some suggestions have been posited (Hooker et al., 2013), whichwe discuss later.
3. Formation of microfractures in rock
3.1. Mechanics of Mode I cracks in rock
The modern theory of brittle fracture was initiated by Griffith(1920). His theory was in the form of an energy balance, in whichhe solved for the energetic conditions necessary for the propaga-tion of a crack. During the 1950s, primarily due to the work of Irwin(1958), a formalism was developed - Linear Elastic Fracture Me-chanicse that lends itself to the solution of general crack problems.
In this model, a crack is assumed to be a mathematically sharpslit embedded within an elastic medium. Three modes of crackingare defined. Mode I is the openingmode andModes II and III are thetwo shear modes. Herewewill be concerned primarily with Mode Icracks, sometimes called tensile cracks, in which the displacementsof the crack walls are normal to them. For this mode, the maximumaperture Dmax between the crack walls is related to crack length Lby
Dmax ¼ Dsð1� nÞ
mL (1)
where m is rigidity, n is Poisson’s ratio, and the effective drivingstress Ds¼ (sn� p) is the difference between the applied stressnormal to the crack wall and the pore pressure within the crack.The minus sign appears because a positive opening corresponds toa negative effective stress (tension).
The stresses near the tip of the crack are
sij ¼ Kð2prÞ�1=2fijðqÞ (2)
where r is the distance from the crack tip, K is the stress-intensityfactor, and fij(q) are functions that describe the dependence ofeach stress component on the angle q from the plane of the crack.The stress-intensity factor for an isolated crack is given by
K ¼ Ds
�pL2
�1=2
(3)
Griffith assumed that the crack would propagate when the en-ergy released in propagating the crack was just sufficient to supplythe surface energy to create the new crack increment. This criterionis incorporated in fracture mechanics by assuming that the crackpropagates when K reaches a critical value Kc defined by when theenergy release rate G attains a critical value Gc equal to the incre-ment of surface energy necessary to break the bonds at the cracktip,
Gc ¼ K2c
.2ð1þ nÞm ¼ 2a (4)
where a is the specific surface energy, a property of the material.Thus during propagation, K¼ Kc, a constant, and Eq. (3) shows thatthe driving stress Ds will decrease as the crack lengthens, i.e. thecrack weakens as it lengthens. Such a crack would thus be unstable
view, Journal of Structural Geology (2014), http://dx.doi.org/10.1016/
M.H. Anders et al. / Journal of Structural Geology xxx (2014) 1e18 7
under constant stress boundary conditions. The Griffith energybalance states that this instability will occur when the crack rea-ches a critical length Lc, given by
Lc ¼ 8mð1þ nÞapT2
(5)
where T is the tensile strength of the rock. Under the constant stressboundary conditions assumed by Griffith, when a crack reaches thiscritical length, it will propagate without limit. Evaluating Eq. (5),assuming m¼ 20 GPa, T¼ 5 MPa and a from experimental data is10e100 Jm-2 (Hoagland et al., 1973) provides estimates of Lc be-tween 2.5�10-2e2.5�10-1m.
Combining Eq. (1) with Eq. (3) we obtain
Dmax ¼ ð1� nÞ� ffiffiffiffiffiffiffiffiffip=2
p �mKcL1=2 (6)
which predicts that Dmax scales as√L.According to this theory, fracture will occur when the
longest, most favorably oriented crack becomes critical. Thisassumes a homogeneous material. Because of the granularnature of rock, stresses in rock are highly heterogeneous at thegrain scale. As a result, when rock is loaded in tension in thelaboratory, acoustic emissions from the propagation of manymicrofractures are observed prior to the formation of themacrofracture that leads to the final failure of the specimen.This failure is the result of the coalescence of microfractures(Mogi, 1962; Zeitlow and Labuz, 1998; Tham et al., 2005). Aswill be described later, the same behavior is observed incompression tests (see Horii and Nemat-Nasser, 1985). Thispattern leads to the phenomenon that is the subject of thisarticle: microfractures at a wide range of scale lengths arecommonly found in many rocks.
For shear-mode cracks (faults), multiple observers have foundthat Dmaxf L, in agreement with Eq. (1) and not Eq. (6) (Cowie andScholz,1992; Dawers et al., 1993; Schlische et al., 1996). This impliesthat Kcf√L and thus Gcf L, contradicting the assumption ofGriffith. The reason for this behavior again lies in the heterogeneityof rock: macrocracks coalesce and propagate within a volume ofintensemicrofracturing, called a process zone (e.g., Atkinson,1987).Thus the surface energy required to propagate the macrocrack(fault) involves not only the new surface area of that crack, asGriffith assumed, but all the microcracks in the process zone thatare integral to the formation of the macrocrack. Because the size ofthe process zone is found to grow proportionally to the length ofthe fault (Vermilye and Scholz, 1998; Faulkner et al., 2011), thefracture energy, Gcf L. Realizing that Kcf√L we see from Eq. (3)that faults grow at a constant stress drop, scaling according to Eq.(1). The finding that Gcf L means, from Eq. (5), that there is nolonger a Griffith instability or critical length. Cracks are thus stableunder constant stress boundary conditions.
Subsequent work has shown that the same conclusions maybe made for Mode I fractures in rock e joints, veins, and dikes.A study of the scaling law for veins found a linear relationshipbetween Dmax and L (Vermilye and Scholz, 1995). It had beenlong known from laboratory experiments that Mode I crackpropagation is associated with a growing process zone(Swanson, 1987; Labuz et al., 1987). More recent work, dis-cussed in a later section, showed that the process zones growlinearly with fracture size, just as in the case with faults.Hence, Mode I fractures in rock scale linearly with L for thesame reason as do faults.
However, there is a school of the study of Mode I fractures inrock that has proceeded along classical linear elastic-fracture
Please cite this article in press as: Anders, M.H., et al., Microfractures: A rej.jsg.2014.05.011
mechanics lines in which the Griffith assumption is implicit. Segall(1984), for example, recognized the existence of sets of joints withgreatly varying lengths that evidently grew quasi-statically andmust therefore be incompatiblewith the Griffith instability. He thusproposed that joint sets grow under constant displacement-boundary conditions. This idea would preclude the possibility ofhorizontal joint sets, because the vertical stress, being produced bythe weight of the overburden, is a body force andmanifestly resultsin constant stress boundary conditions.
Olson (2003) argued, along the lines of Eqs. (1)e(6), that Dmaxmust scale as√L rather than as L, and, while other analyses supportthis view (Schultz et al., 2008), other ways exist for handling andinterpreting the data (Scholz, 2010; Olson and Schultz, 2011;Scholz, 2011; Schultz et al., 2013). Because of stress interactionsbetween the segments of en echelon arrays, these arrays mayexhibit scaling of the form DmaxfL1/n where n is greater than 1(Pollard et al., 1982; Vermilye and Scholz,1995; Olson, 2003) so thatthe scaling of such multisegment arrays often is closer to√L than L.To advance the discussion of reconstructions of fracture shapehistories from inception as microfractures would be a useful di-rection for future research, and one now feasible in certain rocktypes (Becker et al., 2010).
3.2. Experimental stress-induced microfractures
Microfractures (microcracks) induced under experimentalconditions provide important information about the processesof failure in rock and lead to a better understanding offaulting and the formation of microfractures in nature (Scholz,2002). The development of experimentally induced micro-fractures was first demonstrated where dilatancy wasobserved in triaxial compression tests (Brace et al., 1966). Thedilatancy is manifest as inelastic expansion normal to the s1direction, from which researchers have deduced that thedilatancy was produced by the growth and opening of Mode Imicrofractures (dilatant microcracks) parallel to s1. That thisprocess involved the growth of new cracks was demonstratedby acoustic-emission studies (Scholz, 1968a, b; Lockner et al.,1991; Reches and Lockner, 1994). True triaxial compressiontests show that, when s3, < s2, the dilatant microcracks areoriented preferentially in the s1es2 plane (Mogi, 1971) orsomewhat obliquely to them (Healy et al., 2006a; 2006b).Dilatant microcrack anisotropy may also be caused by aniso-tropic rock fabric (Scholz and Koczynski, 1979). Microscopicexamination of samples deformed in the laboratory confirmedthese conclusions. Note that microfractures can often beinferred to nucleate at grain boundaries (Gallegher et al.,1974; Tapponnier and Brace, 1976; Kranz, 1979, 1983b; Wong1982; Moore and Lockner, 1995; Homand et al., 2000; Katzand Reches, 2004). Stress cycling results in the opening andclosing of dilatant microcracks along hysteresis loops (Scholzand Koczynski, 1979; Scholz and Hickman, 1983).
Although much has been learned in the laboratory, mostexperimental work on microfractures does not include con-current chemical processes (such as cement precipitation)that, as shown by observation of microfracture populations,operate in many settings in the Earth. In subsurface envi-ronments, rock and fault properties, for example, may changeduring deformation as a result of cement precipitation.Cement deposition may affect whether and how micro-fractures evolve into larger fractures, with consequences forfracture-size scaling (Clark et al., 1995; Hooker et al., 2012a).A new generation of experimental work may be needed tofully address these and other issues.
view, Journal of Structural Geology (2014), http://dx.doi.org/10.1016/
M.H. Anders et al. / Journal of Structural Geology xxx (2014) 1e188
3.3. Microfracture size distributions
Like macrofractures, microfractures occur in sets, or pop-ulations, that exhibit well-defined statistical properties such astheir size distribution. This distribution has been observed asexponential (Snow, 1970; Baecher and Lanney, 1978) but morecommonly as a power-law distribution (Gudmundsson, 1987;Barton and Zoback, 1992; Clark et al., 1995; Gross and Engelder,1995; Loriga, 1999; Marrett et al., 1999; Ortega and Marrett,2000; Gillespie et al., 2001; Laubach and Ward, 2006; Ortegaet al., 2006; Davy et al., 2010; Guerriero et al., 2010; Hooker et al.,2009; 2011; Hooker et al., 2014). However, in many cases, partic-ularly with small data sets, the type of distribution is not clear-cut.The measured quantity in microfractures is usually openingdisplacement (kinematic aperture), but because aperture may scalelinearly with length (Vermilye and Scholz, 1995; cf. Olson, 2003;Schultz et al., 2008), aperture size distributions could be proxiesfor length distributions. Why such scaling arises (or fails to arise) inmicrofracture populations is an area where more work is needed.Observational studies that document microfracture lengths, testmodels of how microfracture aperture and length relate, and thequestion of whether and how such patterns evolve across the entirefracture size range constitute another topic where more data isneeded. Advanced imaging procedures allow such experiments toprobe microfracture growth in ways that were not possible previ-ously (Barnhoorn et al., 2010).
Power-law distributions are typical of fractal objects that exhibitself-similarity, and such distributions are continuous over a scalerange for which no characteristic dimensions exist. In nature, suchdistributions are truncated at characteristic dimensions of thesystem, either by a transition to another fractal state, characterizedby a change in the exponent in the power-law, or by an upper orlower fractal limit (Scholz, 1995; Marrett, 1996). Two such charac-teristic length scales in rockmerit discussion: the grain size and, forsedimentary rocks, the mechanical-layer thickness.
Because rock is a polycrystalline aggregate of one or morecrystal phases, many of which are anisotropic in their physicalproperties, stresses within the rock will be heterogeneous at thegrain scale, owing, in crystalline igneous and metamorphic rocks,to the mismatch between elastic and thermaleelastic propertiesof adjacent grains, and in porous clastic rocks, to contact stressesbetween adjacent grains. Therefore noise exists in the stress fieldat the grain scale in crystalline rock, and it is at this scale thatstress concentrations exist that can nucleate and propagatemicrofractures, even though the regional stresses are well belowthe fracture strength of the rock. This pattern implies that thenature of the microfracture population will depend on the fabricof the rock. For polyphase igneous or metamorphic rocks, such asgranite, there exists high contrast between grains in physicalproperties like elasticity and thermal expansion as well as a highdegree of grain interlocking. This geometry results in high stressconcentrations and hence high densities of grain-boundary andintragranular cracks. For monomineralic, crystalline rocks such asmarble or peridotite, where property contrasts are less than inother rocks, microfracture density may be less as well. For clasticrocks such as sandstone, grain-contact stresses are dominant atlow levels of diagenesis (low compaction or cement content) andintragranular microfractures emanating from contact points arecommon (Fig. 2f). The presence of cement progressively supportstransgranular stresses so that stress concentrations at grainboundaries become muted and microfractures become lessconcentrated at grain boundaries. Rocks such as mudstones andshales, on the other hand, contain phyllitic minerals, especiallyclay, in their matrices; these phyllitic minerals may act ductily tosuppress cracking.
Please cite this article in press as: Anders, M.H., et al., Microfractures: A rej.jsg.2014.05.011
Although smaller microfractures can be detected (Gomez andLaubach, 2006), studies of microfracture kinematic-aperture sizedistributions typically have a lower resolution limit of about 10-3 mm, which, using an aspect ratio of 1000 (Vermilye and Scholz,1995), indicates microfracture lengths of about 1 mm. This isclose to or larger than the grain size of the rocks studied, typicallymedium- to very fine-grained sandstones; hence any aperturetransition at the grain scale is not readily measurable with currentimaging methods. Hooker et al. (2009), in a study of sandstone,found that most microfractures were intragranular, whereas onlytransgranular microfractures could be confidently ascribed ontextural grounds to the same population as macrofractures. Theaperture distribution at the small scale was best fit with a log-normal distribution, suggesting that a lower cut-off was beingsensed or that at the grain scale and smaller, populations ofdiffering origins are present but indistinguishable (Laubach, 1997).In a study of experimentally deformed granite, however, Katz andReches (2004) observed that microfractures follow a power-lawdistribution that peaks at the grain scale and shows a rapid cutoffin microfracture abundance below that scale. These observationssuggest that a lower fractal limit exists, occurring at the scale of thegrain size in many rocks.
For large fractures, mechanical layer thickness can affectfracture height growth, for example where there is a markedcontrast of competency or ductility between layers so thatfractures are bound within the more brittle layers. Such bed-confined fractures may be of equal height and aperture andregularly spaced, having a spacing that is proportional to thelayer thickness (Price, 1966, p. 144). In this instance, thespacing of these fractures is proportional to layer thicknessbecause it is the latter that controls the width of the stressshadow of a crack of that height (Hu and Evans, 1989; Baiet al., 2000). Field observations and geomechanical modelsthat simulate fracture propagation suggest that even for strata-bound fractures, fracture arrangement can be more compli-cated than this (Olson et al., 2009 and references therein).Moreover, complex hierarchies of large fracture heights existbut have yet to be adequately described and classified (Hookeret al., 2013), and mechanical layering itself commonly evolvesthrough time (Laubach et al., 2009). How these patterns oflarge fractures and the enclosing mechanical stratigraphyevolve, and how this evolution relates to the growth ofmicrofractures and the development of size scaling, are areasthat could be addressed with new observational, experimental,and modeling work.
Some numerical experiments give promise of convergence be-tween models and observations. Spyropoulos et al. (1999b) studieda numerical model of the spontaneous growth of fractures in anelastic layer. They found three regimes. At low strains, the fracturesbehave independently and form a power-law distribution. Athigher strain, where fracture interactions become important ininhibiting nucleation of new fractures and forming longer fracturesby coalescence of smaller fractures, this distribution becomeswarped into an exponential distribution. The system finally satu-rates at high strain into a system of equally spaced system-sizecracks. The transition with strain from a power-law to exponen-tial distribution was replicated in a physical model (Spyropouloset al., 1999) and also observed in field data (for faults) by Guptaand Scholz (2000). The exponent for the power-law frequencydistribution found in the model was about �2. This corresponds toan exponent of �1 in a cumulative distribution, which is similar tothe values of about �0.8 to �1.0 observed for microfractures(Marrett et al., 1999; Ortega et al., 2006; Hooker et al., 2014). Nu-merical experiments that replicate fracture growth by rules thatmimic inhibition of fracture growth by cement accumulation also
view, Journal of Structural Geology (2014), http://dx.doi.org/10.1016/
0.060.03-0.00-0.03-0.06
0.06
-0.03
0.03
-0.00
-0.06
Y D
ista
nce
X Distance
a
b
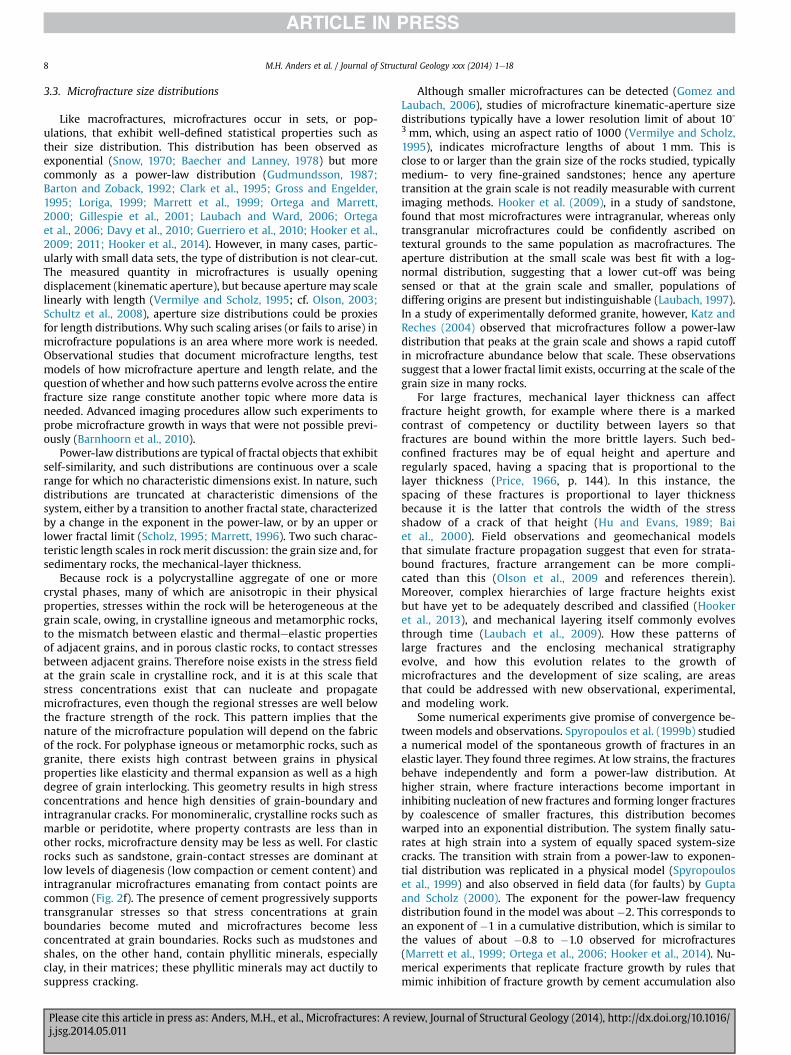
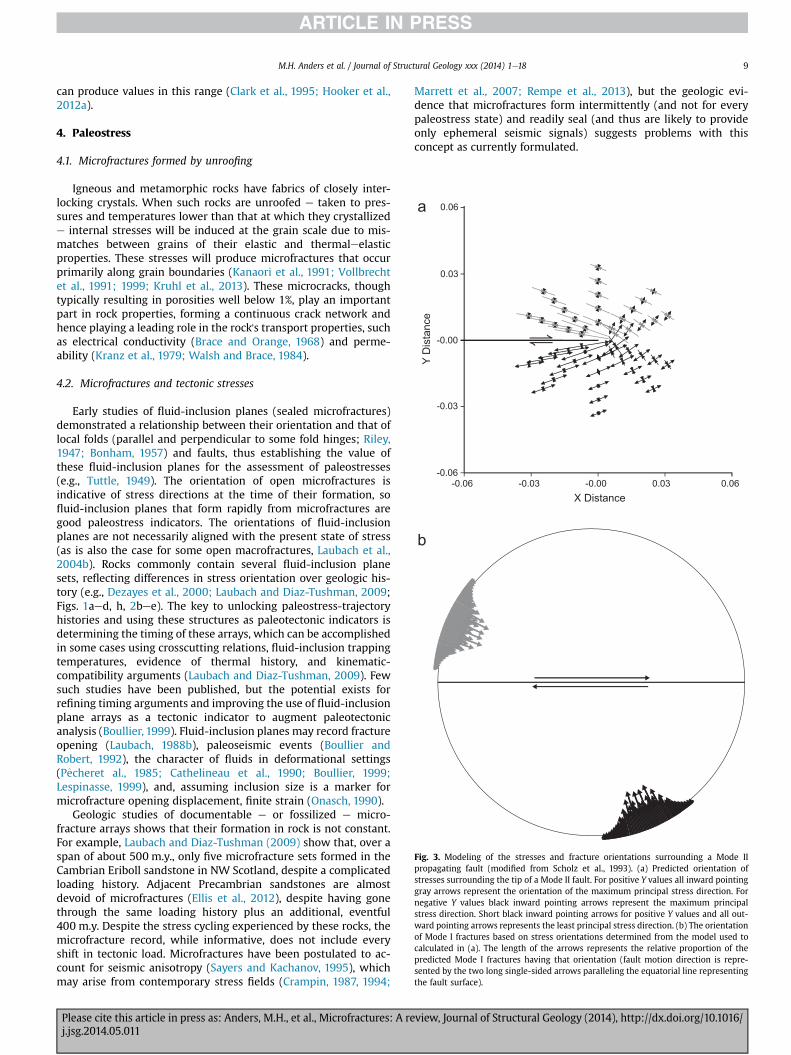
Fig. 3. Modeling of the stresses and fracture orientations surrounding a Mode IIpropagating fault (modified from Scholz et al., 1993). (a) Predicted orientation ofstresses surrounding the tip of a Mode II fault. For positive Y values all inward pointinggray arrows represent the orientation of the maximum principal stress direction. Fornegative Y values black inward pointing arrows represent the maximum principalstress direction. Short black inward pointing arrows for positive Y values and all out-ward pointing arrows represents the least principal stress direction. (b) The orientationof Mode I fractures based on stress orientations determined from the model used tocalculated in (a). The length of the arrows represents the relative proportion of thepredicted Mode I fractures having that orientation (fault motion direction is repre-sented by the two long single-sided arrows paralleling the equatorial line representingthe fault surface).
M.H. Anders et al. / Journal of Structural Geology xxx (2014) 1e18 9
can produce values in this range (Clark et al., 1995; Hooker et al.,2012a).
4. Paleostress
4.1. Microfractures formed by unroofing
Igneous and metamorphic rocks have fabrics of closely inter-locking crystals. When such rocks are unroofed e taken to pres-sures and temperatures lower than that at which they crystallizede internal stresses will be induced at the grain scale due to mis-matches between grains of their elastic and thermaleelasticproperties. These stresses will produce microfractures that occurprimarily along grain boundaries (Kanaori et al., 1991; Vollbrechtet al., 1991; 1999; Kruhl et al., 2013). These microcracks, thoughtypically resulting in porosities well below 1%, play an importantpart in rock properties, forming a continuous crack network andhence playing a leading role in the rock's transport properties, suchas electrical conductivity (Brace and Orange, 1968) and perme-ability (Kranz et al., 1979; Walsh and Brace, 1984).
4.2. Microfractures and tectonic stresses
Early studies of fluid-inclusion planes (sealed microfractures)demonstrated a relationship between their orientation and that oflocal folds (parallel and perpendicular to some fold hinges; Riley,1947; Bonham, 1957) and faults, thus establishing the value ofthese fluid-inclusion planes for the assessment of paleostresses(e.g., Tuttle, 1949). The orientation of open microfractures isindicative of stress directions at the time of their formation, sofluid-inclusion planes that form rapidly from microfractures aregood paleostress indicators. The orientations of fluid-inclusionplanes are not necessarily aligned with the present state of stress(as is also the case for some open macrofractures, Laubach et al.,2004b). Rocks commonly contain several fluid-inclusion planesets, reflecting differences in stress orientation over geologic his-tory (e.g., Dezayes et al., 2000; Laubach and Diaz-Tushman, 2009;Figs. 1aed, h, 2bee). The key to unlocking paleostress-trajectoryhistories and using these structures as paleotectonic indicators isdetermining the timing of these arrays, which can be accomplishedin some cases using crosscutting relations, fluid-inclusion trappingtemperatures, evidence of thermal history, and kinematic-compatibility arguments (Laubach and Diaz-Tushman, 2009). Fewsuch studies have been published, but the potential exists forrefining timing arguments and improving the use of fluid-inclusionplane arrays as a tectonic indicator to augment paleotectonicanalysis (Boullier, 1999). Fluid-inclusion planes may record fractureopening (Laubach, 1988b), paleoseismic events (Boullier andRobert, 1992), the character of fluids in deformational settings(Pecheret al., 1985; Cathelineau et al., 1990; Boullier, 1999;Lespinasse, 1999), and, assuming inclusion size is a marker formicrofracture opening displacement, finite strain (Onasch, 1990).
Geologic studies of documentable e or fossilized e micro-fracture arrays shows that their formation in rock is not constant.For example, Laubach and Diaz-Tushman (2009) show that, over aspan of about 500 m.y., only five microfracture sets formed in theCambrian Eriboll sandstone in NW Scotland, despite a complicatedloading history. Adjacent Precambrian sandstones are almostdevoid of microfractures (Ellis et al., 2012), despite having gonethrough the same loading history plus an additional, eventful400 m.y. Despite the stress cycling experienced by these rocks, themicrofracture record, while informative, does not include everyshift in tectonic load. Microfractures have been postulated to ac-count for seismic anisotropy (Sayers and Kachanov, 1995), whichmay arise from contemporary stress fields (Crampin, 1987, 1994;
Please cite this article in press as: Anders, M.H., et al., Microfractures: A rej.jsg.2014.05.011
Marrett et al., 2007; Rempe et al., 2013), but the geologic evi-dence that microfractures form intermittently (and not for everypaleostress state) and readily seal (and thus are likely to provideonly ephemeral seismic signals) suggests problems with thisconcept as currently formulated.
view, Journal of Structural Geology (2014), http://dx.doi.org/10.1016/

M.H. Anders et al. / Journal of Structural Geology xxx (2014) 1e1810
Fluid-inclusion planes have been used as indicators of paleo-stress directions in a variety of rock types, including metamorphicrocks (Tuttle, 1949), deformed sedimentary rocks (Engelder, 1974;Knipe and White, 1979; Dula, 1981; Anders, 1982; Mitra, 1987;Laubach, 1988a,b; Onasch, 1990; Anders and Wiltschko, 1994;Vermilye and Scholz, 1998; Wilson et al., 2003; I~nigo et al., 2012;Anders et al., 2013), and less deformed or largely undeformedsedimentary rocks in awide range of settings (Laubach,1989; 1997;Laubach and Ward, 2006; Laubach and Diaz-Tushman, 2009).Building on observations of regional patterns of strength anisotropyin New England granites (Tarr, 1891; Dale, 1908; 1923), researchershave documented fluid-inclusion plane arrays in igneous rocks inlaboratory experiments and inferred the fabric to record regionalstress patterns (Nur and Simmons, 1970; Holzhausen, 1977; Plumbet al., 1984; Lespinasse and Pecher, 1986; Hall, 1987; Kowallis et al.,1987; Ren et al., 1989; Fleischmann, 1990; Vollbrecht et al., 1991;Anders et al., 2001; Nadan and Engelder, 2009). The value of suchstudies is increased where strength and other laboratory tests arecombined with microstructural and fluid-inclusion analysis toconstrain timing of the microstructural fabrics.
4.3. Microfractures and fault zones
Faults (shear cracks) are inherently macroscale features. Faultsformed by the coalescence of Mode I microcracks (Scholz, 1968b;Lockner et al., 1991) and propagate via a cloud of microfracturesformed in the stress concentration at the fault tip; when crackdensity reaches a critical value, this cloud of microfractures breaksthe rock down into a cataclasite that allows shear displacement tooccur (Cowie and Scholz, 1992). The orientations of microfracturesin the process zone reflect the fault-tip stresses rather than theregional stresses (Fig. 3; Scholz et al., 1993; Vermilye and Scholz,
Fig. 4. Microfracture density as a function of distance from several faults of various displacemin sandstones, arkoses, and quartzites, from Anders and Wiltschko (1994), (b) microfractugranite, from Anders et al. (2001). (d) Microfracture density in granodiorites, from Faulkne
Please cite this article in press as: Anders, M.H., et al., Microfractures: A rej.jsg.2014.05.011
1998; Suzuki, 2012). In the wake of the process zone, the passageof the fault tip leaves behind a damage zone of microfractures witha width that scales with the length and displacement of the fault(Vermilye and Scholz, 1998; Savage and Brodsky, 2011; Faulkneret al., 2011).
Faults are not planar features but have irregular traces (wavi-ness) that can be described as fractal topography (Aviles et al., 1987;Power et al., 1987). As fault slip accrues, geometrical irregularitiesimpinge on one another. Stress concentrations from these in-teractions produce additional microfractures in the surroundingrock with a different orientation than those formed in the processzone (Chester and Chester, 2000;Wilson et al., 2003; Faulkner et al.,2011). The total damage zone of the fault consists of microfracturesproduced by both mechanisms.
4.4. Microfracture density in the damage zones of faults
Brock and Engelder (1977) demonstrated that surrounding theMuddy Mountain thrust in southern Nevada there was in increasein microfracture density in sandstones as the principal fault surfaceis approached. A similar observationwas made around large strike-slip faults (Chester and Logan, 1986). This, as discussed earlier, wasexpected based on experimental observations where faults werepreceded by coalescence of microcracks about the future failureplane (Scholz, 1968b; Lockner et al., 1991; Moore and Lockner,1995). Microfracture-density field studies show that, for somefaults, microfractures exhibit an exponential increase as the prin-cipal fault plan is approached (Wiltschko and Anders, 1994;Vermilye and Scholz, 1998; Mitchell and Faulkner, 2009; Faulkneret al., 2011; Mitchell and Faulkner, 2012; Mizoguchi and Ueta,2013). Fig. 2d shows a sample from the damage zone of a Tertiarygranite sampled 300 m from the principal fault surface of a normal
ent. See Anders et al. (2013) for details of sampling locations. (a) Microfracture densityre density in quartzites, from Vermilye (1996). (c) Microfracture density in a Tertiaryr et al. (2006) and Mitchell and Faulkner (2009).
view, Journal of Structural Geology (2014), http://dx.doi.org/10.1016/

M.H. Anders et al. / Journal of Structural Geology xxx (2014) 1e18 11
fault with a displacement of 5 km, and Fig. 2e shows a sample fromthe transition between the damage zone and fault core taken 12 mfrom the principal fault surface of the same fault. As shown in Fig. 4,numerous studies have demonstrated an exponential relationshipin microfracture density and fault-surface proximity. At a givendistance, depending on rock type and ambient stresses, there is afall-off of this relationship to a background level of density (Anderset al., 2013).
4.5. Microfracture orientation patterns in fault damage zones
Brittle fracturing in quartz exhibits no strongly preferredorientation (Tuttle, 1949), making quartz a good medium forassessment of the orientation of applied stresses. However, c-axisindenter studies of quartz indicate that some anisotropy exists(Timms et al., 2010), although it is unclear how pronounced theanisotropy is under tectonic deviatoric stress conditions. Quartzcomposes sedimentary rocks such as sandstones, arkoses, andconglomerates, as well as igneous rocks and metamorphic rocks.Because microfractures are, as mentioned above, Mode I fractures,they have been shown by numerous authors to provide importantinformation about the paleostress orientations in many naturalsettings (Tuttle, 1949; Wise, 1964; Friedman, 1969; Engelder, 1974;Brock and Engelder, 1977; Knipe and White, 1979; Dula, 1981;Anders, 1982; Lespinasse and Pecher, 1986; Kowallis et al., 1987;Laubach, 1988a,1989,1997; Fleischmann, 1990; Blenkinsop, 1990;Onasch, 1990; Wang and Sun, 1990; Anders and Wiltschko, 1994;Vermilye and Scholz, 1998; Boullier, 1999; Wilson et al., 2003;Gomez and Laubach, 2006; Laubach and Ward, 2006; Laubachand Diaz-Tushman, 2009; Mitchell and Faulkner, 2009, 2012;Anders et al., 2013; Mizoguchi and Ueta, 2013). Microfractures alsoproved useful for testing fold-fracture models (Narahara andWiltschko, 1986; Laubach, 1988a, Ismat and Mitra 2005; Ismat,2008; I~nigo et al., 2012). Moreover, much can be inferred fromrelatively sparse sampling of regional patterns or local fault-zonepatterns from small samples taken from drilling core or cuttings(e.g., Kowallis et al., 1987; Blenkinsop, 1990; Wang and Sun, 1990;Anders and Christie-Blick, 1994; Martin and Bergerat, 1996; Lau-bach and Gale, 2006; Hooker et al., 2009).
Sedimentary rocks that are weakly lithified tend to transferstresses at points of grain contact (e.g., Borg and Maxwell, 1956;Friedman, 1963; Engelder, 1974; Brock and Engelder, 1977; Knipeand White, 1979; Anders, 1982; Anders and Wiltschko, 1994;Shipton and Cowie, 2001). Microfractures that radiate from a
N = 5635
a
Fig. 5. Plots of poles to microfracture on stereonet projections. (a) Poles to microfracture FCalifornia (represents a subset of the total measurements from Wilson et al., 2003). Great cirslip direction (SW quadrant) and b-axis. (b) Poles to microfractures from samples collected ifault surface and arrows the movement directions (represents a subset of the total measur
Please cite this article in press as: Anders, M.H., et al., Microfractures: A rej.jsg.2014.05.011
point source (Fig. 2f) require large numbers of measurements inorder to overcome the statistical dispersion created by this pattern.Moreover, sampling large populations of microfracture orientationsin siliciclastic sedimentary rocks is also necessary because theserocks commonly have grains that contain inherited microfractures(e.g., Sipple, 1968; Anders et al., 2013; Fig. 1h). Examples of thisinclude the study byWilson et al. (2003), who measured over 8000microfracture orientations in sandstones in order to assess paleo-stress orientations surrounding the Punchbowl fault, an inactivebranch of the San Andreas fault (Fig. 5a). Similarly, Anders andWiltschko (1994) measured a total of over 8000 microfractureorientations in arenites surrounding normal and thrust faults(Fig. 5b). Both Anders and Wiltschko (1994) and Vermilye andScholz (1998) used microfracture orientations surrounding a faultto demonstrate that fractures on opposite sides of a fault yielddifferent orientations depending on slip direction (Figs. 5b and 6).Orientation data from a small displacement fault (Fig. 6) as well asthe larger ones of Anders and Wiltschko (1994) were found to beconsistent with a process-zone fracture aureole around a fault tip.As discussed in the last section, all studies of microfracture orien-tations near fault surfaces present the possibility that some of themicrofractures arise as a result of fault waviness or are inheritedfrom older events (Wilson et al., 2003; Faulkner et al., 2011).However, as we have discussed, CL can be used to mediate thisinheritance problem by identifying crosscutting relationships.
5. Microfractures and macrofractures
In addition to fluid-inclusion planes associated with localizedfolds and faults, there are commonly strong regionally developedpreferred orientations. Many studies demonstrate a parallelismbetween the orientation of microfractures and larger macro-fractures (Tuttle, 1949; Riley, 1947; Bonham, 1957; Wise, 1964;Roberts, 1965; Harper, 1966; Friedman, 1969; Dula, 1981; Laubach,1989; Vermilye and Scholz, 1998; Laubach and Diaz-Tushman,2009). As discussed in Section 3, microfractures nucleate at stressconcentrations that occur at the grain scale. Once microfracturesbecome longer than that length scale, i.e., become transgranular,they may continue to propagate by virtue of the stress concentra-tion at the tip and become macrofractures. Such microfracturesshare common orientations with macrofractures of the same set(Laubach, 1989) and they may belong to a common, systematic sizedistribution (e.g., Hooker et al., 2009). Mode I cracks grown in thelaboratory are observed to form a process zone of grain-scale
N = 1003
b
IPs from a sandstone sampled in the damage zone of the Punchbowl fault of Southerncle represents the fault surface and diamonds represent the normal to the fault surface,n proximity of the Boulder thrust of the Lyon Sandstone. Equatorial line represents theements from Anders and Wiltschko, 1994).
view, Journal of Structural Geology (2014), http://dx.doi.org/10.1016/

Fig. 6. Orientation of microfractures surrounding a small displacement strike-slip Millbrook Cliff fault. The fault is in Silurian-age Shawnangunk Formation quartzites of theShawnangunk Mountains of southern New York (from Vermilye and Scholz, 1998).
Process zone width, (m)
Frac
ture
ape
rture
, (m
)
A (2 cm)
B (1-100 m)
C
D (1 km)
1.E+01
1.E-01
1.E-02
1.E-03
1.E-04
1.E-05
1.E+00
1.E+011.E-011.E-02 1.E+021.E-031.E-04 1.E+00
Fig. 7. A logelog plot of process zone width versus aperture of joints and dikes.Fracture length given in brackets. Data sources: (A) lab experiments on opening modecracks in granite (Swanson, 1987), (B) joints in granite (Segall, 1984; Segall and Pollard,1980). (C) Dikes in gneisses (Engvik et al., 2005), and (D) dikes in sandstone (Delaneyet al., 1986). From Scholz (2011).
M.H. Anders et al. / Journal of Structural Geology xxx (2014) 1e1812
microfractures (Swanson, 1987; Labuz et al., 1987). As the mastercrack grows, the microfractures in the process zone are left behindand become inactive, forming what is known as the damage zone.The width of the crack-tip stress concentration scales with thelength of the master crack, so the process zone width grows inconcert with the growth of the master crack. The damage zonessurrounding some joints and dikes are often highlighted bymineralized halos, making them readily recognizable (Engvik et al.,2005, 2009). Fig. 7 shows approximately linear scaling betweendamage-zonewidth and the aperture of joints and dikes. The crack-tip stress field of a Mode I crack is dominated by tensile stressesnormal to the plane of the crack. Hence microfractures in theprocess zones of joints and dikes will tend to have orientationsparallel to those structures. For example, Delaney et al. (1986)found clusters of subparallel joints surrounding dikes. Some ofthe clustering of microfractures observed in scan lines may bedamage zones surrounding macrofractures.
Populations of fractures having a diverse range of fracture sizesmay arise from the evolution of some microfractures into macro-fractures within an overall disseminated population of fractures, orthe correlation could result from microfractures created by crack-tip stress concentrations in a process zone near a growing frac-ture of larger size (Atkinson, 1987). Although not mutually exclu-sive, the relative importance of these two processes e growth ofselect disseminated fractures and byproducts of process zones e
has yet to be rigorously explored with observational studies, yetfluid-inclusion analysis may permit such tests in some cases(Hooker et al., 2012b).
Many early workers on fluid-inclusion planes noticed that thesemicrostructures shared common orientations with arrays of larger
Please cite this article in press as: Anders, M.H., et al., Microfractures: A rej.jsg.2014.05.011
fractures. Subsequent work combining CL imaging and fluid-inclusion analysis has demonstrated that many quartz-filledmicrofractures share mineral assemblages, CL textures and colors,crosscutting relations, and other attributes that suggest that thesmall fractures are merely the small-size fractions of larger frac-tures (Laubach, 1989; Fig. 2b and c). Where microfractures are parts
view, Journal of Structural Geology (2014), http://dx.doi.org/10.1016/
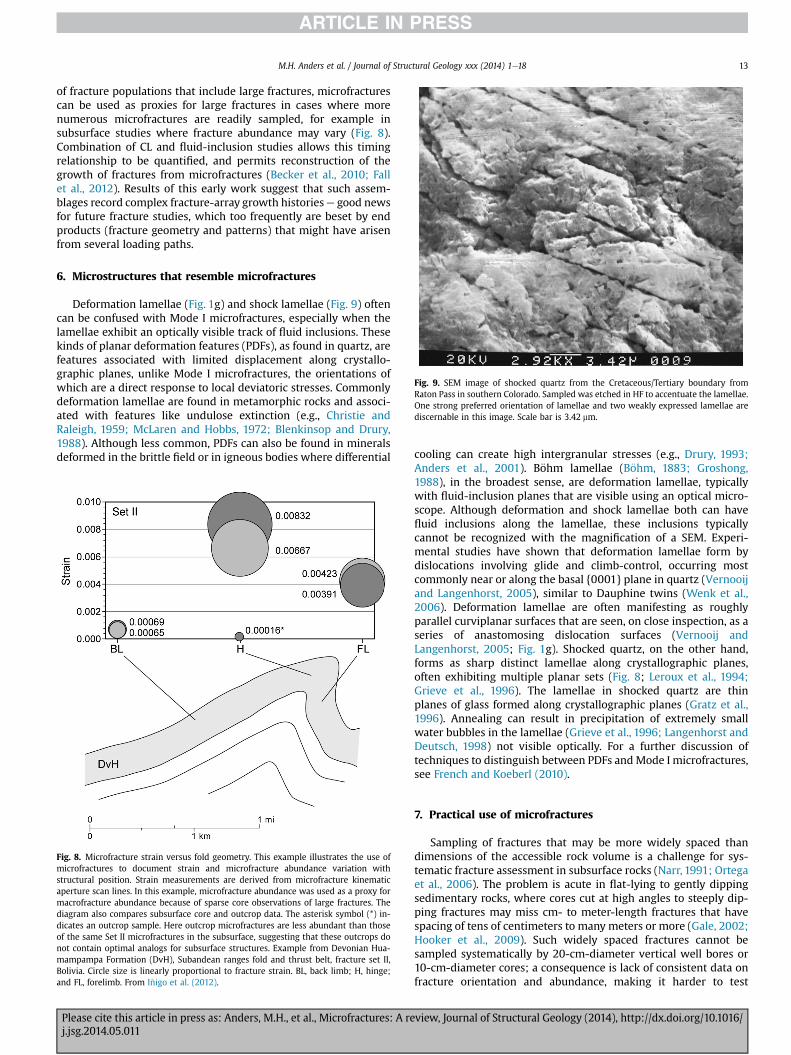
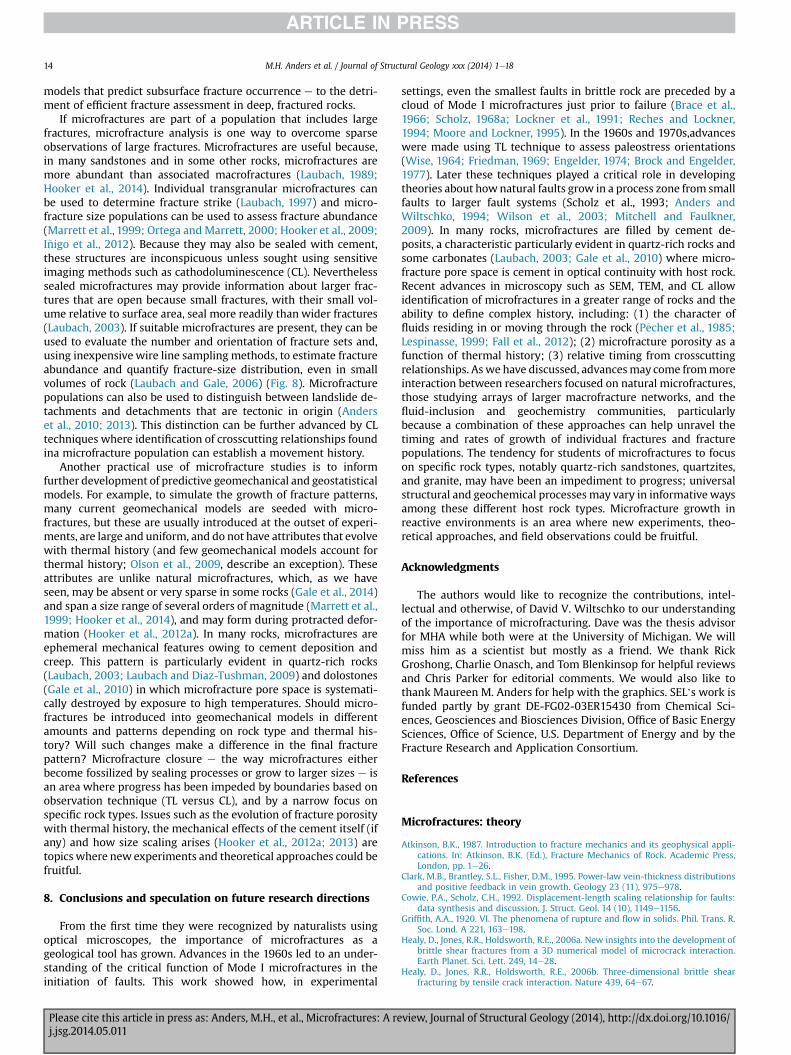
Fig. 9. SEM image of shocked quartz from the Cretaceous/Tertiary boundary fromRaton Pass in southern Colorado. Sampled was etched in HF to accentuate the lamellae.One strong preferred orientation of lamellae and two weakly expressed lamellae arediscernable in this image. Scale bar is 3.42 mm.
M.H. Anders et al. / Journal of Structural Geology xxx (2014) 1e18 13
of fracture populations that include large fractures, microfracturescan be used as proxies for large fractures in cases where morenumerous microfractures are readily sampled, for example insubsurface studies where fracture abundance may vary (Fig. 8).Combination of CL and fluid-inclusion studies allows this timingrelationship to be quantified, and permits reconstruction of thegrowth of fractures from microfractures (Becker et al., 2010; Fallet al., 2012). Results of this early work suggest that such assem-blages record complex fracture-array growth historiese good newsfor future fracture studies, which too frequently are beset by endproducts (fracture geometry and patterns) that might have arisenfrom several loading paths.
6. Microstructures that resemble microfractures
Deformation lamellae (Fig. 1g) and shock lamellae (Fig. 9) oftencan be confused with Mode I microfractures, especially when thelamellae exhibit an optically visible track of fluid inclusions. Thesekinds of planar deformation features (PDFs), as found in quartz, arefeatures associated with limited displacement along crystallo-graphic planes, unlike Mode I microfractures, the orientations ofwhich are a direct response to local deviatoric stresses. Commonlydeformation lamellae are found in metamorphic rocks and associ-ated with features like undulose extinction (e.g., Christie andRaleigh, 1959; McLaren and Hobbs, 1972; Blenkinsop and Drury,1988). Although less common, PDFs can also be found in mineralsdeformed in the brittle field or in igneous bodies where differential
Fig. 8. Microfracture strain versus fold geometry. This example illustrates the use ofmicrofractures to document strain and microfracture abundance variation withstructural position. Strain measurements are derived from microfracture kinematicaperture scan lines. In this example, microfracture abundance was used as a proxy formacrofracture abundance because of sparse core observations of large fractures. Thediagram also compares subsurface core and outcrop data. The asterisk symbol (*) in-dicates an outcrop sample. Here outcrop microfractures are less abundant than thoseof the same Set II microfractures in the subsurface, suggesting that these outcrops donot contain optimal analogs for subsurface structures. Example from Devonian Hua-mampampa Formation (DvH), Subandean ranges fold and thrust belt, fracture set II,Bolivia. Circle size is linearly proportional to fracture strain. BL, back limb; H, hinge;and FL, forelimb. From I~nigo et al. (2012).
Please cite this article in press as: Anders, M.H., et al., Microfractures: A rej.jsg.2014.05.011
cooling can create high intergranular stresses (e.g., Drury, 1993;Anders et al., 2001). B€ohm lamellae (B€ohm, 1883; Groshong,1988), in the broadest sense, are deformation lamellae, typicallywith fluid-inclusion planes that are visible using an optical micro-scope. Although deformation and shock lamellae both can havefluid inclusions along the lamellae, these inclusions typicallycannot be recognized with the magnification of a SEM. Experi-mental studies have shown that deformation lamellae form bydislocations involving glide and climb-control, occurring mostcommonly near or along the basal {0001} plane in quartz (Vernooijand Langenhorst, 2005), similar to Dauphine twins (Wenk et al.,2006). Deformation lamellae are often manifesting as roughlyparallel curviplanar surfaces that are seen, on close inspection, as aseries of anastomosing dislocation surfaces (Vernooij andLangenhorst, 2005; Fig. 1g). Shocked quartz, on the other hand,forms as sharp distinct lamellae along crystallographic planes,often exhibiting multiple planar sets (Fig. 8; Leroux et al., 1994;Grieve et al., 1996). The lamellae in shocked quartz are thinplanes of glass formed along crystallographic planes (Gratz et al.,1996). Annealing can result in precipitation of extremely smallwater bubbles in the lamellae (Grieve et al., 1996; Langenhorst andDeutsch, 1998) not visible optically. For a further discussion oftechniques to distinguish between PDFs andMode I microfractures,see French and Koeberl (2010).
7. Practical use of microfractures
Sampling of fractures that may be more widely spaced thandimensions of the accessible rock volume is a challenge for sys-tematic fracture assessment in subsurface rocks (Narr, 1991; Ortegaet al., 2006). The problem is acute in flat-lying to gently dippingsedimentary rocks, where cores cut at high angles to steeply dip-ping fractures may miss cm- to meter-length fractures that havespacing of tens of centimeters to many meters or more (Gale, 2002;Hooker et al., 2009). Such widely spaced fractures cannot besampled systematically by 20-cm-diameter vertical well bores or10-cm-diameter cores; a consequence is lack of consistent data onfracture orientation and abundance, making it harder to test
view, Journal of Structural Geology (2014), http://dx.doi.org/10.1016/
M.H. Anders et al. / Journal of Structural Geology xxx (2014) 1e1814
models that predict subsurface fracture occurrence e to the detri-ment of efficient fracture assessment in deep, fractured rocks.
If microfractures are part of a population that includes largefractures, microfracture analysis is one way to overcome sparseobservations of large fractures. Microfractures are useful because,in many sandstones and in some other rocks, microfractures aremore abundant than associated macrofractures (Laubach, 1989;Hooker et al., 2014). Individual transgranular microfractures canbe used to determine fracture strike (Laubach, 1997) and micro-fracture size populations can be used to assess fracture abundance(Marrett et al., 1999; Ortega and Marrett, 2000; Hooker et al., 2009;I~nigo et al., 2012). Because they may also be sealed with cement,these structures are inconspicuous unless sought using sensitiveimaging methods such as cathodoluminescence (CL). Neverthelesssealed microfractures may provide information about larger frac-tures that are open because small fractures, with their small vol-ume relative to surface area, seal more readily than wider fractures(Laubach, 2003). If suitable microfractures are present, they can beused to evaluate the number and orientation of fracture sets and,using inexpensive wire line sampling methods, to estimate fractureabundance and quantify fracture-size distribution, even in smallvolumes of rock (Laubach and Gale, 2006) (Fig. 8). Microfracturepopulations can also be used to distinguish between landslide de-tachments and detachments that are tectonic in origin (Anderset al., 2010; 2013). This distinction can be further advanced by CLtechniques where identification of crosscutting relationships foundina microfracture population can establish a movement history.
Another practical use of microfracture studies is to informfurther development of predictive geomechanical and geostatisticalmodels. For example, to simulate the growth of fracture patterns,many current geomechanical models are seeded with micro-fractures, but these are usually introduced at the outset of experi-ments, are large and uniform, and do not have attributes that evolvewith thermal history (and few geomechanical models account forthermal history; Olson et al., 2009, describe an exception). Theseattributes are unlike natural microfractures, which, as we haveseen, may be absent or very sparse in some rocks (Gale et al., 2014)and span a size range of several orders of magnitude (Marrett et al.,1999; Hooker et al., 2014), and may form during protracted defor-mation (Hooker et al., 2012a). In many rocks, microfractures areephemeral mechanical features owing to cement deposition andcreep. This pattern is particularly evident in quartz-rich rocks(Laubach, 2003; Laubach and Diaz-Tushman, 2009) and dolostones(Gale et al., 2010) in which microfracture pore space is systemati-cally destroyed by exposure to high temperatures. Should micro-fractures be introduced into geomechanical models in differentamounts and patterns depending on rock type and thermal his-tory? Will such changes make a difference in the final fracturepattern? Microfracture closure e the way microfractures eitherbecome fossilized by sealing processes or grow to larger sizes e isan area where progress has been impeded by boundaries based onobservation technique (TL versus CL), and by a narrow focus onspecific rock types. Issues such as the evolution of fracture porositywith thermal history, the mechanical effects of the cement itself (ifany) and how size scaling arises (Hooker et al., 2012a; 2013) aretopics where new experiments and theoretical approaches could befruitful.
8. Conclusions and speculation on future research directions
From the first time they were recognized by naturalists usingoptical microscopes, the importance of microfractures as ageological tool has grown. Advances in the 1960s led to an under-standing of the critical function of Mode I microfractures in theinitiation of faults. This work showed how, in experimental
Please cite this article in press as: Anders, M.H., et al., Microfractures: A rej.jsg.2014.05.011
settings, even the smallest faults in brittle rock are preceded by acloud of Mode I microfractures just prior to failure (Brace et al.,1966; Scholz, 1968a; Lockner et al., 1991; Reches and Lockner,1994; Moore and Lockner, 1995). In the 1960s and 1970s,advanceswere made using TL technique to assess paleostress orientations(Wise, 1964; Friedman, 1969; Engelder, 1974; Brock and Engelder,1977). Later these techniques played a critical role in developingtheories about hownatural faults grow in a process zone from smallfaults to larger fault systems (Scholz et al., 1993; Anders andWiltschko, 1994; Wilson et al., 2003; Mitchell and Faulkner,2009). In many rocks, microfractures are filled by cement de-posits, a characteristic particularly evident in quartz-rich rocks andsome carbonates (Laubach, 2003; Gale et al., 2010) where micro-fracture pore space is cement in optical continuity with host rock.Recent advances in microscopy such as SEM, TEM, and CL allowidentification of microfractures in a greater range of rocks and theability to define complex history, including: (1) the character offluids residing in or moving through the rock (Pecher et al., 1985;Lespinasse, 1999; Fall et al., 2012); (2) microfracture porosity as afunction of thermal history; (3) relative timing from crosscuttingrelationships. As we have discussed, advancesmay come frommoreinteraction between researchers focused on natural microfractures,those studying arrays of larger macrofracture networks, and thefluid-inclusion and geochemistry communities, particularlybecause a combination of these approaches can help unravel thetiming and rates of growth of individual fractures and fracturepopulations. The tendency for students of microfractures to focuson specific rock types, notably quartz-rich sandstones, quartzites,and granite, may have been an impediment to progress; universalstructural and geochemical processes may vary in informative waysamong these different host rock types. Microfracture growth inreactive environments is an area where new experiments, theo-retical approaches, and field observations could be fruitful.
Acknowledgments
The authors would like to recognize the contributions, intel-lectual and otherwise, of David V. Wiltschko to our understandingof the importance of microfracturing. Dave was the thesis advisorfor MHA while both were at the University of Michigan. We willmiss him as a scientist but mostly as a friend. We thank RickGroshong, Charlie Onasch, and Tom Blenkinsop for helpful reviewsand Chris Parker for editorial comments. We would also like tothank Maureen M. Anders for help with the graphics. SEL’s work isfunded partly by grant DE-FG02-03ER15430 from Chemical Sci-ences, Geosciences and Biosciences Division, Office of Basic EnergySciences, Office of Science, U.S. Department of Energy and by theFracture Research and Application Consortium.
References
Microfractures: theory
Atkinson, B.K., 1987. Introduction to fracture mechanics and its geophysical appli-cations. In: Atkinson, B.K. (Ed.), Fracture Mechanics of Rock. Academic Press,London, pp. 1e26.
Clark, M.B., Brantley, S.L., Fisher, D.M., 1995. Power-law vein-thickness distributionsand positive feedback in vein growth. Geology 23 (11), 975e978.
Cowie, P.A., Scholz, C.H., 1992. Displacement-length scaling relationship for faults:data synthesis and discussion. J. Struct. Geol. 14 (10), 1149e1156.
Griffith, A.A., 1920. VI. The phenomena of rupture and flow in solids. Phil. Trans. R.Soc. Lond. A 221, 163e198.
Healy, D., Jones, R.R., Holdsworth, R.E., 2006a. New insights into the development ofbrittle shear fractures from a 3D numerical model of microcrack interaction.Earth Planet. Sci. Lett. 249, 14e28.
Healy, D., Jones, R.R., Holdsworth, R.E., 2006b. Three-dimensional brittle shearfracturing by tensile crack interaction. Nature 439, 64e67.
view, Journal of Structural Geology (2014), http://dx.doi.org/10.1016/
M.H. Anders et al. / Journal of Structural Geology xxx (2014) 1e18 15
Hoagland, R.G., Hahn, G.T., Rosenfield, A.R., 1973. Influence of microstructure infracture propagation in rock. Rock Mech. 5, 77e106.
Hooker, J.N., Eichhubl, P., Laubach, S.E., 2012b. Reconstructing the growth of afracture set using fluid inclusion microthermometry, El Alamar Formation(Triassic), NE Mexico (abs.). In: AGU Fall Meeting, Abstract T21A-2556.
Hooker, J.N., Gale, J.F.W., Gomez, L.A., Laubach, S.E., Marrett, R., Reed, R.M., 2009.Aperture-size scaling variations in a low-strain opening-mode fracture set,Cozzette Sandstone, Colorado. J. Struct. Geol. 31, 707e718.
Hooker, J.N., Gomez, L.A., Laubach, S.E., Gale, J.F.W., Marrett, R., 2012a. Effects ofdiagenesis (cement precipitation) during fracture opening on fracture aperture-size scaling in carbonate rocks. In: Garland, J., Neilson, J.E., Laubach, S.E.,Whidden, K.J. (Eds.), Advances in Carbonate Exploration and Reservoir Analysis,Geological Society of London, Special Publication, vol. 370, pp. 187e206. http://dx.doi.org/10.1144/SP370.9.
Hooker, J.N., Laubach, S.E., Gomez, L.A., Marrett, R., Eichhubl, P., Diaz-Tushman, K.,Pinzon, E., 2011. Fracture size, frequency, and strain in the Cambrian EribollFormation sandstones, NW Scotland. Scottish J. Geol. 47, 45e56.
Hooker, J.N., Laubach, S.E., Marrett, R., 2013. Fracture-aperture size e frequency,spatial distribution, and growth processes in strata-bounded and non-strata-bounded fractures, Cambrian Mes�on Group, NW Argentina. J. Struct. Geol. 54,54e71.
Hooker, J.N., Laubach, S.E., Marrett, R., 2014. A universal power-law scaling expo-nent for fracture apertures in sandstone. Geol. Soc. Am. Bull. http://dx.doi.org/10.1130/B30945.1.
Horii, H., Nemat-Nasser, S., 1985. Commpression-induced microcrack growth inbrittle solids: axial splitting and shear failure. J. Geophys. Res. 90 (B),3105e3125.
Irwin, G.R., 1958. Fracture. In: Flugge, S. (Ed.), Handbuch der Physik. Springer-Ver-lag, Berlin, pp. 551e590.
Kranz, R.L., 1983. Microcracks in rocks: a review. Tectonophysics 100, 449e480.Loriga, M.A., 1999. Scaling systematics of vein size: an example from the Guanajuato
mining district (central Mexico). Geol. Soc. London Spec. Pub. 155, 57e67.Marrett, R., 1996. Aggregate properties of fracture populations. J. Struct. Geol. 18 (2/
3), 169e178.Marrett, R., Ortega, O.J., Kelsey, C.M., 1999. Extent of power-law scaling for natural
fractures in rock. Geology 27 (9), 799e802.Narr, W., 1991. Fracture density in the deep subsurface: techniques with application
to Point Arguello oil field. AAPG Bull. 75 (8), 1300e1323.Olson, J.E., 2003. Sublinear scaling of fracture aperture versus length: an exception
of the rule? J. Geophys. Res. 108 (B9), 2413 http://dx.doi.org/10.1029/2001JB000419.
Olson, J.E., Schultz, R.A., 2011. Comments on “a note on the scaling relations foropening mode fractures in rock” by Scholz, C.H. J. Struct. Geol. 33 (10),1523e1524.
Ortega, O.J., Marrett, R., Laubach, S.E., 2006. A scale-independent approach tofracture intensity and average spacing measurement. AAPG Bull. 90 (2),193e208.
Pollard, D.D., Segall, P., Selaney, P.T., 1982. Formation and interpretation of dilatantechelon cracks. Geol. Soc. Am. Bull. 93 (12), 1291e1303.
Schlische, R.W., Young, S.S., Ackermann, R.V., Gupta, A., 1996. Geometry and scalingrelations of a population of very small rift-related normal faults. Geology 24 (8),683e686.
Scholz, C.H., 1995. Fractal transitions on geological surfaces. In: Barton, C.A.,LaPointe, P.R. (Eds.), Fractals in the Earth Sciences. Plenum Press, New York.
Scholz, C.H., 2002. The mechanics of earthquakes and faulting. Cambridge Univer-sity Press, Cambridge, p. 471.
Scholz, C.H., 2010. A note on the scaling relations for opening mode fractures inrock. J. Struct. Geol. 32, 1485e1487.
Scholz, C.H., 2011. Reply to Jon Olson and Richard Schultz. J. Struct. Geol. 33,1525e1526.
Scholz, C.H., Hickman, S.H., 1983. Hysteresis in the closure of a nominally flat crack.J. Geophys. Res. 88, 6501e6504.
Scholz, C.H., Dawers, N.H., Yu, J., Anders, M.H., Cowie, P.A., 1993. Fault growthand fault-scaling laws: preliminary results. J. Geophys. Res. 98 (B12),21951e21961.
Schultz, R.A., Klimczak, C., Fossen, H., Olson, J.E., Exner, U., Reeves, D.M., Soliva, R.,2013. Statistical tests of scaling relationships for geologic structure. J. Struct.Geol. 48, 85e94.
Schultz, R.A., Soliva, R., Fossen, H., Okubo, C.H., Reeves, D.M., 2008. Dependence ofdisplacementelength scaling relations for fractures anddeformation bands onthe volumetric changes across them. J. Struct. Geol. 30, 1405e1411.
Segall, P., 1984. Formation and growth of extensional fracture sets. Geol. Soc. Am.Bull. 95, 454e462.
Simmons, G., Richter, D., 1976. Microcracks in rocks. In: Strens, R.G.J. (Ed.), ThePhysics and Chemistry of Minerals and Rocks. Interscience, New York,pp. 105e137.
Simmons, G., Todd, T., Baldridge, W.S., 1975. Toward a quantitative relationshipbetween elastic properties and cracks in low porosity rocks. Am. J. Sci. 275,318e345.
Sorby, H.C., 1858. On the microscopic structure of crystals, indicating the origin ofminerals and rocks. Geol. Soc. Lond. Q. J. 14, 453e500.
Snow, D.T., 1970. The frequency and apertures of fractures in rock. Int. J. Rock Mech.Mining Sci. 7, 23e40.
Spyropoulos, C., Scholz, C.H., Shaw, B.E., 1999. Transition regimes for growing crackpopulations. Phys. Rev. E. http://dx.doi.org/10.1103/PhysRevE.65.056105.
Please cite this article in press as: Anders, M.H., et al., Microfractures: A rej.jsg.2014.05.011
Vermilye, J.M., Scholz, C.H., 1995. Relation between vein length and aperture.J. Struct. Geol. 17 (3), 423e434.
Wang, C.-Y., Sun, Y., 1990. Orientation microfractures in Cajon Pass drill cores: stressfield near the San Andreas fault. J. Geophys. Res. 95 (B7), 11,135e11142.
Wilson, J.E., Chester, J.S., Chester, F.M., 2003. Microfracture analysis of fault growthand wear processes, Punchbowl Fault, San Andreas system, California. J. Struct.Geol. 25/11, 1855e1873.
Wise, D.U., 2005. Rift and grain in basement thermally triggered snapshots of stressfields during erosional unroofing of the Rocky Mountains of Montana andWyoming. Rocky Mountain Geol. 40 (2), 193e209 http://dx.doi.org/10.2113/40.2.193.
Microfractures: laboratory experiments
Barnhoorn, A., Cox, S.F., Robinson, D.J., Senden, T., 2010. Geology 38 (9), 779e782.Borg, I.Y., Friedman, M., Handin, J., Higgs, D.V., 1960. Experimental deformation of
St. Peter Sand: a study of cataclastic flow. In: Griggs, D., Handin, J. (Eds.), RockDeformation, GSA Memoirs, vol. 79, pp. 133e192 (Chapter 6).
Borg, I.Y., Maxwell, J.C., 1956. Interpretations of fabrics of experimentally deformedsands. Am. J. Sci. 254, 71e81.
Brace, W.F., Orange, A.S., 1968. Electrical resistivity changes in saturated rocksduring fracture and frictional sliding. J. Geophys. Res. 73 (4), 1433e1445.
Brace, W.F., Paulding, B.W., Scholz, C.H., 1966. Dilatancy in the fracture of crystallinerocks. J. Geophys. Res. 71, 3939e3953.
David, C., Wong, T.F., Zhu, W., Zhang, J., 1994. Laboratory measurement ofcompaction-induced permeability change in porous rocks: implications for thegeneration and maintenance of pore pressure excess in the crust. Pure Appl.Geophys. 143 (1-3), 425e456.
Friedman, M., 1963. Petrofabric analysis of experimentally deformed calcite-cemented sandstones. J. Geol. 71, 12e37.
Gallegher, J.J., Friedman, M., Handin, J., Sowers, G.M., 1974. Experimental studiesrelating to microfractures in sandstone. Tectonophysics 21, 203e243.
Gratz, A.J., Fisler, D.K., Bohor, B.F., 1996. Distinguishing shocked from tectonicallydeformed quartz by the use of the SEM and chemical etching. Earth Planet. Sci.Lett. 142 (3), 513e521.
Katz, O., Reches, Z., 2004. Microfracture, damage, and failure in brittle granites.J. Geophys. Res. 109, B01206 http://dx.doi.org/10.1029/2002JB001961.
Kranz, R.L., 1979. Crack growth and development during creep of Barre granite. Int.J. Rock Mech. Mining Sci. 16, 23e35.
Labuz, J.F., Shah, S.P., Dowding, C.H., 1987. The fracture process zone in granite eevidence and effect. Int. J. Rock Mech. Mining Sci. Geomech. Abstr. 24 (4),235e246.
Lockner, D.A., Byerlee, J.D., Kuksenko, V., Ponomarev, A., Sidorin, A., 1991. Quasi-static fault growth and shear fracture energy in granite. Nature 350 (6313),39e42.
Maxwell, J.C., 1960. Experiments on compaction and cementation of sand. In: GSAMemoir, 79, pp. 105e132.
Mogi, K., 1962. Study of elastic shocks caused by the fracture of heterogenousmaterials and their relation to earthquake phenomena. Bull. Earthquake Res.Inst. Univ. Tokyo 40, 125e173.
Mogi, K., 1971. Fracture and flow of rocks under high triaxial compression.J. Geophys. Res. 76, 1255.
Moore, D.E., Lockner, D.A., 1995. The role of microcracking in shear-fracture prop-agation in granite. J. Struct. Geol. 17 (1), 95e114.
Reches, Z., Lockner, D.A., 1994. Nucleation and growth of faults in brittle rocks.J. Geophys. Res. 99 (B9), 18159e18173.
Scholz, C.H., 1968a. Microfracturing and the inelastic deformation of rock incompression. J. Geophys. Res. 73, 1417e1432.
Scholz, C.H., 1968b. Experimental study of the fracturing processes in brittle rock.J. Geophys. Res. 73, 1447e1454.
Scholz, C.H., Koczynski, T.A., 1979. Dilatancy anisotropy and the response of rock tolarge cyclic loads. J. Geophys. Res. 84, 5525e5534.
Spyropoulos, C., Griffith, W.J., Scholz, C.H., Shaw, B.E., 1999. Experimental evidencefor different strain regimes of crack populations in a clay model. Geophys. Res.Lett. 26 (8), 1081e1084.
Swanson, P.L., 1987. Tensile fracture resistance mechanisms in brittle polycrystals:an ultrasonics and in situ microscopy investigation. J. Geophys. Res. 92 (B8),8015e8036.
Tapponnier, P., Brace, W.F., 1976. Development of stress-induced microcracks inWesterly granite. Int. J. Rock Mech. Mining Sci. 13, 103e112.
Tham, L.G., Liu, H., Tang, C.A., Lee, P.K.K., Tsui, Y., 2005. On tension failure of 2-D rockspecimens and associated acoustic emission. Rock Mech. Rock Engin. 38, 1e19.
Timms, N.E., Healy, D., Reyes-Montes, J.M., Collins, D.S., Prior, D.J., Young, R.P., 2010.Effects of crystallographic anisotropy on fracture development and acousticemission in quartz. J. Geophys. Res. 115, B07202 http://dx.doi.org/10.1029/2009JB006765.
Vernooij, M.G.C., Langenhorst, F., 2005. Experimental reproduction of tectonicdeformation lamellae in quartz and comparison to shock-induced planardeformation features. Meteor. Planet. Sci. 40 (9e10), 1353e1361.
Wenk, H.R., Rybacki, E., Dresen, G., Lonardelli, I., Barton, N., Franz, H., Gonzalez, G.,2006. Dauphine twinning and texture memory in polycrystalline quartz. Part 1:experimental deformation of novaculite. Phys. Chem. Miner. 33 (10), 667e676.
Wong, T.-F., 1982. Micromechanics of faulting in Westerly granite. Int. J. Rock Mech.Mining Sci. 19, 49e64.
view, Journal of Structural Geology (2014), http://dx.doi.org/10.1016/
M.H. Anders et al. / Journal of Structural Geology xxx (2014) 1e1816
Wong, T.F., Szeto, H., Zhang, J.X., 1992. Effect of loading path and porosity on thefailure mode of porous rocks. Appl. Mech. Rev. 45 (8), 281e293 http://dx.doi.org/10.1115/1.3119759.
Microfractures: faults, folds and paleostress
Anders, M.H., 1982. Nature of Microfracturing Around Naturally Occurring Faults.MS thesis. University of Michigan, Ann Arbor, Michigan, p. 34.
Anders, M.H., Christie-Blick, N., 1994. Is the Sevier Desert reflection of west-centralUtah a normal fault? Geology 22, 771e774.
Anders, M.H., Fouke, B.W., Zerkle, A.L., Tavarnelli, E., Alvarez, W., Harlow, G.E., 2010.The role of calcining and basal fluidization in the long runout of carbonateslides: an example from the Heart Mountain slide block, Wyoming and Mon-tana, U.S.A. J. Geol. 118, 577e599.
Anders, M.H., Schneider, J.R., Scholz, C.H., Losh, S., 2013. Mode I microfracturing andfluid flow in damage zones: the key to distinguishing faults from slides. J. Struct.Geol. 48, 113e125.
Anders, M.H., Wills, S., Christie-Blick, N., Krueger, S.W., 2001. Rock deformationstudies in the Mineral Mountains and the Sevier Desert of west-central Utah:implications for upper crustal low-angle normal faulting. Geol. Soc. Am. Bull.113, 895e907.
Anders, M.H., Wiltschko, D.V., 1994. Microfracturing, paleostress and the growth offaults. J. Struct. Geol. 16, 795e815.
Aviles, C.A., Scholz, C.H., Boatwright, J., 1987. Fractal analysis applied to character-istic segments of the San Andreas fault. J. Geophys. Res. 92 (B1), 331e344.
Barton, C.A., Zoback, M.D., 1992. Self-similar distribution of macroscopic fractures atdepth in crystalline rock in the Cajon Pass scientific drill hole. J. Geophys. Res.97 (B4), 5181e5200.
Blenkinsop, T.G., 1990. Correlation of paleotectonic fracture and microfracture ori-entations in cores with seismic anisotropy at Cajon Pass drill hole, southernCalifornia. J. Geophys. Res. 95 (B7), 11,143e11,150.
Blenkinsop, T.G., Drury, M.R., 1988. Stress estimates and fault history from quartzmicrostructures. J. Struct. Geol. 10 (7), 673e684.
Bonham, L.C., 1957. Structural petrology of the Pico anticline, Los Angeles County,California. J. Sediment. Petrol. 27, 251e264.
Bouchez, J.L., Delas, C., Gleizes, G., N�ed�elec, A., Cuney, M., 1992. Submagmaticmicrofractures in granites. Geology 20 (1), 35e38.
Brock, W.G., Engelder, T., 1977. Deformation associated with the movement of theMuddy Mountain overthrust in the Buffington window, southeastern Nevada.Geol. Soc. Am. Bull. 88, 1667e1677.
Chester, F.M., Chester, J.S., 2000. Stress and deformation along wavy frictional faults.J. Geophys. Res. 105 (B10), 23421e23430.
Chester, F.M., Logan, J.M., 1986. Implications for mechanical properties of brittlefaults from observations of the Punchbowl fault zone, California. Pure Appl.Geophys. 124 (1e2), 79e106.
Dawers, N.H., Anders, M.H., Scholz, C.H., 1993. Growth of normal faults: displace-ment-length scaling. Geology 21, 1107e1110.
Dezayes, C.T., Villemin, T., Pecher, A., 2000. Microfracture pattern compared to core-scale fractures in the borehole of the Soultz-sous-Forets granite, Rhine graben,France. J. Struct. Geol. 22, 723e733.
Dula Jr., W.F., 1981. Correlation between deformation lamellae, microfractures,macrofractures, and in situ stress measurements, White River Uplift, Colorado.Geol. Soc. Am. Bull. 92, 37e46. Plate 1.
Engelder, J.T., 1974. Cataclasis and the generation of fault gouge. Geol. Soc. Am. Bull.85 (10), 1515e1522.
Faulkner, D.R., Mitchell, T.M., Healy, D., Heap, M.J., 2006. Slip on “weak” faults by therotation of regional stress in the fracture damage zone. Nature 444, 922e925.
Faulkner, D.R., Mitchell, T.M., Jensen, E., Cembrano, J., 2011. Scaling of fault damagezones with displacement and the implications for fault growth processes.J. Geophys. Res. 116, B05403 http://dx.doi.org/10.1029/2010JB007788.
Fisher, Q.J., Knipe, R.J., 1998. Fault sealing processes in siliciclastic sediments. In:Geological Society of London, Special Publication, vol. 147, pp. 117e134 http://dx.doi.org/10.1144/GSL.SP.147.01.08.
French, B.M., Koeberl, C., 2010. The convincing identification of terrestrial meteoriteimpact structures: what works, what doesn't, and why. Earth-Sci. Rev. 98 (1),123e170.
Friedman, M., 1969. Structural analysis of fractures in cores from Saticoy Field,Ventura County, California. AAPG Bull. 53, 367e389.
Grieve, R.A.F., Langenhorst, F., St€offler, D., 1996. Shock metamorphism of quartz innature and experiment: II. Significance in geoscience. Meteor. Planet. Sci. 31 (1),6e35.
Gross, M.R., Engelder, T., 1995. Strain accommodated by brittle failure in adjacentunits of the Monterey Formation, U.S.A.: scale effects and evidence for uniformdisplacement boundary conditions. J. Struct. Geol. 17 (9), 1303e1318.
Gudmundsson, A., 1987. Geometry, formation, and development of tectonic frac-tures on the Reykjanes Peninsula, southwest Iceland. Tectonophysics 139,295e308.
Gupta, A., Scholz, C.H., 2000. Brittle strain regime transition in the Afar depression:implications for fault growth and seafloor spreading. Geology 28, 1087e1090.
Hancock, P.L., 1985. Brittle microtectonics: principles and practice. J. Struct. Geol. 7,437e457.
Hicks, H., 1884. On the Cambrian conglomerates resting upon and in the vicinity ofsome pre-Cambrian rocks (the so-called intrusive masses) in Anglesey andCaernarvonshire. Geol. Soc. Lond. Q. J. 40, 187e199.
Please cite this article in press as: Anders, M.H., et al., Microfractures: A rej.jsg.2014.05.011
Homand, F., Hoxha, D., Belem, T., Pons, M.-N., Hoteit, N., 2000. Geometric analysis ofdamaged microcracks in granite. Mech. Mater. 32, 361e376.
I~nigo, J.F., Laubach, S.E., Hooker, J.N., 2012. Fracture abundance and patterns in theSubandean fold and thrust belt, Devonian Huamampampa Formation petro-leum reservoirs and outcrops, Argentina and Bolivia. Mar. Petrol. Geol. 35,201e218.
Ismat, Z., 2008. Folding kinematics expressed in fracture patterns: an example fromthe anti-Atlas fold belt, Morocco. J. Struct. Geol. 30 (11), 1396e1404 http://dx.doi.org/10.1016/j.jsg.2008.07.010.
Ismat, Z., Mitra, G., 2005. Folding by cataclastic flow: evolution of controlling factorsduring deformation. J. Struct. Geol. 27 (12), 2181e2203 http://dx.doi.org/10.1016/j.jsg.2005.08.005.
Jang, B.A., Wang, H.F., Ren, X., Kowallis, B., 1989. Precambrian paleostress frommicrocracks and fluid inclusions in the Wolf River batholith of Central Wis-consin. Geol. Soc. Am. Bull. 101, 1457e1464.
Kanaori, Y., 1986. A SEM cathodoluminescence study of quartz in mildly deformedgranite from the region of the Atotsugawa fault, central Japan. Tectonophysics131, 133e146.
Kanaori, Y., Yairi, K., Ishida, T., 1991. Grain boundary microcracking of granitic rocksfrom the northeastern region of the Atotsugawa fault, central Japan: SEMbackscattered electron images. Eng. Geol. 30, 221e235.
Knipe, R.J., Lloyd, G.E., 1994. Microstructural analysis of faulting in quartzite, Assynt,NW Scotland: implications for fault zone evolution. Pure Appl. Geophys. 142,229e254.
Knipe, R.J., White, S.H., 1979. Deformation in low grade shear zones in the Old RedSandstone, S.W. Wales. J. Struct. Geol. 1, 53e66.
Kowallis, B.J., Wang, H.F., Jang, B.-A., 1987. Healed microcrack orientations in granitefrom Illinois borehole UPH-3 and their relationship to the rock’s stress history.Tectonophysics 135, 297e306.
Langenhorst, F., Deutsch, A., 1998. Minerals in terrestrial impact structures and theircharacteristic features. In: Marfunin, A.S. (Ed.), Advanced Mineralogy, vol. 3.Springer, Berlin, pp. 95e119.
Laubach, S.E., Diaz-Tushman, K., 2009. Laurentian paleostress trajectories andephemeral fracture permeability, Cambrian Eriboll Formation sandstones westof the Moine thrust zone, northwest Scotland. J. Geol. Soc. Lond. 166 (2),349e362.
Laubach, S.E., Gale, J.F.W., 2006. Obtaining fracture information for low-permeability (tight) gas sandstones from sidewall cores. J. Petrol. Geol. 29 (2),147e158.
Laubach, S.E., Olson, J.E., Gale, J.F.W., 2004b. Are open fractures necessarily alignedwith maximum horizontal stress? Earth Planet. Sci. Lett. 222 (1), 191e195.
Laubach, S.E., Olson, J.E., Gross, M.R., 2009. Mechanical and fracture stratigraphy.AAPG Bull. 93, 1413e1426.
Lespinasse, M., Cathelineau, M., 1995. Paleostress magnitudes determination byusing fault slip and fluid inclusions planes data. J. Geophys. Res. 100 (B3),3895e3904.
Lespinasse, M., Pecher, A., 1986a. Microfracturing and regional stress field: a studyof the preferred orientations of fluid-inclusion planes in a granite from theMassif Central, France. J. Struct. Geol. 8 (2), 169e180.
Lloyd, G.E., Knipe, R.J., 1992. Deformation mechanisms accommodating faulting ofquartzite under upper crustal conditions. J. Struct. Geol. 14, 127e143.
Leroux, H., Reimold, W.U., Doukhan, J.C., 1994. A TEM investigation of shockmetamorphism in quartz from the Vredefort dome, South Africa. Tectonophy-sics 230 (3), 223e239.
Mancktelow, N.S., Pennacchioni, G., 2013. Late magmatic healed fractures in gran-itoids and their influence on subsequent solid-state deformation. J. Struct. Geol.http://dx.doi.org/10.1016/j.jsg.2013.09.006.
Martin, P., Bergerat, F., 1996. Palaeo-stress inferred from macro- and microfracturesin Balazuc-1 borehole (GPF programme). Contribution to the tectonic evolutionof the Cevennes border of the SE basin of France. Mar. Petrol. Geol. 13, 671e684.
McLaren, A.C., Hobbs, B.E., 1972. Transmission electron microscope investigation ofsome naturally deformed quartzites. Geophys. Monogr. Ser. 16, 55e66.
Mitchell, T.M., Faulkner, D.R., 2009. The nature and origin of off-fault damage sur-rounding strike-slip fault zones with a wide range of displacements: a fieldstudy from the Atacama fault system, northern Chile. J. Struct. Geol. 31 (8),802e816.
Mitchell, T.M., Faulkner, D.R., 2012. Toward quantifying the matrix permeability offault damage zones in lowporosity rocks. Earth Planet. Sci. Lett. 339e340, 24e31.
Mitra, S., 1987. Regional variations in deformation mechanisms and structural stylesin the central Appalachian orogenic belt. Geol. Soc. Am. Bull. 98, 569e590.
Mizoguchi, K., Ueta, K., 2013. Microfractures within the fault damage zone recordthe history of fault activity. Geophys. Res. Lett. 40 (8), 2023e2027 http://dx.doi.org/10.1002/grl.50469.
Nadan, B.J., Engelder, T., 2009. Microcracks in New England granitoids: a record ofthermoelastic relaxation during exhumation of intracontinental crust. Geol. Soc.Am. Bull. 121, 80e99.
Narahara, D.K., Wiltschko, D., 1986. Deformation in the hinge region of a chevronfold, Valley and Ridge province, central Pennsylvania. J. Struct. Geol. 8, 157e168.
Nur, A., Simmons, G., 1970. The origin of small cracks in igneous rocks. Int. J. RockMech. Mining Sci. 7, 307e314.
Onasch, C.M., 1990. Microfractures and their role in deformation of quartz arenitefrom the central Appalachian foreland. J. Struct. Geol. 12, 883e894.
Onasch, C.M., Dunne, W.M., Cook, J.E., O’Kane, A., 2009. The effect of fluidcomposition on the behavior of well cemented, quartz-rich sandstone duringfaulting. J. Struct. Geol. 31 (9), 960e971.
view, Journal of Structural Geology (2014), http://dx.doi.org/10.1016/
M.H. Anders et al. / Journal of Structural Geology xxx (2014) 1e18 17
Onasch, C.M., Vennemann, T.W., 1995. Disequilibrium partitioning of oxygen iso-topes associated with sector zoning in quartz. Geology 23 (12), 1103e1106.
Passchier, C.W., Trouw, R.J., 2005. Microtectonics. Springer Verlag, p. 322.Plumb, R.A., Engelder, T., Yale, D., 1984. Near-surface in situ stress 3. Correlation
with microcrack fabric within New Hampshire granites. J. Geophys. Res. 89,9350e9364.
Power, W.L., Tullis, T.E., Brown, S.R., Boinott, G.N., Scholz, C.H., 1987. Roughness ofnatural fault surfaces. Geophys. Res. Lett. 14, 29e32.
Price, N.J., 1966. Fault and Joint Development in Brittle and Semi-brittle Rock.Pergamon, Oxford, p. 176.
Rempe, M., Mitchell, T., Renner, J., Nippress, S., Ben-Zion, Y., Rockwell, T., 2013.Damage and seismic velocity structure of pulverized rocks near the San AndreasFault. J. Geophys. Res. 118, 2813e2831.
Ren, X., Kowallis, B.J., Best, M.G., 1989. Paleostress history of the Basin and Rangeprovince in western Utah and eastern Nevada from healed microcrack orien-tations in granites. Geology 17, 487e490.
Riley, N.A., 1947. Structural petrology of the Baraboo Quartzite. J. Geol. 55/6,453e475.
Savage, H.M., Brodsky, E.E., 2011. Collateral damage: evolution with displacement offracture distribution and secondary fault strands in fault damage zones.J. Geophys. Res. 116, B03405.
Segall, P., Pollard, D.D., 1980. Mechanics of discontinuous faults. J. Geophys. Res. 85(B8), 4337e4350.
Shipton, Z.K., Cowie, P.A., 2001. Damage zone and slip-surface evolution over mm tokm scales in high-porosity Navajo sandstone, Utah. J. Struct. Geol. 23 (12),1825e1844.
Suzuki, T., 2012. Understanding of dynamic earthquake slip behavior using damageas a tensor variable: microcrack distribution, orientation, and mode and sec-ondary faulting. J. Geophys. Res. 117, B05309.
Tarr, R.S., 1891. The phenomenon of rifting in granite. Am. J. Sci. (Third Series) CXLI,267e272.
Vermilye, J.M., Scholz, C.H., 1998. The process zone: a microstructural view of faultgrowth. J. Struct. Geol. 103 (B6), 12,223e12,237.
Vollbrecht, A., Rust, S., Weber, K., 1991. Development of microcracks in granitesduring cooling and uplift: examples from the Variscan basement in NE Bavaria,Germany. J. Struct. Geol. 13, 787e799.
Vollbrecht, A., Stipp, M., Olesen, N.O., 1999. Crystallographic orientation of micro-cracks in quartz and inferred deformation processes: a study of gneisses fromthe German Continental Deep Drilling Project (KTB). Tectonophysics 303,279e297.
Microfractures: fluids and diagenesis
Anderson, A.J., Bodnar, R.J., 1993. An adaptation of the spindle stage for geometricanalysis of fluid inclusions. Am. Mineral. 78, 657e664.
Apaydin, O.G., Ozkan, E., Raghavan, R., 2012. Effect of discontinuous microfractureson ultratight matrix permeability of a dual-porosity medium. SPE Reserv. Eval.Eng. 15, 473e485.
Bai, T., Pollard, D.D., Gao, H., 2000. Explanation for fracture spacing in layeredmaterial. Nature 403 (6771), 753e756.
Batzle, M.L., Simmons, G., 1976. Microfractures in rocks from two geothermal areas.Earth Planet. Sci. Lett. 30/1, 71e93.
Becker, S.P., Eichhubl, P., Laubach, S.E., Reed, R.M., Lander, R.H., Bodnar, R.J., 2010.A 48 m.y. history of fracture opening, temperature, and fluid pressure: Creta-ceous Travis Peak Formation, East Texas basin. Geol. Soc. Am. Bull. 122,1081e1093.
Boiron, M.C., Essarraj, S., Sellier, E., Cathelineau, M., Lespinasse, M., Poty, B., 1992.Identification of fluid inclusions in relation to their host microstructural do-mains in quartz by cathodoluminescence. Geochim. Cosmochim. Acta 56 (1),175e185.
Boullier, A.-M., 1999. Fluid inclusions: tectonic indicators. J. Struct. Geol. 21 (8),1229e1235.
Boullier, A.-M., Robert, F., 1992. Textures and orientation of fluid inclusion planes ingold-quartz vein networks, Val d’Or, Abitibi, Quebec, Canada. J. Struct. Geol. 14,161e179.
Brantley, S.L., 1990. The effect of fluid chemistry on quartz microcrack lifetimes.Earth Planet. Sci. Lett. 113, 145e156.
Brantley, S.L., Evans, B., Hickman, S.H., Crerar, D.A., 1990. Healing of microcracks inquartz: implications for fluid flow. Geology 18, 136e139.
Burley, S.D., Mullis, J., Matter, A., 1989. Timing diagenesis in the Tartan reservoir (UKNorth Sea): constraints from combined cathodoluminescence and fluid inclu-sion studies. Mar. Petrol. Geol. 6, 98e120.
Capuano, R.M., 1993. Evidence of fluid flow in microfractures in geopressuredshales. AAPG Bull. 77 (8), 1303e1314.
Cathelineau, M., Lespinasse, M., Bastoul, A.M., Bernard, C., Leroy, J., 1990. Fluidmigration during contact metamorphism: the use of oriented fluid inclusiontrails for a time/space reconstruction. Mineral. Mag. 54 (2), 169e172.
Crawford, M.L., 1992. Fluid inclusions e what can we learn? Earth Sci. Rev. 32,137e139.
Davies, G.R., Smith, L.B., 2006. Structurally controlled hydrothermal dolomitereservoir facies: an overview. AAPG Bull. 90 (11), 1641e1690.
Davy, P., Le Groc, R., Darcel, C., Bour, O., de Dreuzy, J.R., Munier, R., 2010. A likelyuniversal model of fracture scaling and its consequence for crustal hydrome-chanics. J. Geophys. Res. 115, B10411, http://dx.doi.org/10.1029/2009JB007043.
Please cite this article in press as: Anders, M.H., et al., Microfractures: A rej.jsg.2014.05.011
Dickenson, W.W., Milliken, K.L., 1995. The diagenetic role of brittle deformation incompaction and pressure solution, Etjo sandstone, Namibia. J. Geol. 103/3,339e347.
Eichhubl, P., Hooker, J.N., Laubach, S.E., 2010. Pure and shear-enhanced compactionbands in Aztec Sandstone. J. Struct. Geol. 32 (12), 1873e1886 http://dx.doi.org/10.1016/j.jsg.2010.02.004.
Ellis, M.A., Laubach, S.E., Eichhubl, P., Olson, J.E., Hargrove, P., 2012. Fracturedevelopment and diagenesis of Torridon Group Applecross Formation, near AnTeallach, NW Scotland: millennia of brittle deformation resilience? J. Geol. Soc.Lond. 169, 297e310.
Engvik, A.K., Bertram, A., Kalthoff, J.F., St€ockhert, B., Austrheim, H., Elvevold, S.,2005. Magma-driven hydraulic fracturing and infiltration of fluids into thedamaged host rock, an example from Dronning Maud Land, Antarctica. J. Struct.Geol. 27 (5), 839e854.
Engvik, L., St€ockhert, B., Engvik, A.K., 2009. Fluid infiltration, heat transport, andhealing of microcracks in the damage zone of magmatic veins: numericalmodeling. J. Geophys. Res. 114 (B5), B05203.
Evans, M.A., 1995. Fluid inclusions in veins from the Middle Devonian shales: arecord of deformation conditions and fluid evolution in the AppalachianPlateau. Geol. Soc. Am. Bull. 107, 327e339.
Fall, A., Eichhubl, P., Cumella, S.P., Bodnar, R.J., Laubach, S.E., Becker, S.P., 2012.Testing the basin-centered gas accumulation model using fluid inclusion ob-servations: Southern Piceance Basin, Colorado. AAPG Bull. 96 (12), 2297e2318http://dx.doi.org/10.1306/05171211149.
Fischer, M.P., Higuera-Diaz, I.C., Evans, M.A., Perry, E.C., Lefticariu, L., 2009. Fracture-controlled paleohydrology in a map-scale detachment fold: insights from theanalysis of fluid inclusions in calcite and quartz veins. J. Struct. Geol. 31,1490e1510.
Fisher, Q.J., Casey, M., Harris, S.D., Knipe, R.J., 2003. Fluid-flow properties in sand-stone: the importance of temperature history. Geology 3/11, 965e968. http://dx.doi.org/10.1130/G19823.1.
Gale, J.F.W., 2002. Specifying lengths of horizontal wells in fractured reservoirs. SPEReserv. Eval. Eng. 5 (3), 266e272.
Gale, J.F.W., Laubach, S.E., Marrett, R.A., Olson, J.E., Holder, J., Reed, R.M., 2004.Predicting and characterizing fractures in dolostone reservoirs: using the linkbetween diagenesis and fracturing. The geometry and petrogenesis of dolomitehydrocarbon reservoirs. In: Geological Society of London, Special Publication,vol. 235, pp. 177e192.
Gale, J.F.W., Reed, R.M., Holder, J., 2007. Natural fractures in the Barnett Shale andtheir importance for hydraulic fracture treatments. AAPG Bull. 91, 603e622.
Gale, J.F.W., Lander, R.H., Reed, R.M., Laubach, S.E., 2010. Modeling fracture porosityevolution in dolostone. J. Struct. Geol. 32 (9), 1201e1211 http://dx.doi.org/10.1016/j.jsg.2009.04.018.
Gale, J.F.W., Laubach, S.E., Olson, J.E., Eichhubl, P., Fall, A., 2014. Natural fractures inshale: a review and new observations. AAPG Bull. (in press).
Goldstein, R.H., Reynolds, T.J., 1994. Systematics of fluid inclusions in diageneticminerals. In: SEPM (Society for Sedimentary Geology) Short Course, vol. 31,p. 199.
Guerriero, V., Iannace, A., Mazzoli, S., Parente, M., Vitale, S., Giorgioni, M., 2010.Quantifying uncertainties in multi-scale studies of fractured reservoir ana-logues: implemented statistical analysis of scan line data from carbonate rocks.J. Struct. Geol. 32, 1271e1278.
Hay, S.J., Hall, J., Simmons, G., Russell, M.J., 1988. Sealed microcracks in the Lewisianof NW Scotland: a record of 2 billion years of fluid circulation. J. Geol. Soc. Lond.145, 819e830.
Hilgers, C., Kirschner, D.L., Breton, J.-P., Urai, J.L., 2006. Fracture sealing and fluidoverpressures in limestones of the Jabal Akhdar dome, Oman mountains.Geofluids 6, 168e184.
Hooker, J.N., Laubach, S.E., 2007. The geologic history of quartz grains, as revealed bycolor SEM-CL. Gulf Coast Assoc. Geol. Soc. Trans. 57, 375e386.
Hu, M.S., Evans, A.G., 1989. The cracking and decohesion of thin-films on ductilesubstrates. Acta Metall. 37 (3), 917e925.
Kranz, R.L., Frankel, A.D., Engelder, T., Scholz, C.H., 1979. The permeability of wholeand jointed Barre Granite. Int. J. Rock Mech. Min. Sci. Abstr. 16, 225e234.
Kruhl, J.H., Wirth, R., Morales, L.F.G., 2013. Quartz grain boundaries as fluid path-ways in metamorphic rocks. J. Geophys. Res. 118, 1e11.
Kupecz, J.A., Land, L.S., 1991. Late diagenetic dolomitization of the Lower Ellen-burger group, West Texas. J. Sediment. Petrol. 61 (4), 551e574.
Lander, R.H., Larese, R.E., Bonnell, L.M., 2008. Toward more accurate quartz cementmodels e the importance of euhedral vs. non-euhedral growth rates. AAPG Bull.92, 1537e1564.
Lander, R.H., Laubach, S.E., 2014. Insights into rates of fracture growth and sealingfrom a model of quartz cementation in fractured sandstones. GSA Bull..
Lash, G.G., Engelder, T., 2005. An analysis of horizontal microcracking duringcatagenesis: example from the Catskill delta complex. AAPG Bull. 89,1433e1449.
Laubach, S.E., 1988a. Fractures generated during folding of the Palmerton Sand-stone, Eastern Pennsylvania. J. Geol. 96, 495e503.
Laubach, S.E., 1988b. Subsurface fractures and their relationship to stress history inEast Texas Basin sandstone. Tectonophysics 156, 37e49.
Laubach, S.E., 1989. Paleostress directions from the preferred orientation of closedmicrofractures (fluid-inclusion planes) in sandstone, East Texas basin, U.S.A.J. Struct. Geol. 11/5, 603e611.
Laubach, S.E., 1997. A method to detect natural fracture strike in sandstones. AAPGBull. 81 (4), 604e623.
view, Journal of Structural Geology (2014), http://dx.doi.org/10.1016/
M.H. Anders et al. / Journal of Structural Geology xxx (2014) 1e1818
Laubach, S.E., 2003. Practical approaches to identifying sealed and open fractures.AAPG Bull. 87 (4), 561e579.
Laubach, S.E., Reed, R.M., Olson, J.E., Lander, R.H., Bonnell, L.M., 2004a. Coevolution ofcrack-seal texture and fracture porosity in sedimentary rocks: cath-odoluminescenceobservationsof regional fractures. J. Struct.Geol. 26 (5), 967e982.
Laubach, S.E., Ward, M.E., 2006. Diagenesis in porosity evolution of opening-modefractures, Middle Triassic to Lower Jurassic La Boca Formation, NE Mexico.Tectonophysics 419 (1e4), 75e97.
Lemmlein, G.C., Kliya, M.O., 1960. Distinctive features of the healing of a crack in acrystal under conditions of declining temperature. Int. Geol. Rev. 2, 125e128.
Lespinasse, M., 1999. Are fluid inclusion planes useful in structural geology?J. Struct. Geol. 21 (8), 1237e1243.
Lespinasse, M., Cathelineau, M., 1990. Fluid percolations in a fault zone: a study offluid inclusion planes in the St Sylvestre granite, northwest Massif Central,France. Tectonophysics 184 (2), 173e187.
Lespinasse, M., D�esindes, L., Fratczak, P., Petrov, V., 2005. Microfissural mapping ofnatural cracks in rocks: implications for fluid transfers quantification in thecrust. Chem. Geol. 223 (1), 170e178.
Marquez, X.M., Mountjoy, E.W., 1996. Microfractures due to overpressures causedby thermal cracking in well-sealed Devonian reservoirs, deep Alberta basin,Canada. AAPG Bull. 80 (4), 570e588.
Meere, P.A., 1995. High and low density fluids in a quartz vein from the IrishVariscides. J. Struct. Geol. 17 (3), 435e446.
Milliken, K.L., 1994. The widespread occurrence of healed microfractures in silici-clastic rocks: evidence from scanned cathodoluminescence imaging. In:Nelson, P.P., Laubach, S.E. (Eds.), Rock Mechanics: Models and Measurements,Challenges from Industry, 1st North American Rock Mechanics Symposium. A.A.Balkema, Rotterdam, pp. 825e832.
Milliken, K.L., Laubach, S.E., 2000. Brittle deformation in sandstone diagenesis asrevealed by scanned cathodoluminescence imaging with application to char-acterization of fractured reservoirs. In: Pagel, M., Barbin, V., Blanc, P.,Ohnenstetter, D. (Eds.), Cathodoluminescence in Geosciences. Springer Verlag,New York, pp. 225e243 (Chapter 9).
Milliken, K.L., Reed, R.M., Laubach, S.E., 2005. Quantifying compaction andcementation within deformation bands in porous sandstones. In: Sorkhabi, R.,Tsuji, Y. (Eds.), Faults, Fluid Flow and Petroleum Traps, AAPG Memoir, vol. 85,pp. 237e249.
Montanez, I.P., Read, J.F., 1992. Fluid-rock interaction history during stabilization ofearly dolomites, upper Knox Group (Lower Ordovician), US Appalachians.J. Sediment. Res. 62 (5), 753e778.
Mork, M.B.E., Moen, K., 2007. Compaction microstructures in quartz grains andquartz cement in deeply buried reservoir sandstones using combined petrog-raphy and EBSD analysis. J. Struct. Geol. 29 (11), 1843e1854.
Nelson, R.A., 1985. Geologic Analysis of Naturally Fractured Reservoirs. Gulf Pub-lishing, Houston, p. 320.
Olson, J.E., Laubach, S.E., Lander, R.H., 2009. Natural fracture characterization intight gas sandstones: integrating mechanics and diagenesis. AAPG Bull. 93,1535e1549.
Pagel, M., Barbin, V., Blanc, P., Ohnenstetter (Eds.), 2000. Cathodoluminescence inGeosciences. Springer-Verlag,, New York.
Pecher, A., Lespinasse, M., Leroy, J., 1985. Relations between fluid inclusion trails andregional stress field: a tool for fluid chronology e an example of an intragraniticuranium ore deposit (northwest Massif Central, France). Lithos 18, 229e237.
Roberts, J.C., 1965. Quartz microfracturing in the north crop of the South WalesCoalfield. Geol. Mag. 102, 59e72.
Roedder, E., 1984. Fluid inclusions. In: Ribbe, P.H. (Ed.), Reviews in Mineralogy, vol.12. Mineralogical Society of America, Washington, D.C, p. 644.
Sibley, D.F., Blatt, H., 1976. Intergranular pressure solution and cementation of theTuscarora orthoquartzite. J. Sediment. Res. 46, 881e896.
Sipple, R.F., 1968. Sandstone petrology, evidence from luminescence petrography.J. Sediment. Petrol. 38, 530e554.
Smith, D.L., Evans, B., 1984. Diffusional crack healing in quartz. J. Geophys. Res. 89,4125e4135.
Sprunt, E.S., Nur, A., 1979. Microcracking and healing in granites: new evidencefrom cathodoluminescence. Science 205, 495e497.
Tuttle, O.F., 1949. Structural petrology of planes of liquid inclusions. J. Geol. 57,331e356.
Trav�e, A., Labaume, P., Verg�es, J., 2007. Fluid systems in foreland fold-and-thrustbelts: an overview from the southern Pyrenees. In: Lacombe, O., Roure, F.,Lav�e, J., Verg�es, J. (Eds.), Thrust Belts and Foreland Basins. Springer, Berlin,pp. 93e115.
Walderhaug, O., 1994. Precipitation rates for quartz cement in sandstones deter-mined by fluid-inclusion microthermometry and temperature-historymodeling. J. Sediment. Res. A64 (2), 324e333.
Please cite this article in press as: Anders, M.H., et al., Microfractures: A rej.jsg.2014.05.011
Walsh, J.B., Brace, W.F., 1984. The effect of pressure on porosity and the transportproperties of rock. J. Geophys. Res. 89 (B11), 9425e9431.
Wise, D.U., 1964. Microjointing in basement, middle Rocky Mountains of Montanaand Wyoming. Geol. Soc. Am. Bull. 75, 287e306.
Microfractures: geophysical properties
Crampin, S., 1987. Geological and industrial applications of extensive-dilatancyanisotropy. Nature 328, 491e496.
Crampin, S., 1994. The fracture criticality of crustal rocks. Geophys. J. Int. 118 (2),428e438.
Hall, J., 1987. Physical properties of Lewisian rocks: implications for deep crustalstructure. In: Geological Society of London, Special Publication, vol. 27,pp. 185e192.
Marrett, R., Laubach, S.E., Olson, J.E., 2007. Anisotropy and beyond: geologic per-spectives on geophysical prospecting for natural fractures. Leading Edge 26/9,1106e1111.
Sayers, C.M., Kachanov, M., 1995. Microcrack-induced elastic wave anisotropy ofbrittle rocks. J. Geophys. Res. 100 (B3), 4149e4156 http://dx.doi.org/10.1029/94JB03134.
Microfractures: joints, veins, and lamellae
Baecher, G.B., Lanney, N.A., 1978. Trace length biases in joint surveys. In: 19th U.S.Symposium on Rock Mechanics. University of Nevada, Reno, pp. 56e65.
Boggs Jr., S., Krinsley, D., 2006. Application of Cathodoluminescence Imaging to theStudy of Sedimentary Rocks. Cambridge University Press, Cambridge, p. 165.
B€ohm, A., 1883. Über Gesteine des Wechsels. Tschermaks Mineral. Petrogr. Mitteil.5, 197e214.
Christie, J.M., Raleigh, C.B., 1959. The origin of deformation lamellae in quartz. Am. J.Sci. 257, 385e407.
Dale, T.N., 1908. The chief commercial granites of Massachusetts, New Hampshire,and Rhode Island. U.S. Geol. Surv. Bull. 354, 228.
Dale, T.N.,1923. The commercial granites ofNewEngland.U.S. Geol. Surv. Bull. 738, 488.Delaney, P.T., Pollard, D.D., Ziony, J.I., McKee, E.H., 1986. Field relations between
dikes and joints e emplacement processes and paleostress analysis. J. Geophys.Res. e Solid Earth 91, 4920e4938.
Drury, M.R., 1993. Deformation lamellae in metals and minerals. In: Boland, J.N.,Fitzgerald, J.D. (Eds.), Defects and Processes in the Solid State: Geoscience Ap-plications: McLaren Volume. Elsevier, Amsterdam, The Netherlands,pp. 195e212.
Fleischmann, K.H., 1990. Rift and grain in two granites of the White Mountainmagma series. J. Geophys. Res. 95, 21463e21474.
Gillespie, P.A., Walsh, J.J., Watterson, J., Bonson, C.G., Manzocchi, T., 2001. Scalingrelationships of joint and vein arrays from The Burren, Co. Clare, Ireland.J. Struct. Geol. 23, 183e201.
Gomez, L.A., Laubach, S.E., 2006. Rapid digital quantification of microfracturepopulations. J. Struct. Geol. 28, 408e420.
Groshong, R.H., 1988. Low-temperature deformation mechanisms and their inter-pretation. Geol. Soc. Am. Bull. 100, 1329e1360.
Harper, M.L., 1966. Joints and microfractures in Glenwood Canyon, Colorado.Mountain Geol. 3 (4), 185e192.
Holzhausen, G.R., 1977. Sheet Structure in Rock and Some Related Problems in RockMechanics. Stanford University. Unpublished Ph.D. dissertation.
Ingerson, E., Tuttle, O.F., 1948. Relations of lamellae and crystallography of quartzand fabric directions in some deformed rocks. Am. Geophys. Union Trans. 26,95e105.
Laubach, S.E., Marrett, R., Olson, J., Scott, A.R., 1998. Characteristics and origins ofcoal cleat: a review. Int. J. Coal Geol. 35, 175e207.
Lyell, C., Deshayes, G.P., 1830. Principles of Geology: Being An Attempt to Explainthe Former Changes of the Earth’s Surface, by Reference to Causes Now inOperation, vol. 1. John Murray, London.
Ortega, O.O., Marrett, R., 2000. Prediction of macrofracture properties usingmicrofracture information, Mesaverde Group sandstones, San Juan Basin, NewMexico. J Struct Geol 22, 571e588.
Pollard, D.D., Aydin, A., 1988. Progress in understanding jointing over the pastcentury. Geol. Soc. Am. Bull. 100, 1181e1204.
Tuttle, O.F., 1945. Relations of lamellae and crystallography of quartz andfabric directions in some deformed rocks. Am. Geophys. Union Trans. XXVI,95e105.
view, Journal of Structural Geology (2014), http://dx.doi.org/10.1016/