journal of structural biologynoodle.med.yale.edu/hdtag/papers/tagare_jsb_2015.pdf · structural...
TRANSCRIPT

Journal of Structural Biology 191 (2015) 245–262
Contents lists available at ScienceDirect
Journal of Structural Biology
journal homepage: www.elsevier .com/locate /y jsbi
Directly reconstructing principal components of heterogeneous particlesfrom cryo-EM images
http://dx.doi.org/10.1016/j.jsb.2015.05.0071047-8477/� 2015 Elsevier Inc. All rights reserved.
⇑ Corresponding author at: Dept. of Diagnostic Radiology, Yale University, CT06520, United States.
E-mail address: [email protected] (H.D. Tagare).
Hemant D. Tagare a,b,⇑, Alp Kucukelbir c,d, Fred J. Sigworth e,b, Hongwei Wang f, Murali Rao g
a Dept. of Diagnostic Radiology, Yale University, CT 06520, United Statesb Dept. of Biomedical Engineering, Yale University, CT 06520, United Statesc Data Science Institute, Columbia University, NY 10027, United Statesd Dept. of Computer Science, Columbia University, NY 10027, United Statese Dept. of Cellular and Molecular Physiology, Yale University, CT 06520, United Statesf Center for Struct. Biol., School of Life Sciences, Tsinghua University, Beijing 100084, Chinag Dept. of Mathematics, University of Florida, FL 32611-8105, United States
a r t i c l e i n f o
Article history:Received 26 January 2015Received in revised form 21 May 2015Accepted 28 May 2015Available online 4 June 2015
Keywords:Single particle reconstructionHeterogeneityMaximum-likelihoodEM algorithmPrincipal components
a b s t r a c t
Structural heterogeneity of particles can be investigated by their three-dimensional principal compo-nents. This paper addresses the question of whether, and with what algorithm, the three-dimensionalprincipal components can be directly recovered from cryo-EM images. The first part of the paper extendsthe Fourier slice theorem to covariance functions showing that the three-dimensional covariance, andhence the principal components, of a heterogeneous particle can indeed be recovered fromtwo-dimensional cryo-EM images. The second part of the paper proposes a practical algorithm for recon-structing the principal components directly from cryo-EM images without the intermediate step of cal-culating covariances. This algorithm is based on maximizing the posterior likelihood using theExpectation–Maximization algorithm. The last part of the paper applies this algorithm to simulated dataand to two real cryo-EM data sets: a data set of the 70S ribosome with and without Elongation Factor-G(EF-G), and a data set of the influenza virus RNA dependent RNA Polymerase (RdRP). The first principalcomponent of the 70S ribosome data set reveals the expected conformational changes of the ribosomeas the EF-G binds and unbinds. The first principal component of the RdRP data set reveals a conforma-tional change in the two dimers of the RdRP.
� 2015 Elsevier Inc. All rights reserved.
1. Introduction
The three-dimensional principal components of heterogeneousparticles are, loosely speaking, the primary ‘‘modes’’ of structuralchange in those particles. Principal components are biologicallyquite relevant. Each principal component informs us about partsof the structure that vary together in a coordinated manner. Akey question in single particle electron cryo-microscopy(cryo-EM) is whether the principal components of heterogeneousthree-dimensional structures can be reconstructed directly fromthe two-dimensional cryo-EM images. The goal of this article isto address this question from a theoretical as well as a practicaland algorithmic point of view.
Classical cryo-EM reconstruction methods can be used to obtainprincipal components indirectly: these methods are used to recon-struct a number of different structures from the cryo-EM images.Then, the covariance of the reconstructed structures is taken asan estimate of the true three-dimensional covariance of the hetero-geneous particle, and principal components are calculated aseigenvectors of the covariance. The difference between variousreported methods lies in the reconstruction step. One approachassumes that the heterogeneous sample is a mixture of particleswith a finite number of different structures. The particles in themixture are recovered using the Expectation–Maximization algo-rithm (the EM algorithm). This approach is employed by severalcryo-EM packages, e.g. Xmipp (Scheres et al., 2007), RELION(Scheres, 2012a,b), and FREALIGN (Lyumkis et al., 2013). Anotherapproach employs the bootstrap (Penczek et al., 2011). It samplesthe cryo-EM images with replacement, and reconstructs a largenumber of three-dimensional structures from the bootstrappedsamples.
246 H.D. Tagare et al. / Journal of Structural Biology 191 (2015) 245–262
A more recent method to understand heterogeneity usesLaplacian eigenmaps to organize cryo-EM images into a lowdimensional manifold from which an energy landscape is obtained(Dashti et al., 2014). 2D movies of the heterogeneity are createdalong a trajectory in the energy landscape. These movies aregenerated for paths corresponding to different orientations andpatch information from different orientations is compiled into a3D movie.
A different approach to understanding heterogeneity bypassesthe reconstruction step and directly models and estimates thecovariance of the structures. In Zeng et al. (2012) and Wang et al.(2013), for example, this approach is used to estimate the covari-ance matrix of the structure, assuming that the covariance matrixhas a diagonal form. This gives the voxel-wise variance of thestructures, but not the principal components. Another approachattempts to reconstruct the covariance structure by a form ofinterpolation (Anden et al., 2015; Katsevich 2015). Because thecovariance matrix is quite large, this approach is limited to smallvolumes.
Heterogeneity can also be investigated via normal mode analy-sis (Brooks and Karplus, 1985; Chacon et al., 2003). Normal modesare eigenvectors of the Hessian of the potential function of theatomic displacements of a molecule. Normal modes, especiallythe low-spatial-frequency normal modes, provide insight into pos-sible heterogeneity of the particle due to bending and rotation ofdifferent parts of the molecule. Recent work (Jin et al., 2014) hasshown how normal modes can be used to understand heterogene-ity in images. Normal mode analysis is useful in its own right, butin the context of principal components it can provide very informa-tive priors. In the future, it may be possible to combine thestrengths of both approaches into a unified whole.
In this paper, we consider the problem of directly and sequen-tially reconstructing the principal components from cryo-EMimages. By ‘‘directly’’ we mean that the principal components arerecovered without the intermediate step of reconstructing multi-ple structures or their covariances. By ‘‘sequentially’’ we mean thatthe principal components are reconstructed one at a time. This hasthe dual advantage of efficient memory utilization, because largecovariance matrices are not needed, and of computational effi-ciency, because the principal components are recovered one at atime. Our approach is based on a generative model, and variouscomplications of cryo-EM imaging such as variable image noise,different number of images in different projection directions, andeven the contrast transfer function (CTF) can be incorporated intothe model.
We also discuss a fundamental problem in covariance and prin-cipal component estimation that is often overlooked in the concernover algorithms and practical results. A priori, it is not clear at allwhether, and how much of, the three-dimensional covariance(and hence the principal components) of a heterogeneous particlecan be recovered from the two-dimensional cryo-EM projectionimages. Potentially, some information may be lost because the rela-tion between images that are projected in different directions is notavailable in cryo-EM. However, it does turn out that thethree-dimensional covariance can be recovered exactly withoutthe knowledge of this relation. There is a Fourier slice theorem forcovariances, which shows how the three-dimensional covarianceof a structure can be recovered exactly from two-dimensionalcovariances of images. In Section 3, we present and explain this the-orem. This theorem is as fundamental to heterogeneous particlereconstruction as the usual Fourier slice theorem is to single parti-cle reconstruction. A similar result has also been reported inKatsevich et al. (2015).
A direct implementation of the Fourier slice theorem for covari-ances turns out to be cumbersome; the three-dimensional covari-ance is too large a data structure to calculate and hold in computer
memory. A more practical alternative is to directly calculate theprincipal components and principal values of the covariance. Thesecond part of this article contains our algorithm for directly recov-ering the principal components of the three-dimensional covari-ance from cryo-EM images. Simulations and experiments withreal cryo-EM data show that the algorithm performs well withnoisy data. Because the algorithm recovers principal componentsrather than a discrete set of structures, continuously variable struc-tures are represented well by the method.
The theory and the algorithm in this paper are based on thefollowing assumptions: We assume that if a single structure isreconstructed from a heterogeneous sample using classical recon-struction algorithms, then that structure is the mean (average)structure of the heterogeneous sample. We also assume that theheterogeneity is not excessive, so that during reconstruction eachparticle image is associated with the correct projection directionat the correct alignment. The latter assumption is not strict.Some mismatches and misalignments are not detrimental to thealgorithm. Note that these two assumptions are also commonlymade in other attempts to characterize structural heterogeneity(e.g. Penczek et al., 2011; Katsevich et al., 2015). Finally, weassume that the cryo-EM images can be CTF-corrected after align-ment. This assumption is made only for conceptual simplicity; wewant to address the heart of the problem – estimating the principalcomponents – without the added complexity introduced by theCTF. The assumption is very easily relaxed.
We begin in Section 2 with a brief discussion of continuousspace and discrete space models of heterogeneity. Section 3addresses the question of whether the three-dimensional covari-ance can be recovered at all from cryo-EM images. Here, weexplain how the Fourier slice theorem extends to covariance func-tions. A more mathematical explanation is in Appendix. Section 4formulates the problem of directly estimating the principal compo-nents. Section 5 proposes a practical algorithm for the problem. Asshown in that section, a version of the classic Expectation–Maximization algorithm (the EM algorithm) can be used to directlyreconstruct the principal components from cryo-EM images.Section 6 contains results of using this algorithm to recover princi-pal components from simulated and real cryo-EM data sets.Section 7 contains a discussion and concludes the paper.
2. Models for heterogeneous particles
Classic single particle reconstruction uses a ‘‘continuous space’’and a ‘‘discrete space’’ model of the particle; the former is used toestablish the Fourier slice theorem and the latter to derive practicalalgorithms. The continuous space model regards the structure(density) of the particle as a function s on a continuousthree-dimensional space. The discrete space model takes the struc-ture s to be a set of numbers on the vertices of a V � V � V lattice.The discrete structure can also be thought of as a V3 � 1 vector.
The continuous space model for a heterogeneous particle is arandom process s defined on 3d space. That is, sðuÞ is a randomvariable for any point u in 3d. The mean ls is a deterministic func-tion in 3d taking value lsðuÞ ¼ E½sðuÞ� at u, and the covariance Rs isa deterministic function of any pair of points u;v in 3d, withRsðu;vÞ ¼ E½ðsðuÞ � lsðuÞÞðsðvÞ � lsðvÞÞ�. Samples drawn from srepresent heterogeneous particles.
The discrete space model for a heterogeneous particle is aV � V � V or a V3 � 1 valued random variable s. Its meanls ¼ E½s� is a V � V � V or a V3 � 1 vector, and its covariance Rs is
a V3 � V3 matrix. The principal components and principal valuesof s are the eigenvectors and eigenvalues of Rs.
Bayesian and likelihood approaches to principal componentanalysis use the following generative model for s (Tipping andBishop, 1999; Basilevsky, 1994):

1 The vector n is unique if x1;x2 are linearly independent. If x1;x2 are linearlydependent, then there is more than one such n. All that is required for the theorem isthat there exist at least one such n.
H.D. Tagare et al. / Journal of Structural Biology 191 (2015) 245–262 247
s ¼ ls þ z1l1 þ z2l2 þ � � � þ znln; ð1Þ
where, l1; . . . ;ln are orthogonal vectors, i.e. lTi lj ¼ 0 for i – j. The
norm (length) of lk is the square root of the kth principal value ofs (klkk ¼
ffiffiffiffiffikkp
), and lk=klkk ¼ ek, the kth principal component ofs. Finally, z1; � � � ; zn are independent scalar random variables thatare normally distributed with density Nð0;1Þ. This model can berewritten with simplified notation by defining a V3 � n matrix lwhose columns are lk:
l ¼
..
. ... ..
. ...
l1 l2 � � � ln
..
. ... ..
. ...
2666437775;
and a vector valued random variable z whose components are zk,
z ¼
z1
z2
..
.
zn
266664377775
and which has densityNð0; IÞ, where I is the identity matrix, so that
s ¼ ls þ lz: ð2Þ
This model is used in Section 5 to derive the EM algorithm for esti-mating principal components.
3. The Fourier slice theorem for covariances
Having defined the basic quantities that we will use for describ-ing heterogeneous particles, we turn to describing the Fourier slicetheorem for covariances. This theorem mirrors the classic Fourierslice theorem in single particle reconstruction. We adopt the ‘‘con-tinuous space’’ point-of-view of the classic theorem. Detailed cal-culations and justifications for all of the formulae in this sectionare given in Appendix.
Let the heterogeneous particle s be a random process in threedimensions. Project s tomographically onto a two-dimensionalplane as follows: With the understanding that the north hemi-sphere of a unit sphere includes the equator, pick a point in thenorth hemisphere. This point defines a unit length vector n. If Pn
is the two-dimensional plane perpendicular to n containing theorigin, then for any point a 2 Pn,
ynðaÞ ¼Z
sðaþ nrÞdr ð3Þ
is the line integral along the normal ray through a, with r being thedistance along the ray. This makes yn a two-dimensional stochasticprocess defined on Pn. It is the random image generated by thetomographic projection of s. Its mean and covariance are easilyshown to be (see Appendix):
Mean : lynðaÞ ¼ E½ynðaÞ� ¼
Zlsðaþ rnÞdr
Covariance : Rynða; bÞ ¼ E ðynðaÞ � lyn
ðaÞÞðynðbÞ � lynðbÞÞ
h i¼ZZ
Rs aþ r1n; bþ r2nð Þdr1dr2:
We will call Rynthe projected covariance function.
As with the classic Fourier slice theorem we will assume thatprojection images are available in all projection directions. Thatis, lyn
and Rynare available for all projection directions n.
Below, we will need Fourier transforms of the covariance func-tions. They are:
F sðx1;x2Þ ¼ZZ
e�iðxT1u1þxT
2u2ÞRsðu1;u2Þdu1du2; and ð4Þ
~F ynðm1; m2Þ ¼
ZZe�iðmT
1v1þmT2v2ÞRyn
ðv1; v2Þdv1dv2: ð5Þ
In the above equations x1;x2 are a pair of three-dimensional fre-quencies while m1; m2 are a pair of two-dimensional frequencies.The terms xT
1u1;xT2u2; mT
1v1; mT2v2 are inner products. The integral
in Eq. (4) is six-dimensional and the terms du1 and du2 are thedifferential volumes. Similarly, the integral in Eq. (5) isfour-dimensional, and the terms dv1 and dv2 are differential areas.If the Fourier transform F sðx1;x2Þ is known for every pair ofthree-dimensional frequencies x1;x2, then the transform can beinverted to recover the covariance function Rs.
Notice that when the Fourier transform is written as in Eqs. (4)and (5) the frequencies themselves can be interpreted as vectors inthe spatial domain. To be clear, this means that we treat any xsimultaneously as a vector in the Fourier domain as well as inthe spatial domain. Thus, given any non-zero x, there is a planein the Fourier domain perpendicular to x. Similarly, there is alsoa plane in the spatial domain perpendicular to x (defined by theset all points u such that xT u ¼ 0). These two planes are parallelto each other.
Now recall the classic Fourier slice theorem: let n be a vector inthe three-dimensional Fourier domain and let P0n be a plane in athree-dimensional Fourier domain perpendicular to n. Similarlylet Pn be the plane in the spatial domain perpendicular to n(Fig. 1a). If x is a three-dimensional frequency in P0n, then, x isalso contained in Pn, and we may think of x as atwo-dimensional frequency vector in Pn. The classic Fourier slicetheorem shows that if we tomographically project athree-dimensional function onto Pn, then the Fourier coefficientof the projection at any (two-dimensional) frequency x is equalto the Fourier coefficient of the three-dimensional function at(the three-dimensional) x in P0n. That is, all Fourier coefficientsof the tomographic projection on Pn are equal to the correspond-ing coefficients of the three-dimensional Fourier transform in theplane P0n.
The Fourier slice theorem for covariances shows that a similarargument holds for covariance functions. If x1;x2 are a pair of vec-tors in the three-dimensional Fourier space, then there is at leastone vector n in the north hemisphere in the Fourier domain1
(Fig. 1b) such that the plane P0n perpendicular to n containsx1;x2. Let Pn be the plane in the spatial domain perpendicular tothis n. Then x1;x2 can be thought of as two-dimensional frequen-cies in Pn. It turns out that the Fourier coefficient of the projectedcovariance function in Pn evaluated at the (two-dimensional) fre-quency pair x1;x2 is identical to the Fourier coefficient of thethree-dimensional (unprojected) covariance function at the(three-dimensional) frequency pair x1;x2 in P0n, i.e.
~F ynðx1;x2Þ ¼ F sðx1;x2Þ: ð6Þ
A proof of this claim is available in Appendix.This theorem shows how the three-dimensional covariance can
be recovered exactly from projected two-dimensional covariances.For any x1;x2 in the three-dimensional Fourier domain find thevector n and evaluate F sðx1;x2Þ ¼ ~F yn
ðx1;x2Þ. Since this can bedone for any, hence every, x1;x2, the entire Fourier transformF s can be calculated. Taking the inverse Fourier transform of F s,gives the covariance Rs. Thus, the covariance, and therefore the

Fig. 1. The classic Fourier slice theorem and the Fourier slice theorem for covariances. (a) The planes P0n and Pn are perpendicular to n. A three-dimensional frequency x inP0n can be thought of a two-dimensional frequency. The classic Fourier slice theorem says that the Fourier transform of the tomographic projection of a function on Pn at (thetwo-dimensional) frequency x is equal to the Fourier transform of the function at the three-dimensional frequency x in P0n . (b) The covariance Fourier slice theorem says thatthe Fourier transform of a projected covariance function at the pair of (two-dimensional) frequencies x1;x2 in Pn is equal to the Fourier transform of the unprojectedcovariance function at the pair of (three-dimensional) frequencies x1;x2 in P0n .
248 H.D. Tagare et al. / Journal of Structural Biology 191 (2015) 245–262
principal components, of s can be recovered from the covariancesof the images.
The Fourier slice theorem for covariances makes a number ofidealizations that have to be relaxed to develop a practical algo-rithm: (1) The images are not available in continuous space, butrather on a two-dimensional lattice. (2) The images are not avail-able for all projection directions, but only for finitely many direc-tions. (3) The number of images varies quite widely for differentprojection directions, and for some projection directions the num-ber of images may not be large enough to get a good estimate ofthe image covariance. (4) The images are quite noisy, as is typicalof cryo-EM. (5) The amount of noise may vary from image toimage, since it depends on the quality of the micrograph that theimage comes from.
These factors suggest developing an algorithm with a discretespace image model, which does not assume that a reliable imagecovariance is available and which explicitly takes image noise intoaccount.
4. The estimation problem
Returning to the generative discrete space model of Eq. (2) ofSection 2, suppose that the random structure s is tomographicallyprojected onto a plane by a tomographic projection operator A. Theresult is a random image (size V � V or V2 � 1) given by I ¼ Asþ �,where � is additive noise. Samples of this random variable areimages that are present along the projection direction correspond-ing to A.
More generally, several images Ij; j ¼ 1; . . . ;N are available andare obtained from s by projections from different directions.Image Ij has a corresponding projection operator Aj. Assuming thatthe images Ij are aligned with the correct projection direction atthe correct rotation and translation,
Ij ¼ Ajsþ �j ¼ Ajðls þ lzjÞ þ �j; j ¼ 1 . . . ;N ð7Þ
where zj are i.i.d. random variables, each zj distributed identically toz, and �j is additive noise with density Nð0;rjÞ (each image canhave a different noise level).
Since ls and Aj are known, Eq. (7) can be simplified further as
Ij � Ajls ¼ AjðlzjÞ þ �j; j ¼ 1 . . . ;N: ð8Þ
The term Ajls is just the projection of the mean structure by Aj, andIj � Ajls is the image formed by subtracting out the projected meanstructure from Ij. Since ls and Aj are known this is straightforwardto do. From now on, all images are assumed to be mean-subtractedso that Eq. (8) can be written simply as
Ij ¼ AjðlzjÞ þ �j; j ¼ 1 . . . ;N: ð9Þ
The images Ij are indexed by j, but later it will be convenient to usea double index. Assuming that there are a limited number of projec-tion directions 1; . . . ;R and that after alignment the rth direction hasNr images, the images can be indexed by the joint index r; t withr ¼ 1; � � � ;R and t ¼ 1; . . . ;Nr . Thus the Ij can also be referred to asIr;t .
Our problem is to use the information in Eqs. (2) and (9) to esti-mate the l’s. We solve this problem sequentially. That is, we first

H.D. Tagare et al. / Journal of Structural Biology 191 (2015) 245–262 249
estimate l1, then l2, follwed by l3; . . . and so on. The estimate forany lk assumes that l1; . . . ;lk�1 are known.
To reduce the propagation of noise into the estimate of ln, wewill assume the standard smoothness prior for ln. This prior hasthe log density
log pðlnÞ / �ckrlnk2; ð10Þ
wherer is the discrete three-dimensional finite-difference gradientoperator and k k is the norm. The constant c > 0 is the regularizationconstant. In practice, c is determined by cross validation.
The random variables zj are the latent variables of the problem;there is no interest in estimating them. The EM algorithm(McLachlan and Krishnan, 2008) can be used to estimate ln whilemarginalizing (i.e. integrating out) these latent variables. The EMalgorithm uses several conditional densities, and these are calcu-lated now.
Recall that we are assuming that l1; . . . ;ln�1 are known. Wetake ln and r1; . . . ;rN (the image noise variances) as the parame-ters to be estimated and set H ¼ ðln;r1; . . . ;rNÞ. Then, using thefact that image noise and zj are normally distributed:
pðIjjzj;HÞ¼1
ð2pÞV2=2ðrjÞV
2 exp �kIj�Ajlzjk2
2r2j
!; and ð11Þ
pðIj;zjjHÞ¼ pðIjjzj;HÞ�pðzjjHÞ¼ pðIjjzj;HÞ�pðzjÞ
¼ 1
ð2pÞV2=2ðrjÞV
2 exp �kIj�Ajlzjk2
2r2j
!� 1
ð2pÞn=2 exp �kzjk2
2
!: ð12Þ
A straightforward but tedious calculation gives the result that
pðzjjIj; hÞ is distributed normally as Nðqj; RjÞ, where
qj ¼1r2
j
I þ 1r2
j
lT ATj Ajl
!�1
lT ATj Ij; and ð13Þ
Rj ¼ I � 1r2
j
I þ 1r2
j
lT ATj Ajl
!�1
lT ATj Ajl: ð14Þ
The matrix I þ 1r2
jlT AT
j Ajl is n� n. Typically n is not bigger than 5, so
that the matrix inverse is tractable. Also note that qj is an n� 1 vec-tor, which by definition is
qj ¼ E½zj� ¼
E½z1j �
E½z2j �
..
.
E½znj �
2666664
3777775; ð15Þ
where E½ � is the expectation with respect to zjjIj; h. Similarly, by def-
inition Rj is the covariance matrix
Rj ¼
E½z1j z1
j � � � � E½z1j zn
j �E½z2
j z1j � � � � E½z2
j znj �
..
. ... ..
.
E½znj z1
j � � � � E½znj zn
j �
2666664
3777775: ð16Þ
5. The EM algorithm
Using the conditional densities of the previous section, the Qfunction (McLachlan and Krishnan, 2008) of the EM algorithm is:
QðH;H½k�Þ ¼XN
i¼1
E log pðIj; zjjHÞ� �
� ckrlnk2; ð17Þ
where the expectation is with respect to zjjIj;H½k�, and the second
term is the log prior for ln. Using Eq. (12) and dropping all termsthat do not depend on H, gives
QðH;H½k�Þ ¼XN
i¼1
E �kIj � Ajlzjk2
2r2j
� V2 logrj �kzjk2
2
" #� ckrlnk
2: ð18Þ
The EM algorithm proceeds by alternately maximizing Q withrespect to ln subject to the constraint that ln is orthogonal tol1; . . . ;ln�1, and then with respect to r1; . . . ;rn.
5.1. Maximization with respect to ln
Simplifying the Q function by dropping terms that do notdepend on ln gives (after some algebraic manipulations):
QðH;H½k�Þ ¼XN
j¼1
1r2
j
!ðAT
j IjÞTlnE½zn
j � �Xi<n
lTi AT
j AjlnE½zijz
nj �
(
�12lT
nATj AjlnE½ðzn
j Þ2��� ckrlnk
2: ð19Þ
Notice that the Q function is quadratic with respect to ln. TheM-step requires us to maximize the Q function with respect to ln
subject to the constraint that ln is orthogonal to l1; . . . ;ln�1. Thismaximization is straightforward to carry out: simply minimize�Q with the conjugate gradient algorithm using the negative ofthe gradient of Q with respect to ln projected on the subspaceorthogonal to spanðl1; . . . ;ln�1Þ.
Taking the gradient of Q with respect to ln,
rlnQ ¼
XN
j¼1
1r2
j
ATj ðIjE½zn
j � �Xn
i¼1
AjliE½zijz
nj �Þ � 2cr2ln; ð20Þ
wherer2 is the three-dimensional finite-difference Laplacian oper-ator. The projection of the gradient on the subspace orthogonal tospanðl1; . . . ;ln�1Þ is
PðrlnQÞ ¼ rln
Q �Xn�1
i¼1
lTi
klikrln
Q : ð21Þ
There is one last simplification using the dual indexing scheme forimages: Recall that if there are r ¼ 1; . . . ;R projection directionswith Nr images aligned to the rth projection direction, then theimage index j can be replaced by the double index r; t. Since Aj
depends only on r
rlnQ ¼
XN
j¼1
1r2
j
ATj IjE½zn
j � �Xn
i¼1
AjliE½zijz
nj �
!� 2cr2ln
¼XR
r¼1
ATreIr �
Xn
i¼1
Arlibi;r
!� 2cr2ln; where; ð22Þ
eIr ¼XNr
t¼1
1r2
r;tIr;tE½zn
r;t � ð23Þ
bi;r ¼XNr
t¼1
1r2
r;tE½zi
r;tznr;t�: ð24Þ
E½znr;t� is available as the nth component of qj (Eqs. (13)–(15)) and
E½zir;tz
nr;t� as the ith component of the last column of Rj (Eqs. (14)–
(16)).The gradient calculation of Eq. (22) has an intuitively appealing
interpretation. The term eIr is the weighted average of all imagesaligned to projection direction r. The term
Pni¼1Arlib
i;r is theweighted sum of the projections of all l’s, which represent the
250 H.D. Tagare et al. / Journal of Structural Biology 191 (2015) 245–262
current guess of the principal components and values. Thus,
ðeIr �Pn
i¼1Arlibi;rÞ is the information in the image that is not yet
explained by the projections of the principal components and val-ues. The operator AT
r back projects this information, and the sum ofall the back projections gives the gradient, i.e. the direction, alongwhich the current estimate of ln should be updated to incorporatethis information.
In summary, the maximization of Q with respect to ln is donewith a conjugate gradient algorithm using the projected gradientas follows:
Calculation of projected gradient:
1. Using the given l1; . . . ;ln�1 and the current estimate of ln, cal-culate for every image index j, the values of qj and rj accordingto Eqs. (13) and (14).
2. For every projection direction index r, calculate eIr according toEq. (23) and bi;r according to Eq. (24).
3. Calculate the gradient according to Eq. (22), and project thisgradient according to Eq. (21). Use �Pðrln
QÞ as the gradientfor the conjugate gradient step.
5.2. Maximization with respect to rj
The maximization of Q with respect to rj has the closed formsolution:
rj ¼
ffiffiffiffiffiffiffiffiffiffiffiffiffiffiffiffiffiffiffiffiffiffiffiffiffiffiffiffiffiffiffiffiffiffiffiffiffiffiffiffiffiffiffiffiffiffiffiffiffiffiffiffiffiffiffiffiffiffiffiffiffiffiffiffiffiffiffiffiffiffiffiffiffiffiffiffiffiffiffiffiffiffiffiffiffiffiffiffiffiffiffiffiffiffiffiffiffiffiffiffiffiffiffiffiffiffiffiffiffiffiffi1
V2 ITj Ij � 2IT
j AjlE½zj� þXn;n
i1¼1;i2¼1lT
i1AT
j Ajli2E½zi1
j zi2j �
� �sð25Þ
5.3. The complete algorithm
Thus, the EM algorithm for estimating ln and r1; . . . ;rN is:
1. Input: Mean subtracted images Ij, initial value of ln;r1; . . . ;rN .2. Iterate: Iterate the following until convergence� Maximize w.r.t. ln using conjugate gradient minimization
with the projected gradient.� Maximize w.r.t. rj; j ¼ 1; . . . ;N using Eq. (25).
The above assumes that the value the regularization constant cis known. In practice, it is determined by a cross-validationmethod, a procedure that is analogous to the Fourier ShellCorrelation method for determining resolution. First, the set ofimages is split into two halves. Then a set of values of c are chosen.In practice, it is sufficient to estimate c up to its order of magni-tude, so this set typically contains only a few values. For everyvalue of c, the vector l1 of both halves of the set of images is deter-mined independently. When the images have a highsignal-to-noise ratio, we expect the two l1’s to be almost equal.As the noise increases, some noise propagates into the estimateof the l1’s and they deviate from equality. The closeness of thetwo l1’s can be determined by calculating the magnitude of thecomponent of the each l1 along the other, and summing the mag-nitudes. The c at which this sum is the maximum is the c at whichthe two l1’s are most similar and is taken as the estimate of c. Thisestimate is then used to reconstruct the principal componentsfrom the entire set of images.
5.4. Comments
Now that we have described the model and the algorithm, wecomment on both:
1. The image formation (Eq. (9)) does not assume that the noise inevery image has the same variance. This assumption takes careof the fact that different micrographs do not have identicalnoise.
2. The algorithm directly uses every image to calculate the princi-pal components. This is in contrast to an approach which relieson the covariance of the images. The latter approach requires asufficient number of images along every projection direction toreliably calculate the image covariance. The EM approach doesnot.
3. In many problems, the EM algorithm can get trapped in localminima. For some problems, the EM algorithm has to be runfrom multiple initializations to get a good estimate of theparameters. Our experience with simulated and real data is thatthe algorithm appears to converge reliably from a single ran-dom initialization.
4. Two practical issues arise when the EM algorithm is applied toreal cryo-EM data: first, some noise from the background inevi-tably propagates into the estimate of the principal component.To prevent this, a mask can be created loosely around the meanstructure and the 3D principal components estimated only inthe mask. Second, contrast between the particle and the solventcan be different in different images, and these give rise to a‘‘contrast principal component’’. This principal component usu-ally appears as a change in the amplitude of the mean structure.To avoid this component, the reconstructed principal compo-nents can be constrained to be orthogonal to the mean struc-ture. This is easily done by modifying Eq. (21) to
PðrlnQÞ ¼ rln
Q �Xn�1
i¼0
lTi
klikrln
Q ; ð26Þ
where l0 ¼ ls is the mean structure.
6. Experimental results
The performance of the EM algorithm for determining principalcomponents was evaluated with simulations and with two realcryo-EM datasets. In all cases, first, the regularization constantwas determined by the cross-validation procedure, and then theEM algorithm was used to estimate the principal components.The algorithm was implemented in MATLAB and run on a singledesktop computer. The forward and back projection operationswere parallelized, i.e. Aj and AT
j were implemented in parallel, with6 MATLAB workers. The rest of the algorithm was not parallelized.The execution times per principal component for the algorithm forthe three data sets is shown in Table 1.
We adopt the following convention to present results of the EMalgorithm: the mean structure �2
ffiffiffiffiffikkp
ek are structures that are �2standard deviations away from the mean structure along the kthprincipal component. We present all estimated principal compo-nents as this pair of structures in a figure. In addition, principalcomponents that are estimated from real cryo-EM data are visual-ized by creating a movie that cyclically morphs from mean struc-ture þ2
ffiffiffiffiffikkp
ek to mean structure �2ffiffiffiffiffikkp
ek in a linear fashion. Themorph tool in Chimera (Pettersen 2004; CHIMERA) can be easilyused to do this. The movie is available as SupplementaryInformation.
6.1. Principal components of simulated data
For simulations, the atomic structure (3VG9) of the human ade-nosine A2A receptor with an allosteric inverse-agonist antibodywas downloaded from the PDB (Hino et al., 2012). Systematicchanges were made to the structure to simulate heterogeneity.

Table 1Execution times for the algorithm per principal component. The algorithm was implemented in MATLAB, with the forward and backprojection operators implemented in the spatial domain in parallel by 6 MATLAB workers. The rest of the algorithm was not parallelized.
Data set Num. images Image size Num. Proj. Dirs Time per component (min)
Simulation (3VG9) 19,264 70� 70 301 4.770S ribosome 10,000 130� 130 309 40.9RdRP 30,000 128� 128 1126 96.1
Fig. 2. The structure 3VG9 used in the simulation. (a) The ribbon structure of 3VG9. ‘‘A’’ is the receptor, ‘‘B’’ is the antibody fragment. The two are separated by the plane ‘‘P’’.(b) The simulated density of 3VG9 as surface rendering and slices. The density is obtained by simulating a solvation model, followed by low pass filtering to simulate a 2.5 Åcubed voxel, and then high pass filtering to simulate contrast with the solvent. (c) The antibody fragment B rotated around the axis shown in the figure by �20� in eight steps(only the extreme positions are shown). The eight densities obtained thus were duplicated and (d) an extra density added to the duplicated densities. The resulting 16volumes were used in the simulation.
H.D. Tagare et al. / Journal of Structural Biology 191 (2015) 245–262 251
These changes are described in detail below. The changes to thestructure are not biologically motivated, but instead are meant torepresent uncorrelated stoichiometric and conformationalchanges. Our hope is to recover the uncorrelated changes as dis-tinct principal components.
The structure of 3VG9 is shown in Fig. 2a. It contains a receptor(A) and an antibody fragment (B) which are approximately sepa-rated by a plane (P). Conformational heterogeneity was simulatedby rotating the antibody fragment B around the rotational axisshown in Fig. 2a. Eight rotations, uniformly spaced in the range

Fig. 3. The images used in the simulation. (a) Typical radially-averaged noise spectral density in the simulation. Noise was added before and after applying the CTF. (b) and (c)Typical low and high defocus noisy images in the simulation. (d) and (e) are the underlying noise-free images corresponding to (b) and (c).
252 H.D. Tagare et al. / Journal of Structural Biology 191 (2015) 245–262
�20�, were applied to the atomic coordinates of the antibody frag-ment. A density map was created for each volume by using a sim-ulator of solvated protein (Shang and Sigworth, 2012). Then thevolumes were low pass filtered to simulate limited resolution(voxel size: 2.5 Å cubed). Finally, the d.c. component of the volumewas eliminated by high pass filtering to mimic solvent contrast.This resulted in eight volumes, each of size 70� 70� 70, repre-senting purely conformational change. To model stoichiometricchange, a volume was masked out of the rigid receptor structure.This volume was shifted and added near the receptor to a copyof the eight volumes. The entire set of the original eight volumeswithout the extra density plus the new eight volumes with theextra density were taken as sixteen volumes of a heterogeneousparticle. Note that in this collection, there is a pair of volumes forevery rotation of the antibody fragment – one volume withoutthe extra density and one volume with the extra density. That is,the stoichiometric and conformational changes in this set areuncorrelated.
Fig. 2b–d illustrates the volumes. Fig. 2b shows the original3VG9 volume after applying the solvation model, low pass filtering,and solvent contrast filtering. Fig. 2c shows the extreme �20� rota-tions of the antibody fragment, and Fig. 2d shows the same vol-umes with the extra density near the top.
The 16 volumes were projected along 301 projection directionsin the north hemisphere to produce 70� 70 images of pixel size2.5 Å. Assuming a voltage of 300 kV, four CTFs were simulated with
defocus values of 1.2, 1.45, 1.7, and 2.0 lm respectively. Each CTFwas applied to every projection image. Equal amounts of noisewas added to the projection images before and after the CTF wasapplied. Fig. 3a shows a typical spectrum of noise in one of theimages. The spectrum clearly shows a CTF-filtered noise compo-nent on top of a white noise component (Zeng et al., 2007). A num-ber of simulations were carried out at different signal-to-noiseratios. For brevity, here we report only the results of thelowest signal-to-noise ratio. This signal-to-noise ratio isSNR ¼ 0:03� 1=2, where ‘‘�1=2’’ term represents that fact thatnoise (corresponding to SNR ¼ 0:03) was added before applyingthe CTF as well as after applying the CTF. Fig. 3b and c showstypical noisy low- and high-defocus images. Fig. 3d and e showsthe underlying non-noisy CTF-filtered images. These images areincluded only to visually assess the amount of the noise inFig. 3b and c. The entire simulation resulted in16ðvolumesÞ � 301ðprojectionsÞ � 4ðCTFsÞ ¼ 19;264 images.
Finally, the mean volume and the ‘‘ground-truth’’three-dimensional principal components were calculated fromthe sixteen volumes (without noise). Fig. 4a shows the mean vol-ume. Fig. 4b and c shows the mean volume �2
ffiffiffiffiffik1p
e1 where k1
and e1 are the first principal value and component. Fig. 4d and eshows the mean volume �2
ffiffiffiffiffik2p
e2 where k2 and e2 are the secondprincipal value and component. The first principal component cap-tures the presence/absence of the extra density without capturingany associated rotation of the antibody fragment. The second
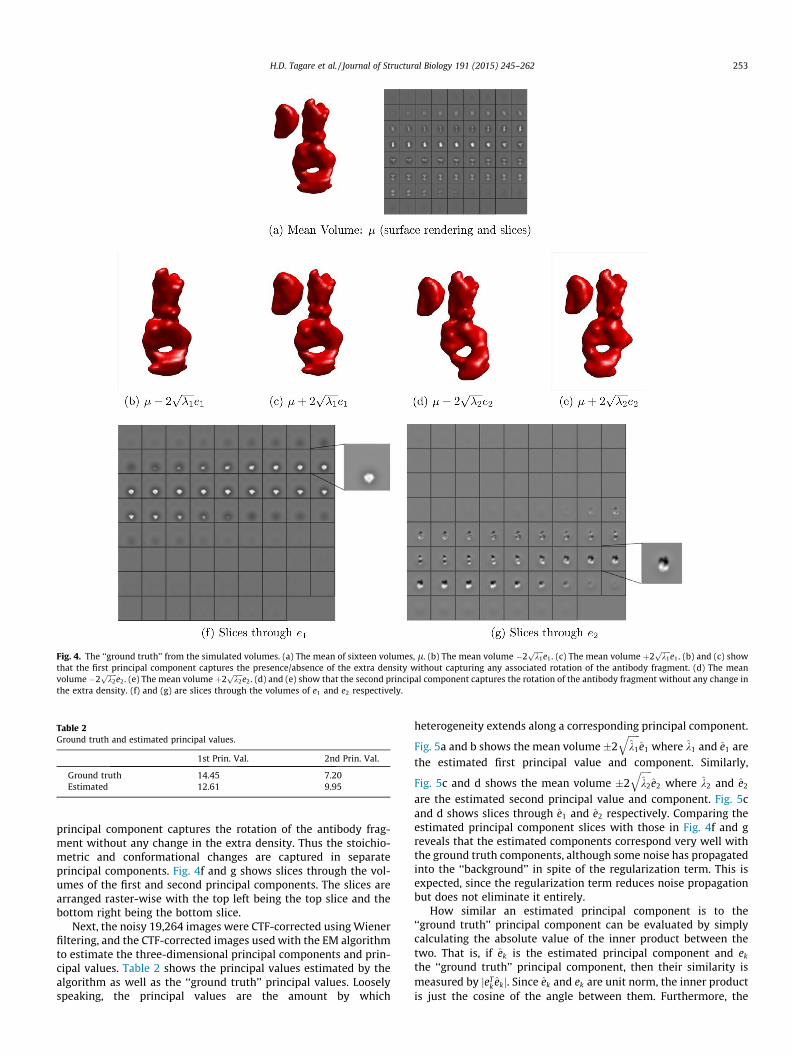
Fig. 4. The ‘‘ground truth’’ from the simulated volumes. (a) The mean of sixteen volumes, l. (b) The mean volume �2ffiffiffiffiffik1p
e1. (c) The mean volume þ2ffiffiffiffiffik1p
e1. (b) and (c) showthat the first principal component captures the presence/absence of the extra density without capturing any associated rotation of the antibody fragment. (d) The meanvolume �2
ffiffiffiffiffik2p
e2. (e) The mean volume þ2ffiffiffiffiffik2p
e2. (d) and (e) show that the second principal component captures the rotation of the antibody fragment without any change inthe extra density. (f) and (g) are slices through the volumes of e1 and e2 respectively.
Table 2Ground truth and estimated principal values.
1st Prin. Val. 2nd Prin. Val.
Ground truth 14.45 7.20Estimated 12.61 9.95
H.D. Tagare et al. / Journal of Structural Biology 191 (2015) 245–262 253
principal component captures the rotation of the antibody frag-ment without any change in the extra density. Thus the stoichio-metric and conformational changes are captured in separateprincipal components. Fig. 4f and g shows slices through the vol-umes of the first and second principal components. The slices arearranged raster-wise with the top left being the top slice and thebottom right being the bottom slice.
Next, the noisy 19,264 images were CTF-corrected using Wienerfiltering, and the CTF-corrected images used with the EM algorithmto estimate the three-dimensional principal components and prin-cipal values. Table 2 shows the principal values estimated by thealgorithm as well as the ‘‘ground truth’’ principal values. Looselyspeaking, the principal values are the amount by which
heterogeneity extends along a corresponding principal component.
Fig. 5a and b shows the mean volume �2ffiffiffiffiffik1
qe1 where k1 and e1 are
the estimated first principal value and component. Similarly,
Fig. 5c and d shows the mean volume �2ffiffiffiffiffik2
qe2 where k2 and e2
are the estimated second principal value and component. Fig. 5cand d shows slices through e1 and e2 respectively. Comparing theestimated principal component slices with those in Fig. 4f and greveals that the estimated components correspond very well withthe ground truth components, although some noise has propagatedinto the ‘‘background’’ in spite of the regularization term. This isexpected, since the regularization term reduces noise propagationbut does not eliminate it entirely.
How similar an estimated principal component is to the‘‘ground truth’’ principal component can be evaluated by simplycalculating the absolute value of the inner product between thetwo. That is, if ek is the estimated principal component and ek
the ‘‘ground truth’’ principal component, then their similarity ismeasured by jeT
k ekj. Since ek and ek are unit norm, the inner productis just the cosine of the angle between them. Furthermore, the

Fig. 5. Estimates from the EM algorithm. The estimated principal values and components are kk and ek for k ¼ 1;2. (a) and (b) show the mean volume �ffiffiffiffiffik1
qe1. Similar to the
ground truth, this estimated first principal component captures the presence/absence of the extra density without any motion of the antibody fragment. (c) and (d) show the
mean volume �ffiffiffiffiffik2
qe2. The estimated second principal component captures the rotation of the antibody fragment without any change in the extra density. (e) and (f) show
the slices through the estimated first and second principal components respectively. These are similar to the slices shown in Fig. 4f and g; however, some noise haspropagated into all of the slices.
Table 3Absolute values of inner product between ground truth and estimated principalcomponents.
1st Prin. Comp. 2nd Prin. Comp.
Raw 0.91 0.89Masked 0.95 0.95
254 H.D. Tagare et al. / Journal of Structural Biology 191 (2015) 245–262
absolute value compensates for the sign ambiguity of the principalcomponents. The performance measure jeT
k ekjtakes values between0 and 1 with high values reflecting greater similarity.
Fig. 6. Sensitivity of the estimated principal components to the amount of heterogeneity.and the ground truth principal component as a function of the extent of antibody fragmecomponent and the ground truth principal component as a function of the percentage o
The first row Table 3, labeled ‘‘Raw’’, shows the above perfor-mance measure for the estimated principal components. The noisybackgrounds of the estimated principal components reduces theirsimilarity to ground truth. To demonstrate this, we attempted tocalculate the performance measure after eliminating the noisybackground as follows: the ground truth principal componentwas thresholded to produce a mask whose voxels took a value 1when the absolute value in the corresponding voxels of the compo-nent were greater than 5 % of the largest absolute value in all vox-els, else the mask voxel was set to 0 (that is, the mask m has valuemðuÞ ¼ 1 at voxel u, if the ground truth principal componentekðuÞ > 0:05�maxujekðuÞj, else mðuÞ ¼ 0). This produced a binary
(a) Absolute value of the inner product between the estimated principal componentnt rotation. (b) Absolute value of the inner product between the estimated principalf extra density. The antibody fragment rotation in the range �20� .

Fig. 7. Two separate reconstructions from images containing the 70S ribosome with and without EF-G. The volumes are displayed with the stalk in the vertical position andthe 30S in the plane of the paper. In this orientation, (a) the presence and (b) the absence of the EF-G is clearly visible. The ratcheting of the 30S is also visible. Cross hairs areadded to fixed pixel locations to make it easier to visualize the ratcheting. The motion of the L1 is also visible. The difference between these two reconstructions is likely to besimilar to the 1st reconstructed principal component.
Fig. 8. Estimated first principal component from the 70S data shown as mean�2ffiffiffiffiffik1
qe1. This principal component clearly captures the binding and unbinding of the EF-G. The
principal component also captures associated conformational changes. They are presented below in Figs. 9 and 10.
H.D. Tagare et al. / Journal of Structural Biology 191 (2015) 245–262 255
mask in which the background was completely suppressed. Themask was then applied to the ground truth and to the recon-structed principal components. The masked components werescaled to have a unit norm, and the performance measure recalcu-lated with these components. The second row of Table 3, labeled‘Masked’, shows the masked performance measures, and it is clearthat with the background masked out, the components are muchmore similar, with absolute value of the inner product close to 1.
Next, we carried out simulations in which we investigated thesensitivity of the estimated principal components to the amountof heterogeneity. Recall that in the simulation discussed above,the antibody fragment density was rotated by �20�. Now, we cre-ated three additional volume sets (sixteen volumes per set) withantibody fragment rotation in the ranges �10�; �5�; �2:5� respec-tively. The extra density was added in an uncorrelated manner asabove. Thus, these sets of volumes contain different amount of con-formational heterogeneity with a fixed amount of stoichiometricheterogeneity. Noisy images at the four CTFs mentioned above
were generated from each volume set at SNR ¼ 0:03� 1=2, alsoas above. The principal components were recovered using the EMalgorithm for each set. Fig. 6a plots the absolute value of the innerproduct of the estimated rotation principal component and theground truth rotation principal component vs. the extent of anti-body fragment rotation. Raw and masked inner products areshown. Results from the �20� rotations, which are available fromthe simulation discussed above, are also added to the figure. Themasked results in Fig. 6a clearly show that the algorithm is ableto recover the relevant principal component even as the conforma-tional change becomes smaller.
Finally, we created volume sets in which the antibody fragmentrotation was set fixed in the range �20�, but the extent of extradensity was reduced to 50% and 25% of the simulation above.Again noisy images at the four CTFs mentioned above were gener-ated at SNR ¼ 0:03� 1=2, and principal components were recov-ered using the EM algorithm. Fig. 6b shows the absolute value ofthe inner product of the recovered principal component which

Fig. 9. The ratcheting of the 30S subunit with respect to the 50S subunit is captured by the first principal component. (a) and (b) show the mean �2ffiffiffiffiffik1
qe1 densities from an
angle that visualizes the 30S subunit straight on. The cross-hairs in (a) and (b) are in fixed spatial positions and can be used to assess the motion of the underlying density. (b)also contains arrows suggesting the apparent direction of motion of the densities under the cross hairs. (c) and (d) show the mean �2
ffiffiffiffiffik1
qe1 densities from an angle that
visualizes the 50S subunit straight on. The 50S subunit is apparently stationary. Thus the first principal component captures the ratcheting of the 30S subunit with respect tothe 50S subunit.
256 H.D. Tagare et al. / Journal of Structural Biology 191 (2015) 245–262
modeled the extra density and the ground truth principal compo-nent as function of percentage extra density. Raw and maskedinner products are shown. The 100% extra density results are fromthe simulation above. Fig. 6b suggests that the algorithm is able torecover the relevant principal component as the mass changebecomes smaller.
6.2. Principal components of the 70S ribosome
Next we evaluated the performance of the algorithm using realcryo-EM data. The data set used in this experiment is a subset ofthe data reported in (Agrawal et al., 1999) and is publicly available.The subset contained 10,000 images, half of which were cryo-EMimages of the 70S ribosome with Elongation Factor-G (EF-G) andhalf without Elongation Factor-G. The images, which are130� 130 pixels, were pre-processed in two steps. First, they wereWiener-filtered to obtain CTF-corrected images. Next, the imageswere low-pass filtered at 15 Å to improve the SNR. This cutoff
frequency was similar to the reported resolution of 17.5–18.4 Åin (Agrawal et al., 1999).
To start, two 3d reconstructions were obtained from the imagesusing cryo-EM reconstruction package SPIDER(Shaikh et al., 2008).The first 3d reconstruction was from the 5000 images of the ribo-some with EF-G and the second reconstruction was from the 5000images of the ribosome without EF-G. The two reconstructions areshown in Fig. 7. The presence and absence of EF-G is clearly visibleas is the ratcheting of the 30S. These two reconstructions are usedto evaluate the results of the principal component algorithm.
Next, the 10,000 images were pooled together and a single par-ticle was reconstructed using 309 projection directions in the northhemisphere. Then, the class mean for each projection direction wassubtracted from the images aligned to that direction, and the meansubtracted, aligned images used with the EM algorithm. Initialexperimentation with reconstructing the first five principal com-ponents showed that only the first two components were mean-ingful, the remaining components showed no biologically

Fig. 10. The motion of the L1 subunit captured by the first principal component. (a) and (b) show the mean �2ffiffiffiffiffik1
qe1 densities from an angle that visualizes the L1 protein
subunit (which is contained in the red circle in (a) and (b)). The cross-hairs are spatially fixed, and the translational motion of the L1 is quite apparent when compared to thecross-hairs. The particle is viewed after the rotation as shown from the positions in Fig. 8. (For interpretation of the references to colour in this figure legend, the reader isreferred to the web version of this article.)
H.D. Tagare et al. / Journal of Structural Biology 191 (2015) 245–262 257
plausible changes and were discarded. The first two principal com-ponents are discussed in detail below.
Almost all of the structural changes captured by the first twoprincipal components are best visualized by orienting the ribo-some such that its stalk is vertically upwards, and then rotatingthe ribosome around the stalk. This is how the results are pre-sented below.
6.2.1. The first principal component
Fig. 8a and b shows the mean �2ffiffiffiffiffik1
qe1 structures. The figure
clearly shows that the first principal component captures the bind-ing/unbinding of the EF-G. Notice the close similarity of the struc-tures in Fig. 8a and b to the structures in Fig. 7.
In addition to the binding/unbinding of the EF-G, the first prin-cipal component also captures associated conformational changesof ribosome. The following conformational changes are clearlyapparent:
1. The most significant conformational change is the ratcheting ofthe 30S subunit with respect to the 50S subunit. Fig. 9a and b
shows the mean �2ffiffiffiffiffik1
qe1 structures from an angle that visual-
izes the 30S subunit straight on. Cross-hairs are added to thefigures in fixed spatial position. The density immediately belowthe cross hairs corresponds to the 30S subunit, so that the 30Smotion can be assessed with reference to the cross hairs.Arrows are also added to the figures illustrating the apparentmovement of the 30S from Fig. 9a and b. The 30S seems torotate clockwise around an axis that is perpendicular to thepage, and which passes approximately through the center ofthe particle.Fig. 9c and d assesses the movement of the 50S subunit. Theviewing angle in Fig. 9 is the polar opposite of that of Fig. 9.In effect, if Fig. 9a-b are the ‘‘front’’ images, then Fig. 9c-d are
the ‘‘back’’ images of the mean �2ffiffiffiffiffik1
qe1 densities. Here too,
cross-hairs are added to the figure to aid comparison, and
density immediately under the cross-hairs is the 50S subunit.When compared with the cross-hairs, it is clear that the 50Ssubunit does not exhibit any rotation.Thus, the ratcheting motion of the 30S subunit with respect tothe 50S subunit is captured by the first principal component.
2. An equally significant conformational change is the motion ofthe L1 subunit towards and away from the main body of theribosome. Fig. 10 shows that this change is also captured bythe first principal component. This motion of the L1 subunit isalso apparent in the separate reconstructions of Fig. 7a and b.
3. Finally, there is a thinning-thickening of the ribosome stalk asthe EFG binds and unbinds to the ribosome. The first principalcomponent captures this clearly, as also seen in Fig. 9a and b.
All of these conformational changes are known to be associatedwith the binding-unbinding of the EF-G to the ribosome (Agrawalet al., 1999).
The above observations can be made more precise and quanti-tative. Recall that the two reconstructions, Fig. 7a and b, areobtained from images with and without EF-G. The differencebetween these two reconstructions should capture thebinding-unbinding of the EF-G as well as any conformationalchanges accompanying it. Comparing the first principal componentwith this difference should reveal how much of the difference iscaptured by the component. Fig. 11a shows slices through the dif-ference between the two reconstructions, and Fig. 11b shows slicesthrough the first principal component. The similarity between thetwo is quite clear in the figure.
If the difference between the reconstructions of Fig. 7a and b isscaled to have a unit norm, then the absolute value of the innerproduct between it and the principal component should evaluatetheir similarity in a quantitative manner. As with the simulateddata above, there is the problem of the noise in the background,but unlike the simulation it is now unclear what threshold tochoose for masking out the background. The strategy we adopt isthe following: We first scale the difference density to have a unitnorm. The absolute values of the voxels of the scaled difference

Fig. 11. Comparing the difference between the two reconstructions in Fig. 7 with the principal component. (a) shows slices through the difference between the tworeconstructions in Fig. 7. (b) shows slices through the first principal component. (c) is the plot of the absolute value of the inner product between the masked and normalizeddifference in the reconstructions (normalized to have a unit norm) and the masked and normalized principal component as a function of the mask threshold t. The mask isobtained by thresholding the difference volume at t times the maximum absolute voxel value. (d) The mask at the threshold 0.15.
258 H.D. Tagare et al. / Journal of Structural Biology 191 (2015) 245–262
are thresholded at t times the maximum absolute value of all vox-els. This mask is applied to the difference density as well as to theprincipal component and the masked volumes are rescaled to havea unit norm. The absolute value of the inner product between themasked and rescaled volumes is plotted as function of t. The plot isshown in Fig. 11c. The plot reveals that the absolute value of theinner product is higher than 0.9 for t > 0:15. Slices through themask at t ¼ 0:15 are shown in Fig. 11d. The mask captures mostof the ‘‘foreground’’ in the difference image of Fig. 11a while sup-pressing much, but not all, of the background. This analysis pro-vides strong evidence that most of the difference density iscaptured very well by the first principal component.
6.2.2. The second principal component
Fig. 12a and b shows mean �2ffiffiffiffiffik2
qe2 densities along the second
principal component. There is no real ratcheting apparent in this
principal component. Instead this component seems to capturecontrast variations that have some residual correlation with thebinding/unbinding of the EF-G: Densities in Fig. 12b seem to be‘‘thicker’’ than densities in Fig. 12a. Fig. 12c shows slices throughthe second principal component. Note the dissimilarity with theslices of the difference density and with the slices through the firstprincipal component (Fig. 11a-b).
In summary, it appears that for this dataset the first principalcomponent captures the stoichiometric change of the EF-G bind-ing/unbinding to the ribosome as well as correlated conforma-tional changes in the ribosome.
6.3. Principal components of the influenza virus RNA polymerasecomplex
The second cryo-EM data set contains images of the influenza ARNA-dependent RNA polymerase (RdRP) (Chang et al., 2015). RdRP

Fig. 12. The estimated second principal component shown as (a) mean þ2ffiffiffiffiffik2
qe2 and (b) mean �2
ffiffiffiffiffik2
qe2. This component seems to capture the residual correlation between
the contrast variation and the EF-G binding/unbinding. (c) shows slices through the principal component. Note the dissimilarity with the slices through the first principalcomponent (Fig. 11b).
H.D. Tagare et al. / Journal of Structural Biology 191 (2015) 245–262 259
is a hetero-trimer with a molecular weight of 250 kDa. In (Changet al., 2015), a tetrameric assembly state of the hetero-trimerwas revealed to adopt a squarish shape with an approximate size
of 180� 150� 70 Å3
having an empty space in the center. A dataset, containing images with defocus values from 1.0 to 3.0 lm,was used in that study to create five classes using 3D classificationin RELION. Details of the five classes are available in figure S1 of thesupplemental information of Chang et al. (2015).
We investigated the principal components of the RdRP by ana-lyzing a subset of images belonging to the class labelled III in thesupplemental information of Chang et al. (2015). The subset wechose had 30,036 images with defocus values between 1.0 and2.0 lm. The images were downsampled from 256� 256 pixels(pixel size 1.32 Å) to 128� 128 pixels and CTF-corrected by
Wiener filtering. A single mean volume was reconstructed fromthe 30,036 images using 1126 projection directions, which wereapproximately uniformly distributed on a sphere (appx. 6� spac-ing). A gold standard FSC analysis suggested that our reconstructedmean volume had a resolution of 14.7 Å. The class mean for eachprojection direction was subtracted from the images aligned tothat direction, and the mean subtracted, aligned images used withthe EM algorithm.
The mean volume is shown in Fig. 13 and is similar to a higherresolution version of the structure reported in (Chang et al., 2015).The four subcomplexes of the tetramer are labeled A, B, C, D inFig. 13. The empty space in the middle of the tetramer is clearlyvisible. A groove, located in each subcomplex towards the tetramer

Fig. 13. The mean density of the RdRP at gold standard FSC resolution 14.7 Å. TheRdRP has four subcomplexes labeled A, B, C, D. AB and CD are dimers. A groove and ahole is present in each subcomplex. The groove in the subcomplexes B and C is inthe back and is not shown. There is evidence in (Chang et al., 2015) that the RdRPhas conformational heterogeneity. The two dimers rock with respect to each otherby changing the angle between their long axes.
Fig. 14. The first principal component of RdRP. (a) and (b) Mean �2ffiffiffiffiffik1
qe1. The
cross-hairs are in stationary position in the figure. In the side view of the particle,the front dimer rotates clockwise when going from mean �2
ffiffiffiffiffik1
qe1 to mean
þ2ffiffiffiffiffik1
qe1. The dimer in the back rotates counterclockwise. (c) Slices through the
first principal component.
260 H.D. Tagare et al. / Journal of Structural Biology 191 (2015) 245–262
center is visible in Fig. 13 for subcomplexes A and D. This groove isalso present for subcomplexes B and C in the back (not shown). Ahole in the center of the subcomplexes A,B,C,D is also visible. Thepairs of subcomplexes AB and CD are referred to as dimers in(Chang et al., 2015). The length of each dimer is larger than the dis-tance between dimers.
Before proceeding, it is useful to comment on the five RELIONclasses reported in the supplementary information of Changet al. (2015). Classes I through IV very clearly have a tetramerstructure similar to that of Fig. 13 (see Fig. S1 in the supplementto Chang et al. (2015)). One key difference between the classes I–IV is that the long axes of the two dimers are at different angleswith respect to each other. The angle is schematically illustratedon the right in Fig. 13. That is, the two dimers appear to rockwith respect to each other. The presence of dimer rocking inclasses I–IV strongly suggests that the RdRP is heterogeneous.If this heterogeneity is ‘‘continuous’’, i.e. if the relative anglebetween the dimer long axes varies continuously, then it is likelythat this heterogeneity is also present in just the images of classIII and principal component analysis should reveal it. Class V isqualitatively different from classes I–IV. The density for class Valso has the form of a tetramer, but the density of one of thedimers is dramatically reduced. This suggests that there weresome dimers in the sample preparation that had not assembledinto a tetramer, and that class V captured many of the dimersalong with a few tetramers. If class III images contained any suchunassembled dimers, then perhaps a principal component mightreveal density change in one of the two dimers in the tetramer.By coincidence, this situation is similar to the simulation ofSection 6.1; the dimer rocking is a continuous conformationalheterogeneity, the tetramer-dimer mixture is a stoichiometricheterogeneity.
Preliminary analysis of the selected class III images with theEM algorithm revealed that the background noise (noise in thesolvent region of the images) and particle-solvent contrastchanges had a strong influence on the principal components. Toreduce these effects, we create a loose soft mask around the meanvolume and reconstructed the principal components using thesoft mask and the variant of EM algorithm discussed on comment4 of Section 5.4. The first two principal components found by theEM algorithm appear to be biologically interpretable and are dis-cussed below. Continuous morphing of 3D densities along these
principal components are contained in the movie referred to inSection 6.2.
6.3.1. The first principal componentFig. 14a and b shows the first principal component as mean vol-
ume �2ffiffiffiffiffik1
qe1 densities. Cross-hairs are added to the figures to aid
visual comparison. The rocking of the two dimers with respect toeach other is clearly evident in the side view of the particle inFig. 14. Also evident in the figure are changes to the groove geom-etry, as well changes in the holes in the center of the subcom-plexes. Slices through the first principal component are shown inFig. 14c. Note the lack of noise propagation into the backgroundbecause of soft masking.
The first principal component clearly appears to capture therocking of the dimers and suggests that this may be a continuousconformational change.
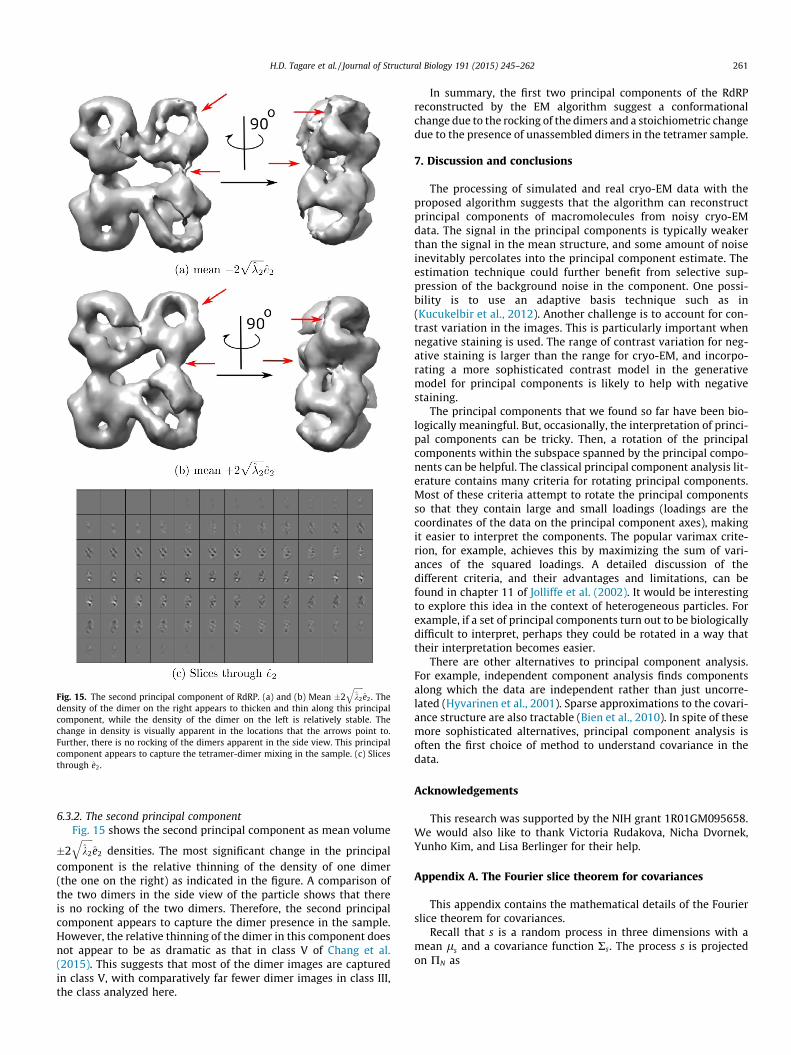
Fig. 15. The second principal component of RdRP. (a) and (b) Mean �2ffiffiffiffiffik2
qe2. The
density of the dimer on the right appears to thicken and thin along this principalcomponent, while the density of the dimer on the left is relatively stable. Thechange in density is visually apparent in the locations that the arrows point to.Further, there is no rocking of the dimers apparent in the side view. This principalcomponent appears to capture the tetramer-dimer mixing in the sample. (c) Slicesthrough e2.
H.D. Tagare et al. / Journal of Structural Biology 191 (2015) 245–262 261
6.3.2. The second principal componentFig. 15 shows the second principal component as mean volume
�2ffiffiffiffiffik2
qe2 densities. The most significant change in the principal
component is the relative thinning of the density of one dimer(the one on the right) as indicated in the figure. A comparison ofthe two dimers in the side view of the particle shows that thereis no rocking of the two dimers. Therefore, the second principalcomponent appears to capture the dimer presence in the sample.However, the relative thinning of the dimer in this component doesnot appear to be as dramatic as that in class V of Chang et al.(2015). This suggests that most of the dimer images are capturedin class V, with comparatively far fewer dimer images in class III,the class analyzed here.
In summary, the first two principal components of the RdRPreconstructed by the EM algorithm suggest a conformationalchange due to the rocking of the dimers and a stoichiometric changedue to the presence of unassembled dimers in the tetramer sample.
7. Discussion and conclusions
The processing of simulated and real cryo-EM data with theproposed algorithm suggests that the algorithm can reconstructprincipal components of macromolecules from noisy cryo-EMdata. The signal in the principal components is typically weakerthan the signal in the mean structure, and some amount of noiseinevitably percolates into the principal component estimate. Theestimation technique could further benefit from selective sup-pression of the background noise in the component. One possi-bility is to use an adaptive basis technique such as in(Kucukelbir et al., 2012). Another challenge is to account for con-trast variation in the images. This is particularly important whennegative staining is used. The range of contrast variation for neg-ative staining is larger than the range for cryo-EM, and incorpo-rating a more sophisticated contrast model in the generativemodel for principal components is likely to help with negativestaining.
The principal components that we found so far have been bio-logically meaningful. But, occasionally, the interpretation of princi-pal components can be tricky. Then, a rotation of the principalcomponents within the subspace spanned by the principal compo-nents can be helpful. The classical principal component analysis lit-erature contains many criteria for rotating principal components.Most of these criteria attempt to rotate the principal componentsso that they contain large and small loadings (loadings are thecoordinates of the data on the principal component axes), makingit easier to interpret the components. The popular varimax crite-rion, for example, achieves this by maximizing the sum of vari-ances of the squared loadings. A detailed discussion of thedifferent criteria, and their advantages and limitations, can befound in chapter 11 of Jolliffe et al. (2002). It would be interestingto explore this idea in the context of heterogeneous particles. Forexample, if a set of principal components turn out to be biologicallydifficult to interpret, perhaps they could be rotated in a way thattheir interpretation becomes easier.
There are other alternatives to principal component analysis.For example, independent component analysis finds componentsalong which the data are independent rather than just uncorre-lated (Hyvarinen et al., 2001). Sparse approximations to the covari-ance structure are also tractable (Bien et al., 2010). In spite of thesemore sophisticated alternatives, principal component analysis isoften the first choice of method to understand covariance in thedata.
Acknowledgements
This research was supported by the NIH grant 1R01GM095658.We would also like to thank Victoria Rudakova, Nicha Dvornek,Yunho Kim, and Lisa Berlinger for their help.
Appendix A. The Fourier slice theorem for covariances
This appendix contains the mathematical details of the Fourierslice theorem for covariances.
Recall that s is a random process in three dimensions with amean ls and a covariance function Rs. The process s is projectedon PN as

262 H.D. Tagare et al. / Journal of Structural Biology 191 (2015) 245–262
ynðaÞ ¼Z
sðaþ nrÞdr ð27Þ
by a the line integral along the normal ray through a. This makes yn
a two-dimensional stochastic process defined on Pn. The mean andcovariance of yn are
Mean : lynðaÞ ¼ E½ynðaÞ� ¼ E
� Zsðaþ rnÞdr
¼Z
E½sðaþ rnÞ�dr
¼Z
lsðaþ rnÞdr; and
Covariance : Rynða; bÞ ¼ E ðynðaÞ � lyn
ðaÞÞðynðbÞ � lynðbÞÞ
h i¼ E
Zsðaþ r1nÞdr1 �
Zlsðaþ r1nÞdr1
���Z
sðbþ r2nÞdr2 �Z
lsðbþ r2nÞdr2
�¼ E
Zðsðaþ r1nÞ � lsðaþ r1nÞÞdr1Þ
��Zðsðbþ r2nÞ � lsðbþ r2nÞÞdr2Þ
¼ZZ
E ðsðaþ r1nÞ � lsðaþ r1nÞÞðsðbþ r2nÞ�
�lsðbþ r2nÞÞ�dr1dr2
¼ZZ
Rsðaþ r1n; bþ r2nÞdr1dr2:
The Fourier transforms of the covariance functions are:
F sðx1;x2Þ ¼ZZ
e�iðxT1u1þxT
2u2ÞRsðu1;u2Þdu1du2; and
~F ynðm1; m2Þ ¼
ZZe�iðmT
1v1þmT2v2ÞRyn
ðv1;v2Þdv1dv2:
Let x1;x2 be two frequencies in the three-dimensional Fourierdomain and n be a vector perpepndicular to x1;x2. Let P0n be theplane perpendicular to n, so that P0n contains x1;x2 (Fig. 1b).Further, let Pn be a plane perpendicular to n in the spatial domain,and let v1 and v2 be two points in Pn. Set u1 ¼ v1 þ r1n andu2 ¼ v2 þ r2n, and set the differential volumes du1 and du2 todu1 ¼ dv1dr1 and du2 ¼ dv2dr2. Then,
F sðx1;x2Þ ¼ZZ
e�iðxT1u1þxT
2 :u2ÞRsðu1;u2Þdu1du2
¼Z
. . .
Ze�iðxT
1ðv1þr1nÞþxT2ðv2þr2nÞÞRsðv1 þ r1n;v2
þ r2nÞdv1dr1dv2dr2
¼Z
. . .
Ze�iðxT
1v1þxT2v2Þe�iðr1xT
1nþr2xT2nÞÞRsðv1 þ r1n; v2
þ r2nÞdv1dr1dv2dr2:
But, xT1n ¼ 0 and xT
2:n ¼ 0 because n is orthogonal to w1 and w2,giving
F sðx1;x2Þ ¼ZZ
e�iðxT1v1þxT
2v2ÞZZ
Rsðv1 þ r1n;v2 þ r2nÞdr1dr2
� �dv1dv2
¼ZZ
e�iðxT1v1þxT
2v2ÞRynðv1;v2Þdv1dv2 ¼ ~F yn
ðx1;x2Þ:
This establishes:
Theorem 1. (Fourier slice theorem for covariances) Let x1;x2 beany two points in three-dimensional Fourier space. If n is a unit lengthvector in the north hemisphere perpendicular to x1 and x1, then
~F ynðx1;x2Þ ¼ F sðx1;x2Þ:
Appendix B. Supplementary data
Supplementary data associated with this article can be found, inthe online version, at http://dx.doi.org/10.1016/j.jsb.2015.05.007.
References
Agrawal, R.K., Heagle, A.B., Penczek, P., Grassucci, R.A., Frank, J., 1999. EF-G-dependent GP hydrolysis induces translocation accompanied by largeconformational changes in the 70S ribosome. Nat. Struct. Biol. 6 (7), 643–647.
Anden, J., Katsevich, E., Singer A., 2015. Covariance estimation using conjugategradient for 3D classification in Cryo-EM, arXiv:1412.0985v2.
Basilevsky, A., 1994. Statistical Factor Analysis and Related Methods: Theory andApplications. Wiley.
Bien, J., Tibshirani, R., 2010. Sparse Estimation of a Covariance Matrix. Biometrika.Brooks, B., Karplus, M., 1985. Normal modes for specific motions of maromolecules:
application to the hinge-bending mode of lysozyme. Proc. Natl. Acad. Sci. 82,4995–4999.
Chacon, P., Tama, F., Wriggers, W., 2003. Mega-Dalton biomolecular motioncaptured from elextron microscopy reconstructions. J. Mol. Biol. 326, 485–492.
Chang, S., Sun, D., Liang, H., et al., 2015. Cryo-EM structure of influenza virus RNApolymerase complex at 4.3 Å resolution. Mol. Cell 57, 925–935.
http://www.cgl.ucsf.edu/chimera.Dashti, A., Schwander, P., Longlois, R., et al., 2014. Trajectories of the ribosome as a
brownian nanomachine. Proc. Natl. Acad. Sci. 111 (49), 17492–17497.Hino, T., Arakawa, T., Iwanari, H., et al., 2012. G-protein-coupled receptor
inactivation by an allosteric inverse-agonist antibody. Nature 482 (7384),237–240.
Hyvarinen, A., Karhunen, J., Oja, E., 2001. Independent Component Analysis:Algorithms and Applications. Wiley.
Jin, Q., Sorzano, C.O.S., Rosa-Trevin, J.M., Bilbao-Castro, J.R., Nunez-Ramirez, R.,Llorca, O., Tama, F., Jonic, S., 2014. Iterative elastic 3D-to-2D alignment methodusing normal modes for studying structural dynamics of large molecularcomplexes. Structure 22, 496–506.
Jolliffe, I.T., 2002. Principal Component Analysis. Springer Series in Statistics.Katsevich, E., Katsevich, A., Singer, A., 2015. Covariance matrix estimation for the
cryo-EM heterogeneity problem. SIAM J. Imaging Sci. 8 (1), 126–185.Kucukelbir, A., Sigworth, F.J., Tagare, H.D., 2012. A Bayesian adaptive basis
algorithm for single particle reconstruction. J. Struct. Biol. 179 (1), 56–67.Lyumkis, D., Brilot, A.F., Theobald, D.L., Grigorieff, N., 2013. Likelihood-based
classification of cryo-EM images using FREALIGN. J. Struct. Biol. 183, 377–388.McLachlan, G., Krishnan, T., 2008. The EM Algorithm and Extensions. Wiley
Interscience.Penczek, P.A., Kimmel, M., Spahn, C.M.T., et al., 2011. Identifying conformational
states of macromolecules by eigen-analysis of resampled cryo-EM images.Structure 19 (11), 1582–1590.
Pettersen, E.F., Goddard, T.D., Huang, C.C., Couch, G.S., Greenblatt, D.M., Meng, E.C.,Ferrin, T.E., 2004. UCSF Chimera—a visualization system for exploratoryresearch and analysis. J. Comput. Chem. 25 (13), 1605–1612.
Scheres, S.H.W., Gao, H., Valle, M., Herman, G.T., Eggermont, P.P.B., Frank, J., Carazo,J.M., 2007. Disentangling conformational states of macromolecules in 3D-EMthrough likelihood optimization. Nat. Methods 4, 27–29.
Scheres, S.H.W., 2012a. A Bayesian view on cryo-EM structure determination. Journ.Mol. Biol. 415, 406–418.
Scheres, S.H.W., 2012b. RELION: implementation of a bayesian approach to cryo-EMstructure determination. J. Struct. Biol. 180, 519–530.
Shaikh, T.R., Gao, H., Baxter, W.T., Asturias, F.J., Boisset, N., Leith, A., Frank, J., 2008.SPIDER image processing for single-particle reconstruction of biologicalmacromolecules from electron micrographs. Nat. Protoc. 3 (12), 1941–1974.
Shang, Z., Sigworth, F.J., 2012. Hydration-layer models for cryo-EM simulation. J.Struct. Biol. 180 (1), 10–16.
Tipping, M.E., Bishop, C.M., 1999. Probabilistic Principal Component Analysis. Journ.Roy. Stat. Soc. Ser B 21 (3), 611–622.
Wang, Q., Matsui, T., Domitrovic, T., Zeng, Y., Doerschuck, P.C., Johnson, J.E., 2013.Dynamics in cryo EM reconstructions visualized with maximum-likelihoodderived variance maps. J. Struct. Biol. 181, 195–206.
Zeng, X., Stahlberg, H., Grigorieff, N., 2007. A maximum likelihood approach to two-dimensional crystals. J. Struct. Biol. 160, 362–374.
Zeng, Y., Wang, Q., Doerschuck, P.C., 2012. Three dimensional reconstruction of thestatistics of heterogeneous objects from a collection of one projection image ofeach object. J. Opt. Soc. Am. A 29 (6), 959–970.