the effect of structural heterogeneity on the conformation...
TRANSCRIPT
RSC Advances
PAPER
Publ
ishe
d on
20
May
201
6. D
ownl
oade
d by
Bos
ton
Uni
vers
ity o
n 01
/07/
2016
02:
18:4
0.
View Article OnlineView Journal | View Issue
The effect of stru
aDepartment of Mechanical Engineering, Ko
Korea. E-mail: [email protected] of Mechanical Engineering, Bo
E-mail: [email protected]
† Electronic supplementary informa10.1039/c6ra09467h
‡ These authors (H. C. and M. L.) contrib
Cite this: RSC Adv., 2016, 6, 52236
Received 12th April 2016Accepted 20th May 2016
DOI: 10.1039/c6ra09467h
www.rsc.org/advances
52236 | RSC Adv., 2016, 6, 52236–5224
ctural heterogeneity on theconformation and stability of Ab–tau mixtures†
Hyunsung Choi,‡a Myeongsang Lee,‡a Harold S. Park*b and Sungsoo Na*a
Oligomeric and fibrillar amyloids, which cause neurodegenerative diseases, are typically formed through
repetitive fracture and elongation processes involving single homogeneous amyloid monomers.
However, experimental and computational methods have shown that the amyloid proteins could be
composed of heterogeneous amyloid segments. Specifically, owing to the polymorphism of amyloids
under physiological conditions, it is crucial to understand the structural characteristics of heterogeneous
amyloids in detail by considering their specific mutations and polymorphic nature. Therefore, in this
study we used atomistic simulations to reveal the various structural characteristics of heterogeneous
amyloids, which are amyloids composed of amyloid beta (Ab) and mutated tau proteins. Furthermore, we
showed that the different characteristics and conformations of Ab–tau mixtures are the cause of the
different types of tau proteins based on Ab segments. Interestingly, we found that valine and lysine
residues have a significant impact on the structural conformation and stability of the heterogeneous Ab–
tau mixtures. We also showed that two types of binding are key to understanding the different binding
features and mechanical reactions to tensile load. This study sheds light on the assembly features of
heterogeneous Ab–tau mixtures as neurodegenerative disease factors.
1. Introduction
Amyloidogenic proteins are the hallmark of pathologicalneurodegenerative disorders such as phenylketonuria and Alz-heimer's, Parkinson's, Huntington's, and prion-relateddiseases.1–4 Such proteins make a key contribution to neuro-degenerative diseases and exist in vivo in various forms such asbers, oligomers, and plaques. Fibrillar amyloids are frequentlyobserved from experimental studies using atomic forcemicroscopy, transmissible electron microscopy, scanning elec-tron microscopy, cryo-electron microscopy, etc.5–7 Owing to thenon-degradable characteristics of brillar amyloids, manyattempts have beenmade to determine the structures of brillaramyloid proteins. Recently, the importance of oligomericamyloid structures has emerged; not only do oligomericamyloids act as seeds that develop into brillar amyloids oramyloid plaques, but they also have toxic characteristics underphysiological conditions.8–10 In particular, the toxic character-istics of oligomeric amyloids have been proven throughmembrane permeation, deletion of the lipid bilayer, andinammatory reaction phenomena.8 Thus, it is important to
rea University, Seoul 02841, Republic of
ston University, Boston, MA 02115, USA.
tion (ESI) available. See DOI:
uted equally to this work.
7
understand the formation and structural characteristics ofoligomeric amyloids.
Many attempts have been made to determine the toxiccharacteristics of amyloid oligomers and bers, and themechanisms underlying their formation from single-unitmonomers. For instance, Collins et al. reported the interme-diate progression from oligomeric to brillar Sup35 amyloidsthrough repetitive additions of monomer, oligomeric elonga-tions, and fragmentations.11 Xue et al. revealed that the bio-logical properties of fragmented amyloid brils, whichcomprise fragmented amyloid proteins, have a toxic effect oncell viability and are involved in the deletion of the membranelipid bilayer.12 Furthermore, the brillar or oligomeric growthphenomena of amyloid monomers were observed under variousphysiological conditions including pH, ionic strength, andpresence of metal ions.6,13–16 For example, different environ-mental conditions induce diverse formations of transthyretin(residues 105–115) amyloid protobrils, which change accord-ing to lateral thickness composition.17–19 The polymorphiccharacteristics of oligomeric amyloids that arise from differentenvironmental segments have also been reported.20–23 More-over, several experimental groups have investigated the role ofspecic metal ions on oligomeric and brillar amyloid forma-tions, and found that specic metal ions accelerate the forma-tion of amyloid beta (Ab) oligomeric amyloids.15,24–27 Specicresidue-mutated segments also have an effect on the formationof amyloids. For example, computational and experimentalinvestigations of particular mutated residues, or the solvent
This journal is © The Royal Society of Chemistry 2016
Paper RSC Advances
Publ
ishe
d on
20
May
201
6. D
ownl
oade
d by
Bos
ton
Uni
vers
ity o
n 01
/07/
2016
02:
18:4
0.
View Article Online
effects at salt-bridge regions and central hydrophobic core(CHC) regions, have shown that mutated residues alter thestructural conformations and characteristics of Ab amyloidproteins.28–34
However, although an understanding of oligomeric single-amyloid proteins is crucial, determining the cross-seedingeffects on oligomeric and brillar amyloid growth is alsoimportant. Generally, the agents of Alzheimer's disease areconsidered to be aggregated Ab amyloid tangles (i.e., oligomers,bers, and plaques), which are generated by the proteolyticactivation of beta amyloid precursor protein (APP) atmembranes.8 However, aer proteolytic processing of betaamyloid precursor protein frommembranes, these APP proteinshave an effect on tau proteins in the microtubules of humanbrains, causing the detachment of tau proteins from microtu-bules and inammatory reactions.35,36 Subsequently, these APPproteins combine with tau proteins, which act as seeds, formingbrillar forms and plaque structures. This “cross-seeding”phenomenon affects brillar growth. Based on these cross-seeding development phenomena, Guo et al. reported insol-uble mixtures of the oligomeric form of Ab and tau proteins inAlzheimer's disease.37 They used western blotting to determinethe specic binding sites between the C-terminal region of Aband tau proteins. Ono et al. also investigated the cross-seedingeffects of Ab and a-synuclein proteins based on differentamounts of additional individual amyloid proteins.38 Similarly,Seeliger et al. reported the heterogeneous interaction betweenhIAPP and Ab amyloid proteins at lipid membranes.39 Inter-estingly, Pinotsi et al. directly observed heterogeneous amyloidbril growth by single alpha-synuclein protein structuresthrough two-color super-resolution microscopy.40 They reportedthat homogeneous elongation depends on the particular a-synuclein amyloid at the ends of the protein seed for eachdifferent direction. Under physiological conditions, not only didsingle monomers of amyloids develop into oligomeric andbrillar amyloid proteins, but heterogeneous amyloid proteinswere also found to grow into oligomeric and brillar amyloidstructures.
To understand in detail the cross-seeding effects of hetero-geneous oligomeric amyloids, computational methods havebeen applied to each individual heterogeneous amyloidprotein.41,42 For example, Miller et al. used replica-exchangemolecular dynamics (REMD) and Monte Carlo methods toinvestigate heterogeneous tau and Ab amyloid proteins basedon the b-turn-b motif.43 They suggested synergistic interactionsbetween Ab and polymorphic structures of tau protein usingequilibrated MD simulations of different partial tau proteinregions.42 Moreover, despite applying the different heteroge-neous types of amyloid from the computational study con-ducted by Miller et al., Berhanu et al. reported different amyloidcompositions in hIAPP and Ab proteins through equilibratedMD study.44 Recently, Zheng et al. reported different oligomericamyloid compositions in hIAPP and Ab amyloid proteins usingmulti-scale MD simulation including equilibrated MD andcoarse-grained MARTINI MD simulations.45 Using combinedMD studies, they reported that the double layer and elongationmodels of cross-seeding structures are stable. Likewise,
This journal is © The Royal Society of Chemistry 2016
understanding heterogeneous amyloid protein in detail isimportant because it has different structural characteristics.Recently, using combined computational and experimentalmethods, Miller et al. and Shea et al. have reported variousstructural compositions resulting from the specic deletion ofthe 280th residue in the R2 region of the tau protein(DK280).41,46 They investigated the polymorphic characteristicsof the R2 region of the tau protein by deleting the K280 residueand adding additional residues (i.e., lysine and proline). Thedeletion of the K280 residue and the addition of other residuesaffected the structural stability of the tau proteins because thelysine residue is a charged amino acid. Furthermore theresearchers also reported the possible existence of heteroge-neous Ab–tau protein mixtures varying in tau componentcontent (i.e., R2, R3, and R4). However, the effects of poly-morphic R2 tau structures, which are composed of DK280 andadditional residues, still need to be determined to understandthe heterogeneous cross-seeding mechanism. Considering thatoligomeric Ab amyloid proteins together with tau proteins arecrucially related to Alzheimer's disease, it is also important toinvestigate the structural characteristics of heterogeneousinteractions between Ab and polymorphic R2 tau proteinstructures in terms of the different effects of hydrophobicityarising from DK280 and additional residues.
In this study, we investigated the structural characteristics ofheterogeneous interactions between Ab and tau protein struc-tures based on polymorphic tau structures by considering theeffects of DK280 and additional residues. We also constructedtwo different binding models of heterogeneous Ab–tau oligo-meric mixtures to understand the different binding mecha-nisms of heterogeneous interactions, referring to bindingmechanisms previously suggested by Pinotsi et al., Shvadchaket al., and Xu et al.40,47,48 By using combined MD and steeredmolecular dynamics (SMD) techniques, we have providedcomprehensive insights into the heterogeneous structuralcharacteristics of mutated tau and Ab amyloid oligomers. Wehave also suggested various oligomeric characteristics ofheterogeneous mixtures and different binding features betweenmutated tau and Ab oligomeric structures for the two elonga-tion types.
2. Material and methods2.1. Construction of heterogeneous Ab and tau structures
To compose the heterogeneous Ab and tau structures, we usedLuhrs model of Ab17–42 and the second repeat part (275R2305) offull-length tau protein structures. Basically, because both theAb17–42 and
275R2305 tau structures from previous studies sharethe common b-turn-bmotif, we used Luhrs model of Ab17–42 forstructure construction, with Protein Data Bank symbol 2BEG.29
Here, we considered Ab17–42 as a template for seeds because Abstructures detach the full-length tau proteins from binding tomicrotubules. Luhrs et al. conducted multiple structuralmodels from the Ab17–42 structures determined by NMR inves-tigations.29 The 275R2305 tau regions, which are known to havethe most stable interactions with Ab17–42 proteins, wereconsidered in this study, referring to studies by Miller et al.41,42
RSC Adv., 2016, 6, 52236–52247 | 52237
RSC Advances Paper
Publ
ishe
d on
20
May
201
6. D
ownl
oade
d by
Bos
ton
Uni
vers
ity o
n 01
/07/
2016
02:
18:4
0.
View Article Online
For the construction of the 275R2305 tau proteins, we followedprevious computational and experimental studies, which foundthose proteins to be stable. Additionally, in the present study,we suggest another model for 275R2305 tau oligomers using therst and second structure from Luhr's model. By replacing thetau residues on the second structure of Luhr's model, we wereable to observe the hydrophobic effect of interior and exteriorvaline residues on the 275R2305 tau oligomers. To distinguishbetween internal and external valine residue locations in thewildtype 275R2305 tau oligomers, we denoted them WT1 andWT2, respectively.
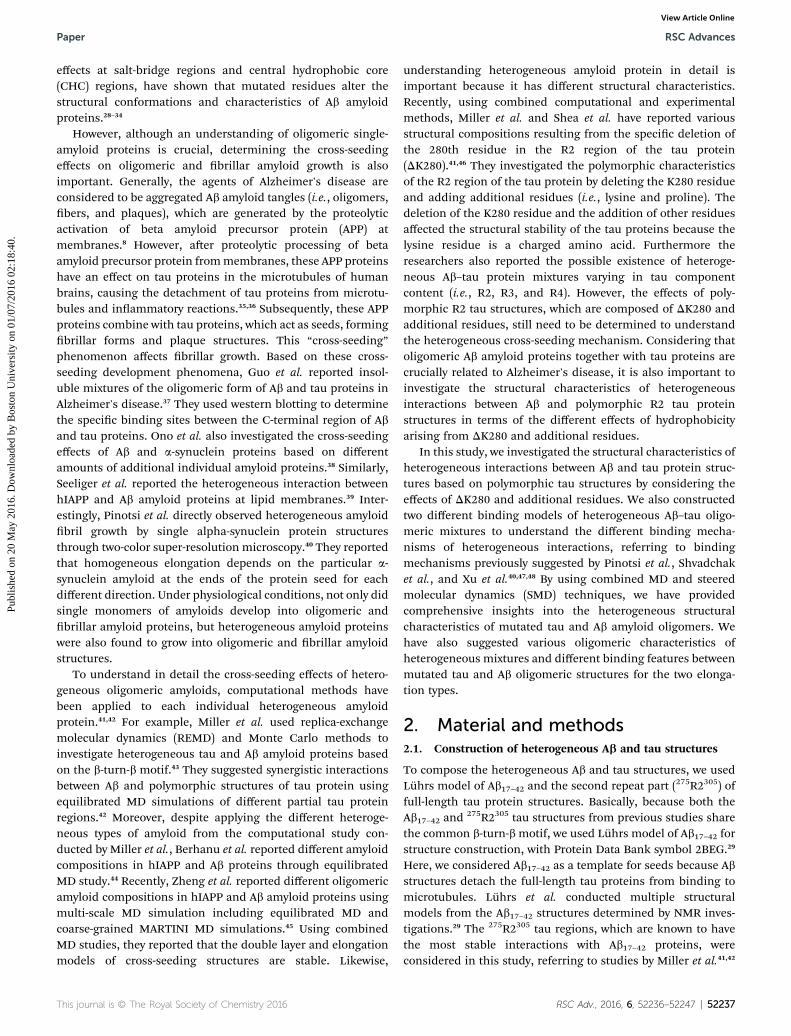
Before building up the various Ab–tau oligomeric structures,we differentiated between the two types of binding in the Ab–taumixtures by considering the experimental results reported byPinotsi et al. As mentioned in the previous section, we assumedthat Ab17–42 assumed the role of the seed, which act as thereference structure. Based on this assumption, we constructedthe top of the tau structure and the bottom of the Ab structure,which was designated ‘T1’. The ‘T2’ model is the reverse of the‘T1’ model in that the tau model was constructed at the bottomsection while the Ab model was located at the top section. Thestructural congurations of the T1 and T2 models are describedin Fig. 1(a).
To construct the T1 model, eight layers of Ab were initiallystacked up. Four top layers were then placed into tau sequencesusing the Visual Molecular Dynamics (VDM) “mutator” plugin.We also constructed the mutated model of 275R2305 tau byfollowing previous tau computational and experimental modelssuch as M1, M31, and M41.41 Using this process, we excludedM2, M32, and M42 models owing to the loss of stabilityresulting from the change in the number of hydrogen bondsfrom Raz et al.41 The M1, M31 and M41 models were generatedto obtain the samemutatingmethods to compare themwith thewildtype taumodels. M1 was constructed based on the preparedwildtype 275R2305 tau model by deleting the K280 residue(DK280). Aer the DK280 procedure, the remaining void residueregion was lled by shiing the rest of the C-terminus sequence
Fig. 1 (a) A scheme of possible binding site for monomers. Upper and lowrepresented at middle (red). T1 and T2 refer to the different binding types,The cross-sectional configurations of simulation models are representemonomers are written in blue. The shape of beta-turn-beta is drawn witdescribed with color spheres. Red sphere indicate hydrophobic charactresidues and green sphere indicate uncharged residues.
52238 | RSC Adv., 2016, 6, 52236–52247
residues towards K280. The M31 model is generated byextending the tail of the C-terminal part of the 273R2305 tausequence by adding one proline residue (P301) to theM1model.The M41 model was generated by extending the tail of the N-terminal of the 275R2305 tau protein by adding one lysineresidue (K274). Based on these construction processes, wedenoted the models WT1T1, WT2T2, M1T1, M31T1, andM41T1. The remaining T2 binding model was modeled in thesame way as the T1 model. The basic cross-sections of each Ab–tau are represented in Fig. 1(b).
2.2. Molecular dynamics (MD) simulations protocol
Aer composing both wildtype and mutated heterogeneous Ab–tau structures, the GROMACS 4.6.5 program with theCHARMM27 force eld was used to construct the heteroge-neous Ab–tau mixtures.49 Total structural energies of oligomerswere minimized using the steepest descent method for 10 000steps. Aer that, they were solvated explicitly with TIP3P watermolecules in a triclinic box, with a boundary distance of 15 A foreach side of the water box. All of the water molecules within 2.5A of the Ab–tau oligomers were removed. Counter ions wereadded to neutralize the net charge of the Ab around the struc-ture. A temperature of 330 K was maintained using theBerendsen thermostat algorithm. The short-range van derWaals interactions were computed using the switching func-tion, with a twin range cut-off of 10.0 and 12.0 A. Long-rangeelectrostatic interactions were computed using the particlemesh Ewald method with a cutoff of 12.0 A. The leapfrog inte-grator was used for the equations of motion as an integrator,with a time-step of 2 fs. The solvated system energies wereminimized, and then equilibrium simulations were computedwith NVT and NPT ensembles for 100 ps during each step (inNVT ensembles, amount of atom (N), volume (V), and temper-ature (T) are conserved; in NPT ensembles, N, pressure (P), andT are conserved). All the atoms were constrained and the SHAKE
er monomers (blue) are indicating tau monomers and Abmonomer iswhich are upper binding (T1) and beneath binding (T2), respectively. (b)d. The names of Ab monomers are written in red and the name of tauh tube and sphere by VMD program. Alpha carbons of each layers areeristic, blue means hydrophilic characteristic, silver represents special
This journal is © The Royal Society of Chemistry 2016

Paper RSC Advances
Publ
ishe
d on
20
May
201
6. D
ownl
oade
d by
Bos
ton
Uni
vers
ity o
n 01
/07/
2016
02:
18:4
0.
View Article Online
algorithm was applied for the constraint algorithm. All the MDsimulations were run for 20 ns at 330 K with the NPT ensemble.
2.3. Structural characteristic analysis of heterogeneous Ab–tau
To investigate the structural stability of the heterogeneous Ab–tau oligomer mixture aer equilibriumMD simulation, we usedroot mean square deviation (RMSD), the number of hydrogenbonds, and Poisson–Boltzmann surface area (MM/PBSA) anal-ysis.50 For the structural conformation analysis, RMSD wasmeasured using the g_rmsd plugin of the GROMACS program.Subsequently, to investigate the structural characteristics of theAb–tau oligomer, MM/PBSA and the number of hydrogen bondswere measured using g_hbonds and g_mmpbsa plug in ofGROMACS. For the RMSD and the number of hydrogen bonds,data for each model were obtained over the entire 20 ns period.Specically, the MM/PBSA method was applied to evaluate thestabilities of interactions between stabilized heterogeneousmixtures for the stacked directions using the g_mmpbsa pluginof the GROMACS 4.5.6 program. MM/PBSA analysis congura-tions were extracted every 1 ps. The binding energy for the MM/PBSA calculations was given by the following equation:
DGbinding ¼ Gmixture � (GAb + GTau) (1)
here, Gmixture is the total free energy of the Ab–tau mixture, andGAb and GTau represent the isolated total free energies insolvent, respectively. The total free energy was computed usingthe following equation:
Gmonomer ¼ hEMMi + hGsolvationi (2)
where Gmonomer represents either the Ab, tau, or Ab–taumixture,hEMMi is the average molecular mechanics (MM) potentialenergy versus time, which comprises bond, bond angle, dihe-dral, and non-bonded energies, and hGsolvationi represents thesolvation free energy for the entire MD simulation. Sinceentropic terms are ignored for calculation of the total freeenergy for monomers, the calculated solvation free energyrepresents the relative, rather than the absolute, energy. Eventhough we did not consider the entropic contribution to thecalculation of energy, the summation of the total contributionof entropic terms to the system was quite small. Therefore weignored those terms in the calculation of the total solvationenergy.50–52 Using the MM/PBSA method, the solvation freeenergy can be calculated using the two terms below:
Gsolvation ¼ GPB + Gnonpolar (3)
whereGPB and Gnonpolar are distinguished by electrostatic effectson the solvation free energy. GPB was estimated using thePoisson–Boltzmann equation,50 whereas Gnonpolar wascomputed using the following equation:
Gnp ¼ Y � SASA + b (4)
This equation can be used with the parameters of Y ¼0.0226778 kJ mol�1 A�2 and b ¼ 3.84928 kJ mol�1. Solvent
This journal is © The Royal Society of Chemistry 2016
accessible surface area (SASA) was obtained using the g_sas toolof the GROMACS program for each model.
2.4. Steered molecular dynamics (SMD) simulationsprotocol
To support the conformational stability of the heterogeneousAb–tau oligomer results from equilibrium MD, and to under-stand the structural characteristics, SMD simulations wereperformed using GROMACS 4.6.5 with CHARMM27 force eld.Tensile tests of Ab–tau oligomers were performed to determinethe properties of the different heterogeneous oligomer compo-sitions, via time–force results. During the tensile test simula-tions, Ab monomers were xed and tau monomers are pulledunder conditions of constant velocity by mimicking the atomicforce microscopy tensile test. The pulling rate for constantvelocity was 0.001 nm ps�1 and the spring constant was 1000 kJmol�1 nm�2, using the NPT ensemble. During the analysis ofthe time–force trajectories, we extracted the conguration datafor the Ab–tau oligomers every 2 ps.
3. Results and discussions3.1. Conformational characteristics of heterogeneous Ab–tau models
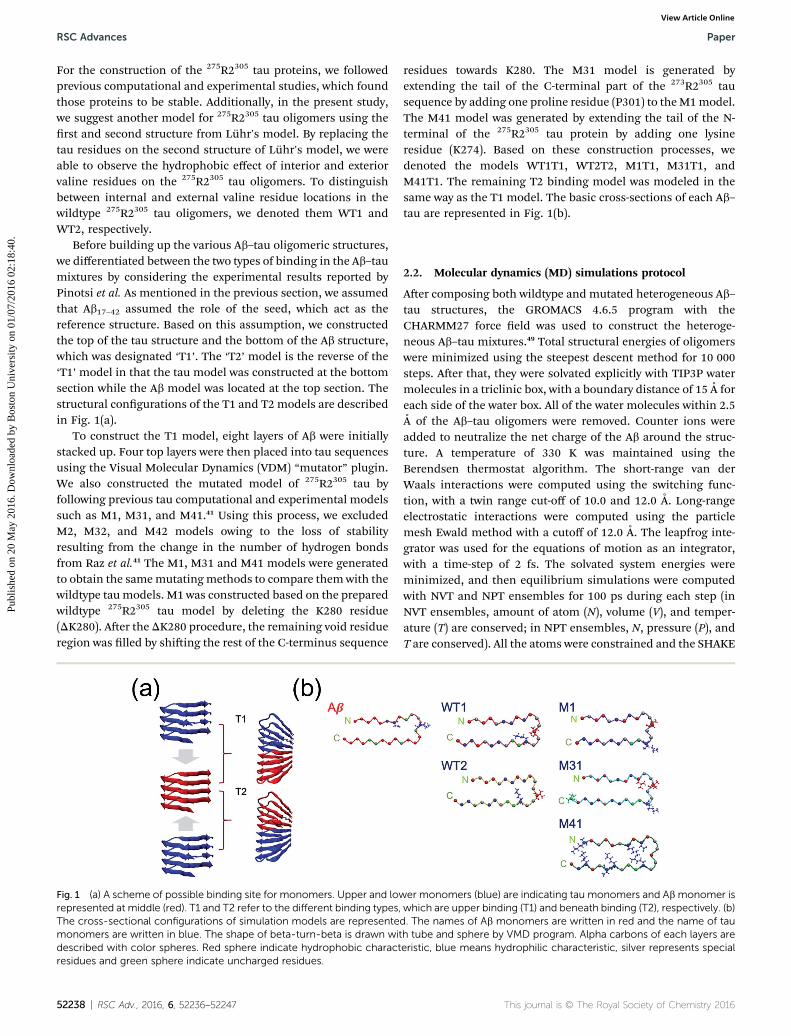
In this study, the WT and mutated heterogeneous Ab–taumodels including different amyloid binding characteristics (i.e.,T1 and T2), were computed for comparisons of the structuralstabilities and their characteristics. WT models and mutated(M1, M31, and M41) models including different binding typeswere prepared to investigate the impact of different sequenceson the stabilities of heterogeneous interactions. The charac-teristics of the heterogeneous Ab–tau oligomers, including thedetailed sequences and the amino acids features of each model,are given in Tables S1 and S2.† Ab monomers are regarded asseeds that have two binding sites for elongation, attaching taualong the bril axis, as shown in Fig. 1(a). Here, only parallelinter-layer interactions based on b-turn-b motif betweenheterogeneous monomers are considered, because parallelheterogeneous interactions are more stable than anti-parallelinter-layer interactions.43 These stable parallel and unstableanti-parallel characteristics were computationally investigatedby Raz et al., who computed the possible structural composi-tions of Ab and tau oligomers.43 The dominant differencesbetween the two binding types, T1 and T2, are described indetail in Fig. S2.† Fig. 2(a) depicts an exact comparison of the T1and T2 models viewed along the same bril axis. Those twodifferently constructed oligomers look like mirror images ofeach other, and their cross-sectional representations are shownin Fig. S1.†
Through the equilibrium MD simulations we found thateach heterogeneous Ab–tau mixture become stable aer 15 ns,as shown in Fig. 4 and 6 (see initial 0 ns time-section). Somemutated models showed relatively higher or lower structuralstability compared with the WT models, which may have beencaused by the structural uctuation near the N- and C-terminalregions. The stabilities of the heterogeneous Ab–tau mixtures
RSC Adv., 2016, 6, 52236–52247 | 52239
Fig. 2 (a) A scheme for the oligomers, which are stacked along the different directions (T1 and T2). The root mean squared deviation (RMSD)values are plotted for each simulation models at (b).
RSC Advances Paper
Publ
ishe
d on
20
May
201
6. D
ownl
oade
d by
Bos
ton
Uni
vers
ity o
n 01
/07/
2016
02:
18:4
0.
View Article Online
were conrmed by RMSD analysis, as shown in Fig. 2(b). Allmodels converged aer approximately 15 ns, having differentconvergent values. The results can be compared with previouscomputational mutated proteinaceous material studies. Most ofthe RMSD results gradually converged. The total deformationswere approximately 2–4 A. Some models of Ab–tau structures(i.e., M1 andWT1) were deformed from the beginning, but therewere notably big deformations in the conformational resultsand RMSD graphs (i.e., Fig. 2 and 4). However, rapid changes ofRMSD were observed in the WT2T1, M41T1, and M31T1models. Especially, M31T1 model undergoes the little confor-mational change at 10–12 ns period, in which degradation ofbeta-turn-beta motif at tau region was observed. The results arecomparable to the results of previous conformational analyses,which were conducted to determine the end terminal uctua-tion behavior of the oligomers. In particular, the WT2T2 modelwas considerably deformed during the early time period, andthe breakage of the two top layers of the tau protein region wasobserved from the beginning of the equilibration simulation.The exterior-located lysine residues appeared to inducebreakage by electrostatic repulsion. However, the interiorhydrophobic regions contracted to reduce the number of watermolecule within a few picoseconds, thereby stabilizing theinterior region. Here, we classied the hydrophobic andhydrophilic residues of Ab and tau mixtures following thehydropathy scale measurement of Kyte et al.53 More hydro-phobic and hydrophilic residue information was classied inESI Table S2† in detail. This interior stabilization was notobserved in the M31T1 model, as reected in the RMSD graphs(le graphs in Fig. 2(b) around 10 ns over two steps). This mayhave been affected by the proline residue, which acts as a beta-sheet breaker at the N-terminal of M31T1. It is interesting thatthe overall convergent values of RMSD for the T2 modelsexhibited lower deviation than those for the T1 models.
Fig. 2(a) and (b) shows that the order of convergence timesand RMSD values for each model were similar for the differentbinding types (T1 and T2), and followed the order: M1 > WT1 >M41 > M31 > WT2. The order of RMSD in the Ab–tau mixtureshas the same tendency as in a previous study by Miller et al.,which was performed with only tau models.41,42 From theirRMSD results, the low distance order of M1 > M41 > M31 > WTwas obtained. Considering the different binding directions
52240 | RSC Adv., 2016, 6, 52236–52247
applied in this study (i.e., T1 and T2), our RMSD results werereliable compared with the results obtained by Raz et al.41 Theconvergent values and their order were mainly caused by thedeletion of the lysine residue at position 280. In previousresearch by Raz et al. and Lee et al., the mutated residueseffected structure stabilities.41,54 Those researchers reportedthat deleting or mutated the lysine residue not only changed themutated tau protein conformations, but also changed conver-gence. For instance, Lee et al. investigated the effect of thesubstitution of glutamine for lysine in tau proteins (i.e., the Q2Kmodel) using a 50 ns equilibrium MD.54 From their results, theRMSD convergence tendency of Q2K was faster and had a lowervalue than the wildtype tau structures.
We observed that the various kinds of Ab–tau mixtures werestable aer the 20 ns equilibrium simulations. The differentbinding types for the mixtures showed that the T2 models weremore stable than the T1 models, as supported by the RMSD andconformational results. From the RMSD results, we determinedthat deletion of lysine at position 280 altered the structuralconformations and their characteristics. In particular, theproline residue in M31T1 caused more instability than inM41T1. Furthermore, the interior or exterior location of thevaline residue also had an effect on the stability of the struc-tures, as shown by computing the differences between theWT1T1 and WT2T1 models. The results from the wildtype (WT)and Ab–mutated tau mixtures provided insight into the hydro-phobicity, and the charged amino acids altered the stability ofeach model. The M1 model had higher structural stability thanthe other models owing to the loss of the charged amino acid(i.e., the lysine residue). Moreover, we observed that, incomparing WT1T1 and WT2T1, the interior location of thevaline residue enhanced the structural hydrophobicity and theresulting structural stability.
3.2. Structural characteristics of the Ab–tau mixtures
Previous computational studies on homogeneous and hetero-geneous amyloids have revealed that the number of inherenthydrogen bonds in a proteinaceous structure is related to itsstructural stability and mechanical characteristics.55–59 Speci-cally, several recent studies have investigated the impact of end-terminus uctuation on structural stability.60,61 It is also known
This journal is © The Royal Society of Chemistry 2016
Paper RSC Advances
Publ
ishe
d on
20
May
201
6. D
ownl
oade
d by
Bos
ton
Uni
vers
ity o
n 01
/07/
2016
02:
18:4
0.
View Article Online
that mutations in the CHC regions, the salt-bridge (i.e., Ab), andthe partition hydrophobic residue (i.e., hIAPP) of amyloids notonly affect their uctuation, but also change their structuralcharacteristics.30
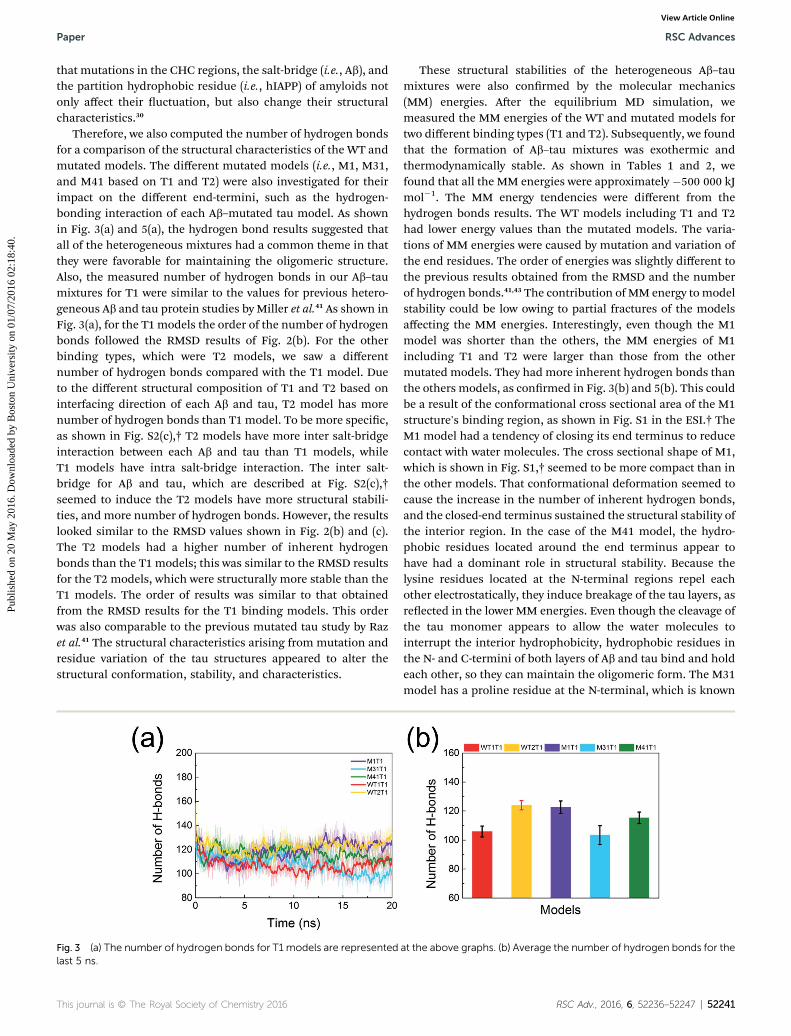
Therefore, we also computed the number of hydrogen bondsfor a comparison of the structural characteristics of the WT andmutated models. The different mutated models (i.e., M1, M31,and M41 based on T1 and T2) were also investigated for theirimpact on the different end-termini, such as the hydrogen-bonding interaction of each Ab–mutated tau model. As shownin Fig. 3(a) and 5(a), the hydrogen bond results suggested thatall of the heterogeneous mixtures had a common theme in thatthey were favorable for maintaining the oligomeric structure.Also, the measured number of hydrogen bonds in our Ab–taumixtures for T1 were similar to the values for previous hetero-geneous Ab and tau protein studies by Miller et al.41 As shown inFig. 3(a), for the T1 models the order of the number of hydrogenbonds followed the RMSD results of Fig. 2(b). For the otherbinding types, which were T2 models, we saw a differentnumber of hydrogen bonds compared with the T1 model. Dueto the different structural composition of T1 and T2 based oninterfacing direction of each Ab and tau, T2 model has morenumber of hydrogen bonds than T1 model. To be more specic,as shown in Fig. S2(c),† T2 models have more inter salt-bridgeinteraction between each Ab and tau than T1 models, whileT1 models have intra salt-bridge interaction. The inter salt-bridge for Ab and tau, which are described at Fig. S2(c),†seemed to induce the T2 models have more structural stabili-ties, and more number of hydrogen bonds. However, the resultslooked similar to the RMSD values shown in Fig. 2(b) and (c).The T2 models had a higher number of inherent hydrogenbonds than the T1 models; this was similar to the RMSD resultsfor the T2 models, which were structurally more stable than theT1 models. The order of results was similar to that obtainedfrom the RMSD results for the T1 binding models. This orderwas also comparable to the previous mutated tau study by Razet al.41 The structural characteristics arising from mutation andresidue variation of the tau structures appeared to alter thestructural conformation, stability, and characteristics.
Fig. 3 (a) The number of hydrogen bonds for T1 models are representedlast 5 ns.
This journal is © The Royal Society of Chemistry 2016
These structural stabilities of the heterogeneous Ab–taumixtures were also conrmed by the molecular mechanics(MM) energies. Aer the equilibrium MD simulation, wemeasured the MM energies of the WT and mutated models fortwo different binding types (T1 and T2). Subsequently, we foundthat the formation of Ab–tau mixtures was exothermic andthermodynamically stable. As shown in Tables 1 and 2, wefound that all the MM energies were approximately �500 000 kJmol�1. The MM energy tendencies were different from thehydrogen bonds results. The WT models including T1 and T2had lower energy values than the mutated models. The varia-tions of MM energies were caused by mutation and variation ofthe end residues. The order of energies was slightly different tothe previous results obtained from the RMSD and the numberof hydrogen bonds.41,43 The contribution of MM energy to modelstability could be low owing to partial fractures of the modelsaffecting the MM energies. Interestingly, even though the M1model was shorter than the others, the MM energies of M1including T1 and T2 were larger than those from the othermutated models. They had more inherent hydrogen bonds thanthe others models, as conrmed in Fig. 3(b) and 5(b). This couldbe a result of the conformational cross sectional area of the M1structure's binding region, as shown in Fig. S1 in the ESI.† TheM1 model had a tendency of closing its end terminus to reducecontact with water molecules. The cross sectional shape of M1,which is shown in Fig. S1,† seemed to be more compact than inthe other models. That conformational deformation seemed tocause the increase in the number of inherent hydrogen bonds,and the closed-end terminus sustained the structural stability ofthe interior region. In the case of the M41 model, the hydro-phobic residues located around the end terminus appear tohave had a dominant role in structural stability. Because thelysine residues located at the N-terminal regions repel eachother electrostatically, they induce breakage of the tau layers, asreected in the lower MM energies. Even though the cleavage ofthe tau monomer appears to allow the water molecules tointerrupt the interior hydrophobicity, hydrophobic residues inthe N- and C-termini of both layers of Ab and tau bind and holdeach other, so they can maintain the oligomeric form. The M31model has a proline residue at the N-terminal, which is known
at the above graphs. (b) Average the number of hydrogen bonds for the
RSC Adv., 2016, 6, 52236–52247 | 52241

Table 1 Molecular mechanics energies of T1 model, such as electro-static energy, van der Waals energy, and total energy for simulated olig-omers are given in the table
Binding type Model Elec energy (kJ mol�1) VdW energy (kJ mol�1) Total energy (kJ mol�1)
T1 WT1 88 394.698 � 784.44 �660 942.232 � 1106.65 �504 909.694 � 468.42WT2 86 863.695 � 757.59 �649 790.225 � 1066.26 �496 839.325 � 446.47M1 44 195.089 � 609.09 �331 670.063 � 858.01 �266 433.269 � 342.51M31 43 762.624 � 585.29 �327 748.023 � 829.74 �263 417.592 � 342.13M41 42 468.775 � 540.90 �319 571.035 � 799.33 �258 771.240 � 331.77
Table 2 Molecular mechanics energies of T2 model are given in the table
Binding type Model Elec energy (kJ mol�1) VdW energy (kJ mol�1) Total energy (kJ mol�1)
T2 WT1 80 818.161 � 778.66 �605 585.960 � 1144.64 �464 763.646 � 451.49WT2 85 730.531 � 816.61 �641 591.569 � 1104.67 �490 965.083 � 446.22M1 45 076.836 � 609.19 �338 861.031 � 857.61 �271 825.954 � 346.54M31 42 669.546 � 597.89 �320 532.008 � 809.17 �258 207.197 � 316.22M41 41 828.241 � 574.70 �314 728.820 � 812.61 �255 114.379 � 310.99
RSC Advances Paper
Publ
ishe
d on
20
May
201
6. D
ownl
oade
d by
Bos
ton
Uni
vers
ity o
n 01
/07/
2016
02:
18:4
0.
View Article Online
as an alpha-helix and beta-sheet breaker. The proline residue inthe M31 model revealed the structural instability of M31through the low number of hydrogen bonds and the high MM/PBSA energy.
Through the number of the hydrogen bonds and the MMenergy analysis, we observed that all the WT and mutatedmodels were stable during the 20 ns equilibrium MD simula-tions. The structural characteristics of the Ab–tau mixtures wereanalyzed via the hydrogen bond data sets, which had similarcharacteristics to the conformational and RMSD results. Inter-estingly, the T2 models had more hydrogen bonds than the T1models. The different number of hydrogen bonds induceddifferent structural features: the beta sheets in the T2 modelsseemed to be more parallel than those in the T1 models. Ananalysis of the MM energies showed that the different ther-modynamic characteristics supported the previous structuraldifferences between the WT and mutated models, such asconformation, RMSD, and the number of hydrogen bonds. Forexample, as shown in Tables 1 and 2, the results showed thatthe lysine residue in theWTmodels increased the van derWaalsenergies and the electrostatic energies of the whole oligomericmixtures. We not only investigated the structural compositionsof the mixtures, but also determined the structural features ofheterogeneous Ab and tau in detail, through the number ofhydrogen bonds and MM energy results.
3.3. Mechanical behavior and structural characteristics ofmixtures against constant velocity tensile load
From the previous computational studies on amyloids, thestructural characteristics of amyloids were investigated throughRMSD, the number of hydrogen bonds, MM/PBSA, and otheradditional parameters.30,57 Here, we applied the SMD methodsto heterogeneous Ab–tau mixtures to support the structuralcharacteristics and observe the mechanical responses ofapplied forces. Generally, SMD simulations of proteins are usedto understand mechanical characteristics and proper-ties.55,56,62–66 Using the SMD methods on heterogeneous
52242 | RSC Adv., 2016, 6, 52236–52247
interfaces between Ab and tau structures, we compared thestructural characteristics between heterogeneous Ab and tau indetail. Aer the MD simulations, we obtained the nal cong-urations of the equilibrated states for the WT and mutatedmodels, as shown in Fig. 4(b) and (d) and 6(b) and (d), respec-tively. SMD simulations (i.e., pulling simulations) were per-formed to determine the mechanical behavior of the oligomericmixtures, especially at the heterogeneous interfaces between Aband tau. Before analyzing the heterogeneous Ab and taumixtures, our magnitude of force reaction from SMD simulationcould be compared to previous experimental and computa-tional results. Considering the our Ab and tau mixturescomposed having heterogeneous characteristics, our peak forcevalues of Ab and tau mixtures were lower than previously re-ported homogeneous insulin amyloid brils, polymorphichIAPP protobrils and transthyretin amyloid proteins. Butthose are in the range of related experimentally measuredvalues.55,56,58,65–67
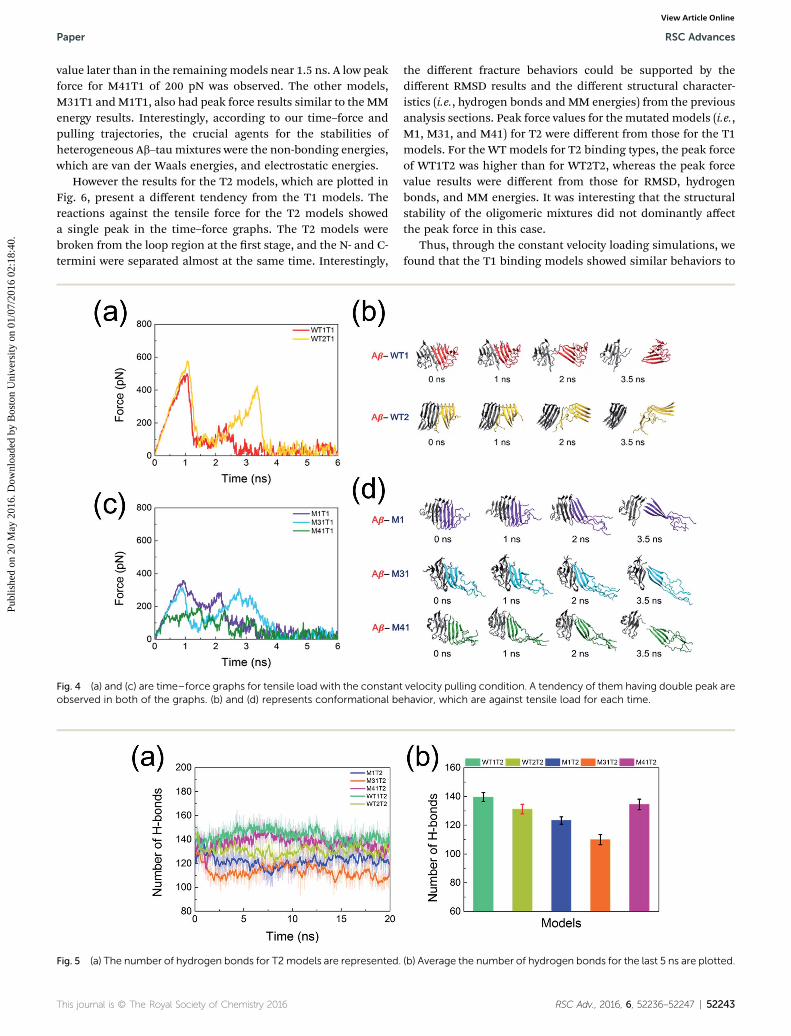
Interestingly, the time–force graphs were different for thedifferent binding types and residue compositions. As shown inFig. 4 with the T1 binding models, the time–force results andthe pulling trajectories showed that they had double peakswhen they were pulled with constant velocity. During the SMDsimulation, the Ab–tau mixtures with binding type 1 (T1) wereprogressively broken from the C-terminal region at the earlystage to the N-terminal regions. Those tendencies wereobserved for all the T1 models except for M41T1. Because the N-terminus region of M41T1 was already broken during theequilibrium MD simulation, the time–force graphs did notshow the rst peak. The values of peak force ranged from 200pN to 800 pN. The rst events were observed around a period of1 ns. The WT1T1 model had a higher peak force than theWT2T1 model, as supported by the MM energy values forWT1T1 and WT2T1. From the MM results in Table 1, we can seethat WT1T1 had a more stabilized MM energy than WT2T1. Inthe case of the mutated model, the peak forces also followed theMM results. For the M41T1 model, we found one peak force
This journal is © The Royal Society of Chemistry 2016
Paper RSC Advances
Publ
ishe
d on
20
May
201
6. D
ownl
oade
d by
Bos
ton
Uni
vers
ity o
n 01
/07/
2016
02:
18:4
0.
View Article Online
value later than in the remaining models near 1.5 ns. A low peakforce for M41T1 of 200 pN was observed. The other models,M31T1 andM1T1, also had peak force results similar to the MMenergy results. Interestingly, according to our time–force andpulling trajectories, the crucial agents for the stabilities ofheterogeneous Ab–tau mixtures were the non-bonding energies,which are van der Waals energies, and electrostatic energies.
However the results for the T2 models, which are plotted inFig. 6, present a different tendency from the T1 models. Thereactions against the tensile force for the T2 models showeda single peak in the time–force graphs. The T2 models werebroken from the loop region at the rst stage, and the N- and C-termini were separated almost at the same time. Interestingly,
Fig. 4 (a) and (c) are time–force graphs for tensile load with the constanobserved in both of the graphs. (b) and (d) represents conformational be
Fig. 5 (a) The number of hydrogen bonds for T2models are represented.
This journal is © The Royal Society of Chemistry 2016
the different fracture behaviors could be supported by thedifferent RMSD results and the different structural character-istics (i.e., hydrogen bonds and MM energies) from the previousanalysis sections. Peak force values for the mutated models (i.e.,M1, M31, and M41) for T2 were different from those for the T1models. For the WT models for T2 binding types, the peak forceof WT1T2 was higher than for WT2T2, whereas the peak forcevalue results were different from those for RMSD, hydrogenbonds, and MM energies. It was interesting that the structuralstability of the oligomeric mixtures did not dominantly affectthe peak force in this case.
Thus, through the constant velocity loading simulations, wefound that the T1 binding models showed similar behaviors to
t velocity pulling condition. A tendency of them having double peak arehavior, which are against tensile load for each time.
(b) Average the number of hydrogen bonds for the last 5 ns are plotted.
RSC Adv., 2016, 6, 52236–52247 | 52243

Fig. 6 (a) and (c) are time–force graphs for tensile load with the same pulling condition as the T1 models are. A tendency of them having singlepeak and step-like shape are observed in the graphs. Just like the Fig. 4, conformational behavior of T2 models are represented at (b) and (d).
RSC Advances Paper
Publ
ishe
d on
20
May
201
6. D
ownl
oade
d by
Bos
ton
Uni
vers
ity o
n 01
/07/
2016
02:
18:4
0.
View Article Online
the equilibrated MD simulation results for RMSD, conforma-tions, hydrogen bonds, and MM energies owing to the loss oflysine residue and the interior effects of hydrophobic residues.However, the T2 binding model showed different results fromthe equilibrated MD results because of the different bindingdirection mechanisms. Using the SMD method on the hetero-geneous Ab and tau, we conrmed the detailed structuralcharacteristics, which could not be seen in the results from theequilibrium simulations.
3.4. Interacting features for binding types between T1 andT2
In the case of heterogeneous interactions, a comprehensiveknowledge of the binding site features is key to understandingthe ber or plaque growth mechanisms of the heterogeneousamyloids. To investigate interaction in the T1 and T2 models,we compared the results of the MM/PBSA and SMD simulations.
In this study, the same residues were considered to observetheir role in governing the stability of the heterogeneous WTand mutated tau and Ab structures. Previous studies haverevealed that interactions between amino acid residues thatreside in the interior regions have an important role in main-taining stability.55–59 The chemical compositions of structuresaffect interactions with the surrounding water molecules, and itis known that permeation of water molecules into the interiorregion can impact the stability of monomers. For example, ourcomputational studies on polymorphic hIAPP revealed that theinterior region location of hydrophobic residues altered the
52244 | RSC Adv., 2016, 6, 52236–52247
mechanical behavior and properties.55–58 The same results wereobserved in heterogeneous Ab, prion, b2M, and taustudies.30,54,68,69 It was observed that some interior bindings ofweak Ab and tau models were broken by the permeated watermolecules. Subsequently, they caused the lower interior stabil-ities of mixtures. However, those chemical interactions cannotexplain the different results for the T1 and T2 models describedpreviously. The chemical features of the direct binding inter-actions for each WT and mutated model are represented inTables S1 and S2.† The chart describes the interaction betweenlayers for a direct comparison between models. However, itshows that there are no notable differences for the differentbinding types (T1 and T2).
For that reason MM/PBSA was computed to verify thosedifferences in binding energies for each model and bindingtype, to understand why their binding features were different,even though their chemical binding features were similar foreach binding type. To investigate the MM/PBSA energy effec-tively, the MM/PBSA analysis was separated into MM, PB, andSA sections, as shown in detail in Fig. 7. The solvent accessiblesurface area (SASA) were computed to determine the hydro-phobicity against solvents. The graphs in Fig. 7 suggest that theT1 and T2 models did not have notable differences, except forthe M1 models. Only the M1 models (i.e., M1T1 and M1T2) hadsmall surface areas. This is because that they are as short asa single residue, compared with the other models. Individualchemical compositions were similar to each model (WT, M1,M31, and M41), but their interacting features were different forthe binding types (T1 and T2). Interestingly, their binding
This journal is © The Royal Society of Chemistry 2016
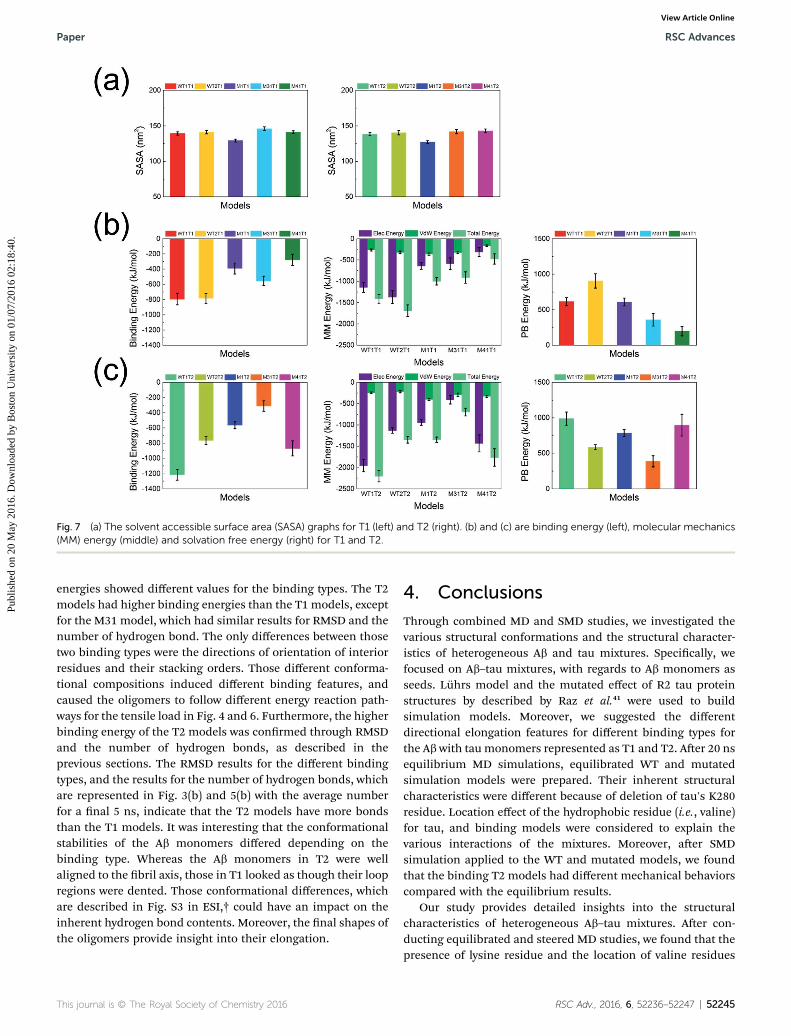
Fig. 7 (a) The solvent accessible surface area (SASA) graphs for T1 (left) and T2 (right). (b) and (c) are binding energy (left), molecular mechanics(MM) energy (middle) and solvation free energy (right) for T1 and T2.
Paper RSC Advances
Publ
ishe
d on
20
May
201
6. D
ownl
oade
d by
Bos
ton
Uni
vers
ity o
n 01
/07/
2016
02:
18:4
0.
View Article Online
energies showed different values for the binding types. The T2models had higher binding energies than the T1 models, exceptfor the M31 model, which had similar results for RMSD and thenumber of hydrogen bond. The only differences between thosetwo binding types were the directions of orientation of interiorresidues and their stacking orders. Those different conforma-tional compositions induced different binding features, andcaused the oligomers to follow different energy reaction path-ways for the tensile load in Fig. 4 and 6. Furthermore, the higherbinding energy of the T2 models was conrmed through RMSDand the number of hydrogen bonds, as described in theprevious sections. The RMSD results for the different bindingtypes, and the results for the number of hydrogen bonds, whichare represented in Fig. 3(b) and 5(b) with the average numberfor a nal 5 ns, indicate that the T2 models have more bondsthan the T1 models. It was interesting that the conformationalstabilities of the Ab monomers differed depending on thebinding type. Whereas the Ab monomers in T2 were wellaligned to the bril axis, those in T1 looked as though their loopregions were dented. Those conformational differences, whichare described in Fig. S3 in ESI,† could have an impact on theinherent hydrogen bond contents. Moreover, the nal shapes ofthe oligomers provide insight into their elongation.
This journal is © The Royal Society of Chemistry 2016
4. Conclusions
Through combined MD and SMD studies, we investigated thevarious structural conformations and the structural character-istics of heterogeneous Ab and tau mixtures. Specically, wefocused on Ab–tau mixtures, with regards to Ab monomers asseeds. Luhrs model and the mutated effect of R2 tau proteinstructures by described by Raz et al.41 were used to buildsimulation models. Moreover, we suggested the differentdirectional elongation features for different binding types forthe Ab with tau monomers represented as T1 and T2. Aer 20 nsequilibrium MD simulations, equilibrated WT and mutatedsimulation models were prepared. Their inherent structuralcharacteristics were different because of deletion of tau's K280residue. Location effect of the hydrophobic residue (i.e., valine)for tau, and binding models were considered to explain thevarious interactions of the mixtures. Moreover, aer SMDsimulation applied to the WT and mutated models, we foundthat the binding T2 models had different mechanical behaviorscompared with the equilibrium results.
Our study provides detailed insights into the structuralcharacteristics of heterogeneous Ab–tau mixtures. Aer con-ducting equilibrated and steered MD studies, we found that thepresence of lysine residue and the location of valine residues
RSC Adv., 2016, 6, 52236–52247 | 52245
RSC Advances Paper
Publ
ishe
d on
20
May
201
6. D
ownl
oade
d by
Bos
ton
Uni
vers
ity o
n 01
/07/
2016
02:
18:4
0.
View Article Online
alters the structural conformation and stability. Additionally,from the different T1 and T2 binding models, the structuralfeatures of the two different binding types were discussed inorder to explain the binding mechanism of the heterogeneousmonomers. The results suggest that the heterogeneous inter-actions of the binding types can produce different stabilizedconformations. In particular, the open binding site of Ab, whereanother monomer could be added, showed different structuraltendencies for both the T1 and T2 models, and the effect ofdifferent shapes of the binding sites should be investigated inthe future. These results provide useful insights into under-standing how heterogeneous amyloid structures lead toheterogeneous oligomeric amyloid formation mechanisms.Additionally, information about structural stabilities caused bythe presence of lysine and the location of valine could shed lighton the aggregating features of neurodegenerative diseasefactors and the elongation and binding mechanisms betweenmonomers.
Acknowledgements
S. N. gratefully acknowledges the Basic Science ResearchProgram, through the National Research Foundation of Korea(NRF) and funded by the Ministry of Science, ICT & FuturePlanning (MSIP) (No. 2014R1A2A1A11052389).
References
1 D. Eisenberg and M. Jucker, Cell, 2012, 148, 1188–1203.2 G. Merlini and V. Bellotti, N. Engl. J. Med., 2003, 349, 583–596.
3 M. B. Pepys, Annu. Rev. Med., 2006, 57, 223–241.4 L. Adler-Abramovich, L. Vaks, O. Carny, D. Trudler,A. Magno, A. Caisch, D. Frenkel and E. Gazit, Nat. Chem.Biol., 2012, 8, 701–706.
5 J. Adamcik, J. Jung, J. Flakowski, P. Rios De Los, G. Dietlerand R. Mezzenger, Nat. Nanotechnol., 2010, 5, 423–428.
6 N. Mizuno, U. Baxa and A. C. Steven, Proc. Natl. Acad. Sci. U.S. A., 2011, 108, 3252–3257.
7 C. Sachse, N. Grigorieff and M. Fandrich, Angew. Chem., Int.Ed., 2010, 49, 1321–1323.
8 C. Haass and D. J. Selkoe, Nat. Rev. Mol. Cell Biol., 2007, 8,101–112.
9 C. Soto, Nat. Rev. Neurosci., 2003, 4, 49–60.10 J. Bieschke, M. Herbst, T. Wiglenda, R. P. Friedrich,
A. Boeddrich, F. Schiele, D. Kleckers, J. M. Lopez del Amo,B. A. Gruning, Q. Wang, M. R. Schmidt, R. Lurz, R. Anwyl,S. Schnoegl, M. Fandrich, R. F. Frank, B. Reif, S. Gunther,D. M. Walsh and E. E. Wanker, Nat. Chem. Biol., 2012, 8,93–101.
11 S. R. Collins, A. Douglass, R. D. Vale and J. S. Weissman,PLoS Biol., 2004, 2, e321.
12 W.-F. Xue, A. L. Hellewell, W. S. Gosal, S. W. Homans,E. W. Hewitt and S. E. Radford, J. Biol. Chem., 2009, 284,34272–34282.
13 Y. Miller, B. Ma, C.-J. Tsai and R. Nussinov, Proc. Natl. Acad.Sci. U. S. A., 2010, 107, 14128–14133.
52246 | RSC Adv., 2016, 6, 52236–52247
14 H. Choi, H. J. Chang, Y. Shin, J. I. Kim, H. S. Park, G. Yoonand S. Na, RSC Adv., 2015, 5, 49263–49269.
15 W.-T. Chen, Y.-H. Liao, H.-M. Yu, I. H. Cheng and Y.-R. Chen,J. Biol. Chem., 2011, 286, 9646–9656.
16 P. J. Marek, V. Patsalo, D. F. Green and D. P. Raleigh,Biochemistry, 2012, 51, 8478–8490.
17 N. M. Kad, S. L. Myers, D. P. Smith, D. Alastair Smith,S. E. Radford and N. H. Thomson, J. Mol. Biol., 2003, 330,785–797.
18 N. M. Kad, N. H. Thomson, D. P. Smith, D. A. Smith andS. E. Radford, J. Mol. Biol., 2001, 313, 559–571.
19 A. W. P. Fitzpatrick, G. T. Debelouchina, M. J. Bayro,D. K. Clare, M. A. Caporini, V. S. Bajaj, C. P. Jaroniec,L. Wang, V. Ladizhansky, S. A. Muller, C. E. MacPhee,C. A. Waudby, H. R. Mott, A. De Simone, T. P. J. Knowles,H. R. Saibil, M. Vendruscolo, E. V. Orlova, R. G. Griffin andC. M. Dobson, Proc. Natl. Acad. Sci. U. S. A., 2013, 110,5468–5473.
20 J. T. Nielsen, M. Bjerring, M. D. Jeppesen, R. O. Pedersen,J. M. Pedersen, K. L. Hein, T. Vosegaard, T. Skrydstrup,D. E. Otzen and N. C. Nielsen, Angew. Chem., 2009, 121,2152–2155.
21 M. R. Sawaya, S. Sambashivan, R. Nelson, M. I. Ivanova,S. A. Sievers, M. I. Apostol, M. J. Thompson, M. Balbirnie,J. J. W. Wiltzius, H. T. McFarlane, A. O. Madsen, C. Riekeland D. Eisenberg, Nature, 2007, 447, 453–457.
22 J. Madine, E. Jack, P. G. Stockley, S. E. Radford, L. C. Serpelland D. A. Middleton, J. Am. Chem. Soc., 2008, 130, 14990–15001.
23 L. R. Volpatti, M. Vendruscolo, C. M. Dobson andT. P. J. Knowles, ACS Nano, 2013, 7, 10443–10448.
24 J. Dong, J. E. Shokes, R. A. Scott and D. G. Lynn, J. Am. Chem.Soc., 2006, 128, 3540–3542.
25 M. Innocenti, E. Salvietti, M. Guidotti, A. Casini, S. Bellandi,M. L. Foresti, C. Gabbiani, A. Pozzi, P. Zatta and L. Messori, J.Alzheimer's Dis., 2010, 19, 1323–1329.
26 D. Noy, I. Solomonov, O. Sinkevich, T. Arad, K. Kjaer andI. Sagi, J. Am. Chem. Soc., 2008, 130, 1376–1383.
27 V. Tougu, A. Karan, K. Zovo, R. S. Chung, C. Howells,A. K. West and P. Palumaa, J. Neurochem., 2009, 110, 1784–1795.
28 R. Paparcone, M. A. Pires and M. J. Buehler, Biochemistry,2010, 49, 8967–8977.
29 T. Luhrs, C. Ritter, M. Adrian, D. Riek-Loher, B. Bohrmann,H. Dobeli, D. Schubert and R. Riek, Proc. Natl. Acad. Sci. U. S.A., 2005, 102, 17342–17347.
30 H. J. Chang, I. Baek, M. Lee and S. Na, ChemPhysChem, 2016,17, 425–432.
31 M. Lee, H. J. Chang, J. Y. Park, J. Shin, J. W. Park, J. W. Choi,J. I. Kim and S. Na, J. Mol. Graphics Modell., 2016, 65, 8–14.
32 G. Wei and J.-E. Shea, Biophys. J., 2006, 91, 1638–1647.33 C. Yang, J. Li, Y. Li and X. Zhu, J. Mol. Struct.: THEOCHEM,
2009, 895, 1–8.34 R. Cukalevski, B. Boland, B. Frohm, E. Thulin, D. Walsh and
S. Linse, ACS Chem. Neurosci., 2012, 3, 1008–1016.35 C. Conde and A. Caceres, Nat. Rev. Neurosci., 2009, 10, 319–
332.
This journal is © The Royal Society of Chemistry 2016

Paper RSC Advances
Publ
ishe
d on
20
May
201
6. D
ownl
oade
d by
Bos
ton
Uni
vers
ity o
n 01
/07/
2016
02:
18:4
0.
View Article Online
36 C. Ballatore, V. M. Y. Lee and J. Q. Trojanowski, Nat. Rev.Neurosci., 2007, 8, 663–672.
37 J.-P. Guo, T. Arai, J. Miklossy and P. L. McGeer, Proc. Natl.Acad. Sci. U. S. A., 2006, 103, 1953–1958.
38 K. Ono, R. Takahashi, T. Ikeda and M. Yamada, J.Neurochem., 2012, 122, 883–890.
39 J. Seeliger, F. Evers, C. Jeworrek, S. Kapoor, K. Weise,E. Andreetto, M. Tolan, A. Kapurniotu and R. Winter,Angew. Chem., Int. Ed., 2012, 51, 679–683.
40 D. Pinotsi, A. K. Buell, C. Galvagnion, C. M. Dobson,G. S. Kaminski Schierle and C. F. Kaminski, Nano Lett.,2014, 14, 339–345.
41 Y. Raz, J. Adler, A. Vogel, H. A. Scheidt, T. Haupl, B. Abel,D. Huster and Y. Miller, Phys. Chem. Chem. Phys., 2014, 16,7710–7717.
42 Y. Miller, B. Ma and R. Nussinov, Biochemistry, 2011, 50,5172–5181.
43 Y. Raz and Y. Miller, PLoS One, 2013, 8, e73303.44 W. Berhanu and A. Masunov, J. Mol. Model., 2012, 18, 1129–
1142.45 M. Zhang, R. Hu, H. Chen, X. Gong, F. Zhou, L. Zhang and
J. Zheng, J. Chem. Inf. Model., 2015, 55, 1628–1639.46 L. Larini, M. M. Gessel, N. E. LaPointe, T. D. Do,
M. T. Bowers, S. C. Feinstein and J.-E. Shea, Phys. Chem.Chem. Phys., 2013, 15, 8916–8928.
47 L. Xu, Y. Chen and X. Wang, J. Phys. Chem. B, 2014, 118,9238–9246.
48 V. V. Shvadchak, M. M. A. E. Claessens and V. Subramaniam,J. Phys. Chem. B, 2015, 119, 1912–1918.
49 H. J. C. Berendsen, D. van der Spoel and R. van Drunen,Comput. Phys. Commun., 1995, 91, 43–56.
50 R. Kumari, R. Kumar and A. Lynn, J. Chem. Inf. Model., 2014,54, 1951–1962.
51 S. P. Brown and S. W. Muchmore, J. Med. Chem., 2009, 52,3159–3165.
This journal is © The Royal Society of Chemistry 2016
52 T. Yang, J. C. Wu, C. Yan, Y. Wang, R. Luo, M. B. Gonzales,K. N. Dalby and P. Ren, Proteins, 2011, 79, 1940–1951.
53 J. Kyte and R. F. Doolittle, J. Mol. Biol., 1982, 157, 105–132.54 M. Lee, I. Baek, H. Choi, J. I. Kim and S. Na, Biochem.
Biophys. Res. Commun., 2015, 466, 486–492.55 M. Lee, H. J. Chang, D. Kim, Y. Lee, H. Suh, N. Ahn, G. Yoon
and S. Na, Biophys. Chem., 2015, 199, 1–8.56 J. I. Kim, M. Lee, I. Baek, G. Yoon and S. Na, Phys. Chem.
Chem. Phys., 2014, 16, 18493–18500.57 G. Yoon, M. Lee, J. I. Kim, S. Na and K. Eom, PLoS One, 2014,
9, e88502.58 M. Lee, I. Baek, H. J. Chang, G. Yoon and S. Na, Chem. Phys.
Lett., 2014, 600, 68–72.59 J. T. Berryman, S. E. Radford and S. A. Harris, Biophys. J.,
2011, 100, 2234–2242.60 M. Lee and S. Na, ChemPhysChem, 2016, 17, 425–432.61 M. Andreasen, K. K. Skeby, S. Zhang, E. H. Nielsen,
L. H. Klausen, H. Frahm, G. Christiansen, T. Skrydstrup,M. Dong, B. Schiøtt and D. Otzen, Biochemistry, 2014, 53,6968–6980.
62 S. Max and J. B. Markus, Nanotechnology, 2014, 25, 105703.63 M. Solar and M. J. Buehler, Nanoscale, 2012, 4, 1177–1183.64 B. Choi, G. Yoon, S. W. Lee and K. Eom, Phys. Chem. Chem.
Phys., 2015, 17, 1379–1389.65 M. Lee, J. Kwon and S. Na, Phys. Chem. Chem. Phys., 2016, 18,
4814–4821.66 M. Lee, H. Choi and S. Na, J. Nanomater., 2016, 2016, 10.67 J. Smith, T. Knowles, C. Dobson, C. MacPhee and
M. Welland, Proc. Natl. Acad. Sci. U. S. A., 2006, 103,15806–15811.
68 Y. Gwonchan, L. Myeongsang, K. Kyungwoo, K. Jae In,C. Hyun Joon, B. Inchul, E. Kilho and N. Sungsoo, Phys.Biol., 2015, 12, 066021.
69 G. Yoon, Y. Kab Kim, K. Eom and S. Na, Appl. Phys. Lett.,2013, 102, 011914.
RSC Adv., 2016, 6, 52236–52247 | 52247