journal veterinary animal sciences - cvas … dr. a. jalaludeen director (academic & research)...
TRANSCRIPT


CHAIRMANDr. A. JalaludeenDirector (Academic & Research)
MEMBERSDr. S. RamkumarDirector of Entrepreneurship
Dr. H. SubramanianDean, College of Veterinary & Animal Sciences,Mannuthy
Dr. Leo JosephDean, College of Veterinary & Animal Sciences,Pookode
Dr. R. RajendrakumarDean, College of Dairy Science & Technology,Mannuthy
Dr. P.C. SaseendranProfessor, Livestock Production & ManagementCollege of Veterinary & Animal Sciences,Mannuthy
Dr. Jose John ChungathProfessor, Veterinary Anatomy and HistologyCollege of Veterinary & Animal Sciences,Pookode
Dr. P.I. GeevargheseProfessor, Dairy Technology, College of DairyScience & Technology, Mannuthy
Dr. M.R. SaseendranathProfessor, Veterinary Epidemiology andPreventive Medicine, College of Veterinary &Animal Sciences, Mannuthy
ANIMAL SCIENCESVolume 39 2008 Issues 1 & 2
E D I TO R I A L B O A R D
MANAGING EDITORDr. K. Devada
Professor and HeadVeterinary Parasitology
ASSISTANT EDITORSDr. Shibu Simon
Assistant Professor, Animal Reproduction,Gynaecology & Obstetrics
Dr. Indu. V. Raj Assistant Professor
Veterinary Anatomy and Histology
Dr. H. Shameem Assistant Professor
Veterinary Parasitology
KERALA VETERINARY &
ANIMAL SCIENCES UNIVERSITYOffice of Journal of Veterinary & Animal SciencesCollege of Veterinary & Animal SciencesMannuthy - 680 651, Thrissur, Kerala (India)
of and
ISSN 0971-0701
JOURNAL VETERINARY

AIM AND SCOPE
Journal of Veterinary and Animal Sciences is a half yearly publication of theKerala Veterinary and Animal Sciences University (KVASU) devoted to the publication of originalresearch papers on various aspects of Veterinary and Animal Sciences and clinical articles whichare of interest to research workers and practitioners engaged in livestock and poultry production.Research papers on wild life, laboratory animals and environmental problems affecting livestockproduction; short communications of importance in Veterinary and Animal Sciences are alsoaccepted. With 38 volumes published under Kerala Agricultural University, the Journal ofVeterinary and Animal Sciences continues its journey to greater heights and achievements underthe youngest Veterinary University in the world, KVASU. The editorial board look forward tocontinual support and co operation from all well wishers in future for a promising and prospectiveventure.
SUBSCRIPTION RATE
Annual : Inland : KVASU staff/A.H. Dept. : Rs. 100/-Inland : Other Agencies : Rs. 200/-Foreign : US $ 75
Price per issue : Inland : KVASU staff/A.H. Dept : Rs. 50/-Inland : Other Agencies : Rs. 100/-
Back volume : Inland : Rs. 100/-Foreign : US $ 30
ADVERTISEMENT TARIFF
Front Cover in : Rs. 8000/-Back Cover in : Rs. 7000/-Colour insertion : Rs. 6000/-Black and white full page : Rs. 4000/-Black and white half page : Rs. 2500/-
ADDRESS FOR COMMUNICATION
The Managing EditorJournal of Veterinary and Animal SciencesCollege of Veterinary & Animal SciencesMannuthy - 680651, Thrissur, Kerala, India+91-487-2370344 ext.277; 334Mob.+91 9447418800Fax No: +91 487 2370344e mail : [email protected]
The Editors and the Editorial Board or the honourable referees do not assume any responsibility for theopinions offered by the authors. No material in any form can be reproduced without the permissionof the Editorial Board. The Board is also not responsible for any delay, whatsoever in publication/delivery ofperiodicals to the subscribers due to unforeseen circumstances or postal delay. Readers arerecommended to make appropriate enquiries before sending money, incurring expenses or entering intocommitments in relation to any advertisement appearing in this publication. The Editorial Board does notvouch for any claims made by the advertisers of products and services. The publisher, the editors and theeditorial Board of the publication shall not be held liable for any consequence in the event of such claims notbeing honored by the advertisers. All disputes are subject to the exclusive jurisdiction of competent courtsand forums in Thrissur, Kerala only.
(per issue)
Published by the Director of Entrepreneurship for and on behalf of the Kerala Veterinary and AnimalSciences University, Pookode, Wayanad, Kerala, India and Printed at VIVID OFFSET PRINTERS, Thrissur.

JOURNAL OF VETERINARY AND ANIMAL SCIENCESVolume 39 2008 Issues 1 & 2
CONTENTSRESEARCH ARTICLES
1. Pattern of induced oestrus and fertility rate following hCG injection at early
luteal phase in PGF2α treated repeat breeder cows.................................................................1
M. Selvaraju, C. Veerapandian, D. Kathiresan, K. Kulasekar and C. Chandrahasan
2. Toxicity studies on carbon tetrachloride and n-nitrosomethylurea
indepenently and in combination in rats....................................................................................5
Mammen J. Abraham and A. Sundararaj
3. Carcass characteristics of Madras red lambs fed with diets of varying
proportions of roughage and concentrate......................................................................................10
M. K. Seethalakshmi, S. Meenakshi Sundaram, R. Kumararaj, T. Sivakumar,
P. Tensingh Gnanaraj and M. Murugan
4. Homologous transplantation of bovine ethmoid carcinoma cells............................................14
Ajith Jacob George, K. M. Ramachandran, A. Rajan, K. T. Punnose and C. B. Manomohan
5. Comparing the sensitivity of detecting viral antigen in different parts of
rabies suspected brain using Fluorescent antibody test............................................................18
S. Raju, M. R. Saseendranath and P. V. Tresamol
6. Effect of DNA microsatellite markers on milk fat percentage of
crossbred cattle of Kerala........................................................................................................20
T. Naicy, K. Anilkumar, A. P. Usha and K. V. Raghunandanan
7. Evaluation of bacteriological quality of processed chicken.....................................................23
Raji Rose Jacob, C. Sethulekshmi, E. Nanu and B. Sunil
8. Correlation between serum steroid hormone profiles before, during and
after norgestomet induced oestrus and occurence of conception in repeat
breeder crossbred cows...........................................................................................................26
M. Selvaraju, C. Veerapandian, D. Kathiresan, K. Kulasekar and C. Chandrahasan
9. Effect of different housing systems on the serum iron and haemoglobin content in Large
White Yorkshire pigs.....................................................................................................................31
M. Pushpalatha, Ra. Murallidharan, P. Tensingh Gnanaraj, R. Kumararaj and M. Murugan
10. Microanatomical studies on the moderator band (trabecula septomarginalis)
of horses (Equus caballus).......................................................................................................33
O. R. Sathyamoorthy and Geetha Ramesh
11. Awareness and needs of pig farmers in Kerala.........................................................................36
A. Kannan, Francis Xavier, T. V. Raja and M. Murugan
12. Histology and age related involutary changes of the thymus of Giriraja
birds (Gallus domesticus).........................................................................................................40
C. Leena, R. V. Prasad, K. Kakade and K. V. Jamuna

SHORT COMMUNICATIONS
17. Effect of nicotinic acid supplementation on production performance of lactating cows.........................55
Renjith Gopal, A. D. Mercy, Nidhish Francis, S. Aravind and Rani Chacko
18. Comparative clinical pathology of Johnin and Tuberculin reactors of bovines.....................................57
P. C. Siji, K. Vijayakumar, P. V. Tresamol and M. R. Saseendranath
19. Credibility of communication sources as perceived by dairy entrepreneurs.....................................60
C. A. Pradeep and P. J. Rajkamal
20. Dystocia due to foetal anasarca with ascites in a sheep- a case report..............................................62
M. Selvaraju, M. Palanisamy, K. Ravikumar, V. Prabaharan, R. Ravi, R. Ezakial Napolean
and C. Chandrahasan
21. Mammary fibroadenoma in a calf - a case report...............................................................................64
K. N. Nimisha, Usha N. Pillai, Premni Elias, Reji Varghese, P. V. Tresamol and M. R. Saseendranath
JOURNAL OF VETERINARY AND ANIMAL SCIENCESVolume 39 2008 Issues 1 & 2
13. Immune response to foot and mouth disease oil adjuvant vaccines in calves.................................44
K. Rajkumar and M. R. Saseendranath
14. Gross anatomical studies of the scapula in leopard (Panthera pardus)...................................47
A. R. Sreeranjini, Indu V. Raj, N. Ashok and K. R. Harshan
15. Memory and hierarchial behaviour in mice, rats and guinea pigs............................................49
Chitra R. Nair, Joseph Mathew, K. Shyama, P. C. Saseendran, K. S. Anil and A. Kannan
16. Diagnosis of caprine toxoplasmosis by latex agglutination test..............................................53
K. Syamala, K. Devada and K. Madhavan Pillai

PATTERN OF INDUCED OESTRUS ANDFERTILITY RATE FOLLOWING hCG INJECTIONAT EARLY LUTEAL PHASE IN PGF2ααααα TREATEDREPEAT BREEDER COWS*
M. Selvaraju1, C. Veerapandian2,D. Kathiresan,3 K. Kulasekar4
and C. Chandrahasan5
Department of Animal ReproductionGynaecology and ObstetricsMadras Veterinary College, Chennai- 600 007
Abstract
A total of 48 repeat breeder cowswere divided into three groups viz., group I, IIand III. Cows in group I and II were treatedwith 0.98mg of Tiaprost (PGF2α) on day 10following natural oestrus (day 0). Group IIIcows, served as control without any treatment.AI was done at 72 and 96 h following PGF2αtherapy in group I and II. Group III cows wereartificially inseminated twice at 24 h intervalduring natural oestrus. Group II cows wereinjected with 1500 IU hCG on day fourfollowing first AI. There was cent per centoestrus response in PGF2α treated cows. Themean onset of oestrus was 59.38±0.81 and59.63±0.74 h and the mean duration ofinduced oestrus was 28.50±0.56 and27.50±0.70 h in group I and II, respectively. Incontrol, the mean duration of oestrus was29.38±0.77 h. The occurrences of very goodand good oestrus intensities were 12.50 and87.50 (group I) and 25.00 and 75.00 (group IIand III) per cent. The first service conceptionrate obtained was 43.75, 37.50 and 18.75 percent, in group I, II and III, respectively. It isconcluded that administration of PGF2α on day10 following natural oestrus may improve theconception rate in repeat breeder cows andthat injection of hCG on day four after fixedtime AI is unnecessary.
Key words: Induced oestrus and fertility rate,hCG injection, early luteal phase, repeatbreeder cows.
Control of oestrus using prostaglandinpreparations (PGF2α) has been found to beeffective in achieving good fertility in cyclingcows (Xu et al., 1997). Odde (1990) stated thatPGF2α treatment has been highly effective inregulating oestrous cycle by inducing completeluteolysis in dairy cows. However, such studiesin repeat breeding crossbred cows are lacking.Further lowered conception rate with PGF2α insome studies were related to reduced CLweight and subsequent lower serumprogesterone content (Rentfrow et al., 1987).Time of administration of hCG (humanchorionic gonadotropin) in relation to theoccurrence of oestrus influenced theconception rate in cyclical cows (Hixon et al.,1981). Hence, the present investigation wasundertaken to study the fertility rate followingadministration of hCG at early luteal phase inPGF2α treated repeat breeder cows.
Materials and Methods
A total of 48 healthy, parous crossbredcows which failed to conceive after three ormore AIs were selected for this study. Theywere having regular oestrous cycle length of18 to 24 days with clear genital mucous
* Part of Ph.D. thesis submitted by the first author to the Tamil Nadu Veterinary & Animal Sciences University, Chennai- 51 1. Associate Professor and Head, Dept. of ARGO, VC & RI, Namakkal 2. Professor and Head 3. Director of Extension Education, TANUVAS, Chennai-5 4. Professor 5. Dean, VC & RI, Namakkal J. V
et. A
nim
.Sci
. 20
08.
39 :
1-4
1
RESEARCH ARTICLE
M. Selvaraju et al.

discharge during every previous oestrus. Theywere free from gross palpable abnormalitiesand obvious infections of the genital tract. Outof 48 selected animals, 32 cows were treatedwith 0.98 mg of Tiaprost intramuscularly on day10 following natural oestrus and were equallydivided into two treatment groups viz., group Iand group II. AI was done at 72 and 96 h afterPGF2α injection in these cows. Cows in groupII were administered with 1500 IU hCG on day4 following first AI. Sixteen repeat breeder cowswithout any treatment served as control (GroupIII) and were artificially inseminated twice at24 h interval during natural oestrus. Oestrusresponse was calculated in percentage(number cows exhibited oestrus out of numberof cows treated in group I and II). Onset ofoestrus was recorded from the time of PGF2αinjection to the expression of oestrus signs.Duration of oestrus was estimated in hours inthe experimental and control groups from thetime of first appearance of oestrus sign to thedetection of last oestrus sign. Intensity ofnatural and induced oestrus in control andtreatment group was scored according to themethod described by Rao and Rao (1981) withslight modifications. Based on the score cardthe intensity of oestrus was classified as verygood (> 15 points), good (11 to 15 points), fair(6 to 10 points) and poor (< 5 points). Rectalexamination was carried out in all the treatedand control cows at 60 days after the AI toconfirm pregnancy. First service conceptionrate was calculated in treatment groups(number of animals conceived at inducedoestrus divided by number animals treated ineach group) and was expressed in percentage.Similarly, in control group first serviceconception rate was calculated following AI atnatural oestrus.
Results and Discussion
In the present study, injection ofPGF2α on day 10 after natural oestrus resultedin cent per cent oestrus response in both thetreatment groups. This was in agreement withthe findings of Zaayer and Van der Horst (1986)and Goley and Kadu (1995) in repeat breedercows. Lower oestrus responses of 80 to 92 percent to PGF2α treatment in cows were reportedin Rentfrow et al. (1987). However, Hixon etal.(1981) reported only 54 to 57 per centoestrus response in cows treated with PGF2αThe cent per cent efficacy of PGF2α treatmentin inducing oestrus in repeat breeder crossbredcows in this study might be due to the day of
the cycle in which the drug was administered(Odde, 1990), higher sensitivity of the corpusluteum on day 10 of the cycle to PGF2αtreatment (Berardinelli and Adair, 1989) andgood nutritional status of the cows selected.
In this experiment, in group I and IIthe mean onset of oestrus was 59.38±0.81 and59.63±0.74 h respectively. No significantdifference was observed between two groups.Goley and Kadu (1995) recorded the meanonset of oestrus in repeat breeder cows treatedwith PGF2α plus GnRH and PGF2á plus hCGand the values were 63.71± 6.76 and67.59±5.00 h, respectively. The mean onsetof oestrus in repeat breeder cows found in thisstudy was in concurrence with the observationsof Jain and Dave (1992) and Cavalieri et al.(1997). Similar interval to onset of oestrus withdouble injection schedule of PGF2α in cows wasreported in a study by Jimenez et al. 1988.Longer interval (3.66 days) and shorter interval(32 h) between PGF2α injection and onset ofoestrus were recorded in cows by Jochle et al.(1982).
The mean duration of induced oestrus(28.50±0.56 and 27.50±0.70 h in group I andII, respectively) recorded in this study was inaccordance with the findings of Selvaraju(1997) in anoestrus cows treated withnorgestomet ear implants and in crossbredcows treated with PGF2α (Jochle et al., 1982).However, Goley and Kadu (1995) recorded anoestrus duration of 35.57±1.02 h in repeatbreeder cows treated with PGF2α which washigher than the duration obtained in this study.In control, the mean duration of oestrus was29.38±0.77 h. More or less similar duration ofoestrus in repeat breeder cow was reportedby Gustafsson et al. (1986) and Goley andKadu. (1995). It was concluded that oestrusinduction with PGF2α did not influence theduration of oestrus in repeat breeder crossbredcows.
In this study, the occurrences of verygood and good oestrus intensities were 12.50and 87.50 (group I) and 25.00 and 75.00 (groupII and III) per cent respectively. None of thetreated and control cows showed fair or pooroestrus intensity. Duchens et al. (1995)observed 40 each and 20 per cent of intense,intermediate and weak oestrus following PGF2αinjection in cows, respectively. However, Peters(1996) found 94.74 per cent good and 4.26 percent poor intensity in crossbred cows treatedwith PGF2α. In repeat breeder cows, theJ.
Vet
. Ani
m.S
ci.
2008
. 39
: 1
-4
2 Induced Oestrus and Fertility Rate...
RESEARCH ARTICLE

percentage of intense, medium and weakoestrus intensity recorded earlier was 64.28,28.58 and 7.14 in PGF2α induced oestrus(Goley and Kadu, 1995). Therefore, it wasinferred that oestrus induction programmesmay alleviate the problems of oestrus detectionin repeat breeder crossbred cows asrecommended by Goley and Kadu, (1995) andprovide good opportunity for fixed timeinsemination.
In PGF2α alone treated cows (GroupI), the first service conception rate obtained was43.75 per cent in this study. Almost similarconception rate was reported in repeat breedercows by Stevenson et al. (1988). However,higher conception rates of 76.92 (Zaayer andVan der Horst, 1986) and 80.00 (Kumar et al.,2000) per cent were reported in repeat breedercows. On comparison between control andgroup I cows, the conception rate obtained washigher in group I (43.75 per cent) than incontrol (18.75 per cent) in this study. Goley andKadu (1995) reported that the prostaglandinscorrected the uterine milieu and increased theconception rate by preventing early embryonicmortality. Further, they stated that it checkedmild endometritis by increasing the phagocyticactivity by uterine leukocytes and stimulatoryactions on smooth muscles of uterus.Moreover, double inseminations at inducedoestrus with good quality semen improved thepregnancy rates in many studies (Kumar et al.,2000). These factors might have contributedto achieve a higher conception rate in group Icows than the control cows.
In the present investigation, injectionof hCG at 4 days after AI resulted in 37.50 percent conception in group II animals. Almostsimilar percentage of conception was noticedin other studies in oestrus synchronised cowstreated with 1000 IU of hCG on day of 4 of theoestrous cycle (Holness et al., 1982) andrepeat breeder cows treated on day 5 of thecycle (Kumar et al., 2000). However, very highconception rate of 92 per cent was reported inheifers treated with hCG on day 4 of the postbreeding oestrous cycles (Peters, 1989). In thisstudy, the conception rate (37.50 per cent) inpost breeding hCG groups was marginallylower than the conception rate (47.75 per cent)obtained in group I without hCGsupplementation. Day of administration of hCGat post breeding was critical and variations infollicular wave pattern between cows (Peters,1989) might be the reason for marginal
reduction in conception rate in early luteal hCGgroup.
It is concluded that the induction ofoestrus with PGF2α alone and breeding at fixedtime might have helped in eliminating errors inoestrus detection and possibly in bringing morefavourable hormonal and uterine milieu andmight have resulted in increased conceptionrate in group I than in group II and control.From this study, it is clear that hCGadministration on day 4 following AI after PGF2αtreatment is not necessary and hence it isconcluded that PGF2α treatment on day 10following natural oestrus and fixed time doubleAI at induced oestrus may be followed toaugment fertility in repeat breeder cows underfield conditions.
References
Berardinelli, J.G. and Adair R. 1989. Efffect ofProstaglandin F2α and stage ofoestrous cycle on the oestrousresponse and corpus luteum functionin beef heifers. Theriogenology,32:301-313.
Cavalieri, J., Rubio, I., Kinder, J.E., Entwistle,K.W and Fitzpatrick, L.A. 1997.Synchronisation of oestrus andovulation and associated endocrinechanges in Bos indicus cows.Theriogenology, 47: 801-804.
Duchens, M., Maciel, M. Gustafsson, H.,Forsberg, M., Rodriguez-Martinez, H.and Edquist, L.E. 1995. Influence ofperioestrous suprabasalprogesterone levels on cycle length,oestrous behaviour and ovulation inheifers. Anim. Reprod. Sci., 37: 95-108.
Goley, R.R. and M.S. Kadu. 1995. Efficacy ofprostaglandin F2α (Lutalyse) GnRHanalogue (Receptal) and hCG(Chorulon) in treatment of repeatbreeder cows. Indian. Vet. J., 72: 472-475.
Gustafsson, H., Larson, K., Kindahl, K. andMadej, A. 1986.Sequential endocrinechanges and behaviour duringoestrus and metoestrus in repeetbreeder and virgin heifers. Anim.Reprod. Sci., 10:261-273.
Hixon, D.L., Kesler, D.J., Trroxel, T. R., Vincent,D.L. and Wiseman, B.S. 1981.Reproductive hormone secretions J.
Vet
. Ani
m.S
ci.
2008
. 39
: 1
-4
3
RESEARCH ARTICLE
M. Selvaraju et al.

and first service conception ratesubsequent to ovulation control withsynchromate B. Theriogenology, 16:219-229.
Holness, D.H., McCabe, C.T. and Sprowfon,G.W. 1982. Observations on the useof human Chorionic Gonadotrophin(hCG) during the post-inseminationconception rates in synchronized beefcows wit sub-optimum reproductiveperformances. Theriogenology, 17:133-140.
Jain, A. and Dave, B.K. 1992. Effect ofhormonal treatment on conceptionrate and biochemical constituents ofcervico-vaginal fluids of anoestrusand repeat breeding crossbred cows.National Symposium on recentadvances in clinical reproduction indairy cattle reproduction. Chennai.pp. 16-17.
Jimenez, F. Galina, C.S., Duchateau, A. andFierro, R.N. 1988. Levels of LH,progesterone and estradiol-17αduring natural and PGF2α inducedestrus in Indobrazil and Brown Swisscows in the tropics. Anim. Reprod.Sci., 16: 199-206.
Jochle, W., Kuzmano,D. and Vujosevic,J.1982. Oestrus cycle synchroni-zationin dairy heifers with the prostaglandinanalog alfaprostal. Theriogenology,18: 215-225.
Kumar, P., Roy, G.P., Singh, A.P., Prasad, K.M.,Singh, R.B. and Akhahar, M.H. 2000.Fertility in repeat breeder crossbredcows. In: ISSAR XVI Annualconvention and national symposiumon reproduction management foroptimizing reproduction fromlivestock, BAU, Ranchi, pp. 47
Odde, K.G., 1990. A review on synchronizationof estrus in post partum cattle. J.Anim. Sci., 68: 817-830.
Peters, A.R. 1996.Embryo mortality in thecows. Anim.Br.Abstr., 64: 587-598.
Rao, S.V. and Rao, A.R. 1981. Oestrousbehaviour and ovarian activity ofcrossbred heifers. Indian Vet. J., 58:881-884.
Rentfrow, L.R., Randel, R.D. and Newendroff,D.A. 1987. Effect of estrussynchronization with synchromate-Bon serum luteinizing hormone,progesterone and conception rate inBrahman heifers. Theriogenology, 28:355-362.
Selvaraju, S. 1997. Effect of GnRH and eCGon oestrous response and fertility innorgestomet primed post partumanoestrus cows. M.V.Sc thesis.Tamilnadu Veterinary AnimalSciences University, Chennai-51.
Stevenson, J.S., Schmidt, M.K. and Call, E.P.1988. Stage of the oestrous cycle,time of insemination and seasonaleffects on oestrus and fertility inHolstein heifers after prostaglandinF2α, J. Dairy. Sci., 67: 140-145.
Xu, Z.Z., Burton, L.J. and MacMillan, K.L.1997.Reproductive performance oflactating dairy cows following estrussynchronization regimens with PGF2αand progesterone. Theriogenology,47: 687-701.
Zaayer, D. and Van der Horst, C.J.G. 1986.Non-fertility in cows; Treatment withPGF2α and investigation of uterinebiopsy. Cytobios., 45: 55-70.
�
J. V
et. A
nim
.Sci
. 20
08.
39 :
1-4
4
RESEARCH ARTICLE
Induced Oestrus and Fertility Rate...

TOXICITY STUDIES ON CARBON TETRACHLORIDEAND N-NITROSOMETHYLUREA INDEPENDENTLYAND IN COMBINATION IN RATS*
Mammen J. Abraham1 andA. Sundararaj2
Department of Veterinary PathologyMadras Veterinary College, Chennai – 600 007
Abstract
This trial was designed to study thesubchronic effects of carbon tetrachloride(CCl4) and N-Nitrosomethylurea (NMU)independently as well as in combination. Inthe CCl4 and CCl4 + NMU groups, the lipidperoxidation (LPO) recorded the peak level onthe 15th day while in NMU group it was reachedonly on the 75th day. Serum gamma glutamyltranspeptidase (GGT) levels were higher onthe 15th day in CCl4 group and on the 75th dayin NMU and CCl4 + NMU groups. Liver tissueGGT recorded the maximum level on the 15th
day while it reached only by the 75th day in theNMU and CCl4 + NMU groups. DNA strandbreaks recorded an increase on the 45th dayin CCl4 group, 75th day in the NMU group andfrom 45th day onwards in the CCl4 + NMUgroup. Initially there was cytoplasmicvacuolarity in the hepatocytes followed bycholangio-fibrosis while kidney revealeddegenerative changes. Congestion andhaemorrhages were seen in the stomachduring the initial period of the trial in the CCl4group. In the NMU group liver showedcentrilobular necrosis, while kidney revealedtubular epithelial cytoplasmic vacuolations.Hyperplasia of squamous epithelium was seenin the stomach while testes showeddegenerative changes. In the combined group,focal bile duct hyperplasia was prominent inthe liver, while kidneys revealed glomerularswelling and exudation with degenerativechanges in the tubules. Hyperplasia and
hyperkeratosis were seen in the stomach whiletestes showed degenerative changes.
Key words: N-Nitrosomethylurea, Carbontetrachloride, toxicity, rats
Nitroso compounds represent a majorclass of important chemical carcinogens andmutagens. Their importance lies in the factthat these compounds can be formed in vivofrom precursors and therefore lead toendogenous exposure to such compounds(Preusmann, 1980). N-Nitrosomethylurea(NMU) which belongs to nitrosamide group ofN-nitroso compounds was shown to producemarked toxic changes in tissues with rapidgrowth of tissues such as bone marrow,lymphoid organs and gastrointestinal tract(Leaver et al., 1969).
Carbon tetrachloride is a potenthepatotoxin. The inherent ability of carbontetrachloride (CCl4) to induce hepatic necrosisand liver cell regeneration together withconcurrent in vivo formation of N-nitrosocompounds were found to be conducive to thedevelopment of hepatocellular alterations andtumours by their combination. This study wasundertaken to assess the toxicity of NMU insubchronic doses and to study the biochemicaland pathological alterations.
Materials and Methods
The experimental animals weredivided into five groups. The first group of 10
* Part of Ph.D. thesis submitted by the first author to the Tamil Nadu Veterinary & Animal Sciences University, Chennai-511. Associate Professor, Dept. of Veterinary Pathology, CVAS, Mannuthy2. Professor & Head (Retd.) J. V
et. A
nim
.Sci
. 20
08.
39 :
5-9
5Mammen J. Abraham and A. Sundararaj
RESEARCH ARTICLE

rats was maintained as untreated controlgroup. The second group of 20 rats was givenCCl4 at the dose rate of 0.2 ml/kg body weightmixed with olive oil in the ratio 1:1. Theadministration was daily for 10 days andobserved for 10 weeks. The third group oftwenty rats was orally administered NMU at adose rate of 25 mg/kg body weight at weeklyintervals for 10 weeks. The fourth group of 30rats was administered CCl4 orally at a dose rateof 0.2 ml/ kg body weight in olive oil for a periodof 10 days daily. This was followed by oraladministration of NMU at a dose rate of 25mg/kg body weight at weekly intervals for 10weeks. The fifth group of 20 rats was orallyadministered 0.1 ml of olive oil each, for aperiod of 10 days daily and kept for 10 weeks.
All the rats were kept underobservation for 10 weeks. They were sacrificedregularly at fortnightly intervals. Estimationsof lipid peroxidation (Ohkawa et al., 1979) andprotein (Lowry et al., 1951) were carried out infreshly collected liver pieces. The activity ofgamma-glutamyl transpeptidase in freshlycollected blood serum (Jacob, 1971) and liver(Fiala et al., 1976) were also estimated.Fluorometric analysis of DNA unwinding(Birnboim and Jevcak, 1981) was carried outin freshly collected blood Tissues were fixed
in 10% buffered formalin for histopathologicalstudies. Tissues were processed andembedded in paraffin, sectioned at 5µthickness and stained by hematoxylin andeosin.
Results and Discussion
The mean lipid peroxidation (LPO)values for the different treatment and controlgroups are furnished in Fig.1. In the CCl4 groupthe peak mean LPO value was obtained bythe 15th day which got reduced on the 75th dayyet maintaining higher levels than controls. Theincreased levels of LPO were indicative ofperoxidative deterioration of membrane lipidscaused by CCl4 leading to the genesis ofhepatocyte injury and neurosis. This wasobserved by early workers (Comporti, 1985).The NMU group also showed a progressiveincrease in the mean LPO levels from the 15th
day of observation. In the CCl4 + NMU group,the highest LPO levels were obtained duringthe initial period when CCl4 was administered.But following the administration of NMU duringthe later part of the trial although the increasein the LPO levels was significant they were onthe decline when compared to the peak valueat 15 days. These findings suggested thatNMU was not as potent as CCl4 in inducing
Fig.1. Sub Chronic Trial Mean liver tissue peroxidation values (n moles of MDA/100 mg of protein)
J. V
et. A
nim
.Sci
. 20
08.
39 :
5-9
6 Studies on Carbon Tetrachloride ....
RESEARCH ARTICLE

lipid peroxidation. In the olive oil vehicle controlgroup, the peak LPO level was observed at 15days and as a result of cessation of olive oiladministration after the initial 10 days of trial,there was a progressive and steady decreasein the mean LPO values.
The mean serum GGT values of theanimals belonging to the different treatmentand control groups are furnished in Fig. 2. Themean serum GGT activity in the case of theCCl4 group registered an increase up to 15th
day of observation and subsequently there wasa gradual fall in the level. In acute poisoningwith CCl4, Rosalki (1975) observed apronounced elevation of serum GGT valuesand values of up to 20 times the upper limit ofnormal were recorded. In the NMU group thepattern of increase was gradual till the end ofthe trial. In the case of the CCl4 + NMU groupthe peak value was obtained only at the end ofthe trial. The serum GGT activity in the oliveoil control group recorded only a very moderateelevation. Ivanov et al. (1976) attributed theincreased serum GGT activity to the enzymeinduction in the liver.
The mean values of liver tissue GGTactivity for the different treatment groups arepresented in Fig. 3. In the CCl4 group, the peaklevel was obtained by 15th day and as a resultof discontinuation of CCl4 administration by the
10th day, there was a gradual decline till theend of the trial. The NMU group showed thepeak value at the end of the trial as was alsoin the CCl4 + NMU group. On the contrary,for the olive oil control group the peak valuewas obtained by 15th day. Ideo et al. (1972)reported a significant increase of serum andliver GGT in rats poisoned with carbontetrachloride.
The DNA strand breaks assay isused for assessing the genotoxic potential ofchemical compounds. The results obtainedare summarised and furnished in Fig. 4. Inthe assay of DNA strand breaks with WBCs,the CCl4 group showed only a marginalincrease in the % “ D value from the 45th to75th day. In the case of the NMU group theincrease was significant and with the CCl4 +NMU group the values were still higher thanwhen they were administered separately.NMU was known to induce toxic changesmore markedly in tissues with rapid growthlike the haematopoietic and lymphopoietictissues (Leaver et al., 1969).
In the CCl4 group the pathologicalchanges in the liver up to 15 days were severevacuolar changes, with microvesicular fattychanges and nuclear pyknosis (Fig.5). In thekidneys, up to 15 days, renal congestion andtubular degeneration were observed. The
Fig.2. Sub Chronic Trial Mean serum gamma - glutamyl transpeptidase activity (I.U/L) J. V
et. A
nim
.Sci
. 20
08.
39 :
5-9
7Mammen J. Abraham and A. Sundararaj
RESEARCH ARTICLE

stomach showed only mild hyperplasticchanges.
In the NMU group, the hepatocytesdeveloped prominent vacuolar changes andnecrotic changes. (Fig.6). In the kidneys,epithelial cell swelling and later inflammatorychanges could be observed. In the stomach,increased thickness of the squamous epithelialcell layer was seen.
In the case of CCl4 + NMU group, thehepatocytes showed toxic changes in the form
Fig. 3. Sub Chronic Trial Mean liver tissue lipid peroxidation Values (n moles of MDA/100 mg of protein)
Fig.4. Sub Chronic Trial DNA double strand breaks detection by FADU in blood
of cytoplasmic granularity, nuclear pyknosisand fatty changes. These changes werepersistent throughout the trial. The otherpathological changes included renal tubulardegeneration and squamous epithelial cellhyperplasia in the stomach.
In the olive oil vehicle control groupthe only changes observed in the hepatocyteswere mild cytoplasmic vacuolation andoccasional fatty changes.
J. V
et. A
nim
.Sci
. 20
08.
39 :
5-9
8 Studies on Carbon Tetrachloride ....
RESEARCH ARTICLE

Fig. 5. Liver showing vacuolar and fatty changesand nuclear pyknosis.
References
Birnboim, H.C. and Jevcak, J.J. 1981.Fluorometric methods for rapiddetection of DNA strand breaks inhuman white blood cells produced bylow doses of radiation. Cancer Res.,41: 1889-1892.
Comporti, M. 1985. Biology of Disease. Lipidperoxidation and cellular damage intoxic liver injury. Lab. Invest., 53: 599-623
Fiala, S., Mohindru, A., Kettering, W.G., Fiala,A.E. and Morris, H.P. 1976.Glutathione and gamma glutamyltranspeptidase in rat liver duringchemical carcinogenesis. J. Natl.Cancer Inst., 57: 591-598.
Ideo, G., Morganti, A. and Dioguardi, N. 1972.Glutamyl Transpeptidase: a Clinicaland Experimental Study. Digestion, 5: 326-336.
Ivanor, E., Krester, L., Adjarov, D., Chernev,K., Apostolov, L., Dinitrov, P., Drenska,E., Stephanova, M. and Pramatorova,V. 1976. Studies on the mechanismof changes in serum and liver gammaglutamyl transpeptidase activity.Enzyme., 21: 8-20.
Fig. 6. Liver showing vacuolar and necrotic changes.
�
J. V
et. A
nim
.Sci
. 20
08.
39 :
5-9
9Mammen J. Abraham and A. Sundararaj
RESEARCH ARTICLE
Jacob, W.L.W. 1971. A colorimetric assay forgamma-glutanyl transpeptidase.Clinica-Chemica Acta., 31: 175-179.
Leaver, D. D., Swann, P.F. and Magee, R.N.1969. The induction of tumours in therat by a single oral dose of N-Nitroso-N-Methyurea. Br. J. Cancer., 23:177-187.
Lowry, L.H., Rosebrough, N.J., Farr, A.L. andRandals, R.J. 1951. Proteinmeasurement with the Folin PhenolReagent. J. Biol. Chem., 193:265.
Ohkawa, H., Ohishi, N. and Yagi, K. 1979.Assay for lipid peroxides in animaltissues by thiobarbituric acid reaction.Anal. Biochem., 95: 351-358.
Preussmann, 1980. N-Nitroso Compounds.Important environmental carcinogensIn: R.L. Smith and E.A. Bababumi(Eds). Toxicology in the Tropics.Taylor Francis Ltd., London.
Rosalki, S.B., 1975. Gamma glutamyltranspeptidase. Acta. Clin. Chem.,17: 53-108.
CARCASS CHARACTERISTICS OF MADRASRED LAMBS FED WITH DIETS OF VARYINGPROPORTIONS OF ROUGHAGE ANDCONCENTRATE
M.K. Seethalakshmi 1,S. Meenakshi Sundaram 2
R. Kumararaj,3 T. Sivakumar4
P. Tensingh Gnanaraj5 and M. Murugan6
Department of Livestock Production and ManagementMadras Veterinary College, Chennai 600 007
Abstract
Twenty four Madras red lambs wereweaned at 60 days of age and divided in tohigh forage (HF), medium forage (MF), lowforage (LF) and control groups and fed withcomplete ration containing roughage andconcentrate in the ratios of 60:40, 50:50 and40:60 respectively. The control group wasreared by grazing with concentratesupplementation @100g per head. Carcassmeasurements were mainly dependent on thebody weight at slaughter, rather than on energylevels and age.
It was concluded that low foragefeeding in lambs had significant influence onthe primal cuts, meat and bone percentage andyield of offals, blood,liver,lungs and gutpercentages. Similarly a high forage diet hadsignificant influence on the bone percentage
Key words: Carcass characteristics, Madrasred lambs, roughage and concentrate
With limited availability of goodpasture in most instances, the energy acquiredfrom grazing is not enough for higherproduction levels. Intensive feeding based onlocally available crop residues, leguminousfodder and other agro-industrial by-product isan alternative promising feeding system to rearsheep economically in view of dwindlinggrazing resources in India. Hence the present
1 P. G. Scholar2. Associate Professor3. Professor & Head (Retd.)4. Professor & Head5. Associate Professor6. Associate Professor, LRS, Kattupakkam
study was taken to study the performance ofMadras red lambs under feedlot system withcomplete ration having different roughage toconcentrate ratios.
Materials and MethodsTwenty four Madras red ram lambs
born during the main lambing season weretaken for the study. The experiment wasconducted for a period of 105 days. Thelambs weaned at the age of two months wererandomly allotted to four groups (high forage,medium forage, low forage and control group)of six animals each, based on body weight.
Sorghum Stover was used as thesole source for roughage. Forages obtainedas a single lot were sun cured and hay wasground through a medium mesh screen in agrinder. Three complete rations wereformulated by blending sorghum stover withthree different concentrate mixtures in theratios of 60: 40, 50:50 and 40:60 roughage:concentrate respectively. Using conventionalcomposition of the concentrate mixture theexperimental rations were formulated.Experimental ration composition is furnishedin Table 1.
Experimental lambs were fed oncomplete ration ad libitum from 61 to 150 daysof age. Group one lambs were fed withconcentrate and roughage in the ratio of40:60, group two lambs in the ratio of 50:50
J. V
et. A
nim
.Sci
. 20
08.
39 :
10-
13
10 Characteristics of Madras Red Lambs...
RESEARCH ARTICLE

and group three lambs in that of 60:40. Thecontrol group animals were allowed grazingduring the daytime for eight hours and weresupplemented with 100 g of concentrate perhead per day.
At the end of the experimental period,at 105 days of age, lambs had ad libitumaccess to their experimental diets for another24 h, which was followed by a 12 h fasting afterwhich the lambs were weighed andslaughtered as per standard procedure.Carcasses were skinned and the weights ofnon-edible offals such as blood, head, skinand feet was determined. The weight of thegastro intestinal tract and its contents was alsodetermined. The carcass was eviscerated andthe hot carcass weight was determined.Dressing percentage was determined fromcarcass weight and pre slaughter weight. Theedible offals (liver, kidneys, spleen, heart, andlung) were weighed and expressed aspercentage of the live weight. The omental,mesenteric and perinephric fat were separatedand also weighed.
Cut up parts (shoulder, neck, rack,breast, flank, loin and legs) were separated andweighed and expressed as carcass weight. Thearea of Musculus longissimus dorsi (loin eyemuscle) was measured after cross section,and tracing the area on to an acetate paperand measuring it using a planimeter. Lean,bone and fat were separated and weighed fordetermination of meat: bone ratio. Their valueswere calculated in percentage from its carcass
weight.The data collected were subjected tostatistical analysis as per the methodsuggested by Snedecor and Cochran (1994).The percentage data were transformed to arsinvalues prior to analysis.
Results and Discussion
The lambs maintained under lowforage group had significantly higher (P<0.01)dressing percentage (47.08±0.50) than thoseof other experimental groups (Table 2) viz.,medium forage group (44.83±0.50), highforage group (42.39±0.50) and control group(40.3± 0.99). The higher dressing percentageof low forage group lambs could be attributedto their higher body weight at slaughter. Theresults of the present study were in agreementwith the findings of Lioyd et al. (1981) whoreported that heavy weight lambs had higher(P<0.01) dressing percentage.
Among the yield of offals, there wasno marked significant differences between theexperimental and control groups except in thecase of low forage group in the weights of bloodand liver. The experimental groups differedsignificantly (P<0.05) in blood and lungspercentage and differed highly significantly(P<0.01) in the percentage of liver. However,there seemed to be no significant difference inthe percentage of head, skin and feet betweenthe experimental groups. The low forage grouphad significantly (P<0.01) higher yield ofstomach and intestine than the otherexperimental groups. Similar results wereobserved by Mcleod and Baldwin (2000) J.
Vet
. Ani
m.S
ci.
2008
. 39
: 1
0-13
11M.K. Seethalakshmi et al.
RESEARCH ARTICLE
Table 1. Concentrate Feed Formulae
Ingredients Ration 1 Ration 2 Ration 3) Control60:40 (R:C) 50:50 (R:C) 40:60 (R:C
Maize 18 5 8 15
GNC 7 6 5 10
Rice polish - 5 - 22
Broken rice 13 10 - -
Wheat bran - - - 20
Soya - - - 5
Sun Flower Oilcake - - - 10
Sorghum - 12 15 -
Ragi - 10 15 -
Cumbu - - 15 15
Salt 0.5 0.5 0.5 1
Mineral Mixture 1.5 1.5 1.5 2
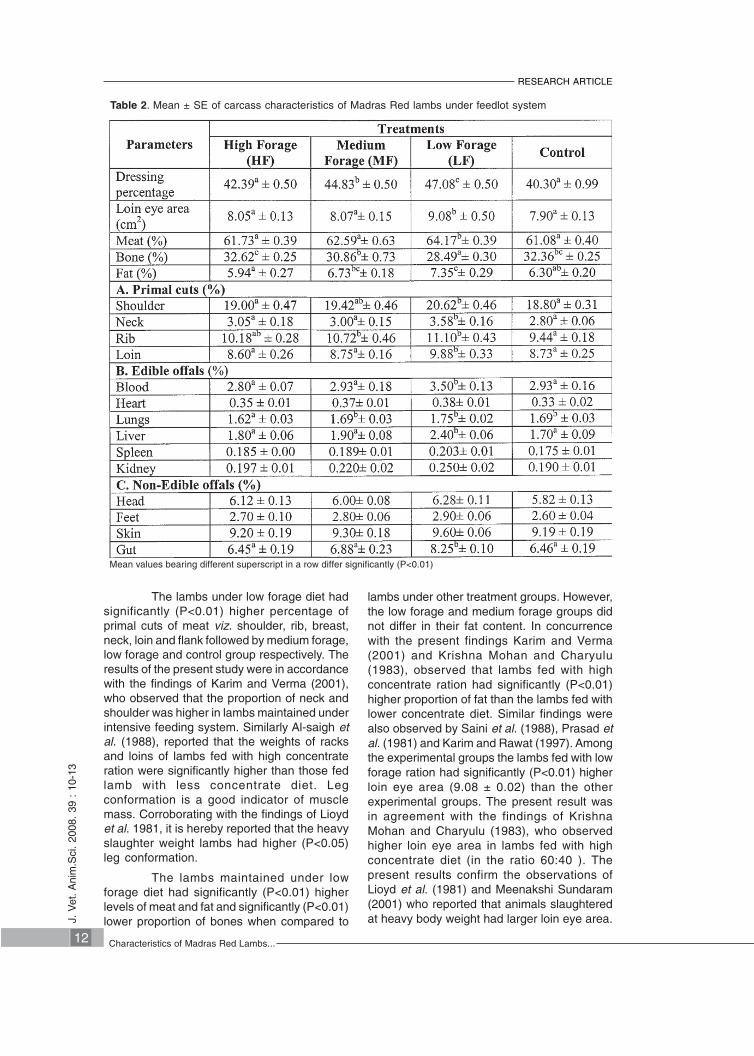
Table 2. Mean ± SE of carcass characteristics of Madras Red lambs under feedlot system
Mean values bearing different superscript in a row differ significantly (P<0.01)
The lambs under low forage diet hadsignificantly (P<0.01) higher percentage ofprimal cuts of meat viz. shoulder, rib, breast,neck, loin and flank followed by medium forage,low forage and control group respectively. Theresults of the present study were in accordancewith the findings of Karim and Verma (2001),who observed that the proportion of neck andshoulder was higher in lambs maintained underintensive feeding system. Similarly Al-saigh etal. (1988), reported that the weights of racksand loins of lambs fed with high concentrateration were significantly higher than those fedlamb with less concentrate diet. Legconformation is a good indicator of musclemass. Corroborating with the findings of Lioydet al. 1981, it is hereby reported that the heavyslaughter weight lambs had higher (P<0.05)leg conformation.
The lambs maintained under lowforage diet had significantly (P<0.01) higherlevels of meat and fat and significantly (P<0.01)lower proportion of bones when compared to
lambs under other treatment groups. However,the low forage and medium forage groups didnot differ in their fat content. In concurrencewith the present findings Karim and Verma(2001) and Krishna Mohan and Charyulu(1983), observed that lambs fed with highconcentrate ration had significantly (P<0.01)higher proportion of fat than the lambs fed withlower concentrate diet. Similar findings werealso observed by Saini et al. (1988), Prasad etal. (1981) and Karim and Rawat (1997). Amongthe experimental groups the lambs fed with lowforage ration had significantly (P<0.01) higherloin eye area (9.08 ± 0.02) than the otherexperimental groups. The present result wasin agreement with the findings of KrishnaMohan and Charyulu (1983), who observedhigher loin eye area in lambs fed with highconcentrate diet (in the ratio 60:40 ). Thepresent results confirm the observations ofLioyd et al. (1981) and Meenakshi Sundaram(2001) who reported that animals slaughteredat heavy body weight had larger loin eye area.J.
Vet
. Ani
m.S
ci.
2008
. 39
: 1
0-13
12 Characteristics of Madras Red Lambs...
RESEARCH ARTICLE

�
J. V
et. A
nim
.Sci
. 20
08.
39 :
10-
13
13M.K. Seethalakshmi et al.
RESEARCH ARTICLE
References
Al-Saigh, M.N.R., Abdullah, A.H., Kutaibany,H.I.E and Gharib, F.H. 1988. Effect offeeding different levels of concentratediet and alfalfa on the performanceof Arabi lambs and their carcasscharacteristics. Indian J. Anim. Sci.,58: 1327-1332.
Karim, S.A and Rawat, P.S. 1997. Growthperformance and carcasscharacteristics of lambs raised onvarying proportion of roughage andconcentrate. Indian J. Anim. Sci., 67:902-905.
Karim, S.A and Verma, D.L. 2001. Growthperformance and carcasscharacteristics of finisher lambsmaintained on intensive feeding orgrazing with supplementation. IndianJ Anim. Sci., 71: 959-961.
Krishna Mohan, D.V.G and Charyulu, E.K.1983. Growth nutrient utilization andcarcass characteristics in lambs fedration having different proportions ofconcentrate to roughage. Indian J.Anim. Sci., 53: 1228-1232.
Lioyd, W.R., Slyter, A.L and Costello, W.J.1981. Effect of breed,sex and finalweight on feed lot performance ,
carcass characteristics and meatpalatability of lambs. J. Anim. Sci., 51:317-320.
Mcleod, K.R and Baldwin, R.L. 2000. Effect ofdiet forage:concentrate ratio andmetabolizable energy intake onvisceral organ growth and in vitrooxidative capacity of gut tissues insheep. J. Anim. Sci., 78: 760-770.
Meenakshi Sundaram, S.2001. Comparativeperformance of Madras Red Sheepunder different management systems.Ph.D thesis, TANUVAS, Chennai.
Prasad, V.S.S., Singh, R.N and Bapna, D.L1981. Carcass composition of nativeand cross bred lambs maintained ontwo different rations. The Indian J.Anim. Genetics and Breed., 3: 25-30.
Saini, A.L., Khan, B.U and Khub singh. 1988.Growth performance of goats underthree systems of management. IndianJ . Anim. Sci., 58: 604-609.
Snedecor, G.W and Cochran, W.G. 1994.Statistical methods. 8th ed. Iowa StateUniversity Press, Ames, Iowa. 330 p.

HOMOLOGOUS TRANSPLANTATION OFBOVINE ETHMOID CARCINOMA CELLS *
Ajith Jacob George1,K.M. Ramachandran2 , A. Rajan 3,K.T. Punnoose4 and C.B. Manomohan 5
Centre for Excellence in PathologyCollege of Veterinary and Animal SciencesMannuthy-680 651,Thrissur, Kerala
Abstract
A study was undertaken to transplantbovine ethmoid tumour cells into calvesimmunosuppressed with hydrocortisone.Twelve calves were equally grouped into twogroups of control and immunosuppressedgroup. Trypsinized single cell suspension offreshly taken bovine ethmoid tumour wasinoculated subcutaneously into all the calves.The animals were observed for four months.At the end of the observation period the calveswere sacrificed and site of inoculation wastaken for histopathology. The tumour failed togrow in calves even after providing favourableconditions. Haematological studies were alsodone to evaluate the immuno-competency ofthe animals. The failure to transplant bovineethmoid carcinoma cells subcutaneously incalves even though majority of therequirements were satisfied may be due to theabsence of some unknown factors required forthe growth of neoplastic cells.
Key words : Bovine ethmoid carcinoma cells,homologous transplantation
A transplanted tumour offers anexcellent model system for studying thetumour-host relationship and clues which aidin the clinical management of the tumour inthe primary host. Several attempts were madefor transplantation of the ethmoturbinate
* Part of M.V.Sc thesis submitted by the first author to the Kerala Agricultural University, Thrissur1. Assistant Professor, CVAS, Pookode, Wayanad2. Since deceased3. Dean (Retd.)4. Professor (Retd.), Dept. of Veterinary Microbiology5. Registrar, KVASU
neoplasms of the domestic animals intoexperimental animals with or withoutimmunosuppression without success(Duncan et al., 1967; Rajan et al., 1972; Nair,1973; Jayaraman et al., 1979; Sulochana,1980; Pospischil et al., 1982; Karki and Rajan,1986 and Chaudhary, 1994). Ajith (1994)transplanted ethmoid tumour of cattle byinoculating single cell suspension of thetumour subcutaneously in miceimmunosuppressed with cyclosporine-A. Thispaper describes an attempt to transplantethmoid carcinoma cells in calvessubcutaneously.
Materials and Methods
Cattle bearing tumour of theethmoturbinate mucosa and twelve neonatalcalves which were not fed colostrum wereutilised for the study. Calves were groupedequally into two. Group A of six calves wereadministered hydrocortisone sodiumsuccinate (Neon) subcutaneously at the rateof 3 mg/kg body weight one day prior totransplantation and was repeated for threedays. Group B was kept as control withoutimmunosuppression.
Hank’s balanced salt solution(Hi-Media) (HBSS) and TC 199 media(Hi-Media)prepared as per the manufacturers’direction by dissolving in deionized doubledistilled water and filtered through 0.2 µ
J. V
et. A
nim
.Sci
. 20
08.
39 :
14-
17
14 Bovine Ethmoid Carcinoma Cells...
RESEARCH ARTICLE

membrane filter (Sartorius) under positivepressure were used as maintenance andculture media. Culture media wassupplemented with 10 per cent foetal calfserum (CSIR, New Delhi). The antibioticmixture added contained penicillin G - 200 IU/ml, streptomycin - 150 ug/ml, gentamycin - 50ug/ml and nystatin - 100 IU/ml.
A strength of 0.25 per cent trypsin (1:250 Difco) in phosphate buffered saline (Caand Mg free) (Hi-Media) (PBS) was preparedin deionized double distilled water andsterilized by filtering through 0.2µ membranefilter.
Tumour bearing cows wereeuthanised by exsanguination after stunningwith captive bolt pistol. Fresh soft healthytumour tissue was dissected out under sterilecondition from the deeper portion avoiding thenecrotic area. The tumour tissue was collectedin HBSS with antibiotics. A part of the tumourtissue was taken in 10% formalin forhistopathology.
The tumour tissue was washedseveral times using PBS containing antibiotics,to remove the debris. It was transferred into aPetri dish containing PBS. The superficialfascia was removed from the tumour mass. Thetissue was then cut into small cubes of onemillimetre size and washed several times withPBS. A few cubes of the tumour tissue weretransferred into a beaker containing l00 ml of0.25 per cent trypsin solution in PBS. Thebeaker was placed on a magnetic stirrer andstirred for 10 min using a magnetic stirringpaddle. The supernatant was decanted andreplaced with fresh 100 ml of 0.25 per centtrypsin and again stirred using magnetic stirrerfor another 10 min. Serum (3 ml) was addedto the suspension to neutralise the trypsin. Thesuspension was sieved through a doublelayered sterile muslin cloth into a sterile flask.The suspension was transferred to a centrifugetube and was centrifuged at 1000 rpm for 5
min. The supernatant was poured off and thecell pellet was suspended in media withantibiotic. The viable cell concentration wasadjusted to 1X 10⁶ viable cells per 0.25 ml afterestimating live cell concentration by trypan bluestaining.
Single cell suspension obtained bytrypsinization was injected subcutaneously inthe flap of flank of all the calves, at the rate of1X I06 viable cells per inoculum. Theexperimental animals were observed for fourmonths. The thickness of the skin at the site ofinoculation was measured immediately andrepeated monthly. All animals were sacrificedafter the observation period. The site ofinoculation, spleen, lungs, heart, liver andkidney were taken for histopathology. At thetime of sacrifice blood samples were collectedin EDTA for total leucocyte count anddifferential leucocyte count.
Results and Discussion
The gross and histopathologicalfindings confirm that the tumour was a primaryadenocarcinoma arising from theethmoturbinate mucosa, which agreed with theobservations made by Gangadharan, 1992.Thickness of the skin at the site of inoculationis shown in Table 1. Control animals revealedlocal oedema at the site of inoculation 24 hafter transplantation which attained maximumsize by first week and then gradually decreasedin size. The animals of group B, showedcongested blood vessels with infiltration oflymphocytes and macrophages at theinoculation site. Neoplastic cells were notdetected at the site of inoculation. The absenceof tumour growth in control animals could bedue to the destruction of the neoplastic cellsby the host immune cells as observedmicroscopically.
The animals of group A revealed initialswelling which subsided within 24 h.Histologically there was no evidence of tumour
J. V
et. A
nim
.Sci
. 20
08.
39 :
14-
17
15Ajith Jacob George et al.
RESEARCH ARTICLE
Table 1: Skin thickness after transplantation
Months Group A Group B
0 0.410 ± 0.010 0.419 ± 0.006
1 0.313 ± 0.004 0.410 ± 0.075
2 0.320 ± 0.004 0.368 ± 0.093
3 0.331 ± 0.003 0.417 ± 0.005
4 0.392 ±0.003 0.420 ± 0.006

growth. The total leucocyte count andlymphocyte percentage are shown in Table 2.There was significant difference between theanimals of group A and group B in theseparameters.The total leucocyte counts in allexperimental animals were very low whencompared to the control. The differentialleucocyte count of the immunosuppressedanimals showed a very low lymphocytepercentage when compared to the control.
Jayaraman et al. (1979) suggestedthat the failure to transplant bovine ethmoidtumour cells may perhaps be due to theetiological agent not being present in thesecells or remaining in an incomplete form whichrequires certain exciting condition formaturation and replication. Karki and Rajan(1986) attributed degraded condition of thetumour tissue and the absence of certainunknown factors required for the growth of theneoplastic cells in the receipient along with therole of infectious agent to the failure of tumourgrowth in vivo. Ebbers et al. (1986) suggestedthat nasopharyngeal carcinomas have difficultyin surviving in tissue culture system and eventhe transplantation of solid tumour mass intonude mouse was also not easy. There may alsobe various other factors like type of host, ageof host, immune status of the receipient, typeof tissue preparation, type of tumour,inoculation rate, viability of the cells and routeof inoculation which would determine thetransplantability of tumour.
Lin et al. (1990) transplantednasopharyngeal carcinoma cellssubcutaneously into the back of BALB/c nudemice. The tumour grew upto 2-3 months, and
attained a size of 2.2 cm. Ajith (1994) observedthat ethmoid tumour could be successfullytransplanted in mice treated with cyclosporineA supports the assumption thatimmunosuppression is a prerequisite for thedevelopment of neoplasms. Lowering of theimmunological barrier of the host thereforeappears to be an important event inestablishing neoplastic growth.
In the present study the experimentallot consisted of young animals which werenaturally at a lower immunological competencyand were immunosuppressed withhydrocortisone. Even after providing theseconditions the tumour cells failed to grow whichindicates the need of some unknown factors.Watanabe et al. (1980) suggested thatsubcutaneous route was more effective than I/P or I/V routes of inoculation probably due tobetter blood supply and presence of connectivetissue framework for fixation and proliferationof the inoculum.
It has also been reported that thefailure of some tumours to grow wheninoculated subcutaneously (Al-Yamen andWillenborg, 1984) was probably due to factorssuch as lack of proper vascularisation or thelack of essential factors required for tumourgrowth, which is present in the original hostbut not in the receipient. In the tumourtransplant obtained by Ajith (1994) moderatedegree of vascularisation was present whichmight have facilitated the proliferation andgrowth of the tumour cells. The tumour cellstransplanted in the present study did not initiatecapillary proliferation which might have beena concurrent factor for the failure of transplant.
J. V
et. A
nim
.Sci
. 20
08.
39 :
14-
17
16 Bovine Ethmoid Carcinoma Cells...
RESEARCH ARTICLE
Table 2: Total leucocyte count (xl03/mm3) and lymphocyte percentage
Parameter Group A Group B
Total leucocyte 4.90 ± 0.15 9.25 ± 0.21
Lymphocyte percentage 32.00 ± 0.58 57.30 ± 0.98
References
Ajith, J.G. 1994. Homologous and heterologoustransplantation of bovine ethmoidarcinoma cells. M.V.Sc. thesis. KeralaAgricultural University, Thrissur.
Al-Yaman, F. and Willenborg, D.O. 1984.Heterotransplantation of ovinesquamous cell carcinoma into nudemice. Res. Vet. Sci., 36: 339-344.
Chaudhary, S.K. 1994. Assessment of the roleof aflatoxin in the aetiology ofcarcinoma of the mucosa of theethimoid. Ph.D. thesis. KeralaAgricultural University, Thrissur.
Duncan, J.R., Tyler, O.E., Vandermaaten, M.S.and Anderson, J.R. 1967. Enzooticnasal adenocarcinoma in sheep. J.Am. Vet. Med. Assoc., 151: 732-734.

J. V
et. A
nim
.Sci
. 20
08.
39 :
14-
17
17Ajith Jacob George et. al
RESEARCH ARTICLE
�
Ebbers, J., Linderberger, J., Gottesterge -Orsulakova, A.M.Z., Koldovsky, P.,Koldovsky, V. and Vosteen, K.H. 1986.Xenografting of nasopharyngealcarcinoma into athymic mice. Orl”J. Otorhenolaryngol. Relat. Spec, 48:221-229.
Gangadharan, B. 1992. As assessment of thebiological characteristics of theneoplastic cells of ethmoidcaarcinoma in cattle. M.V.Sc. thesis.Kerala Agricultural University,Thrissur.
Jayaraman, M.S., Pathmanabha, V.D.,Masillamony, P.R. and Nachimuthu, K.1979.Epidemiological and virologicalstudies on sinus neoplasms of theupper respiratory tract of bovines inTamil Nadu. Cherion, 8: 34-39.
Karki, M.S. and Rajan, A. 1986. Transplantationstudies on the carcinoma ofethmoturbinate mucosa of cattle.Kerala. J. Vet. Sci. 17: 74-84.
Lin, C., Wong, C., Chan, W., Tzung, K., Ho,J.K.E., Hsu, M. and Chuang, S. 1990.Establishment and characterization oftwo nasopharyngeal carcinoma celllines. Lab.Invest., 62: 713-718.
Nair, K.V.N. 1973. A study of the commonneoplasms of domestic animals inKerala. M.V.Sc. thesis. KeralaAgricultural University, Thrissur.
Pospischil, A, Weiland, F., Sandersleben, J.,Von Hanichan, T. and Chaffer, H.1982.Endemic ethmoidal tumours incattle. Sarcomas and carcinomas. Alight and electronmicroscopic study.Zentbl. Vet. Med., 29: 628-636.
Rajan, A, Sivadas, E.G., Nair, M.K. andMaryamma, K.I. 1972. Incidence andpathology of tumours of the paranasalsinuses in domestic animals. Kerala.J. Vet. Sci., 3: 83-10l.
Sulochana, S. 1980. Etiological aspects of thetumours of the mucosa of the ethmoidwith special reference to viruses.Proc. Symp. Tumour, : 7-13.
Watanabe, S., Shimosato, Y., Kuroki, M., Sato,Y. and Nakajima, T. 1980.Transplantability of human lymphoidcell line, lymphoma and leukaemia insplenectomized and/or irradiatednude mice. Cancer Res., 40: 2588-2593.

COMPARING THE SENSITIVITY OF DETECTINGVIRAL ANTIGEN IN DIFFERENT PARTS OF RABIESSUSPECTED BRAIN USING FLUORESCENTANTIBODY TEST
S. Raju1, M.R. Saseendranath2 andP.V. Tresamol3
Department of Veterinary Epidemiology &Preventive MedicineCollege of Veterinary & Animal SciencesMannuthy- 680 651, Thrissur, Kerala
Abstract
Among 78 rabies suspected brainsamples examined, 61 were found positive indirect fluorescent antibody test (FAT) andmaximum percentage of positivity wasobserved (91.8 per cent) in impression smearsfrom the brain stem. A thorough examinationof various parts of brain tissue including thebrain stem is needed before giving a concreteresult for rabies diagnosis using FAT.
Key words: Rabies, direct fluorescentantibody test, brain stem
Only few diseases cause as muchanxiety as does rabies. The laboratorydiagnosis occupies a central role in meetingthe threat of rabies because upon its verdictoften depend the decision whether or not toproceed with a course of post exposureantirabies therapy. The choice of the parts ofbrain for taking impressions for FAT definitelyaffects the results of the test (Tepsumethanonet al., 1997; Bingham and Merwe, 2002).
Clinical observation may only lead toa suspicion of rabies because signs of thedisease are not characteristic and may varygreatly from one animal to another and nogross postmortem lesions can be consideredpathognomonic. The only way to perform areliable diagnosis of rabies is to identify thevirus or viral antigens using laboratory tests(Hostnik et al., 2001; David et al., 2002).
1. Veterinary Surgeon, AHD, Kerala (on leave)2. Professor & Head3. Associate Professor
The reliability of immunofluor-escence depends on the section of the braintissue taken because rabies virus does notinfect uniformly and varies with speciessusceptibility (Dean et al., 1996). So obviouslythe choice of the tissue for taking impresimpressions for FAT definitely affects thesensitivity of the test. Hence the present studywas undertaken to assess the reliability ofdetecting the viral antigens from various partsof the brain using FAT.
Materials and Methods
Brain samples were collected from 78dogs suspected for rabies, brought forpostmortem examination at the College ofVeterinary and Animal Sciences, Mannuthy.Out of 78, 31 dogs were having definite historyof dog bite. Impression smears were preparedfrom hippocampus (both right and left), brainstem and cerebellum and subjected to directFAT as per CDC protocol (2003).
Impression smears were fixed bykeeping in cold acetone (-20°C) for 30 min. Theslides were taken out and allowed to dry.Diluted Fluorescien isothiocyanate conjugatedantirabies antinucleo capsid antibody wasadded to the slides and incubated in a moistchamber at 37°C for 45 min. Slides were thenwashed in phosphate buffered saline (pH 7.4),two changes for 5 min. Slides were then
J. V
et. A
nim
.Sci
. 20
08.
39 :
18-
19
18 Sensitivity of Detecting Viral Antigen
RESEARCH ARTICLE

examined under fluorescent microscope using20% glycerol-Tris buffered saline as mountant.
Results and Discussion
Positive samples revealed foci of viralantigen as apple green fluorescence underultraviolet illumination. Out of 78 brain samplesexamined 61 were positive by FAT (Table).When the positivity of impression smears fromvarious parts of the brain were compared, brainstem showed maximum percentage of positivity(91.8 per cent). Higher sensitivity of impressionsmears from brain stem in diagnosing rabiesby FAT was also reported by Tepsumethanonet al. (1997) and Bingham and Merwe (2002).Fifty samples (80.3 per cent) taken fromhippocampus and 44 samples (72 per cent)from cerebellum showed good resultsequivalent to that of brain stem. Thefluorescence varied in size and ranged fromlarge oval to small sand-dust like particles. The
small sized fluorescing particles were observedin the brain stem, while large sizedfluorescence was observed in the impressionsmears from hippocampus and cerebellum. Intwo cases impressions from brain stem werenegative but hippocampus showed positiveresult. Samples from cerebellum showedpositive result in three cases where brain stemwere negative.
Thus, examination of various parts ofbrain for detection of rabies virus antigensusing FAT showed maximum percentagepositivity with impressions from brain stem.Hence examination of brain stem must beincluded in every specimen before giving anegative result. It was also concluded that athorough examination of impression smears ofvarious brain tissue is needed before giving aconcrete result for rabies diagnosis using FAT.
Table. Comparison of different sampling sites in FAT for rabies diagnosis
References
Bingham, J. and Merwe, M. 2002. Distributionof rabies antigen in infected brainmaterial: determining the reliability ofdifferent regions of the brain for therabies fluorescent antibody test. J.Virol. Methods, 101: 85-94.
Centre for Disease Control (CDC). Viral andRickettsial Zoonoses Branch (VRZB).2003. Protocol for PostmortemDiagnosis of Rabies in Animals byDirect Fluorescent Antibody Testing.22 p.
David, D., Yakobson, B., Rotenberg, D.,Dveres, N., Davidson, I. and Stram,Y. 2002. Rabies virus detection byRT-PCR in decomposed naturallyinfected brains. Vet. Microbiol.,311: 1-8.
Dean, D.J., Abelseth, M.K. and Atanasiu, P. 1996.The Fluorescent Antibody Test. In :Meslin, F.X., Kaplan, M.M. andKoprowsky, H. (Eds). LaboratoryTechniques in Rabies. 4th ed., WorldHealth Organization, Geneva. pp. 88-95.
Hostnik, P.M., Strancar, D., Maganja, B. andGrom, J. 2001. Doubtful anddisconcordant results in fluorescentantibody test for rabies diagnosing.Veterinarski. Arhiv., 71: 65-73.
Tepsumethanon, V., Lumlertdacha, b. andMitmoonpitak, C. 1997. Thesensitivity of fluorescent rabiesantibody testing on samples takenfrom brain stem, cerebellum,cerebrum and hippocampus. Thai J.Vet. Med., 27: 335-340.
J. V
et. A
nim
.Sci
. 20
08.
39 :
18-
19
19S. Raju et al.
RESEARCH ARTICLE
Part of brain examined Number positive Percent positive
Brain stem 56 91.8
Hippocampus 50 80.3
Cerebellum 44 72.0
�
Total samples examined : 78Number of samples positive for rabies : 61

EFFECT OF DNA MICROSATELLITEMARKERS ON MILK FAT PERCENTAGE OFCROSSBRED CATTLE OF KERALA
T. Naicy1, K. Anilkumar2, A. P. Usha 3 andK.V. Raghunandanan4
Centre for Advanced Studies in Animal Genetics and BreedingCollege of Veterinary and Animal SciencesMannuthy-680 651, Thrissur, Kerala
Abstract
A recent application of moleculartechnology in dairy cattle breeding is theidentification of the regions of the DNA affectingthe production traits. In the present study, thepossibility of using the informations of the allelefrequency, heterozygosity and PIC of twomicrosatellite markers and their associationwith the economically important traits for theselection of crossbred cattle were studied. Boththe markers were highly informative, as theirPIC values were more than 0.5. Animals withthe allele 205 at HUJII77 locus had significantlylower milk fat percentage compared to theanimals without this allele. The selectionagainst this allele may contribute much inimproving the milk fat percentage. For BM4305locus, the allele 154 had effects on lower milkfat percentage. The selection against this allelemay contribute much in improving the milk fatpercentage. The animals with the allele 166had the highest average of milk fat percentage.Selection for this allele will have good impacton higher milk fat percentage.
Key words: Microsatellite markers, Milk FatPercentage, Heterozygosity.
The important applications ofmolecular markers in conventional breedingprogrammes include linkage mapping ofQuantitative Trait Loci (QTL), marker assistedselection (MAS) and marker assistedintrogression. MAS is the process of using the
1. Assistant Professor2. Associate Professor, LRS, Thiruvazhamkunnu3. Professor and Head, CPPR, Mannuthy4. Director(Retd.)
results of DNA testing to assist in the selectionof individuals to become parents in the nextgeneration. In the present study, possibility ofusing the information of the allele frequency,heterozygosity and polymorphic informationcontent of two polymorphic microsatellitemarkers (HUJII77 and BM4305) in the selectionof crossbred cattle for milk fat percentage wasstudied. According to Shalom et al. (1994) themicrosatellite marker HUJII77 was located onBTA3 with a relative position of 81.331 cM, witha size range of 187-213 bp and this markerhas dinucleotide GT repeat sequences, whichcan be represented as (GT)2TT(GT)15 with 8alleles and a heterozygosity of 86%. This wasalso confirmed by Ihara et al. (2004) in thegenetic map of the cattle genome based on3802 microsatellites. The microsatellite markerBM4305 is located on BTA14 with a relativeposition of 83.309 cM and heterozygosity of69 with a size range of 148-168 bp (Bishop etal., 1994; Ihara et al., 2004). Heyen et al. (1999)detected that the same marker affected milkyield also.
Materials and Methods
Blood and milk samples werecollected from animals from two dairy cattlefarms of the Kerala Agricultural Universitynamely, University Livestock Farm, Mannuthyand Cattle Breeding Farm, Thumburmuzhi.DNA samples from 117 animals were used tofind out the PIC of the selected markers. DNA
J. V
et. A
nim
.Sci
. 20
08.
39 :
20-
22
20 Microsatellite Markers.......
RESEARCH ARTICLE

was extracted by modifications in the phenol-chloroform protocol (Andersson et al., 1986)and milk samples were analysed for fatpercentage (IS: 1224, 1977).
Two markers viz., HUJII77 andBM4305 were chosen for the study. Theprimers for these markers were customsynthesised. The markers were typed for theirpolymorphism. For visualising the PCRproducts by autoradiography, forward primerof each marker was radio-labelled at the 5’ endwith ã32P-ATP. The reaction was carried outwith the DNA endlabeling Kit 1 (Genei). Foreach microsatellite loci PCR conditions werestandardised separately.
To determine the allele size ofmarkers, comparison with a sequencing ladderis necessary. Single stranded M13 phage DNAwas sequenced using the DNA Sequencing KitVersion 2.0 (M/s Amersham BiosciencesCorporation, USA). The radio-labeled PCRproducts were fractionated using 6 per centdenaturing polyacrylamide gels. A volume of3.5 µl of formamide loading buffer (0.02 percent Xylene Cyanol, 0.02 per centBromophenol Blue, 10 mM EDTA, 98 per centdeionised formamide) was added to the PCRproducts, mixed well, denatured at 95°C for 5min and cooled immediately on ice. Again avolume of 3.5-4 µl each of this mixture wasloaded into each well. Sequenced products ofM13 DNA were loaded in four wells (G, A, T,C). After electrophoresis, the gel was driedand autoradiographed. The number of allelesfor each marker was counted and their sizewas determined by comparing with M13sequencing ladder. The G, A, T and Csequences were read from the bottom to thetop in the order. The allele sizes weredetermined corresponding to the G, A, T and Cbands and the allele frequency was worked out.
Heterozygosity was calculated bythe method of Ott (1992). The unbiasedheterozygosity was calculated using theformula of Pandey et al. (2002). PIC valuesfor the markers were calculated (Botstein etal., 1980). Large sample test (Z test) for thecomparison of means of allele containingpopulation with that of the population withoutthe allele was done by the method suggestedby Snedecor and Cochran (1985).
Results and Discussion
The alleles present in the sires ofthe cows under study were considered for theanalysis. The allelic effects of HUJII77 andBM4305 on milk fat percentage of crossbreddairy cattle of Kerala are presented in thetable.
1. HUJII77
Thirteen alleles with a size range of193-221 bp and 36 genotypes were observedfor the microsatellite marker HUJII77 incrossbred cattle of Kerala. Shalom et al.(1994) and Ihara et al. (2004) reported a sizerange of 187-213 bp for the marker and thenumber of alleles observed by them waseleven. For HUJII77, direct countheterozygosity, unbiased heterozygosity andPIC were 0.851, 0.854 and 0.842. This meansthe marker is highly informative.
The animals with the allele 205 atHUJII77 locus showed a significantly lowermilk fat percentage (3.3±0.18), compared tothe animals without this allele (3.78±0.11).This microsatellite marker is located on BTA3,in which the markers ILSTS096 and BL41 arelocated and both of them have strongassociations with milk fat percentage (Heyenet al., 1999). This may be the reason for theassociation shown by the alleles of HUJII77
J. V
et. A
nim
.Sci
. 20
08.
39 :
20-
22
21T. Naicy et al.
RESEARCH ARTICLE
Table. Effects of HUJII77 and BM4305 alleles on milk fat percentage of crossbred dairy cattle of Kerala
Sl.No. Alleles of BM4305 Average Milk Alleles of Average MilkFat Percentage HUJII77 Fat Percentage
1 146 3.94±0.14 b 203 3.48±0.16 b
2 148 3.53±0.33 b 205 3.30±0.18 a
3 154 3.19±0.23 a 207 4.00±0.34 b
4 156 3.60±0.24 b 209 3.85±1.44 b
5 158 3.79±0.16 b 211 3.56±0.22 b
6 160 3.66±0.14 b 213 4.00±0.24 b
7 162 3.68±0.23 b
8 166 4.58±0.20 c
Means bearing same superscripts do not differ significantly (P<0.05)

with the milk fat percentage.
2. BM4305
Twelve alleles were detected with asize range of 146-168 bp and 37 genotypes inthe genetically unrelated population. ForBM4305, direct count heterozygosity, unbiasedheterozygosity and PIC were 0.861, 0.864 and0.846. This means this marker is also highlyinformative.
The average milk fat percentage was3.19±0.23, for the animals with the allele 154,
�
J. V
et. A
nim
.Sci
. 20
08.
39 :
20-
22
22 Microsatellite Markers......
RESEARCH ARTICLE
which was significantly lower from the animalswithout this allele (3.81±0.0106).
The allelic average for milk fat percentage isvery high (4.58±0.2) for the allele 166. Theallele 166 had a frequency of 0.063, which islow in the population. Hence selection for thisallele can be advocated strongly for thepopulation under study. It is recommended toundertake a study with larger number ofsamples and more number of daughters foreffective marker assisted selection.
References
Andersson, L., Bohme, J., Rask, L. andPeterson, P.A. 1986. Genomichybridization of bovine class II majorhistocompatability genes : Extensivepolymorphism of DQá and DQâ
genes.Anim. Genet., 17: 95-112
Bishop, M.D., Kappes, S.M., Keele, J.W.,Stone, R.T., Sunden, S.L., Hawkins,G.A., Toldo, S.S., Fries, R., Grosz,M.D., Yoo, J. and Beattie, G.W. 1994.A genetic linkage map for cattle.Genetics, 136: 619-639
Botstein, D., White, R.D., Skolnick, M. andDavis, R.W. 1980. Construction of agenetic linkage map in man usingrestriction fragment lengthpolymorphisms. Am. J. Hum. Genet.,32: 314-331
Heyen, D.W., Weller, J.I., Ron, M., Band, M.,Beever, J.E., Feldmesser, E., Da, Y.,Wiggans, G.R., VanRaden, P.M. andLewin, H.A. 1999. A genome scan forQTL influencing milk production andhealth traits in dairy cattle. Physiol.Genom., 1: 165-175
Ihara, N., Takasuga, A., Mizoshita, K., Takeda,H., Sugimoto, M., Mizoguchi, Y.,Hirano, T., Itoh, T., Watanabe, T.,Reed, K.M., Snelling, W.M., Kappes,
S.M., Beattie, C.W., Bennet, G.L. andSugimoto, Y. 2004. A comprehensivegenetic map of the cattle genomebased on 3802 microsatellites.Genome Res., 14: 1987-1998
IS: 1224. 1977. Determination of fat byGerber’s method. Part. I. Milk. IndianStandards Institution, New Delhi, 18 p.
Ott, J. 1992. Strategies for characterizinghighly polymorphic markers in humangene mapping. Am. J. Hum. Genet.,51: 283-290
Pandey, A.K., Tantia, M.S., Kumar, D., Mishra,B., Chaudhary, P. and Vijh, R.K. 2002.Microsatellite analysis of three poultrybreeds of India. Asian-Aust. J. Anim.Sci., 15: 1536-1542
Shalom, A., Mosig, M.O., Barendse, W.,Friedmann, A. and Soller, M. 1994.Dinucleotide repeat polymorphism atthe bovine HUJ246, HUJII77,HUJVI74 and HUGI75 loci. Anim.Genet., 25: 56
Snedecor, G.W. and Cochran, W.G. 1985.Statistical methods. 7th ed. The IowaState University Press, USA, 313 p.

EVALUATION OF BACTERIOLOGICALQUALITY OF PROCESSED CHICKEN
Raji Rose Jacob1, C. Sethulekshmi2,E. Nanu3 and B.Sunil4
Department of Veterinary Public HealthCollege of Veterinary and Animal SciencesMannuthy - 680 651, Thrissur, Kerala
Abstract
Bacteriological quality of 60 poultrycarcasses selected from a meat processingplant located at Kochi in Kerala was assessedduring the present investigation. The sampleconsisted of 30 carcasses each randomlycollected after the removal of head and forefeet (AR HF) and after evisceration (AE) toevaluate the bacterial quality as well asisolation and identification of salmonella . Thesamples were collected and brought to thelaboratory in thermocool containers andprocessed immediately. The samples had anoverall mean Coliform count, Escherichia colicount, Total viable count and Faecalstreptococcal count of 3.81 + 0.09 , 0.89 + 0.23,5.88 + 0.13 and 3.89 + 0.06, 0.89 log10 cfu/cm2 respectively in samples collected fromARHF and 3.92 + 0.12, 2.15 x + 0.24, 4.44 x +0.10, 3.91 + 0.07 log10 cfu/cm2 respectively inAE samples. The salmonella was isolated fromten per cent carcasses from ARHF and positiveisolates belonged to S. enteritidis.
Key words: Poultry carcasses, meatprocessing plant, total viable count, coliformcount, Escherichia coli count, faecalstreptococcal count, Salmonella.
The shelf life of chicken carcasses,its products and the consumer safety primarilydepend on their microbial quality. The microbialquality of the carcasses depends on the levelof contamination from the feathers,
1. Veterinary Surgeon, AHD, Kerala2. Assistant Professor3. Dean (Retd.)4. Associate Professor
defeathering machines, hygienic practices ofpersonal engaged in the slaughter anddressing of chicken and also the environment.Considering the above factors bacterial qualityof chicken carcasses produced in a meatprocessing plant located at Kochi wasevaluated at two points on the production line.
Materials and Methods
During the investigation a total of 60poultry carcasses were randomly selected froma meat processing plant located at Kochi inKerala during a period from April to June 2002.The sample consisted of 30 carcasses each,randomly collected after the removal of headand fore feet (ARHF) and after evisceration(AE) to evaluate the bacterial quality as wellas isolation and identification of salmonella.The samples were collected and brought to thelaboratory in thermocool containers andprocessed immediately to evaluate thebacterial quality. The selected serial dilutionof each sample was used to estimate Totalviable count (TVC), Coliform count (CC), E. colicount (ECC) and Faecal streptococcal count(FSC) according to the procedures describedby Swanson et al. (2001); Anon(1968), Anon(1973)and BIS (1980), respectively. Thesamples were identified by the cultural,morphological and biochemical characteristicsdescribed by Barrow and Feltham (1993). Allthe suspected isolates of Salmonella were
J. V
et. A
nim
.Sci
. 20
08.
39 :
23-
25
23Raji Rose Jacob et al.
RESEARCH ARTICLE

serotyped at National Salmonella andEscherichia centre, Central Research Institute,Kasauli, Himachal Pradesh.
Results and Discussion
The mean Coliform count, E.colicount, Total viable count, and Faecalstreptococcal count of the samples taken afterthe removal of head and feet (ARHF) and alsoafter evisceration (AE) are presented in the table.
The Coliform count of evisceratedcarcass in the present study was higher thanthat reported by Fluckey et al. (2003) who hadrecorded the count as 3.27 log 10cfu/ml.Coliform may be faecal or nonfaecal in origin.The high count on carcasses taken after
evisceration might be due to the contaminationof the carcasses from the intestinal contentsand cross contamination from the evisceratingtable. Coliform count is used as an index of the overall hygienic condition prevailing duringthe processing of food (Koenacki and Johnson2001).
Statistical analysis of variance of thedata revealed significant (P<0.05) differencebetween the mean E.coli count of samplestaken from the carcass ARHF and AE. The ECCof the carcasses taken ARHF was two log lowerthan that reported by Berrang et al. (2000).Thehigh count of the organism on the evisceratedcarcass might be attributed to thecontamination with intestinal content of chicken
since the organism is found in the intestinaltract of broiler chicken. (Vorster et al., 1994).The contamination of carcass might haveoccurred from contaminated water and thepersonal engaged in various dressing process.
The samples taken from ARHF had ahigher mean count (5.58 + 0.13 log10 cfu/ml)and was one log greater than that reported byBerrang et al. (2000) and Fluckey et al. (2003).However the count in the AE group of carcasswas 4.44 + 0.10 log 10 cfu/ml was also onelog greater than that reported by Fluckey etal.(2003). In the case of samples taken ARHF,only two percent had count at the level of 107
cfu/ml. The count of all the samples from bothgroups was within the limits recommended byICMSF (1986) (Gracey et al., 1999). Total viablecount is used as an index of sanitary quality inhandling of foods (Jay, 1978). The high countin the carcasses after the removable of headand feet (ARHF) is an indication of poorhygiene product followed during dressing.Reduction of the count in the carcass afterevisceration (AE) could be attributed tothorough washing and immersion in chilledwater.
All samples taken after the removalof head and feet and after evisceration hadfaecal streptococci, but the mean count of thesamples belonging to both groups did not differJ.
Vet
. Ani
m.S
ci.
2008
. 39
: 2
3-25
24 Bacteriological Quality of processed chicken...
RESEARCH ARTICLE
significantly. Faecal streptococci are normallypresent in mammal’s faeces and act asindicators of faecal contamination. (Brown andBaird -Parker, 1982). The high count of theorganism in eviscerated carcasses indicatespoor evisceration technique. Analysis ofvariance test revealed significant (P<0.05) and positive correlation between the mean TVCand FSC, CC and ECC, CC and FSC and ECCand FSC in samples taken from ARHF & AEsamples. However a negative non-significantassociation was observed between the meanTVC and CC and TVC and ECC.
Salmonella enteritidis was isolatedfrom 3 rinse samples of carcass obtainedARHF but none of the samples from theeviscerated carcasses revealed the presenceof the organism. The isolation of the serotypefrom raw chicken meat was reported byJerngklinchan et al. (1994), from importedpoultry meat by Telco et. al. (1998) and Duffyet al. (1999) and from retail earlier chickensamples by Chang (2000). As per Governmentof India standards for raw meat (chilled, frozen)Salmonella should be absent in all the fivesamples examined (Berrang et. al., 2000;Brown and Baird -Parker, 1982). According tothe food act, Government of Mauritius (1998)Salmonella should be absent in 25 g of rawmeat and poultry.
Table : Mean bacterial counts of samples
Sample CC ECC TVC FSC
No.of samples Step Mean + SE Mean + SE Mean + SE Mean + SE(log 10 cfu/ ml.) (log 10 cfu/ ml.) (log 10 cfu/ ml.) (log 10 cfu/ ml.)
30 ARHF 3.81 a + 0.09 x 0.89a + 0.23 x 5.88a +0.13 x 3.89 + 0.06
30 AE 3.92 + 0.12 x 2.15 + 0.24 x 4.44 + 0.10 x 3.91 + 0.07

References
[Anonymus]. 1968. Determination of faecalstreptococci in foods. NordicCommittee on Food Analysis 68.Universal Decimal Classification. 576,851, 21, Finland
[Anonymus]. 1973. Determination of numberof coliform bacteria in foods. NordicCommittee on Food Analysis 68.Universal Decimal Classification. 576,851, 48, Finland.
Barrow, C.J. and Feltham, R.K.A. 1993. Cowanand Steel’s manual for the identificationof medical bacteria 3rd ed. CambridgePress, London. 238 p.
Berrang, M.E., Dickens, J.A. and Musgrovet,M.T. 2000. Effects of hot waterapplication after defeathering on thelevels of campylobacter, coliformbacteria and Escherichia coli onbroiler carcasses. Poult. Sci.,79:1689-1693.
BIS [Bureau of Indian Standards]. 1980. SP:18.Handbook of food analysis. Part 1.General Methods. Indian standardsinstitution. Manak Bhavan, NewDelhi.FAO. 1985. FAOSTAT, FAOStatistics Division, Rome
Brown, M. H and Baird –Parker, A.C. 1982. Themicrobiological examination of meat.In: Brown, M.H. (Ed.) Meatmicrobiology. Applied sciencepublishers, England, pp. 423-520.
Chang Y. H. 2000. Prevalence of Salmonellaspp in poultry broilers and shell eggsin Korea. J.Fd. Prot., 63: 655-658.
Duffy, G., Cloak, O.M., O” Sullivan, M.G.,Gulleit, A., Sheridan, J.J., Blair, I.S.and Dowell, D.A. 1999. The incidenceand antibiotic resistance profiles ofSalmonella spp. on Irish retail meatproducts. Fd. Microbiol., 16: 623-631.
Fluckey, W.M., Sanchez, M.X., Mckec, S.R.,Smith, D.M., Pendleton, E. andBrashears, M.M. 2003. Establishmentof a microbiological profile for an airchilling poultry operation in the UnitedStates. J. Fd. Prot., 66 : 272-279.
Gracey, J., Collins, D.S. and Huey, R. 1999.Meat hygiene. 10th ed. W.B. SaundersCompany, London 758 p.
Jay, J.M. 1978. Modern food microbiology, 2nd ed.D. Van Nostrand company, NewYork,479 p.
Jerngklinchan, J., Koowatannaukul, C.,Darngprom, K. and Saitanu, K. 1994.Occurrence of Salmonellae in rawbroilers and their products inThailand. J. Fd. Prot., 57: 808-810.
Koenacki, J.L. and Johnson J.L. 2001.Enterobactericae, coliforms andEscherichia coli as quality and safetyindicators. In : Downes, F.P. and Ito,K.(Eds) Compendium of methods forthe microbiological examination offoods. 4th ed. American public healthassociation. Washington DC., pp. 69-82.
Rao, D. N., Nair, K.K.S and Sakhare, P.Z. 1998.Meat microbiology and spoilage intropical countries. In: Davies, A. andBoard, R (Eds.) The microbiology ofmeat and poultry . Blackie Academicand professional London, pp. 220-265.
Swanson K. M. J., Petran, R. L and Hanlin, J.H.2001. Culture methods forenumeration of microbiologicalexamination of foods. 4th ed.American Public Health Association,Washington, pp. 53-67.
Telco, A., Beli, E., Dbra, A. and Panariti, E.1998. Salmonella enteritidis importedpoultry meat in Albania Vet. Archiv.,68: 173-176.
Vorster, S. M., Greebe, R. P. and Nortje, G. L.1994. Incidence of staphylococcusaureus and Escherichia coli in groundbeef, broilers and broilers andprocessed meats in Pretoria, SouthAfrica J. Fd. Prot., 57: 305-310.
Zivkovic, J., Jaksic,S, and Miokovic, B. 1997.Salmonella serovars in chicken meat& chicken meat products. Zagreb,Croatia, Vet. Archiv., 67: 169-175
J. V
et. A
nim
.Sci
. 20
08.
39 :
23-
25
25Raji Rose Jacob et al.
RESEARCH ARTICLE
�

J. V
et. A
nim
.Sci
. 20
08.
39 :
26-
30
26
RESEARCH ARTICLE
CORRELATION BETWEEN SERUM STEROIDHORMONE PROFILES BEFORE, DURING ANDAFTER NORGESTOMET INDUCED OESTRUSAND OCCURENCE OF CONCEPTION INREPEAT BREEDER CROSSBRED COWS*
M. Selvaraju1, C. Veerapandian2,D. Kathiresan3 , K. Kulasekar4 andC. Chandrahasan5
Department of Animal Reproduction, Gynaecologyand ObstetricsMadras Veterinary College, Chennai- 600 007
Abstract
A total of 16 crossbred repeat breedercows were treated with norgestomet(Syncromate-B) ear implants for nine days. Atthe time of implant insertion, two ml of SMBinjection was adminisetred to all the cowsintramuscularly on day 10 of the oestrous cycleto induce oestrus. AI was done at 48 and 72 hafter implant removal. Pregnancy diagnosiswas done at 60 days following AI after inducedoestrus to assess the first service conceptionrate and it was found to be 43.75 per cent.Blood samples were collected from all the cowsat different stages following norgestomettreatment for oestradiol and progesteroneassays. The mean progesterone level (ng/ml)and oestrogen levels (pg/ml) at the time ofnatural oestrus, day of initiation of oestrusinduction treatment, implant removal and at firstAI and at second, fourth and sixth day followingfirst AI in cows which became pregnant (n=7)was 0.36±0.08, 7.19±0.46, 1.45±0.24,0.18±0.05,1.05±0.20, 1.70±0.22 and 3.37±0.77 and38.83±12.24, 11.33±3.54, 43.65±17.05,20.63±3.44, 10.37±6.07, 9.68±3.71 and14.28±4.77 respectively and thecorresponding values in cows which did notconceive (n=9) at induced oestrus were0.51±0.09, 5.24±0.43, 1.29±0.20, 0.23±0.03,0.57±0.15, 0.99±0.27 and 1.62±0.26 and15.13±5.14, 19.57±5.50, 25.86±13.54, 19.11±4.36,23.51±5.35, 24.39±6.60 and 20.40±6.41,
* Part of Ph.D thesis submitted by the first author to the Tamil Nadu Veterinary & Animal Sciences University, Chennai-51 1. Associate Professor & Head, Dept. of ARGO, VC & RI, Namakkal2. Professor and Head3. Director of Extension Education, TANUVAS4. Professor5. Dean, VC & RI, Namakkal
respectively. It is concluded that serumprogesterone and oestrogen levels at variousstages following syncromate –B therapyinfluenced the conception rate in repeatbreeder cows.
Key words: Norgestomet, Syncromate –B,Oestrus, Repeat breeder cows
Since serum progesteroneconcentration directly reflected the function ofcorpus luteum, it was considered as anindicator of ovarian function and hence, couldbe used as a marker to predict the responseto hormone treatment (Bulman andLamming,1978). Administration of exogenoushormones to induce oestrus might change theendocrine status of treated animals(Selvaraju,1997). Hence, estimation ofhormones before, during and after oestrusinduction treatment might be helpful inpredicting the nature of ovarian function andthus response to treatment. Roberts (1986)suggested that more investigations should bedone with regard to the progesterone levelsbefore, during and a few days after oestrus asa cause of the repeat breeder syndrome incattle. Randel et al. (1971) noted that repeatbreeder cows had altered serum estrogenlevels during the first nine days afterinsemination compared to normal cows. Basedon these views, the present investigation wasundertaken to study the relationship of serum
Serum steroid hormone profiles...

J. V
et. A
nim
.Sci
. 20
08.
39 :
26-
30
27M. Selvaraju et al.
RESEARCH ARTICLE
progesterone and oestrogen profiles before,during and after norgestomet induced oestrusand establishment of pregnancy in repeatbreeder crossbred cows.
Materials and Methods
Healthy, parous crossbred cowswhich failed to conceive after three or moreAIs were subjected to thorough gynaecolgicalexamination and cows free from any grosspalpable abnormalities and obvious infectionsof the genital tract were included in this study.A total of 16 crossbred repeat breeder cowswere used. Sexual rest was given during oneoestrus following selection. Norgestomet earimplants (Syncromate-B, SMB system, Sanofi,Animal Health Inc., U.S.A) containing 6 mg ofsynthetic progesterone (norgestomet) wereinserted aseptically and subcutaneously in themiddle third of the outer surface of the pinnaof the ear of all cows using an applicator onday 10 following natural oestrus. At the time ofear implant insertion, 2 ml of SMB injection(Sanofi, Animal Health Inc., U.S.A) containing5 mg oestradiol valerate and 3 mg norgestometwas administered intramuscularly to all thecows. AI was done at 48 and 72 h of implantremoval. Pregnancy diagnosis was done at 60days following AI at induced oestrus and firstservice conception rate was calculated(number of cows conceived divided by numberof cows treated and expressed in percentage).Blood samples were collected from all the cowsat natural oestrus, at the time of implantinsertion, implant removal, at the time of firstAI at induced oestrus and at second, fourthand sixth day following first AI for oestradioland progesterone assay. Serum was separatedby centrifuging the clotted blood at 3000 rpmfor 10 min. The serum samples were stored at-80°C for progesterone and oestradiol assay.Serum progesterone and oestradiol assayswere carried out using progesterone RIA kit(PROG- CTK – 4; DiaSorin, s.r.l. Saluggia (vc),Italy) and oestradiol RIA kit (ESTR- CTK–4;DiaSorin, s.r.l.Saluggia (vc), Italy) respectivelyby employing solid phase Radioimmunoassaytechnique. The radio activity was measured inI125 gamma counter. The mean serumprogesterone and oestradiol concentrations atdifferent stages following oestrus inductionwere correlated with the conception in repeatbreeder cows.
Results and Discussion
In the present investigation, cent percent oestrus response was obtained followingimplant removal. This was in agreement withthe findings of Odde (1990) in norgestomet and
oestradiol valerate treated cows. Theeffectiveness of norgestomet in this studymight be attributed to the combined effects ofprogestagen priming on the brain and the directeffect on the hypothalamus by bothexogenously administered oestrogen and thehigh concentration of oestrogen that occurredin association with use of norgestomet-oestradiol (Cavalieri and Fitzpatrick, 1995).Following norgestomet treatment, the firstservice conception rate obtained was 43.75 percent in this study. This was more or less similarto the conception rate obtained in cows in anearlier study with norgestomet (Hixon etal.,1981). Many investigators recorded that thefirst service conception rate ranged from 33 to68 per cent in norgestomet treated cows(Odde, 1990; Cavalieri and Fitzpatrick, 1995).However, a very low conception rate of 18.20per cent was also reported in norgestomettreated cows (Rentfrow et al., 1987).
The mean progesterone level (ng/ml)at the time of natural oestrus, day of initiationof oestrus induction treatment, implant removalat first AI and at second, fourth and sixth dayfollowing first AI in cows which becamepregnant (n=7) at induced oestrus was0.36±0.08, 7.19±0.46, 1.45±0.24, 0.18±0.05,1.05±0.20, 1.70±0.22 and 3.37±0.77respectively and the corresponding values incows which did not conceive (n=9) at inducedoestrus were 0.51±0.09, 5.24±0.43, 1.29±0.20,0.23±0.03, 0.57±0.15, 0.99±0.27 and1.62±0.26 respectively.
In this study, the level of progesteroneat natural oestrus and induced oestrus wasaround or less than 0.5ng/ml in cows whichconceived and in those which did not conceive.The level progesterone observed at natural andinduced oestrus in these cows was inaccordance with the finding of Agarwal et al.(1989) in repeat breeder cows. In the presentstudy, the marginal reduction in progesteronelevel was noticed in induced oestrus whencompared to natural oestrus both in cows whichbecame pregnant and in cows which did notconceive after AI at induced oestrus. Inaccordance with this finding, Gupta et al.(1998) found that the mean serumprogesterone level was lower on the day ofoestrus in cows which conceived (0.29 ng/ml)than in those which did not (0.32). Duchens etal. (1995) suggested that elevatedprogesterone level after luteolysis might leadto asynchrony between the onset of oestrusand ovulation and consequently a cause ofrepeat breeding in cattle. Similarly, Agarwal et

al. (1989) stated that 62 per cent of repeatbreeders had abnormal progesteronesecretory pattern during oestrus.
The higher concentration ofprogesterone observed on the day of oestrusinduction (day 10 of the previous cycle) inpregnant cows (7.19±0.46) compared to nonpregnant cows (5.24±0.43 ng/ml) was inaccordance with the finding of Breuel et al.(1989). Folman et al. (1973) reported that theprogesterone level during the oestrous cyclepreceeding insemination was closely relatedto the occurrence of conception. The level ofprogesterone (6.31±0.32) noticed at the timeof initiation of treatment in animals studied wassignificantly reduced to a lower level (1.38±0.16ng/ml) by the time of implant removal inpregnant and non-pregnant cows. Similar trendwas also noticed in previous studies innorgestomet treated cows (Garverick et al.,1988; Cavalieri and Fitzpatrick, 1995). Furthernone of the cows in this study exhibited oestrusduring the implant period. Norgestomet wasfound to have approximately 300 folds morebiological activity than natural progesterone inthe dairy cows (Barnes et al., 1981). This mightbe the reason for the effective control of oestrusduring the implant period in norgestomettreated cows in this experiment.
In the present study, both naturaloestrus and induced oestrus in pregnant cowsshowed marginally lower progesterone profilewhen compared to non-pregnant cows. Thiswas in agreement with the finding ofGustafsson et al.(1986). Higher progesteronelevel at the time of oestrus might affect spermand ovum transport as well as the fertilizationprocess and subsequent embryo passage tothe uterus (De Silva et al.,1981). Anderson andDay (1994) opined that increased progesteronelevel blocked the LH release and affectedoocyte maturation and ovulation. Further,Duchens et al. (1995) stated that suprabasalprogesterone level delayed the ovulation andlead to retention of Graafian follicle for anextended period and damage of the oocyte tosuch an extent that even inseminating closeto the time of ovulation did not ensureconception. Thus the marginally higherconcentration of progesterone at natural andinduced oestrus recorded in non-pregnantcows might have been one of the contributingfactors for the failure of conception in this study.
In the present investigation, from day2 to 6 post AI, the concentration ofprogesterone was higher in pregnant cows
than in non-pregnant cows. Further, thedifference was statistically significant (P<0.01)on day 6 after AI. This was in agreement withthe finding of other study on repeat breedercows (Bugalia and Sharma, 1990). Manyinvestigators studied the progesteroneconcentrations in pregnant and non-pergnantcows to determine whether these affected thefertility. Duchens et al. (1995) found a higherplasma progesterone concentration inpregnant cows between day 10 and 18 than innon-pregnant females. Peters (1996)suggested that progesterone secretion couldbe a limiting factor to embryonic developmentduring the first few days of pregnancy inbovines. The more rapid increase inprogesterone level from day 2 to 6 postinsemination in pregnant cows compared tonon-pregnant cows in this study indicated ahigher level of luteal activity which might haveresulted in conception.
In this experiment, the mean serumoestradiol levels (pg/ml) at the time of naturaloestrus, day of initiation of treatment (day 10of previous oestrous cycle), implant withdrawal,day of first AI and at second, fourth and sixthday after first AI were 38.83±12.24, 11.33±3.54,43.65±17.05, 20.63±3.44, 10.37±6.07,9.68±3.71 and 14.28±4.77 in pregnant cowsand 15.13±5.14, 19.57±5.50, 25.86±13.54,19.11±4.36, 23.51±5.35, 24.39±6.60 and20.40±6.41 in non-pregnant cows, respectively.The mean levels of oestradiol recorded in thisstudy at natural oestrus in cows whichconceived (38.83 ±12.24) and those did notconceive (15.13 ±5.14 pg/ml) was inaccordance with the levels reported by Coe andAllrich (1989). However, a lower serumoestradiol level (8 to 10 pg/ml) at naturaloestrus was reported in repeat breeder cows(Gupta et al., 1998). The levels of serumoestradiol measured at induced oestrus in thisstudy in pregnant and non-pregnant cows(20.63±3.44 and 19.11±4.36 pg/ml,respectively) were in concurrence with thereported value of Bugalia and Sharma (1990)in repeat breeder cows. Maurer andEchternkamp (1985) reported a loweroestradiol concentration (8 to 10 pg/ml) inrepeat breeder cows.
In the present study, the levels ofoestradiol on day 2, 4 and 6 after AI were lowerin cows which conceived than in those that hadnot conceived. Similar finding was made byLukaszewska and Hansel (1980). However,Agarwal et al. (1989) found significantly higheroestradiol levels in cows which conceived toJ.
Vet
. Ani
m.S
ci.
2008
. 39
: 2
6-30
28
RESEARCH ARTICLE
Serum steroid hormone profiles...

service than those cases reported again.Further, Maurer and Echternkamp (1985)compared the oestrogen levels betweencontrol and repeat breeder cows duringoestrous cycle and found that repeat breedercows had lower oestrogen profile whencompared to control. There was no significant(P>0.05) difference in the oestradiol levelsbetween cows which became pregnant andthose which did not conceive at the inducedheat on all the days measured in this study.This study might be attributed to variations ofthe individual cows in the secretory pattern ofoestradiol during oestrus induction and theensuing period.
Hence, from this study it is concludedthat lower level of serum progesterone duringnatural, induced oestrus and implant removaland higher level of progesterone on the day ofoestrus induction, and elevated levels ofprogesterone during early luteal phaseensured conception in repeat breeder cows.Further, increased concentration of serumoestrogen during natural oestrus, inducedoestrus and implant removal and lowerconcentrations on day 10 of the preceedingcycle and during early luteal phase determinedconception in repeat breeder cows.
References
Agarwal, V.K., Sani, M.S. and Agarwal, S.P.1989. Serum oestrogen andprogesterone levels in repeatbreeding cows. Indian J. Dairy Sci.,42: 373-374.
Anderson, L.H. and Day, M.L. 1994. Acuteprogesterone administrationregresses persistent dominantfollicles and improves fertility of cattlein which oestrus was synchronizedwith melengesterol acetate. J. Anim.Sci., 72: 2955-2961.
Barnes, M.A., Kazmer, G.W and Bierley, S.T.1981. Gonadotropic and ovarianhormone response in dairy cowstreated with norgestomet andestradiol valetrate. Theriogenology,16: 15-25.
Breuel, K.F. Spitzer, J.C. and D.M. Henricks,1989. Systemic progesteroneconcentration following humanChorionic Gonadotrophinadministration at various times inheifers. J. Anim. Sci., 67:1564-1572.
Bugalia, N.S and Sharma, R.D. 1990.Variations in serum progesteroneprofiles in fertile and repeat breederBuffaloes (Bubalus bubalis) duringlate oestrus. Indian J. Anim. Reprod.,11: 140-141.
Bulman, D.C. and Lamming, G.E. 1978. Milkprogesterone levels in relation toconception in repeat breeding andfactors influencing acyclicity in dairycows. J. Reprod. Fert., 54: 447-458.
Cavalieri, J. and Fitzpatrick, L.A. 1995. Oestrusdetection techniques andinsemination strategies in Bosindicus heifers synchronized withnorgestomet- estradiol. Aust. Vet. J.,72: 177-182.
Coe, B.L. and Allrich, R.D. 1989. Relationshipbetween endogenous oestradiol-17âand oestrous behavior in heifers. J.Anim. Sci., 67: 1546-1551.
De Silva, A.W., Anderson, G.W.,Gwazdauskas,F.C., McGilliard, M.L.and Lineweaver, J.A. 1981.Interrelationship with oestrousbehaviour and conception in dairycattle. J. Dairy. Sci., 64:2409-2418.
Duchens, M., Maciel, M. Gustafsson, H.,Forsberg, M.,Rodriguez-Martinez, H.and Edquist, L.E. 1995. Influence ofperioestrous suprabasalprogesterone levels on cycle length,oestrous behaviour and ovulation inheifers. Anim. Reprod. Sci., 37: 95-108.
Folman,Y., Rosenberg, M., Herz, Z. andDavidson, M. 1973. The relationshipbetween plasma progesteroneconcentration and conception in postpartum dairy cows.maintained on 2levels of nutrition. J. Reprod. Fert., 34:267-278.
Garverick, H.A., Parfet, J.R., Lee, C.N.,Copelin, J.P., Youngquist, R.S. andSmith, M.F. 1988. Relationship of preand post-ovulatory gonadotropin J.
Vet
. Ani
m.S
ci.
2008
. 39
: 2
6-30
29M. Selvaraju et al.
RESEARCH ARTICLE

�
J. V
et. A
nim
.Sci
. 20
08.
39 :
26-3
0
30
RESEARCH ARTICLE
concentrations to subnormal lutealfunction in postpartum beef cattle. J.Anim. Sci., 66: 104-111.
Gupta, J., Dabas, Y.P.S., Lakhchanra, B.D. andMaurya, S.A. 1998. Estradiol-17â andprogesterone profile in repeatbreeding cattle. Indian J. Anim.Reprod., 19: 126-128.
Gustafsson, H., Larson, K., Kindahl, K. andMadej, A. 1986. Sequential endocrinechanges and behaviour duringoestrus and metoestrus in repeatbreeder and virgin heifers. Anim.Reprod. Sci., 10:261-273.
Hixon, D.L., Kesler, D.J., Trroxel, T.R., Vincent,D.L. and Wiseman, B.S. 1981.Reproductive hormone secretionsand first service conception ratesubsequent to ovulation control withsynchromate B. Theriogenology, 16:219-229.
Lukaszewska, J. and Hansel, W. 1980. Corpusluteum maintenance during earlypregnancy in the cows. J. Reprod.Fert., 59: 485-493.
Maurer, R.R. and Echternkamp, S.E. 1985.Repeat breeder females in beefcattle. Influences and causes. J.Anim. Sci., 61: 624-636.
Odde, K.G.1990. A review on synchronizationof oestrus in post partum cattle. J.Anim. Sci, 68: 817-830.
Peters, A.R. 1996. Embryo mortality in thecows. Anim. Br. Abstr., 64: 587-598
Randel, R.D., Garverick, A.H., Surve, A.H., Erb,R.E. and Callahan, C.J. 1971.Reproductive steroids in the bovine.V. Comparisons of fertile and non-fertile cows. J. Anim. Sci., 33: 104-114.
Rentfrow, L.R., Randel, R.D. and D.A.Newendroff. 1987. Effect of estrussynchronization with synchromate-Bon serum luteinizing hormone,progesterone and conception rate inBrahman heifers. Theriogenology, 28:355-362.
Roberts, S.J. 1971. Veterinary Obstetrics andGenital diseases, 2nd ed. CBSPublishers and distributors, NewDelhi. 283 p.
Selvaraju, S. 1997. Effect of GnRH and eCGon oestrous response and fertility innorgestomet primed post partumanoestrus cows. M.V.Sc. thesis.Tamilnadu Veterinary AnimalSciences University, Chennai-51.
Serum steroid hormone profiles...

EFFECT OF DIFFERENT HOUSING SYSTEMSON THE SERUM IRON AND HAEMOGLOBINCONTENT IN LARGE WHITE YORKSHIRE PIGS *
M. Pushpalatha¹, Ra. Murallidharan2,P. Tensingh Gnanaraj3, R. Kumararaj4
and M. Murugan5
Department of Livestock Production and ManagementMadras Veterinary College, Chennai-600 007
Abstract
A study was conducted at LivestockResearch Station, Kattupakkam to assess theeffect of different housing systems viz.,intensive, semi-intensive and extensivesystems on the serum iron and haemoglobincontent in Large White Yorkshire pigs. The pigsreared under extensive system and semi-intensive system had significantly (P<0.05)higher serum iron and hemoglobin content(P<0.01) than those reared under intensivesystem. The results revealed that the extensiveand semi-intensive system of housing of pigshad an influence on serum iron andhaemoglobin content due to exposure of pigsto rooting in the soil.
Key words: Housing System, serum iron,haemoglobin, LWY pigs
Farmers are not fully aware of theinfluence of pig housing on economic returnsfrom a piggery unit. A growing interest hasbeen shown in alternative pig productionsystems because of the low capital cost ofoutdoor rearing. The outdoor reared pigs hada higher average daily gain than the indoorreared pigs (Gentry et al.,2002) and moreoverpigs maintained under extensive systemacquire iron from the soil by their rootingbehaviour. This will help preventing pigletmortality due to piglet anemia. On the otherhand, intensively reared pigs are prone todeficiency of iron and other essential minerals
*Part of M.V.Sc. thesis submitted by first author to the Tamil Nadu Veterinary and Animal Sciences University, Chennai-511. P. G Scholar2. Professor (Retd.)3. Associate Professor4. Professor and Head (Retd.)5. Associate Professor , LRS, Kattupakkam
which are found in the soil. This iscompensated by supplementation, eitherthrough feed or in the form of injection.However, the impact of rearing systems on theiron level in serum is not documented for theclimatic region under study. This paper throwslight on the effect of different housing systemson the serum iron and haemoglobin levels inLarge White Yorkshire (LWY) pigs.
Materials and Methods
Twenty-four weaned LWY pigletsaged 56 days were randomly selected basedon body weight and divided into threetreatment groups of eight piglets each. Themale piglets were castrated after selection. Thefirst group was reared under intensive systemof housing with concrete floor, the secondgroup was reared under semi-intensive systemof housing with concrete floor and the thirdgroup was reared under Extensive system withmud floor. Animals in all the three groups weregiven a floor space of 10 sq. ft per piglet asper the ICAR standards. All the three treatmentgroups were provided a standard grower pigfeed in the form of dry mash with 18 per centcrude protein and the ration contained acalculated level of 2640 kcal digestible energy.Serum samples were collected at the time ofslaughter for the estimation of haemoglobinand iron using standard procedures by AtomicAbsorption Spectroscopy (Perkin –Elmer,1994) and the collected data were statisticallyanalysed (Snedecor and Cochran, 1994).
J. V
et. A
nim
.Sci
. 20
08.
39 :
31-
32
31M. Pushpalatha et al.
RESEARCH ARTICLE

Results and Discussion
As furnished in the table, it wasobserved that the pigs reared under semi-intensive (1.99 ± 0.19 ppm) and extensive(2.03 ± 0.16 ppm) housing systems hadsignificantly higher (P<0.05) levels of iron thanthose reared under intensive housing system(1.36 ± 0.14 ppm). The extensively (12.08 ±0.46 g/dl) and semi-intensively reared pigs(11.09 ± 0.18 g/dl) had significantly higherhaemoglobin level (P<0.01) as compared to
Table. Mean ± SE of serum iron and haemoglobin content in Large White Yorkshirepigs reared under different housing systems
*- Significant at five per cent level ( P<0.05)**- Significant at one per cent level (P<0.01) Values bearing different superscript in a column differ significantly.
intensive housing system (10.74 ± 0.46). Theeffect of rearing systems on the serum iron andhaemoglobin content could be due to the freeaccess of pigs to soil, plants, bedding andfaeces. The indoor reared pigs had limitedaccess to faeces and no access at all to soil(Kleinbeck and McGlone, 1999). It was alsoestablished that supplemental iron was notnecessary for pigs reared outdoors as pointedout by Kleinbeck and McGlone (1999).
References
Gentry, G.J., McGlone, J.J., Blanton, Jr. J.R.and Miller, M.F. 2002. Alternativehousing systems for pigs: Influenceson growth, composition and porkquality. J. Anim. Sci., 80: 1781-1790.
Kleinbeck, S.N and McGlone, J.J. 1999.Intensive indoor versus outdoorproduction sytems : Genotype and
Housing systems Haemoglobin (g/dl) Iron (ppm)
Intensive system 10.74 b ± 0.46 1.36 b ± 0.14
Semi-intensive system 11.09ª ± 0.18 1.99ª ± 0.19
Extensive system 12.08ª ± 0.46 2.03ª ± 0.16
‘F’ value 6.765** 5.41*
supplemental iron effects on bloodhemoglobin and selected immunemeasures in young pigs. J. Anim. Sci.,77: 2384-2390.
Snedecor, G.W and Cochran,W.G. 1994.Statistical methods. 8th ed. Iowa StateUniversity Press, Ames, Iowa. 313 p.
�
J. V
et. A
nim
.Sci
. 20
08.
39 :
31-
32
32 Effect of different housing systems...
RESEARCH ARTICLE

MICROANATOMICAL STUDIES ON THEMODERATOR BAND (TRABECULA SEPTOMARGINALIS) OF HORSES (EQUUS CABALLUS)
O.R. Sathyamoorthy1 andGeetha Ramesh2
Department of Veterinary Anatomy and HistologyMadras Veterinary College, Chennai - 600 007
Abstract
The moderator bands from six adulthorses over two years of age were utilised forhistological studies. The moderator band(trabecula septomarginalis) was composed ofan outer thick endocardial covering, Purkinjefibres, ordinary myocardial fibres, bloodvessels and nerves. The endocardium wasthick and consisted of an endothelial coveringand an underlying connective tissue ofcollagen, elastic and a few reticular fibres. ThePurkinje fibres were large, irregular cells withcentrally placed nuclei. It was present eitherin the myocardium or in the subendocardium.The myocardial fibers were striated and had acentrally placed nuclei. The intercalated diskswere noticed in both myocardial fibers andPurkinje fibres. Blood vessels of various sizesand nerve fibres were also noticed.
Key words : Moderator band, Purkinje fibres,Myocardial fibres
The moderator band (trabeculaseptomarginalis) is considered to prevent overdistention of the ventricles (Sisson andGrossman, 1961). The artery of the moderatorband can play a key role in collateral circulationfollowing the obstruction of the epicardialcoronary arteries (Reig et al., 2000) in humanheart. The right bundle branch of theconducting system of the heart passes downin the interventricular septum and continuesby way of the moderator band to the base ofthe anterior papillary muscle. From here
1. Associate Professor2. Professor and Head
branches are issued to the subendocardialplexus of Purkinje fibres and pass to the conusarteriosus to the free wall of the ventricle andto the septum (Yoshida et al., 1991). In horses,the moderator band is an important structureto prevent over distension and also for itsvascular and conduction elements as well. Theliterature available on the histological structureof moderator band in horses is scanty andhence the present study was undertaken.
Materials and Methods
The moderator bands from six adulthorses over two years of age were collectedfrom the postmortem room of the Departmentof Veterinary Pathology, Madras VeterinaryCollege, Chennai. The tissues were fixed inbuffered formalin and Bouin’s fluid and furtherprocessed for histological sectioning andstaining.
Results and Discussion
The moderator bands of horseconsisted of a thick outer endocardial covering,Purkinje fibres, ordinary myocardial fibres,blood vessels and nerve fibres (Fig. 1) asnoticed by Prasad and Sinha (1979) inbuffaloes and Fawcett (1994) in bovines.
The endocardium was thick andconsisted of an outer endothelial layer situatedover a fibro-elastic membrane, as observed byBone (1982) and Dellmann and Eurell (1998)in animals and Bardosi et al. (1990) in humanhearts. Below the endothelium a thick layer ofsubendothelium composed of collagen, elastic
J. V
et. A
nim
.Sci
. 20
08.
39 :
33-
35
33O.R. Sathyamoorthy and Geetha Ramesh
RESEARCH ARTICLE
Fig. 1. Moderator band of a two year-old horse showingcollagen fibres of the endocardium. Van Geisons x 125A. Endocardium B. Sub endocardial Purkinje fibresC. Myocardium.
and a few reticular fibres were noticed. It iscontrary to the findings observed by Prasadand Sinha (1979) in buffaloes, where thesubendothelial connective tissue was greatlyreduced.
The inner layer of connective tissueor the subendothelial layer was dense andthick. The outer layer or the subendocardiallayer was thin at some places and thick at otherplaces. The subendocardial connective tissuelayer was loose and consisted of blood vesselsand Purkinje fibers at some places. This is inagreement with the findings of Ham (1979) inhuman beings and Dellmann and Eurell (1998)in animals. As observed by Dellmann andEurell (1998) in animals, the connective tissuefibres of the endocardium was continuous withthat of the myocardium.
The Purkinje fibres were largeirregular cells present either in the middle ofthe moderator band as in buffaloes (Prasadand Sinha, 1979) or within the myocardium(Fig. 2) or in the subendocardium (Fig. 1) asobserved by Ansari et al. 1999. The
sarcolemma of the Purkinje fibres was thickerthan the ordinary myocardial fibres as spottedby Prasad and Sinha (1979) in buffaloes.
The Purkinje fibres were seen mostlyin groups. They were all surrounded by a thickconnective tissue network or capsule whichconsisted of blood vessels. But theconnective tissue was not noticed in betweenthe individual Purkinje fibres within a group(Fig. 2) as observed by Ansari et al. (1999) insheep heart, and Muir (1965) in human heart.The myofibrils of the Purkinje fibres weredispersed around the periphery with avacuolated appearance in the centre of thecell (Fig. 3) as observed by Ham (1979) inhuman beings. The nuclei of the Purkinjefibres were round to oval and centrally placed,surrounded by a vacuolated surface. This isin agreement with the findings of Ham (1979)who recorded that the vacuolated space wasoccupied by the glycogen.
The ordinary myocardial cells weresmaller than the Purkinje fibres (Fig. 2). Theyshowed striations and had a centrally placed
J. V
et. A
nim
.Sci
. 20
08.
39 :
33-
35
34 Moderator band (trabecula septo marginalis) of horses...
RESEARCH ARTICLE
Fig. 2. Moderator band of a three year-old horse showingPurkinje fibres and myocardium. H & E X 250A. Purkinje fibres B. Capsule around the Purkinje fibres C.Myocardium.
Fig. 3. Moderator band of a three year-old horse showingthree sarcolemmal portions of Purkinje fibres. H & E X 500 A. Intercalated disk sarcolemma B. Internal sarcolemmaC. External sarcolemma
Fig. 4. Moderator band of a four year-old horse showingmyocardium. H & E x 250A. Myocardium B. Blood vessels

round or oval nuclei. The intercalated diskswere also noticed comparable to theobservations of Fawcett (1994) in humanbeings. Individual cardiac muscle fibres weresurrounded by highly vascular connectivetissue network similar to the endomysium asobserved by Craigmyle (1986) in humanbeings. Copenhaver (1964) recorded that inhuman heart, between the bundles of musclefibres, there were coarser collagenous fibresand elastic fibres.
In the present study cardiac musclefibres were divided into bundles in the centreof the moderator band. But below theendocardium the muscles fibres were tightlypacked without any fascicular arrangement.
J. V
et. A
nim
.Sci
. 20
08.
39 :
33-
35
35O.R. Sathyamoorthy and Geetha Ramesh
RESEARCH ARTICLE
�
Nunez - Duran (1981) noticed that thearrangement of Purkinje fibres made it possibleto distinguish three sarcolemmal portions ineach cell. The intercalated disk, the internalsarcolemma and the external or surfacesarcolemma is in direct contact with theconnective tissue. Same observations weremade in the present study also. (Fig.3).
The blood vessels of different sizesand nerve fibres were noticed either in betweenthe myocardium or in the connective tissuesepta of the moderator band (Fig. 4) asobserved by Prasad and Sinha (1979) inbuffaloes.
References
Ansari, A., Ho, S.Y. and Anderson, R.H. 1999.Distribution of Purkinje fibres in thesheep heart. Anat. Rec., 254: 92-97.
Bardosi, A., Bardosi, L., Hendrys, M., Wosgien,B. and Gabius, H.J. 1990. Spatialdifferences of endogenous lectinexpression within the cellularorganization of the human heart: Aglycohistochemical, immunohistochemical and glycobiochemicalstudy. Am. J. Anat., 188: 409-418.
Bone, J.F. 1982. Animal Anatomy andPhysiology, 2nd ed., RestonPublishing Company Inc., A Prentice- Hall Company, Virginia. pp. 45-70.
Copenhaver, W.M. 1964. Baileys Textbook ofHistology, 15th ed., The Williams andWilkins company, Baltimore. pp. 252-281.
Craigmyle, M.B.L. 1986. A Colour Atlas ofHistology, 2nd ed., Wolfe MedicalPublications Ltd., London. pp. 28-35.
Dellmann, H.D. and Eurell, J.A. 1998. Textbookof Veterinary Histology, 5th ed.,Williams and Wilkins, A Waverly Co.,Baltimore. pp. 114-127.
Fawcett, D.W. 1994. A Textbook of Histology,12th ed. Chapman and Hall, New York,London. pp. 368-406.
Ham, A.W. 1979. Histology, 5th ed., PitmanMedical Publishing Co. Ltd., London.pp.476-501.
Muir, A.R. 1965. Further observations on thecellular structure of cardiac muscle.J. Anat., 99: 27-46.
Nunez - Duran, H. 1981. Electronmicroscopicstudy of the sarcolemma of Purkinjecells of the goat heart. Acta Anat.,109: 19-24.
Prasad, J. and Sinha, R.D. 1979. Note onhistological and histochemical studieson the right moderator band of Indianbuffalo (Bubalus bubalis). Indian J.Anim. Sci., 49: 1093-1096.
Reig, J., Alberti, N. and Petit, M. 2000. Arterialvascularization of the humanmoderator band: An analysis of thisstructure’s role as a collateralcirculation route. Clin. Anat., 13: 244-250.
Sisson, S. and Grossman, J.D. 1961. TheAnatomy of the Domestic Animals, 4th
ed., Asia Publishing House, NewDelhi.
Yoshida, A., Moritomo, Y. and Murakami, T.1991. Branching of the right limb ofthe atrioventricular conducting systemin ventricular system of cattle andswine. Bull. Agri., Miyazaki Univ., 38:119-124.

AWARENESS AND NEEDS OF PIG FARMERSIN KERALA
A. Kannan1, Francis Xavier2, T. V. Raja3
and M. Murugan4
Department of Livestock Production and ManagementCollege of Veterinary and Animal SciencesMannuthy-680 651, Thrissur, Kerala
Abstract
A survey study was conducted toevaluate the awareness of pig farmers onscientific pig rearing and management. A well-designed questionnaire and personal interviewwas used for collecting the information. Theresults revealed that the farmers knew aboutdeworming, iron injection, sanitation, wastedisposal and castration but lacked awarenesson vaccination and ectoparasite control. Apartfrom pig farming, farmers were interested inintegrated farming, biogas production,expansion of farm and management throughcooperative societies’ assistance. Digestivedisorder was found to be the major problem inpig farming and piglet mortality was mainly dueto ‘Mastitis Metritis Agalactia’ (MMA) of thedam, scours, crushing and nutritionaldeficiency. The prime concern of farmersregarding training was on breedingmanagement rather than on health, feedingand meat processing. The constraints in pigproduction systems were lack of financialsupport followed by the unavailability of stockand social risk factor.
Key words: Pig farming, awareness, training,constraints
Pig farming is a profitable livestockenterprise in Kerala because of food habits andabundant sources of swill. Among the differentlivestock, pigs are most prolific and contribute
1. Associate Professor2. Professor ( Farms), KVASU3. Assistant Professor (SS), Dept. of Animal Genetics and Breeding, CVAS, Pookode, Wayanad4. Associate Professor, LRS, Kattupakkam
significantly to the economic development andfood security. Majority of the pig farmers followunconventional feeding consisting of organicwastes of animal and plant origin. Though thispractice is found cost effective, farmers facemany problems like incidence of diseases,lowered performance of dam and nutritionaldeficiency. The potential pig farming can beexploited by creating awareness amongfarmers on scientific pig rearing andmanagement, which will ultimately providegainful income and nutritional security to thesociety. Hence this survey was conducted tostudy the awareness of pig farming andproblems faced by the farmers in rural areasof Kerala state.
Materials and Methods
A survey work was conducted to studythe impact of scientific management practicesand health problems encountered in pig rearingin different agroclimatic zones of Kerala.Stratified random sampling method wasemployed to select 200 farmers from fivedifferent agroclimatic zones viz., South,Central, North, High range and Coastal zones.A well-designed questionnaire and personalinterview supplemented the survey. Thescientific management viz., deworming,vaccination, iron injection, sanitation, controlof ectoparasites, waste disposal, castration,health problems, training requirement,interested activities and constraints in pigrearing were evaluated.
J. V
et. A
nim
.Sci
. 20
08.
39 :
36-
39
36 Needs of pig farmers...
RESEARCH ARTICLE

Results and Discussion
Scientific Management Practices
The study on scientific managementpractices adapted by the pig farmers showedthat they lacked awareness (Table 1) invaccination and control of ectoparasites. Butdeworming, iron injection, sanitation, wastedisposal and castration were scientificallyfollowed in higher proportion among therespondents. This was in close agreement withthe results of Harikumar (2001). These resultsreflect that the scientific practices viz.deworming, iron injection, sanitation, wastedisposal and castration were seriouslyattended to, than the preventive measures likevaccination and spraying of ectoparasiticide.This might be due to the awareness of pigfarmers on the importance of hygiene oneconomic production. Moreover, pigs weremainly reared as fatteners and were disposedat eight to ten months of age, hence thefarmers were least bothered about thepreventive measures.
Apart from the pig farming, farmersshowed interest on allied activities likeintegrated farming, biogas production,expansion of farm and management throughcooperative societies’ assistance. As early asin 1977, FAO recommended that integrationof livestock and fish raising with cropproduction should be revitalised and reorientedto meet the changing needs of small farmersin Asia. Santhakumar (2000), reported thatintegrated farming in India was proved to beefficient by adopting simple and easy
technology involving meagre input. The mainpurpose of integrated farming approach wasto enhance the income and to recycle theresources for pig production.
Health Management Practices
The health management practices ofpig farmers in different agroclimatic zones(Table 2), revealed that digestive disorder wasthe major problem in pigs. Piglet mortality wasmainly due to ‘Mastitis Metritis Agalactia’ (MMA)of the dam, scour, crushing and nutritionaldeficiency. The findings of the study were inagreement with the reports of Srinongkote etal. (1992), Wagner and Polly (1997) and Duruet al. (1999). The digestive disorders could beattributed to the poor quality of the swill at thetime of feeding. The skin and respiratoryproblems of pigs encountered in this studycould be due to unhygienic practices. Inaddition, the deficiency diseases might be dueto the unbalanced nutrients of the swill feed.Sixty to eighty per cent of the farmers soughtveterinary help for treatment and this reflectsthe literacy and awareness of the farmers withrespect to health management practices.
Training Requirements
The training requirements of pigfarmers (Table 3) showed that they requiredtraining on breeding management rather thanon health, feeding and meat processing. Agwu(1999) also indicated that the poor know-howon breeding and management was one of themajor problems associated with pig production.The demand for quality piglets, its impact on
J. V
et. A
nim
.Sci
. 20
08.
39 :
36-
39
37A. Kannan et al.
RESEARCH ARTICLE
Table 1. Scientific management practices adapted by pig farmers
(values in percentage)

Table 2. Health management practices followed by pig farmers
(values in percentage)
Table 3. Training requirements of pig farmers
(values in percentage)
Table 4. Constraints of pig farmers
(values in percentage)
the production performance and the profitthrough sale of piglet as a breeding stock,indicate the need for such training to pigfarmers of Kerala.
Constraints
The study on the constraints (Table4) in pig production systems showed that lackof financial support was the major constraint(56 to 68 %) followed by the unavailability ofstock (18 to 29 %) and social risk factor (14 to17 %). This was in accordance with thefindings of Harikumar (2001) who reported thatthe constraints of the pig farmers were
financial, social and shortage in theavailability of piglets. Duru et al. (1999) alsoreported that lack of capital investment wasone among the major constraints in pigproduction. Since most of the pig farmerswere marginal farmers they could not affordhigher capital investment on pig rearing. Theneed for construction of pig pens, warrantsfinancial support from external sources. Theunavailability of stock and social factor wereless important constraints in Kerala, probablydue to adequate supply of quality piglets fromprivate/ organised sectors and due to highproportion of pork consumers respectively.
J. V
et. A
nim
.Sci
. 20
08.
39 :
36-
39
38 Needs of pig farmers...
RESEARCH ARTICLE

J. V
et. A
nim
.Sci
. 20
08.
39 :
36-
39
39A. Kannan et al.
RESEARCH ARTICLE
References
Agwu, A. F. 1999. Intra-household task rolesin pig production in Udi Governmentarea, Enugu state. J. Agri. Technol.Edu., 4: 5-11
Duru, S., Akpa, G.N., Omage, J.J., Olugbemi,T.S., Jokthan, G.E. and Balogun, T.F.1999. Production characteristics ofpig holdings under peri-urban settingsof Zaria Northern Nigeria. Indian J.Anim. Sci., 69: 628-630
FAO. 1977. China: Recycling or organic wastesin agriculture. Report of the FAOStudy Tour to the People’s Republicof China, 28 April-24 May 1977.
Harikumar, S. 2001. Productivity and Feasibilityof pig production systems in rural sector
M.V.Sc. Thesis. Kerala AgriculturalUniversity, Thrissur, 114 p.
Santhakumar, R. 2000. Integrated fish farmingsystems. Pashudhan, 15: 1-8
Srinongkote, T., Onishi, S.N. and Kamura, I.1992. Effect of peptidoglycansupplementation to lactating sow feedand to creep feed on performance ofsculling piglets. In: Proc. AAAP V-II:123 p.
Wagner, B. and Polley, L. 1997. Anthelminticuse on Saskatchewan pig farms:results from a postal survey. Vet.Parasitol., 73: 299-307
�

HISTOLOGY AND AGE RELATED INVOLUTARYCHANGES OF THE THYMUS OF GIRIRAJABIRDS (Gallus domesticus ) *
C. Leena1, R.V. Prasad2, K. Kakade3
and K.V. Jamuna4
Department of Veterinary Anatomy and HistologyVeterinary College, Hebbal, Bangalore
Abstract
Erythrocytes were maximum posthatch. Thymic nurse cells, myoid cells (roundforms) were seen more during involution.Regression started at 8 weeks, butrecrudescence was seen at 14 weeks.hjkLamellated Hassel’s corpuscles andmetaplasia of reticuloepithelial cells werecommon features of involuting thymus.Intracellular cysts and apoptotic changes wererecorded.
Key words: involution, giriraja, thymus,histology.
The thymus gland in the fowl consistsof three to eight irregular shaped lobes, palepink in colour, situated on either side of theneck, close to the jugular vein (King andMcLelland,1983). It is a primary lymphoidorgan where T cells differentiate and participatein cell mediated immune response. Literatureavailable on age related changes of the thymusof Giriraja birds are sparse. Hence the presentstudy was envisaged.
Materials and Methods
A total of 72 birds were rearedseparately at the U.A.S. poultry farm,Bangalore from day old to 24 weeks and thethymus was collected from six birds each every
*Part of M.V.Sc. thesis submitted by the first author to U.A.S., Bangalore1. Assistant Professor, CVAS, Pookode, Wayanad2. Professor and Head3. Professor (Retd.)4. Professor
alternate week. Tissue pieces were fixed in10% neutral buffered formalin, Bouin’s fluid,lymphatic tissue fixative and Zenker’s aceticfluid. The tissues were processed by paraffinembedding and cut at 4 mm thickness. Theywere stained by Hematoxylin and Eosin, VanGeison’s stain for collagen fibres, Masson’sTrichrome method, method for reticulin(Kiernan, 1981), Weigert’s elastic stain andMethyl green Pyronin method for thedemonstration of DNA and RNA (Kiernan,1981).
Results and Discussion
The thymus of the perinate birdscontained many immature erythrocytes. Themacrophage activity at day old stage wasmaximum (Fig. 1) which may be due to theselection process (Ross et al., 1998).
The thymus of day old birdscomprised of pyramidal or polygonal lobules.Its cortex consisted of densely packed smalland medium sized lymphocytes making it toappear deeply basophilic. Division of thecortex and medulla started at first week andwas distinct by the third week of age. Duringthe first week the cortex contained huge paleeosinophilic structures containing more thanone lymphocyte frequently undergoing mitoticdivisions. By fifth week a basophilic cortex andan eosinophilic medulla were clear.
J. V
et. A
nim
.Sci
. 20
08.
39 :
40-
43
40 Thymus of giriraja birds...
RESEARCH ARTICLE

Heterophils were numerous in the peripheralcortical area. Similar observations were madeby King and McLelland (1983) in fowl.
The mitotic index of the cortex washigh in the first four weeks and then decreased,however at 16 weeks the index increased againwhich may be due to the effect of prolactinhaving a mitogenic effect associated withbreeding cycles (Ibars et al., 1997).
By third week many lobulespossessed a common medulla and by the endof the sixth week, the medulla was found toopen into the interlobular connective tissue.The blood vessels appeared from the fourthweek onwards. By the end of the sixth week,pale eosinophilic medulla showingreticuloepithelial cells with fewer lymphocytescompared to darkly stained basophilic cortexwas distinctly noticed. As differentiation ofcortex and medulla progressed, thereticuloepithelial cells were more apparent inthe lightly stained medulla.
The reticular cells were observedbetween the lymphocytes and also occurringfrequently in small groups devoid of other celltypes. Mild alkaline phosphatase activity aswell as acid phosphatase activity was recordedby the thymic reticuloepithelial cells andstroma which were in accordance with thefindings of Fennel and Pearse (1961).
Numerous thymic bodies or Hassal’scorpuscles occurred in the medulla. They werecomposed of degenerative reticular cells whichhave formed a concentric mass. The centreof the mass was degenerated so that it had acystic or calcified appearance. Avian typeHassal’s corpuscles as described by Kendall(1980) characterised by vesiculatedreticuloepithelial cell clusters surrounding ahomogenous mass were recorded in thepresent study. They represented an abortiveattempt at keratinisation by the epithelial cells(Tizzard,1987).
The myoid cells were seen in themedulla as round or oval or elongated, stronglyeosinophilic structures (Fig. 2) which appearedto be syncitial in nature. Their cytoplasm wasstrongly eosinophilic and fibrous (Itoh,1983).During the involutary phase the round formswere more in number and were supported bythe observations of Van develde et al. (1967).
In transmission electron microscopicstudies the myofibrils were found in thecytoplasm of some cells similar to the
description of myoid cells given by Chan(1995).
A continuous layer of reticuloepithelialcells was noted around the blood vessels. Thiscomponent of blood thymic barrier had threecomponents namely the capillary with itsbasement membrane, the perivascular spaceand reticuloepithelial cell with its basementmembrane. Toivanen and Toivanen (1987)stated that the blood thymic barrier was presentin the cortex and not in the medulla. However,in this study the presence of germinal centreswere very few and were present mostly in theinvoluting thymus in the medulla. At this stage
J. V
et. A
nim
.Sci
. 20
08.
39 :
40-
43
41C. Leena et al.
RESEARCH ARTICLE
Fig. 1. Phagocytic activity in day old thymus. H & E X 450
Fig. 2. Cross and longitudinal sections of Myoid cells.Masson’s Trichrome X 1000
Fig. 3. Nuclear toroids of apoptotic lymphocytes.H & E X 1000
degeneration of the blood thymic barrier cellsalso occurred.
Ham and Cormack (1979) reportedthat protective blood thymic barrier preventedthe occurrence of plasma cells in the thymus.In the present study however plasma cells andgerminal centres were found within the thymuswhich suggested that thymus in addition to itsrole as a primary lymphoid tissue may functionas a secondary lymphoid organ. In supportoccasional secondary lymphoid follicles werealso observed.
The involutary changes were seenfrom eighth week onwards which progressedtill 14th week of age, after which a re-enlargement and restoration of thymicarchitecture was noticed indicatingrecrudescence. The re-enlarged thymusregressed very slowly thereafter. But completeinvolution was not seen even at 24 weeks ofage. Involutary changes in the thymus glandwere characterised by thickening of thecapsule, loss of interlobular septa, pyknosis ofthymocytes, extension of area of medulla,increase in size and number of Hassal’scorpuscles and myoid cells and accumulationof lipid granules in the medulla. Theseobservations were also noted by Bhattacharyaand Binay Kumar (1983) in fowl.
Metaplasia of epithelial reticular cellsinto epithelial myoid cells were seen. Roundand elongated forms of myoid cells were moreand found associated with blood vessels.Towards the later stages, myoid cells showedgranular and strand like fibrous nature in theircytoplasm. Empty spaces were evident aroundthese myoid cells with advancement of age.
Frequent capped appearance oflymphocyte nucleus referred to as toroids(Fig.3) and horse shoe forms of the nuclei werenoticed which increased in number during laterstages of involution. These were also notedby Wyllie and Duvall (1998) and were a featureof apoptotic cells. Sparsely disributed roundor oval masses of intensely eosinophilic
materials were seen in the involuting thymus.These were similar to the description ofapoptotic bodies given by Vegad (1995). Rapidingestion of these bodies by phagocytesaccounts for their rare occurrence.
Some cells of the medulla, probablythe reticuloepithelial cells, appeared cystic andwere alcian blue positive, which were probablyintracellular cysts. Others were squamous andformed Hassal’s corpuscles. The cystscomprised of smaller vesicles lined by simpleor stratified columnar cells and containingmucus. Some were large intracytoplasmicvesicles in the reticuloepithelial cells.
The weight of the thymus reduced at14 weeks with a subsequent increase at 16weeks followed by further decrease which isan evidence for recrudesence. Thecorticomedullary ratio increased till threeweeks and then decreased till 14 weeks afterwhich it increased drastically indicatingreappearance of the cortex, an observationfurther supporting recrudesence. Similarobservations were recorded in some speciesof birds by Kendall (1980). A decrease incortical lymphocytes and increase in fat andconnective tissue were also seen. The cortexdecreased with age and by six months it wasnoted to be absent. Lipid substances werenoted in the medulla of thymus at involution.
The size of the thymus varyconsiderably, its relative size being greatest innewborn and its absolute size being greatestat puberty. An inverse weight relationshipexisted between the growth of the thymus andsexual maturity. The absolute weight of thethymus was maximum at 16 weeks, the timeof sexual maturity while the relative weight washighest at day old being 1.31 which is in totalagreement with Tizzard (1987).
Acknowledgements
The authors are thankful to the IndianCouncil of Agricultural Research, New Delhi,for providing financial support for the work.
J. V
et. A
nim
.Sci
. 20
08.
39 :
40-
43
42 Thymus of giriraja birds...
RESEARCH ARTICLE
References
Bhattacharya and Binay, K. 1983. Somehistomorphological and cytochemicalchanges in chick thymus duringspontaneous age involution. PAUO.21: 71-85.
Chan, A.S. 1995. Ultrastructure of myoid cellsin the chick thymus. Brit. Poult. Sci.,36 : 197-203
Fennell, R.A. and Pearse, A.G.E. 1961. Some

J. V
et. A
nim
.Sci
. 20
08.
39 :
40-
43
43C. Leena et al.
RESEARCH ARTICLE
�
histochemical observations on thebursa of Fabricius and thymus of thechicken. Anat. Rec., 139 : 93-103.
Ham, A.W. and Cormack, D.H. 1979.“Histology”. 8th ed. JB Lippincott Co.Philadelphia
Ibars, C.B., Rodniguez, A.B., Sonta, K.S. andLea, R.W. 1997. Mitogenic effect ofnaturally occurring elevated plasmaprotection on ring dove lymphoytes.Dev. Comp. Immunol., 21: 47-58.
Itoh,T. 1983. Establishment of a myoid cellclone from rat thymus, Cell Tiss. Res.,231:39-47
Kendall, M.D. 1980. Avian thymus gland, Areview. Dev. Comp. Immunol., 4 : 191-210.
Kiernan, J.A. 1981. Histological andHistochemical Methods-Theory andpractice. 1st ed. Pergmon Press,Oxford.
King, A.S. and Mc Lelland, J. 1983. Form andfunction in birds. Vol 2. Academicpress. pp. 352-359
Ross, M.H.,Romrell,L.J. and Kaye, G.I. 1998.Histology- a text and atlas. Williamsand Wilkinsons publishers, Baltimore.330 p.
Tizzard, I.R. 1987. Veterinary Immunology, anintroduction. 5th ed. W.B. SaundersCompany.
Toivanen, A. and Toivanen, P. 1987. AvianImmunology:Basis and PracticeVolume 1. CRC Press, Inc. Florida.
Van develde, R.L., Friedman, N.B. and Milch,M. 1967. Muscular element in thymus.Anat. Rec., 157 : 392.
Vegad, J.L. 1995. Text book of VeterinaryPathology. Vikas Publishing housePvt. Ltd. 63 p.
Wyllie,A.H., and Duvall,E. 1998. OxfordTextbook of Pathology Vol 1. OxfordUniversity Press,Oxford.

IMMUNE RESPONSE TO FOOT AND MOUTHDISEASE OIL ADJUVANT VACCINES IN CALVES
K. Rajkumar1 and M. R. Saseendranath2
Department of Veterinary Epidemiology andPreventive MedicineCollege of Veterinary and Animal SciencesMannuthy-680651, Thrissur, Kerala
Abstract
Immune response to FMD oil adjuvantvaccines in four month old calves born ofvaccinated dams showed increased antibodiesto FMD type ‘0’, ‘A’, Asia 1 and ‘C’ within amonth after primary vaccination. The antibodylevel remained satisfactory till 270 days postvaccination. It is concluded that FMD oiladjuvant vaccine elicits efficient responseagainst all types of FMD virus in calves evenin the presence of maternal antibodies.
Key words: FMD oil adjuvant vaccines,Immune response, calves
Foot and Mouth Disease is an acutefebrile disease of mainly cloven footed animalsthat cause severe economic loss and is mainlycontrolled by vaccination in India. One of themain problems in mass immunisation againstFMDV is inducing protection in young calvesin which the presence of maternal antibodiesinterfere with immune response. Since it hasbeen shown that new born calves with maternalantibodies give very poor or no response toaqueous (Aq) Foot and Mouth Disease virus(FMDV) vaccines (Nicholla et al., 1984), theepidemic waves start in many countries withinfection of these unprotected young calves.But it has been demonstrated, both inlaboratory and in controlled field conditions,that oil adjuvant vaccines confer a much longlasting protection in cattle (Rivenson et al.,1982). Further Sadir et al. (1988) reported thatoil emulsion FMD vaccines are highly efficient
1. Assistant Professor, RGCOVAS, Puducherry2. Professor and Head
from 30 days of age, even in the presence ofcolostral antibody. The present study wasundertaken to study the immune response toFoot and Mouth Disease oil adjuvant vaccinesin calves.
Materials and Methods.
Twelve calves, aged four monthsbornof dams vaccinated against FMDV type 0, A,C and Asia 1 were used (Raksha O Vac) forthe present study.
All the calves were vaccinated withtwo ml of FMD Oil adjuvant vaccineintramuscularly.
Serum samples were collected beforevaccination and at monthly interval for a periodof one year. Liquid Phase Blocking EnzymeLinked Immuno Sorbent Assay (LPB ELISA)was carried out as per the method of Hamblinet at. (1986) for the assessment of immuneresponse. The optical density (OD) was readon a titertek multiskan (Flow laboratories) at492 nm. The OD values were converted topercent of mean OD obtained for virus control,which was taken as the maximum OD. The 50per cent OD end point of each serum dilutionwas computed using the slop of regressionbetween serum dilution (loglO)and per cent ODand expressed as the antibody titre.
Results and Discussion
The antibody titres to FMDV type 0,A, C and Asia -1 are presented in the tables (1to 4). On examination of the serum sample at
J. V
et. A
nim
.Sci
. 20
08.
39 :
44-
46
44 Immune response to FMD oil adjuvant vaccines...
RESEARCH ARTICLE

fourth month of age before primary vaccination,all the animals showed antibody titres to FMDtype C virus. But antibody titres to 0, A, Asia1FMD virus were shown to be significantly low.After vaccinating these animals with polyvalentFMD oil adjuvant vaccine, all of them showedincreased antibody levels to FMD type C withina month. Immune response against FMD virustype C in the presence of maternal antibodiesclearly indicate that there is no interference ofmaternal antibodies in immune response. Theresults are in accordance with the observationmade by Rao et al. (1993) and Sadir et al.(1988) who reported that presence of maternal
antibodies did not influence the serologicalresponse in animals vaccinated with oiladjuvant vaccine. Antibody titre reached a peaksix months after primary vaccination and thereafter it declined. The serum neutralisingantibody titres remained at a protective levelfor 270 days post vaccination. The antibodyresponse to FMD type ‘0’, ‘A’ and Asia 1 werealso above the protective level for 270 dayspost vaccination (Tables 1,2, & 4). Hence it isconcluded that FMD oil adjuvant vaccineensures a protective level of antibody for 270days post vaccination in calves even in thepresence of maternal antibodies.
Table 1. Antibody titre to FMDV type 0 (Mean ± SE).
(For the protection of FMDV type ‘0’ the titre of 1.5and above is taken as protective)
Table 2. Antibody titre to FMDV type A (Mean± SE)
Table 3. Antibody titre to FMDV type C (Mean ± SE)
(For the protection of FMDV type ‘C’ the titre of one and above is taken as protective)
Table 4. Antibody titre to FMDV type Asia-I (Mean ± SE)
(For the protection of FMDV type Asia 1 the titre of 1.4 and above is taken as protective)
(For the protection of FMDV type ‘A’ the titre of one and above is taken as protective)
J. V
et. A
nim
.Sci
. 20
08.
39 :
44-
46
45K. Rajkumar and M.R Saseendranath
RESEARCH ARTICLE
Acknowledgements
We thank the Executive Director,Indian Immunologicals Ltd., Hyderabad for thesupply of vaccine and biologicals and the Dean,College of Veterinary and Animal Sciences,Mannuthy for providing facilities andpermission to conduct the study.
References
Hamblin, C., Barnett, I.T. and Crowther, J. R.1986. A new enzyme-linkedimmunosorbent assay (ELISA) for thedetection of antibodies against foot-and-mouth disease virus. II -Application. J. Immunol. Meth., 93:123-129.
Nicholla, M. 1., Black, L., Rweyemamu, M. M.,Genovese, J., Ferrari, R., Hammant,C.A., De Silva E. and Umehara O.1984. The effect of maternally derivedantibodies on the response of calvesto vaccination against foot-and-mouthdisease. J. Hygiene., 92: 105-116.
Rao, A. K., Palanisamy, R., Kalanidhi, A. P.,Azad, H. M. and Srinivasan, V. A.1993. Use of oil adjuvant foot-and-mouth disease vaccine in cattle.Indian Vet. J., 70: 493-497.
Rivenson, S., Sandir, A. M., Gaggino, O. P.,Marcovecchio, F. E., Zabal, O. andLaporte O. 1982. Comparison of twofoot and mouth disease vaccines (oilemulsion and hydroxyl saponin) incattle. Revista de MedicinaVeterinaria, 65 : 364-370.
Sadir, A.M., Schudel, A. A., Laporte, O., Braun,M. and Margni, R. A. 1988. Responseto foot and mouth disease vaccinesin new born calves. Influence of age,colostral antibodies and adjuvants.Epidemiol. Inf., 100: 135-144.
�
J. V
et. A
nim
.Sci
. 20
08.
39 :
44-
46
46 Immune response to FMD oil adjuvant vaccines...
RESEARCH ARTICLE
GROSS ANATOMICAL STUDIES OF THESCAPULA IN LEOPARD (Panthera pardus)
A.R.Sreeranjini 1, Indu V. Raj2,N. Ashok3 and K.R.Harshan 4
Department of Veterinary Anatomy and HistologyCollege of Veterinary & Animal SciencesPookode, Wayanad, Kerala
Abstract
A study was conducted on thescapula of two leopards (Panthera pardus).The scapula presented two surfaces, threeborders and three angles as in other species.Spine of scapula divided the lateral surface intoa supraspinous and an infraspinous fossa.Ventral end of the spine presented acromionor hamate process. Above the hamate processa small suprahamate process was also noticed.The medial surface presented a shallowsubscapular fossa and facies serrata.Supraglenoid tubercle and coracoid processwere recorded proximal to the glenoid cavity.
Key words: Scapula, anatomy, leopard
Scapula is a large flat bone of thepectoral girdle (Evans and Christensen, 1979).Literature available on the anatomy of scapulaof leopard is scanty. Hence, an attempt hasbeen made to record the gross anatomicalcharacteristics of the scapula of this species.
Materials and Methods
The present study was conducted onthe scapula of two leopards brought for post-mortem examination at the College ofVeterinary and Animal Sciences, Pookode,Wayanad, from the Department of Forest,Government of Kerala. The fore limb wasresected from the trunk and the bones weremacerated and prepared according to themethods of Young (1980).
1. & 2. Assistant Professors, CVAS, Mannuthy3. Professor and Head, CVAS, Mannuthy4 Professor (Retd.)
Results and Discussion
The scapula presented two surfaces– lateral and medial; three borders – cranial,caudal and dorsal and three angles – cranial,caudal and ventral as in various species ofdomestic animals (Nickel et al., 1986). Thelateral surface was divided by the spine ofscapula into two unequal fossae viz., a cranialsupraspinous fossa and a caudal triangularinfraspinous fossa (Fig.1). Unlike in the caseof domestic animals, the supraspinous fossawas larger in leopard. Near the middle third ofthe dorsal border of scapula, the spineappeared as a low thick ridge and graduallyincreased in height distally. It presented acranial and a caudal surface throughout itslength as reported by Evans and Christensen(1979) in dogs. The acromion or hamateprocess was present at the ventral end of thespine as recorded in dogs (Budras et al., 1994).A small caudally directed triangularsuprahamate process was noticed above thehamate process as in cats (Nickel et al., 1986).A nutrient foramen was observed in theinfraspinous fossa in the distal third. Thisconcurs with the findings of Nickel et al. (1986)in various species of domestic animals.
The medial surface presented ashallow subscapular fossa (Fig. 2). The cranialand caudal angles of this surface showed tworough areas -the facies serrata, of which thecranial one was more prominent, larger andtriangular in shape. These are in partial
J. V
et. A
nim
.Sci
. 20
08.
39 :
47-
48
47A.R.Sreeranjini et al.
RESEARCH ARTICLE

agreement with the findings of Evans andChristensen (1979) in dogs, who haveobserved rectangular shape for the faciesserrata cranialis. The ventral third of thissurface also showed a nutrient foramen.
The cranial border was stronglyconvex proximally and formed an arc thatcontinued distally as a deep concave scapularnotch and thus formed a distinct neck for thescapula. These are in agreement with theobservations of Evans and Christensen (1979)in dogs and Nickel et al. (1986) in carnivores.
Distal to the scapular notch, thecranial border presented a distinctsupraglenoid tubercle. Medial surface of thesupraglenoid tubercle showed a hook likecoracoid process as in various domesticanimals (Nickel et al., 1986). The caudalborder was thick, rough and straight and nearthe glenoid angle it showed an infraglenoidtubercle. This is in agreement with the findingsof Smith (1999) in canines. The dorsal borderwas thick and pitted for the scapular cartilageand was slightly convex.
The cranial angle was more obtusethan the caudal angle. The ventral or glenoidangle presented a shallow, oval glenoid cavity.The cavity extended to the ventral surface ofthe supraglenoid tubercle. The glenoid notchwas noticed on the lateral rim of the glenoidJ.
Vet
. Ani
m.S
ci.
2008
. 39
: 1
-2
48 Scapula in leopard...
RESEARCH ARTICLE
A. Supraspinous fossaB. Infraspinous fossaC. Cranial angleD. Caudal angleE. Ventral angleF. Cranial borderG. Caudal borderH. Dorsal borderI. Spine of scapulaJ. Hamate processK. Suprahamate processL. Nutrient foramenM. Scapular notchN. Glenoid notch
Fig.1. Scapula of leopard- lateral surface
A. Subscapular fossaB. Facies serrataC. Nutrient foramenD. Supraglenoid tubercleE. Coracoid process
Fig.2. Scapula of leopard - medial surface
cavity at its middle. These are in accordancewith the reports of Nickel et al. (1986) incanines. The medial border of the glenoid rimformed a larger arc than the lateral border, asobserved by Evans and Christensen (1979) incanines.
References
Budras, K.D., Wolfgang, F., Mc McCarthy, H.P. andWolfe, M. 1994. Anatomy of the dog- anIllustrated Text, 3rd ed. SchluterscheVerlagsanstalt and Dreckerei Gmbh Co.,Hannover. 114 p.
Evans, H.E. and Christensen, G. C. 1979.Miller’s Anatomy of the Dog, 2nd ed.W.B. Saunders Co., Philadelphia. pp.68-70.
Nickel, R., Schummer, A. and Seiferle, E. 1986.The Anatomy of Domestic Animals-Vol.1., Verlag Paul Parey, Berlin,Hamburg. 499 p.
Smith, J.B. 1999. Canine Anatomy, LippincottWilliams and Wilkins, Philadelphia.619 p.
Young, J.H. 1980. Preparation of the skeletalspecimen. Equine Practice, 2: 29-32
�

MEMORY AND HIERARCHICAL BEHAVIOUR INMICE, RATS AND GUINEA PIGS
Chitra R. Nair1, Joseph Mathew2,K. Shyama3, P.C., Saseendran4,K. S. Anil5 and A. Kannan6
Department of Livestock Production ManagementCollege of Veterinary and Animal SciencesMannuthy - 680 651, Thrissur, Kerala
AbstractA study was conducted to retrieve
information on the memory and hierarchicaltraits in mice, rats and guinea pigs bysequential separations and re-mixing atdifferent time intervals and recording theaggression, dominance and submissivebehavioural traits. The results of the studyindicated that among the three species ofanimals studied, guinea pig was found to bethe least aggressive. Loss of hair around themouth due to severe fighting (barbering) wasfound to be more with mice than rat. Cagestereotypies shown by rats were clinging onthe roof of the cage, biting the meshes of thecage and eating the plastic portion of the cage.Constant pacing or circling of the cage,gnawing of the bars were the cage steriotypiesshown by mice. Animals of all speciesestablished stable, sound hierarchy within 24h. It was concluded that all the species retainedvarying levels of memory that lasted for lessthan a week as indicated by increasing trendof the duration of the aggression in eachepisode.
Key words: Hierarchy, behaviour, memory
Specific studies on the ethologicalfactors of laboratory animals are scarce andscanty. Knowledge of the behaviour of therodents has become important from the viewof controlling their population for reducing theeconomic loss and disease problems incurredby them. The knowledge has also been
1. Allianz Cornhill, TVPM2. Professor, CVAS, Pookode, Wayanad3. Associate Professor, Dept. of Animal Nutrition4. Professor & Head5. & 6. Associate Professors
employed to keep them both physiologicallyand psychologically healthy, when they areused in research laboratories and also as pets.Rearing in confinement may influence theirbehavioral traits there by resulting in certainmanagemental problems in laboratoryconditions. Hence the present study wasundertaken to retrieve specific information onthe memory and hierarchial traits in mice, ratsand guinea pigs.
Materials and MethodsTwenty four each of adult female rats,
mice and guinea pigs maintained at KeralaAgricultural University Small Animal BreedingStation, Mannuthy belonging to two strainswithin each species were taken for study.Twelve animals in each strain were housed inseparate cages as replicates for two weeks asindicated below:
Mice-Balb/c (C1) and Swiss albino (C2)
Rats-Wistar (C3) and Spraque dawley (C4)
Guinea Pigs-Coloured (C5) and Albino(C 6)
After two weeks, animals in each cagewere divided into two groups of six animalseach and were housed in separate cages likeC1.1, C1.2, C2.1, C2.2, C3.1, C3.2, C4.1, C4.2,C5.1, C5.2, C6.1 and C6.2. One animal fromeach cage was interchanged to their respectivepre- divided cage mates after 1, 2, 3, 4 and 7days respectively. The frequency and intensityof aggressive behaviour and physical injurywere observed for one hour, after transfer. Theperiod required for establishment of stable
J. V
et. A
nim
.Sci
. 20
08.
39 :
49-
52
49Chitra R. Nair et al.
RESEARCH ARTICLE
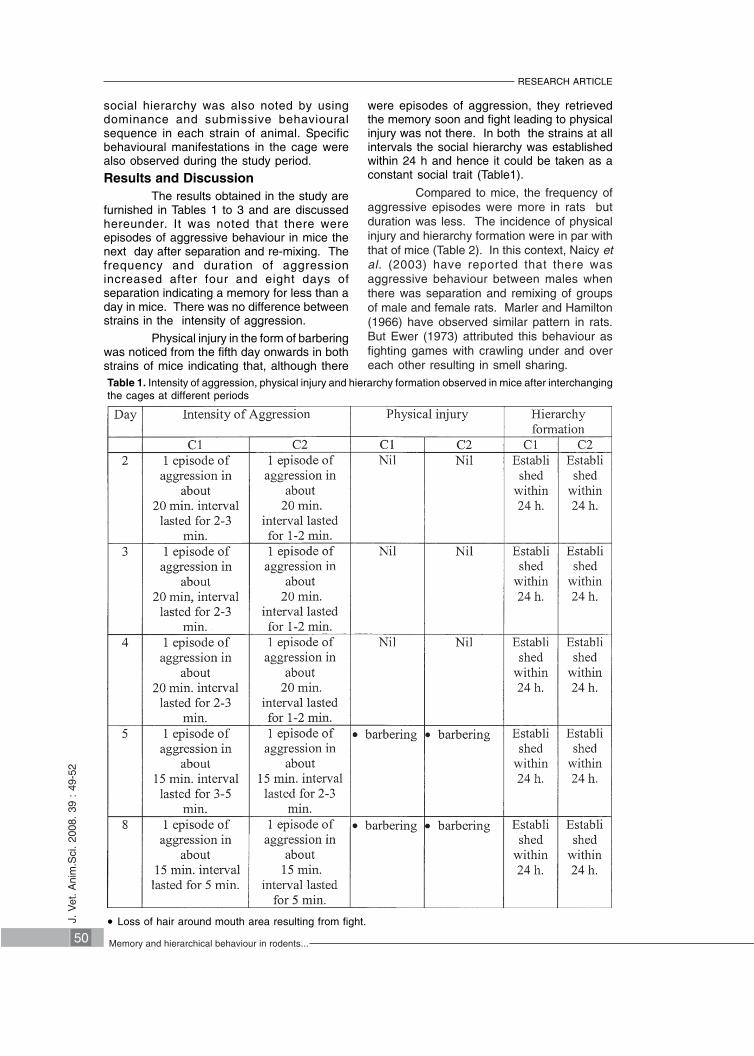
social hierarchy was also noted by usingdominance and submissive behaviouralsequence in each strain of animal. Specificbehavioural manifestations in the cage werealso observed during the study period.
Results and DiscussionThe results obtained in the study are
furnished in Tables 1 to 3 and are discussedhereunder. It was noted that there wereepisodes of aggressive behaviour in mice thenext day after separation and re-mixing. Thefrequency and duration of aggressionincreased after four and eight days ofseparation indicating a memory for less than aday in mice. There was no difference betweenstrains in the intensity of aggression.
Physical injury in the form of barberingwas noticed from the fifth day onwards in bothstrains of mice indicating that, although thereTable 1. Intensity of aggression, physical injury and hierarchy formation observed in mice after interchangingthe cages at different periods
were episodes of aggression, they retrievedthe memory soon and fight leading to physicalinjury was not there. In both the strains at allintervals the social hierarchy was establishedwithin 24 h and hence it could be taken as aconstant social trait (Table1).
Compared to mice, the frequency ofaggressive episodes were more in rats butduration was less. The incidence of physicalinjury and hierarchy formation were in par withthat of mice (Table 2). In this context, Naicy etal. (2003) have reported that there wasaggressive behaviour between males whenthere was separation and remixing of groupsof male and female rats. Marler and Hamilton(1966) have observed similar pattern in rats.But Ewer (1973) attributed this behaviour asfighting games with crawling under and overeach other resulting in smell sharing.
• Loss of hair around mouth area resulting from fight.J. V
et. A
nim
.Sci
. 20
08.
39 :
49-
52
50 Memory and hierarchical behaviour in rodents...
RESEARCH ARTICLE

Table 2. Intensity of aggression, physical injury and hierarchy formation in rats after interchanging thecages at different periods
• Loss of hair around mouth area resulting from fight
J. V
et. A
nim
.Sci
. 20
08.
39 :
49-
52
51Chitra R. Nair et al.
RESEARCH ARTICLE
Table 3. Intensity of aggression, physical injury and hierarchy formation in guinea pigs afterinterchanging the cages at different periods

There was no sign of aggression andphysical injury on 2nd, 3rd and 4th day ofseparation and re-mixing in guinea pigs. On5th day onwards they have started very shortepisodes of aggression indicating that theypossess a memory for about three days. Butduration for hierarchy formation was below24 h (Table 3).
Among the three species of animalsstudied, guinea pig was found to be the leastaggressive. Among the rats and mice species,loss of hair around the mouth due to severefighting (barbering) was found to be more withmice than rat. Apart from all these behaviors“cage steriotypies” were also shown by theanimals especially rats and mice. Cagesteriotypies shown by rats were clinging on theroof of the cage, biting the meshes of the cageand eating the plastic portion of the cage.Constant pacing or circling of the cage,gnawing of the bars were the cage steriotypiesshown by mice. All of the three species of the
animals established stable sound hierarchywithin 24 hours. From this observation it canbe reasonably concluded that the rats and miceretained memory for one day and guinea pigsretained memory for three days as indicatedby the increasing trend of duration ofaggression in each episode.
References
Ewer, R.F. 1973. Ethology of Mammals. ElekScience, London. 292 p.
Naicy Thomas, Seeba, C. John and JosephMathew. 2003. Analysis of ethologicalelements in rats. Proc. First AnnualConvention of Blue Cross Society ofThrissur. pp. 42-43.
Marler P. and Hamilton W.J. 1966. Mechanismof Animal Behaviour. Toppan PrintingCo. Ltd., pp. 173-192
�
J. V
et. A
nim
.Sci
. 20
08.
39 :
49-
52
52
RESEARCH ARTICLE
Memory and hierarchical behaviour in rodents...

DIAGNOSIS OF CAPRINE TOXOPLASMOSISBY LATEX AGGLUTINATION TEST
K. Syamala1, K. Devada2 andK. Madhavan Pillai3
Department of Veterinary ParasitologyCollege of Veterinary and Animal SciencesMannuthy-680 651,Thrissur, Kerala
Abstract
A total of 98 blood samples of goatsmaintained in the Government goat farms ofAttapady, Kommeri and KAU and of thosebrought to the slaughter houses of Thrissur andErnakulam were screened for the presence ofToxoplasma antibodies by Latex agglutinationtest.The test was performed using the test kitToxotest MT (Eiken). Positive reaction ≥ 64 wasdetected in 57 samples (58.16 percent) thatputs forth the need of public awareness on therisk of acquiring Toxoplasma infection.
Key words: Toxoplasma gondii, goats, Latexagglutination test
Toxoplasmosis is a zoonoticprotozoan disease caused by a coccidianparasite, Toxoplasma gondii, common andwidespread in all warm blooded living beings.Human beings contact the disease by ingestingfood or meat contaminated with the infectivestages of T. gondii. Among domestic animals,T. gondii is most pathogenic in goats (Dubeyand Beattie, 1988). It also causes economicloss due to abortion and premature birth ingoats. The diagnosis of toxoplasmosis inanimals depends on the demonstration ofspecific antibodies by one or more serodiagnostic tests. Latex agglutination test (LAT)has been used in the diagnosis of caprinetoxoplasmosis (Samad, 1993; Hashemi-Fesharki, 1996). The present study is a
1. Assistant Professor,CVAS,Pookode, Wayanad2. Professor and Head3. Professor (Retd.)
preliminary attempt made to detect theoccurrence of Toxoplasma antibodies in goatsera obtained from various regions of Keralaby LAT.
Materials and Methods
Collection of samples
Blood samples were collected frombucks, kids, healthy does and does with ahistory of abortion belonging to theGovernment Goat farms, Attapady andKommeri and the Kerala Agricultural UniversityGoat farm and from the slaughter houses atThrissur and Ernakulam. The sera wereseparated and stored at -20° C till use.
Test proper
Latex agglutination test wasperformed as per the procedure described inthe product information of Toxotest-MT (Eiken).The agglutination was done in “U” bottomed96 well microtitre plates (Tarson). A volume of0.025 ml of buffer (0.2M 2 amino-2 methyl-1propanol- Hcl buffer solution) supplied wasadded to each well. Next 0.025 ml of the testsera serially diluted from 1:16 to 1:2048 wascharged to each well followed by 0.025 ml ofthe sensitive latex suspension (Eiken). Theplates were gently shaken and properly mixed.
They were then sealed and allowedto stand for 12 h at room temperature. Positiveand negative control sera were also maintainedin each plate.
J. V
et. A
nim
.Sci
. 20
08.
39 :
53-
54
53K. Syamala et al.
RESEARCH ARTICLE

Interpretation
An agglutination that spread uniformlythrough out the well or that which was intensewith irregular edges was interpreted as apositive reaction ≥ 64 while a small, distinctcircular precipitation in the centre indicated anegative reaction.
Results and Discussion
The results of the presence of T.gondiiantibodies in goat sera by LAT are furnishedin the table. It was found that 57 samples(58.16 percent) out of 98 screened werepositive for the antibodies. The maximumpercent was obtained from those samplescollected from the Government goat farm,Kommeri (65 percent). Access to the nearbyreserve forest where there is possibility of wildcats and oocysts in the soil constitute areasonable factor for the high positive titres inthese goats which are usually let out to grazenear the wilderness.
The results of the present surveyindicate that the presence of T. gondiiantibodies is in a fairly high order among thegoats of Kerala. The favorable environmentalconditions for the survival of T. gondii oocystsin the soil like high humidity and heavy annualrainfall seen throughout the state also signifythe presence of the infection in these animals.This work was beneficial to create awarenessamong the public on the risk of acquiringToxoplasma infection from handling goat meatand drinking unpasteurised goat milk. Whenapplied to caprine sera, a positive titre ≥ 64 isa true indication of the presence of Toxoplasmaantibodies. However, negative samples needrepeated evaluation.
Acknowledgements
The authors thank the Dean, Collegeof Veterinary and Animal Sciences, Mannuthyfor providing facilities for the conduct of thestudy.
Table : Sero prevalence of Toxoplasma gondii in goat sera by Latex agglutination test
�
J. V
et. A
nim
.Sci
. 20
08.
39 :
53-
54
54 Caprine toxoplasmosis...
RESEARCH ARTICLE
References
Dubey, J.P. and Beattie, C. P. 1988. Toxoplasmosisin animals and man. CRC Press, BocaRaton, Florida. 220 p.
Hashemi-Fesharki, R. 1996. Seroprevalence ofToxoplasma gondii in cattle, sheep andgoat in Iran. Vet.Parasitol., 61 : 1-3
Samad, M.A. 1993. Serological diagnosis ofToxoplasma gondii associated withabnormal reproduction in Black Bengalgoats. Prev.Vet. Med.,13: 217-220

EFFECT OF NICOTINIC ACIDSUPPLEMENTATION ON PRODUCTIONPERFORMANCE OF LACTATING COWS
Nicotinic acid in its co-enzyme forms,NAD and NADP are involved in many metabolicreactions especially important for thosereactions that provide energy to the animal.There are reports showing that nicotinic acidsupplementation can improve milk productionand reduce occurrence of ketosis in cattle(Fronk and Schultz, 1979). Hence this studywas undertaken to assess the effect ofsupplementation of nicotinic acid in the diet oflactating cows on milk production and milk fatpercentage.
Twelve cross-bred lactating cowswere selected from University Livestock FarmMannuthy and were divided into two groupsas uniformly as possible with regard to parityand days in milk. They were allotted randomlyto two dietary treatments T1 and T2. All animalswere fed commercial concentrate mixture usedin the farm and green fodder to meet theirnutritive requirements. Animals of the groupT2 were fed with 10g nicotinic acid per animalper day. Records of daily milk yield weremaintained through out the experimental periodof one month. Milk samples were collected inthe beginning and towards the end of theexperiments and were analysed for fat content,using Gerber’s method (IS:1224, 1977). Dataon average milk production and fat percentagewere analysed using analysis of covarianceand students‘t’ test (Snedecor and Cochran,
1985) respectively. The animals of the groupsT1 and T2 consumed on an average 5.58 and5.42 kg of concentrates respectively. Thegreen fodder was fed ad libitum.
Weekly average of daily milkproduction for control and experimentalgroups are given in the table. Average initialyield was 9.47 and 9.55 kg for T1and T2respectively, and the final milk yield was 8.84and 9.96 kg respectively. There was nosignificant difference between the two groups.Average milk yield of the animals whichreceived nicotinic acid showed a numericalincrease in milk production while there was agradual decline in milk yield in those fed withthe control diet. The final yield was 0.63 kglower for the control, while it was 0.41kghigher in T2 when compared to that of theinitial yield.
Initial fat percentage was 3.2 forcontrol and 3.38 percent for the treatmentgroup. The final values were 3.31 and 3.85percent respectively for groups T1 and T2.Fat percentage also showed a numericalincrease in both groups but the increase washigher for T2. However statistical analysisdid not reveal any significant differencebetween two groups. The milk yield was 7.94and 9.68 kg respectively for the control andexperimental group, with fat content correctedto four percent.
J. V
et. A
nim
.Sci
. 20
08.
39 :
55-
56
55Renjith Gopal et al.
SHORT COMMUNICATION
Table. Weekly average of daily milk production (kg) of experimental cows

SHORT COMMUNICATION
Results of the present study are inagreement with that of Riddell et al. (1981) whoobserved only numerical increase in milkproduction when early lactating cows weresupplemented with nicotinic acid. Dufva et al.(1982) also could not observe any significanteffect on milk yield or milk composition whensupplemented with nicotinic acid. SimilarlyCostanzo et al. (1997) reported no significantincrease in milk production but observeddecreased skin temperature during mild orsevere heat stress.
Fronk and Schultz (1979) on the otherhand observed a significant increase in milkproduction in dairy cows suffering from ketosiswhen supplemented with nicotinic acid.Similarly increased milk production was alsoreported by Jaster and Ward (1990) whennicotinic acid was supplemented to lactatingcows.
From overall assessment of theresults obtained it could be concluded thatnicotinic acid supplementation in the ration oflactating cows did not significantly improve themilk yield or milk fat percentage. But there wasa numerical increase in average daily milkyield, fat percentage and 4 per cent fatcorrected milk yield in cows supplemented withnicotinic acid.
Summary
The effect of dietary supple-mentationof nicotinic acid on milk yield and milk fatpercentage was studied in twelve lactatingcows allotted at random to treatments T1 andT2. All animals were fed concentrate mixtureand green grass to meet their nutritiverequirements. Animals of T2 were given 10gof nicotinic acid / head / day. Result of thestudy showed an increase in milk yield and milkfat percentage, though not statisticallysignificant, in nicotinic acid supplementedgroup.
References
Costanzo, A.D. I., Spain, J.N. and Spiers, D.E.1997. Supplementation of nicotinicacid for lactating Holstein cows underheat stress condition. J. Dairy Sci.,80:1200-1206
Duvfa, G.S., Bartley, E.E., Dayton, A.O. andRiddel, D.O. 1983. Effect of niacinsupplementation on milk productionand ketosis of dairy cattle. J. DairySci., 66:2329-36
Fronk, T. J. and Schultz, L. H. 1979. Oralnicotinic acid as a treatment forketosis. J. Dairy Sci., 62:1804
Jaster, E.H. and Ward, N.E. 1990.Supplementation of nicotinic acid ornicotinamide for lactating dairy cows.J. Dairy Sci., 73:2880-2887
Riddell, P.O., Bartley, E.E. and Dayton, A.D.1981. Effect of nicotinic acid onmicrobial protein synthesis in vitro andon dairy cattle growth and milkproduction. J. Dairy Sci., 64: 782-791
Snedecor, G.W. and Cochran, W.G. 1985.Statistical Methods. 8th ed. The IowaState
University Press, United States of America.313 p.
1, 3, 4 & 5. Veterinary graduates2. Professor and Head, Dept. of Animal NutritionJ.
Vet
. Ani
m.S
ci.
2008
. 39
: 5
5-56
56 Nicotinic acid supplementation on production performance...
�
Renjith Gopal 1 , A.D. Mercy2,Nidhish Francis3,S. Aravind4 andRani Chacko 5
College of Veterinary and Animal SciencesMannuthy - 680 651, Thrissur, Kerala

SHORT COMMUNICATION
COMPARATIVE CLINICAL PATHOLOGY OFJOHNIN AND TUBERCULIN REACTORS OFBOVINES
Johnes disease and tuberculosis areimportant mycobacterial diseases that causeeconomic losses due to emaciation and deathbesides decreased productivity, increasedinfertility and susceptibility to other infections.Both diseases have long incubation periodmanifesting subclinical infection leading toasymptomatic carriers shedding the bacillithroughout their lives or some with clinicaldisease. In order to avoid spreading of diseaseamong different farm animals, it is necessaryto employ periodic screening tests to detectthe reactors, segregation and rapid disposalof reactors. This paper reports on thehaematology and biochemical parameters ofJohnin and Tuberculin bovine reactors.
One hundred and twenty one cattleabove six months of age in an organised dairyfarm were subjected to comparativeintradermal tests using Johnin PPD andTuberculin PPD. Preparation of animals fortests and test procedures and recording ofresults were done as per instructions issued
by the B.P. Division of IVRI, Izatnagar, on useof Johnin and tuberculin PPD. Eight johninreactors and eleven tuberculin reactors werekept segregated and served as theexperimental group and another six johnin andtuberculin negative clinically healthy cowsserved as control. Blood was collected fromboth experimental and control groups forhematology and serum for biochemicalestimation. Erythrocyte sedimentation rate(ESR) and differential leucocyte count (DLC)were estimated using Wintrobes method(Benjamin, 1985). Packed cell volume (PCV),haemoglobin (Hb), total erythrocyte counts(TEC) and total leukocyte counts(TLC) weredetermined as per Coles (1986). The serumprofile of calcium (Ca), magnesium (Mg), iron(Fe), zinc (Zn) and copper were estimatedusing atomic absorption spectrophotometer(Perkin Elmer 3110). The data obtained wereanalysed statistically as per the methoddescribed by Snedecor and Cochran (1980).
J. V
et. A
nim
.Sci
. 20
08.
39 :
57-
59
57P. C. Siji et al.
Table 1. Haematological parameters of johnin and tuberculin reactors in comparison to control
* P<0.1
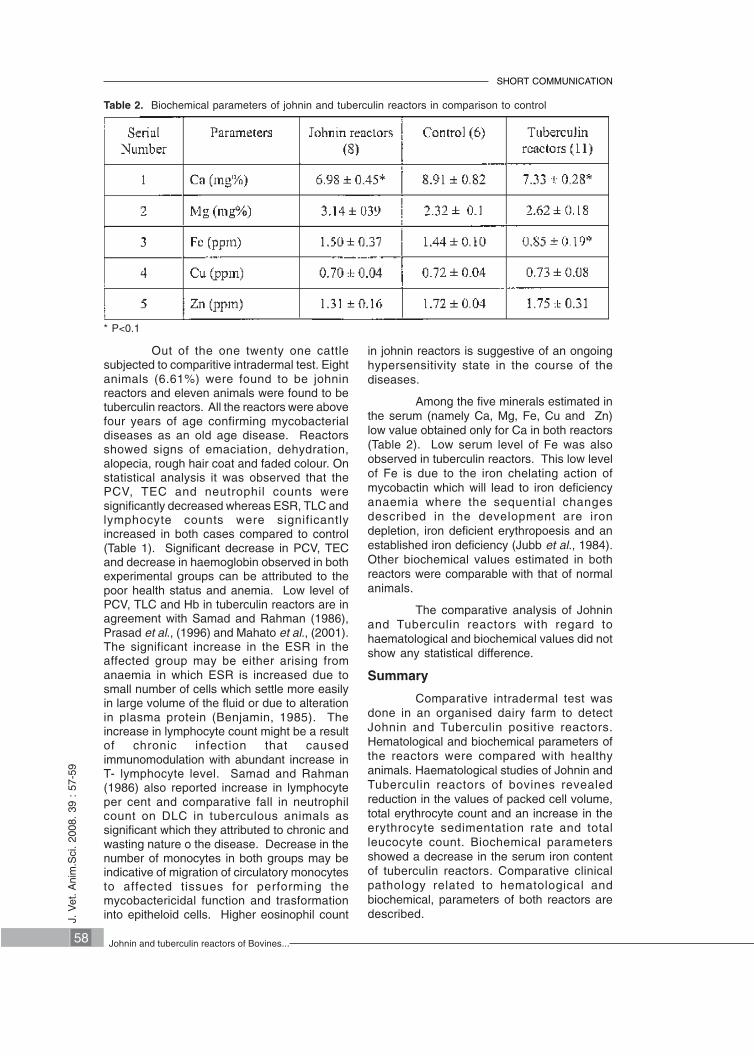
Out of the one twenty one cattlesubjected to comparitive intradermal test. Eightanimals (6.61%) were found to be johninreactors and eleven animals were found to betuberculin reactors. All the reactors were abovefour years of age confirming mycobacterialdiseases as an old age disease. Reactorsshowed signs of emaciation, dehydration,alopecia, rough hair coat and faded colour. Onstatistical analysis it was observed that thePCV, TEC and neutrophil counts weresignificantly decreased whereas ESR, TLC andlymphocyte counts were significantlyincreased in both cases compared to control(Table 1). Significant decrease in PCV, TECand decrease in haemoglobin observed in bothexperimental groups can be attributed to thepoor health status and anemia. Low level ofPCV, TLC and Hb in tuberculin reactors are inagreement with Samad and Rahman (1986),Prasad et al., (1996) and Mahato et al., (2001).The significant increase in the ESR in theaffected group may be either arising fromanaemia in which ESR is increased due tosmall number of cells which settle more easilyin large volume of the fluid or due to alterationin plasma protein (Benjamin, 1985). Theincrease in lymphocyte count might be a resultof chronic infection that causedimmunomodulation with abundant increase inT- lymphocyte level. Samad and Rahman(1986) also reported increase in lymphocyteper cent and comparative fall in neutrophilcount on DLC in tuberculous animals assignificant which they attributed to chronic andwasting nature o the disease. Decrease in thenumber of monocytes in both groups may beindicative of migration of circulatory monocytesto affected tissues for performing themycobactericidal function and trasformationinto epitheloid cells. Higher eosinophil countJ.
Vet
. Ani
m.S
ci.
2008
. 39
: 5
7-59
58 Johnin and tuberculin reactors of Bovines...
in johnin reactors is suggestive of an ongoinghypersensitivity state in the course of thediseases.
Among the five minerals estimated inthe serum (namely Ca, Mg, Fe, Cu and Zn)low value obtained only for Ca in both reactors(Table 2). Low serum level of Fe was alsoobserved in tuberculin reactors. This low levelof Fe is due to the iron chelating action ofmycobactin which will lead to iron deficiencyanaemia where the sequential changesdescribed in the development are irondepletion, iron deficient erythropoesis and anestablished iron deficiency (Jubb et al., 1984).Other biochemical values estimated in bothreactors were comparable with that of normalanimals.
The comparative analysis of Johninand Tuberculin reactors with regard tohaematological and biochemical values did notshow any statistical difference.
Summary
Comparative intradermal test wasdone in an organised dairy farm to detectJohnin and Tuberculin positive reactors.Hematological and biochemical parameters ofthe reactors were compared with healthyanimals. Haematological studies of Johnin andTuberculin reactors of bovines revealedreduction in the values of packed cell volume,total erythrocyte count and an increase in theerythrocyte sedimentation rate and totalleucocyte count. Biochemical parametersshowed a decrease in the serum iron contentof tuberculin reactors. Comparative clinicalpathology related to hematological andbiochemical, parameters of both reactors aredescribed.
SHORT COMMUNICATION
Table 2. Biochemical parameters of johnin and tuberculin reactors in comparison to control
* P<0.1
J. V
et. A
nim
.Sci
. 20
08.
39 :
57-
59
59P. C. Siji et al.
P. C. Siji 1 , K. Vijayakumar 2, P. V. Tresamol 3
and M. R. Saseendranath 4
Department of Veterinary Epidemiology &Preventive MedicineCollege of Veterinary & Animal SciencesMannuthy-680651, Thrisssur, Kerala
1. Lecturer (LSM) VHSC, Ayyanthole, Thrissur2 & 3. Associate Professors4. Professor & Head
�
SHORT COMMUNICATION
References
Benjamin, M.M. 1985. Outline of VeterinaryClinical Pathology. 3rd ed., IndianReprint 2001. Kalyani Publishers,New Delhi, 351 p.
Coles, E.H. 1986. Veterinary ClinicalPathology. 4th ed., W.B. SaundersCompany, Philadelphia, 486 p.
Jubb, K.V.F., Kennedy, P.C. and Palneg, N.1984. Pathology of DomesticAnimals. Vol.3. 3rd ed., AcademicPress Inc., California.
Mahato, G., Dutta, G.N. and Sharma, V.K. 2001.Hematological studies in tuberculinpositive bulls. Indian J. Vet. Med., 21:43
Prasad, H., Roy Choudary, R.K. and Phukan,A. 1996. Hematological changes intuberculous cows. Indian Vet. J., 73:209-211.
Samad, M.A. and Rahman, M.S. 1986.Incidence of bovine tuberculosis andits effect on certain blood indices indairy cattle of Bangladesh. Indian J.Dairy Sci., 39: 231-234.
Snedecor, G.W. and Cochran, W.G. 1980.Statistical Methods. 9th ed., Oxford-IBH Publishing Company, Calcutta.584 p.
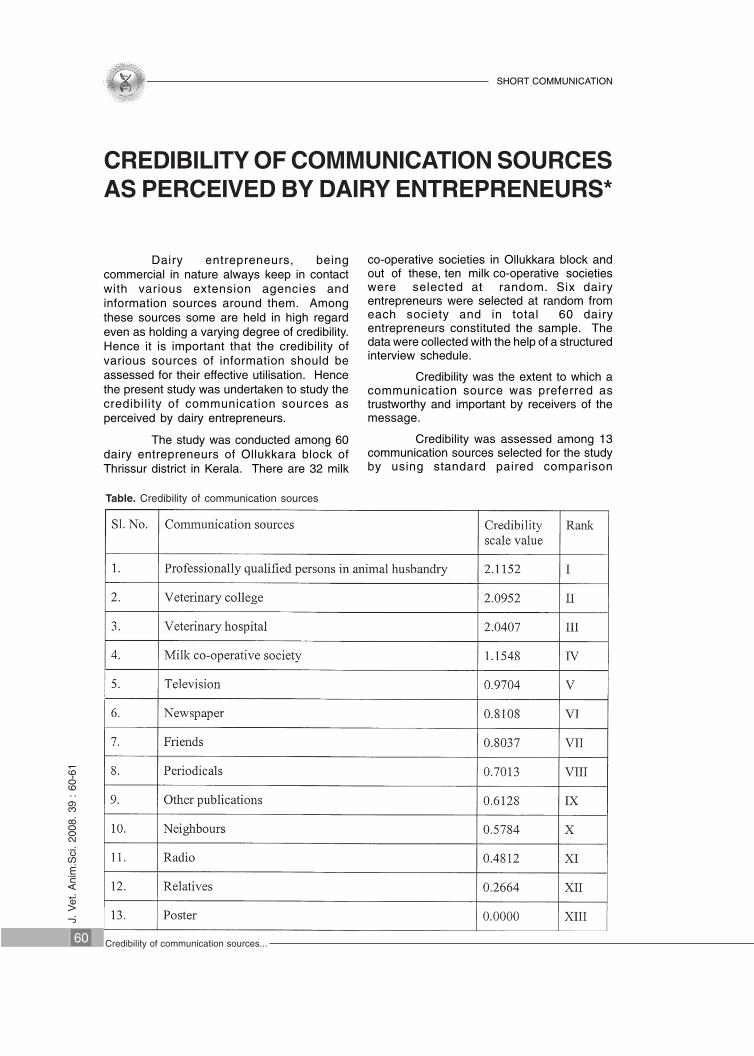
Table. Credibility of communication sources
CREDIBILITY OF COMMUNICATION SOURCESAS PERCEIVED BY DAIRY ENTREPRENEURS*
Dairy entrepreneurs, beingcommercial in nature always keep in contactwith various extension agencies andinformation sources around them. Amongthese sources some are held in high regardeven as holding a varying degree of credibility.Hence it is important that the credibility ofvarious sources of information should beassessed for their effective utilisation. Hencethe present study was undertaken to study thecredibility of communication sources asperceived by dairy entrepreneurs.
The study was conducted among 60dairy entrepreneurs of Ollukkara block ofThrissur district in Kerala. There are 32 milk
co-operative societies in Ollukkara block andout of these, ten milk co-operative societieswere selected at random. Six dairyentrepreneurs were selected at random fromeach society and in total 60 dairyentrepreneurs constituted the sample. Thedata were collected with the help of a structuredinterview schedule.
Credibility was the extent to which acommunication source was preferred astrustworthy and important by receivers of themessage.
Credibility was assessed among 13communication sources selected for the studyby using standard paired comparison
J. V
et. A
nim
.Sci
. 20
08.
39 :
60-
61
60 Credibility of communication sources...
SHORT COMMUNICATION

J. V
et. A
nim
.Sci
. 20
08.
39 :
60-
61
61C.A. Pradeep and P.J. Rajkamal
technique developed by Thurstone (1927).Maximum possible number of pairs with thecommunication sources selected was arrivedat by using the formula suggested by Edwards(1957).
n (n-1)
Number of pairs = –––––––
2
N = total number of communication sourcesselected for the study.
The respondents were asked toidentify the source from each pair, which theyjudge as more credible than the other. Basedon the judgement of respondents, the F, P andZ matrices were constructed as suggested byEdwards (1957) to arrive at the credibility scalevalue of each of the selected communicationsource. Scale value was taken as the basisfor credibility ranking.
It could be seen from the table thatprofessionally qualified persons in animalhusbandry were perceived as the most crediblesource which was followed by institutionalsources like Veterinary College, VeterinaryHospital and milk co-operative society. Theywere followed by television, newspaper,friends, periodicals, other publication,neighbours, radio, relatives and finally posters.
The first three most important andtrustworthy sources mentioned were otherprofessionally qualified persons in animalhusbandry, Veterinary College and VeterinaryHospital. This indicated that dairyentrepreneurs recognosed importance oftechnically competent personnel. The resultsthat technical experts are highly credible tofarmers agreed with the findings of Chole andRabudkar (1975), Kalamegam and Menon(1977), Vijayaraghavan and Subramaniyan(1981). Other professionally qualified personsincluded retired veterinary personnel whorendered service to dairy farmers in the studyarea. Such persons were mostly those retiredfrom the College of Veterinary and AnimalSciences, located in the study area. At thesame time, some other important mediasources such as radio, poster and otherpublications were observed to becomparatively less credible probably becausethey were impersonal media.
Summary
Dairy entrepreneurs perceivedtechnical experts as the most credible sourcesof information available to them. It was followedby instituitional sources like Veterinary Collegeand Veterinary Hospital. Nevertheless,credibility of communication sources such asradio, poster and other publications should beenhanced by giving right information at the righttime.
Acknowledgement
The authors are thankful to the Dean,College of Veterinary and Animal Sciences,Mannuthy for the facilities provided to conductthe study.
References
Chole, R.R. and Rabudkar, W.B. 1975. Sourcecredibility pattern among small andbig farmers. Indian J. Extn. Edn., 14:50-53.
Edwards, A.L. 1957. Technique of attitudescale construction. Vakils Feffer andSimons Pvt. Ltd., Bombay
Kalamegam, E.V. and Menon, K.R. 1977.Communication behaviour of smallfarmers in a progressive and lessprogressive village. Indian J. Extn.Edn., 12: 37-41.
Thurstone, L.L. 1927. A law of comparativejudgement. Psychological Review,34: 273-286.
Vijayaraghavan, K. and Subramaniam, V.S.1981. Information source credibilityof gardenland and dryland farmers.Indian J. Extn. Edn., 17: 92-94.
* Part of M.V.Sc. thesis submitted by the first author to the Kerala Agricultural University, Thrissur1. Veterinary Surgeon, AHD, Kerala2. Professor and Head
C.A. Pradeep1 and P.J. Rajkamal2
Department of Veterinary and Animal Husbandry ExtensionCollege of Veterinary and Animal SciencesMannuthy - 680 651, Thrissur, Kerala
�
SHORT COMMUNICATION

SHORT COMMUNICATION
Fig. Parts of foetus with anasarca
DYSTOCIA DUE TO FOETAL ANASARCA WITHASCITES IN A SHEEP- A CASE REPORT
Foetal anasarca with ascites is seenmost commonly in cattle and may affect thesheep (Roberts, 1971). Various congenitalabnormalities affecting intrauterine foetuses infarm animals have been reported (Arthur et al.,1996). However, such incidences in sheep areoccasional (Roberts, 1971). The present articlereports a case of dystocia due to foetalanasarca with ascites in a sheep.
A full term pregnant two year old non-descript sheep was brought to the VeterinaryCollege and Research Institute Hospital,Namakkal with history of straining since 24 hand difficulty in delivery of the foetus. Therupture of amnion was noticed 12 h back. Thesheep was active and alert. Per vaginalexamination following lubrication with cetrimidecream revealed a fully dilated cervix, dryvaginal passage and the presence of foetalhead in the birth canal. Examination of thefoetus revealed subcutaneous oedema of theentire body indicating foetal anasarca alongwith fluid accumulation in the abdominal cavity(foetal ascites). Puncture of the foetal abdomenand traction did not help to deliver the foetus.Since oedema was severe, both the fore limbswere separated from the body of the foetus byusing embryotomy knife followed byevisceration. Both the hind limbs wereseparated at the level of acetabulum byembryotomy knife and removed. Finally thepelvis was removed by traction manually.Therefore, total foetotomy was performed toremove the entire parts of the foetus from theuterus (Fig.). The foetal membranes wereseparated and two boli of uromet were placedin the uterus. The foetal membranes werefound to be oedematous. Following foetaldelivery, the dam was administered with 150mg of Enrofloxacin (i/m), intravenous fluids(250 ml 5% Dextrose normal saline) and anti-inflammatory drug (Meloxicam 2ml: i/m) for
three days. Tetanus toxoid (i/m) was injectedimmediately following fetal delivery. Uneventfulrecovery of the dam was noticed.
Foetal anasarca is the result of adisturbance of fluid exchange and may be ofplacental origin. In mild cases the foetus maybe delivered by traction. Multiple incisions intothe oedematous parts of foetus to drain theliquid or the removal of limbs is recommendedwhenever traction failed (Roberts, 1971). In thepresent case total fetotomy was performed bythe obstetrician since the condition was severe.Caesarean section is usually chosen when thefoetus is inaccessible in cattle (Sloss and Duffy,1980). In this case foetal anasarca wasassociated with ascites. The probable causesof foetal anasarca are hereditary predispositiondue to autosomal recessive genes (Arthur etal., 1996) especially affecting normalembryonic lymph node development(Tamizharasan et al., 2008). The lesions
J. V
et. A
nim
.Sci
. 20
08.
39 :
62-
63
62 Foetal anasarca with ascites...
observed in the foetus were similar to thosedescribed by Arthur et al. (1996) in ananasarcous foetus of cattle.
Summary
A total fetotomy to relieve a dystociadue to foetal anasarca with ascites in a sheepis placed on record.
SHORT COMMUNICATION
1. Associate Professor and Head2. Assistant Professor3. Assistant Professor, Dept. of Clinics4. Assistant Professor5. Junior VAS, AHD, Tamil Nadu6. Associate Professor and Head, Dept. of Clinics7. Dean
M. Selvaraju1, M. Palanisamy2,K. Ravikumar3,V. Prabaharan4, R. Ravi5,R. Ezakial Napolean6 and C. Chandrahasan7
Department of Animal Reproduction, Gynaecologyand ObstetricsVeterinary College and Research InstituteNamakkal – 637 002
J. V
et. A
nim
.Sci
. 20
08.
39 :
62-
63
63M. Selvaraju et al.
�
References
Arthur, G.H., Noakes, D.E., Pearson, H andParkinson, T.J. 1996. VeterinaryReproduction and obstetrics. 7th ed.,W.B. Sauders Co. Ltd., Philadelphia.131 p.
Roberts, S.J. 1971. Veterinary obstetrics andGenital diseases, 2nd ed. CBSPublishers and distributers, NewDelhi. 283 p.
Sloss,V. and Duffy, J.H.1980. Handbook ofbovine obstetrics, Williams andWilkins, Baltimore, USA. 121 p.
Tamizharasan, S., Babu prasath, N.,Balachandran, C., Vairamuthu, S. andThirumurugan, R. 2008. Fetalanasarca in a sheep. Indian Vet. J.,85: 897-898.

MAMMARY FIBROADENOMA IN A CALF– A CASE REPORT
Mammary fibroadenoma is a benigntumour consisting of a mixture of luminalepithelial and stromal cells, and sometimesadmixed with myoepithelial cells. It is fairlycommon in cats and dogs (Misdrop et al.,1999). However spontaneous mammarytumours are extremely rare in other species.Mammary adenoma in bovines has beenreported in a young Holstein cow (Mina et al.,1994) and a heifer (Thibault et al., 1997). Thetumours are typically seen as soft,circumscribed or somewhat flat appearinggrowth that are movable on palpation, or afirmly attached growth (seen more inmalignancy) anywhere along the region ofmammary tissue. This paper reports the
diagnosis of a case of mammary fibrodenomain a calf.
A female calf aged four months waspresented at the University Veterinary Hospital,Mannuthy with a history of enlargement ofwhole udder since one and a half month (Fig.1).
Clinical examination revealed normaltemperature, respiration and pulse. Onpalpation of udder, a hard mass could be felt.An opaque watery secretion from teats wasnoted. Ultrasonography, histopathology ofbiopsy material from udder tissue andexfoliative cytology of secretion was carriedout for confirmatory diagnosis.
J. V
et. A
nim
.Sci
. 20
08.
39 :
64-
65
64 Mammary fibroadenoma...
SHORT COMMUNICATION
Fig.1. A female calf with enlargement of udder Fig.2. Ultrasonogram showing highly vascular udder tissue
Fig.3. Ultrasonogram showing grape sized ovary Fig.4. Histopathological section of udder showinghyperplastic mammary glands lined by low columnar tocuboidal epithelium H&EX100

1. Veterinary Surgeon, AHD, Kerala2. Associate Professor, Dept. of Clinical Veterinary Medicine3. Since deceased4. Veterinary Surgeon, AHD5. Associate Professor, Dept. of Veterinary Epidemiology & Preventive Medicine6. Professor and Head, Dept. of Veterinary Epidemiology & Preventive Medicine
K.N. Nimisha 1, Usha N. Pillai2,Premni Elias3, Reji Varghese4,P.V. Tresamol5 and M.R. Saseendranath6
College of Veterinary and Animal SciencesMannuthy-680 651,Thrissur, Kerala
�
J. V
et. A
nim
.Sci
. 20
08.
39 :
64-
65
65K. N. Nimisha et al.
SHORT COMMUNICATION
Exfoliative cytology of secretion fromteats revealed neoplastic cells. Ultrasonogramshowed highly vascular udder tissue (Fig.2)and ovary of the size of a grape with anechoiccore (Fig.3). Macroscopic examination ofbiopsy specimen revealed fibrous appearancewith slimy feel. Gulbahar et al. (2007) describedsimilar findings in a three month old lamb withmammary fibroadenoma. Histopathologicalexamination of udder tissue revealed,hyperplastic mammary glands lined by lowcolumnar to cuboidal epithelium (Fig.4).Stroma consisted of hyperplasticfibrocollagenous tissue with scatteredlymphocytic and plasma cellular infiltration.These findings are in accordance with that ofThibault et al. (1997) and Gulbahar et al.(2007). Based on these results the case wasconfirmed as mammary fibroadenoma. As theowner was not interested in treatment of thecase, no treatment was suggested.
Summary
A case of mammary fibroadenoma ina female calf of four months of age and itsdiagnosis by ultrasonography, histopathologicalexamination and exfoliative cytology arediscussed.
References
Gulbahar, M.Y., Guvenc, T., Yarim, M., Kabak,Y.B. and Sozen, Y. 2007. Mammaryfibroadenoma in a lamb. J. Vet. Sci.,8: 423-425.
Mina, R.B., Uchida, K., Sakumi, A., Yamaguchi,R., Tateyama, S. and Ogawa, H.1994. Mammary fibroadenoma in ayoung Holstein cow. J. Vet. Med. Sci.,56: 1171-1172.
Misdrop, W., Else, R.W. and Lipscomb, H.T.P.1999. Histological classification ofMammary Tumours of the dog andcat. 2nd Series. Vol.7, Armed ForcesInstitute of Pathology, WashingtonD.C., pp. 11-29.
Thibault, S., Mikaelian, I., Dbrruil, P., Drolet,R. and Couture, Y. 1997. Mammaryfibroadenoma in a heifer. Can. Vet.J., 38: 785-786

INSTRUCTIONS TO CONTRIBUTORS
Papers are accepted for publication on the understanding that they have neither been publishednor are being considered for publication elsewhere. The concurrence of all authors for publication ofthe article is necessary.
All authors must subscribe the journal for one year.
Original research papers, clinical articles and short communications are accepted forpublication.
Two copies of the article and a soft copy on a CD should be sent to the Managing Editor. Thecopies of the article should be typewritten (double space) on one side of A4 bond paper with a marginof three cm on left hand side.
The papers on completed original research, must be concise and not exceeding eight typed pages.The bulk of paper should record the actual work done by the author (s).
The article should be headed with the full title, initials and surnames of all authors and the nameand address of the institution. A shortened version of the title (running title) should be furnished. Serialtitles are not acceptable. Each author should be superscribed with numbers which should beexplained as a foot note at the end of first page itself in italics. Phone number and email id of corre-sponding author are to be given.
The format for paper should be title, author(s), abstract (about 50 words), keywords, a shortrunning title, introduction (without heading), materials and methods, results and discussion,acknowledgement if any and references. The results and discussion should be combined to avoidrepetition. The abstract and key words must be in italics.
Authors are requested to expand each scientific abbreviation at its first occurrence in the text. eg.Complement Fixation Test (CFT). The abbreviation presented in “System internationale” for Units andSymbols should be adopted.
The references should be listed at the end of the paper in alphabetical order together with theinitials of names. The author(s) name, the year of publication, title of the article, name of the journal,volume and page numbers should be included in the form: Shameem. H., Subramanian. H.,Devada. K. and Lucy Sabu. 2010. Anticoccidial effect of certain herbal formulations in chicken coc-cidiosis. J.Vet.Parasitol. 24: 79 - 81. Abbreviation for the title of the journal should be in accordancewith the “World list of scientific periodicals”.
Tables should be typed at appropriate place in the text with only essential data. The size of thetable and graphs as far as possible should be adjusted for double column printing. The illustration/photographs should be on separate sheets. Each should bear the author’s name and figure number inpencil on the back. Photograph should be unmounted glossy prints suitable for reproduction. Colourillustrations are accepted. Captions and legends should be typed separately from theillustrations and numbered.
Short communications should not exceed a maximum of three typed pages. They may have asummary, but no other division. It should not contain more than two tables or figures.
Papers will be subjected to editorial revision that may be dictated by the general rules governingthe presentation in the journal. The Editorial board retains the right to accept the papers and no reasonwill be given in case of non-acceptance of articles.
All correspondences pertaining to the journal should be addressed to the Managing Editor, Journalof Veterinary & Animal Sciences, College of Veterinary & Animal Sciences. Mannuthy,Thrissur - 680 651, Kerala, India. You can reach the editor at [email protected] as well.
JOURNAL OF VETERINARY AND ANIMAL SCIENCES
MANAGING EDITOR