jpmorgan chase & co. (jpm) september 16,...
TRANSCRIPT

Important disclosures appear on the last page of this report.
The Henry Fund
Henry B. Tippie School of Management
Bernardo Daza [[email protected]]
JPMorgan Chase & Co. (JPM) September 16, 2015
Financial Services – Money Center Banks Stock Rating Hold
Investment Thesis Target Price $64-$71 JP Morgan Chase & Co. delivered expected earnings levels for the last six quarters with a solid revenue growth and a leading position among Money Center Banks in its Investment Banking and Asset Management segments. The company faces the challenge of a low interest rate environment in its Community & Consumer banking segment, but has responded well and attempted to offset this trend by reducing costs. A positive U.S. macroeconomic environment led to better credit quality and lower loan provisions. These estimations, analysis and margin of safety below 15% during the stock valuation, lead to recommend a hold rating. Drivers of Thesis
Asset Management Segment fees will continue growing at a steady pace of approximately 1.5% YOY and JPM will continue gaining market share from competitors.
Low interest rates are still originating reasonable deposit costs which will maintain current net interest margin (2.3%) but it will not exceed pre-crises performance.
Investment Banking fees will continue growing and JPM will maintain its market share in the segment.
Improvement in asset quality and decreasing loan loss provisions as forecasted in model.
Risks to Thesis
Decreasing earnings due to downturn in economy, specifically in the Consumer and Commercial banking segments.
High cost of deposits accompanied by low yield on loans causing a decrease on interest margin and interest spread
Henry Fund EDCF $66.20 Henry Fund DDM $64.80 Relative Multiple P/E $73.70 Relative Multiple P/B $66.40 Price Data Current Price $63.48 52wk Range $50.07 – 70.61 Consensus 1yr Target $74.64 Key Statistics Market Cap (B) $235.60 Shares Outstanding (M) $3,698 Institutional Ownership 77.2% Beta 1.34 Dividend Yield 2.8% Est. 5yr Growth 7.9% Price/Earnings (TTM) 11.47 Price/Earnings (FY1) 11.60 Price/Book (mrq) 1.10 Price/Tangible Book 1.20 Profitability Net Interest Margin 2.19% Net Interest Spread 2.04% Return on Assets (TTM) 0.90% Return on Equity (TTM) 9.84% Source: FactSet
Earnings Estimates Year 2012 2013 2014 2015E 2016E 2017E
EPS $5.22 $4.39 $5.34 $6.34 $6.73 $7.45
growth 15.85% -15.93% 21.70% 18.73% 6.16% 10.76%
12 Month Performance Company Description
Source: FactSet
JPMorgan Chase & Co. is considered a Money Center Bank given its size and presence around the globe. The company has 240,000 employees and operates over 5,600 branches worldwide. JPM develops its operations among four main business lines: Consumer & Community Banking, Corporate & Investment Banking, Commercial Banking and Asset Management.
11.6 9.8
0.9
16.2
11.7
0.9
15.8
9.0
1.0 0.0
5.0
10.0
15.0
20.0
P/E ROE ROA
JPM Fin. Conglomerates Sector
-20%
0%
20%
S O N D J F M A M J J A
JPM S&P 500
Page 2
EXECUTIVE SUMMARY JP Morgan Chase & Co. delivered expected earnings levels for the last six quarters with a leading position among Money Center Banks in its Investment Banking and Asset Management segments. The company faces the challenge of a low interest rate environment, specifically in its Consumer banking segment. This trend led to decreasing revenue in that segment. As the economy continues to gain traction in the U.S. mainly due to strong employment, positive consumer confidence and other industry factors such as growing M&A activity and growing assets under administration; given these trends, JPM is likely to continue showing growing earnings that will meet and beat market expectations. Among some of the company’s challenges and keys to monitor are: increased competition, lower prices on mortgage loans in a still low interest rate environment, asset quality and more rigorous regulation coming from the Federal Reserve, the Federal Deposit Insurance Corporation, the Consumer Protection Financial Bureau and other states regulatory agencies.
COMPANY DESCRIPTION
JPMorgan Chase & Co. is a large, global Money Center Bank. The company has 240,000 employees and operates over 5,600 branches worldwide. JPM develops its operations among four main business lines: Consumer & Community Banking, Corporate & Investment Banking, Commercial Banking, and Asset Management. JPM is the largest bank in the United States, and the world's fifth largest bank by total assets; with total assets of US$2.6 trillion. i It is a major provider of financial services, and according to Forbes magazine is the world's third largest public company based on a composite ranking. The hedge fund unit of JPMorgan Chase is the second largest hedge fund in the United States. ii JP Morgan Chase & Co. was formed in 2000, when Chase Manhattan Corporation merged with J.P. Morgan & Co.
Business Segment Overview
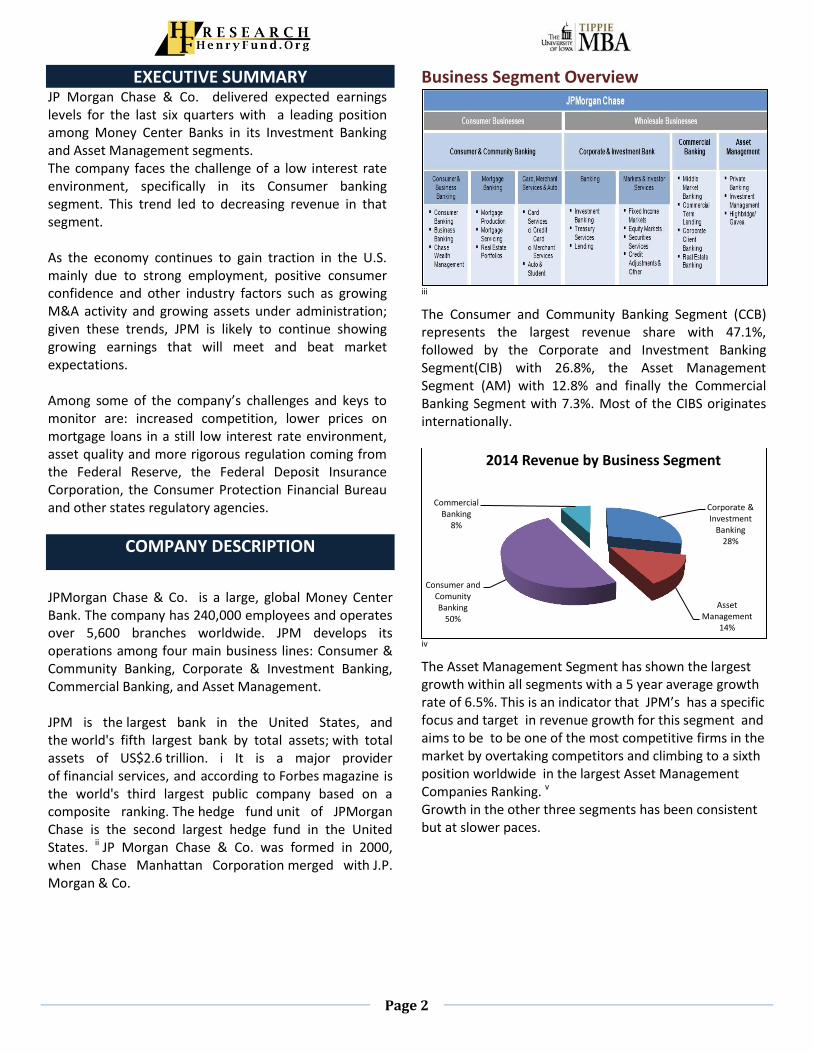
iii The Consumer and Community Banking Segment (CCB) represents the largest revenue share with 47.1%, followed by the Corporate and Investment Banking Segment(CIB) with 26.8%, the Asset Management Segment (AM) with 12.8% and finally the Commercial Banking Segment with 7.3%. Most of the CIBS originates internationally.
iv The Asset Management Segment has shown the largest growth within all segments with a 5 year average growth rate of 6.5%. This is an indicator that JPM’s has a specific focus and target in revenue growth for this segment and aims to be to be one of the most competitive firms in the market by overtaking competitors and climbing to a sixth position worldwide in the largest Asset Management Companies Ranking. v Growth in the other three segments has been consistent but at slower paces.
Corporate & Investment
Banking 28%
Asset Management
14%
Consumer and Comunity Banking
50%
Commercial Banking
8%
2014 Revenue by Business Segment

Page 3
Revenue by Geography
vi
vii Most of the bank’s revenue is originated in the United States (74.4%), specifically from the Community and Consumer Banking Segment where JPM is strong and has the majority of its assets allocated. On the other hand, the Asset Management Segment and the Corporate & Investment Banking Segment generate most of its earnings from international clients and institutions. This is an interesting trend that might help diversifying the risk for country specific economic turndowns.
Consumer & Community Banking (CCB) This business segment comprises different business units such as Consumer Banking, Business Banking, Chase Wealth Management, Mortgage Production, Mortgage Services, Auto and Students Loans, Credit Cards and Card Services. This segment offers the most traditional banking services and products mainly to individual customers and small businesses. JPM operates over 5,600 branches. The number of branches is directly associated with the CCB business operations. The CCB segment serves approximately half of the U.S. households (58Million) and 3.9 million small businesses. viii
ix Historically, about 56.5% of total JPM’s loans have been allocated into this business segment and we forecast this trend continuing since this segment represents most of the bank’s revenue and it also represents the highest interest yield for the company given the nature of the personal and small businesses loans. An important metric for this business segment is customer satisfaction. JPM has been successful at this, ranking #1 in Customer Satisfaction according to The American Customer Satisfaction Index. x This is relevant in order to avoid customer churn and to avoid losing market share against competitors. It is especially relevant for a mature and fragmented industry such as banking. JPM has showed solid growth in deposits. The Federal Deposit Insurance Corporation (FDIC) named the company #1 in deposit growth among the largest 50 U.S. banks. This is an important source for funding, especially given the still low interest rate environment in the U.S. Although revenue decreased in loans from this segment specifically due to a slower mortgage market derived from a challenging rate environment, JPM has been successful in reducing expenses. Since 2012 the CCB segment decreased $3.2 Billion in expenses and the target is to reduce additional $2 Billion by 2016 xi We forecast this cost reduction in our valuation model. The plan is to reduce the number of branches in determined locations by 300 and to reduce the number of employees. This is an effort to increase efficiency between the business segment that is also possible because of the clients’ tendency to do business transactions online and to leverage on technology. Allowances for loan losses have been decreasing at an average rate of 14% for the past 5 years and after the financial crisis. We forecast that these allowances and change-offs will maintain its current low rate (2% of total loans) given the U.S. stable macroeconomic conditions and low unemployment rates.
2012 2013 2014 2015 2016 2017 2018 2019 2020
Total consumer loans 292,620 289,063 295,374 303,644 313,361 323,389 333,737 344,417 359,915
Credit card 127,993 127,791 131,048 134,193 138,219 142,366 146,636 151,036 155,567
Total CCB Loans 420,613 416,854 426,422 437,838 451,580 465,754 480,374 495,452 515,482
Percentage of Total Loans 57.32% 56.45% 56.31% 56.28% 56.24% 56.18% 56.07% 55.93% 55.82%

Page 4
Corporate & Investment Bank (CIB) Corporate and Investment Banking revenue consists on Fixed Income, Equities, Securities Services, Treasury Services, Lending and Investment Banking fees. For simplicity we divide this revenue among Underwriting Services and Advisory Services.
xii Historically, revenue from this business segment is represented by 75% from Underwriting and 25% originating from Advisory Services. We forecast that this share will continue for the next years. In 2014, approximately 50% of revenue from this business segment came from the U.S. transactions, but there is an increasing trend and market growth coming especially from the EMEA and APAC regions. We foresee this trend continuing and also bringing more revenue from developing countries entering the capital markets for raising funds. We forecast a 1.5% YOY increase from 2015-2020. Investment Banking Revenue Growth by Region
xiii
M&A Global Activity
xiv
M&A activity has been stronger during 2012-2014 and we forecast growth over the next years. M&A activity has not come back to pre-crisis numbers but it is showing a growing tendency. JPM’s CIB client base is about 7,200; most of them being part of the Fortune 500 ranking. It is truly a global business unit, being present in over 60 countries. There is also a strong cost reduction effort in this business segment. Since 2010, CIB reduced office costs by more than $2 Billion. Management has set the target to reduce another $2.8 Billion in expenses in the next three years. As of July 2015, JMP had the largest world market share in investment banking fees at 8.6%. xv We forecast a similar scenario for JPM’s market share in the segment for the years to come. We also forecast a YOY total CIB market growth at 1.5%.
Commercial Banking (CB) The Commercial Banking segment delivers extensive industry knowledge, local expertise and dedicated service to U.S. and U.S. multinational clients, including corporations, municipalities, financial institutions and nonprofit entities with annual revenue generally ranging from $20 million to $2 billion. This business segment is divided into 4 client segments: Middle Market Banking (corporate, municipal and nonprofit clients), Corporate Client Banking, Commercial Term Lending (real estate investors/owners), Real Estate Banking (investors and developers of institutional-grade real estate investment properties). xvi Commercial banking leverages on the capabilities of the Corporate & Investment Banking segment. Wholesale Loans are divided among these business units and other

Page 5
wholesale loans for high-net-worth from the Asset Management Segment.
Historically, about 43.5% of total JPM’s loans have been allocated into this business segment and we forecast this trend continuing. These types of loans require a more personalized attention from specialized bankers and service costs are larger than those of the Consumer Banking segment. JPM is expanding its Commercial Banking services by expanding its geographical footprint in 34 new markets globally and focusing on key industries. This expansion increased revenues by $327 million and the long-term goal is to increase it by $1 Billion. xvii These efforts are important in order to create growth and attract new market segments that were not targeted before. By selecting well their customers and key industries in this business segment, JPM has been able to achieve lower Non-Performing Loans and Net Charge-Offs that its peers. This is a great competitive advantage that derives from great market intelligence techniques. Non-Performing Loans & Net Change-Offs
xviii
Asset Management (AM) This business segment offers investment management across all major asset classes including equities, fixed income, alternatives and money market funds. JPM also provides retirement products and services, brokerage and banking services including trusts and estates, loans, mortgages and deposits. The Asset Management segment clients include institutions, high-net-worth individuals and retail investors. xix
JPM’s total assets under supervision have grown at an average rate of 6.5% for the last five business periods and at a rate of roughly 2% in 2014. We forecast a 2.5% growth in average for future business periods. This business unit is one of the most competitive in the industry with a network of over 600 portfolio managers and 300 research analysts and market strategists. These capabilities and a great commercial effort translate into solid and sustainable revenue growth in the segment.
xx
Company Analysis For Q1, Q2 and Q3-2015, JPM showed increasing earnings that have exceeded growth expectationsxxi like in years previous the last economic downturn and financial crisis. The stock price been has developed an increasing trend since the starting of the economy recovery. EPS Consensus Estimates
xxii The company has a strong dividend pay-out policy to shareholders due to the increasing earnings and its dividend pay-out policy. Moreover, post 2008-2009 crisis, JPM has increased its dividends per share due to solids financial performance. Dividend per share growth averages 17% since 2010-2014. Although, something to be aware of regarding this dividend paying policy, are regulations and the capability of the company to achieve minimum Equity/Assets ratios imposed by regulators and specifically the Basel III requirements.
2012 2013 2014 2015 2016 2017 2018 2019 2020
Total wholesale loans 313,183 321,564 330,914 340,180 351,406 363,353 376,434 390,362 407,928
Percentage of Total Loans 42.68% 43.55% 43.69% 43.72% 43.76% 43.82% 43.93% 44.07% 44.18%
Page 6
JPM Stock Price
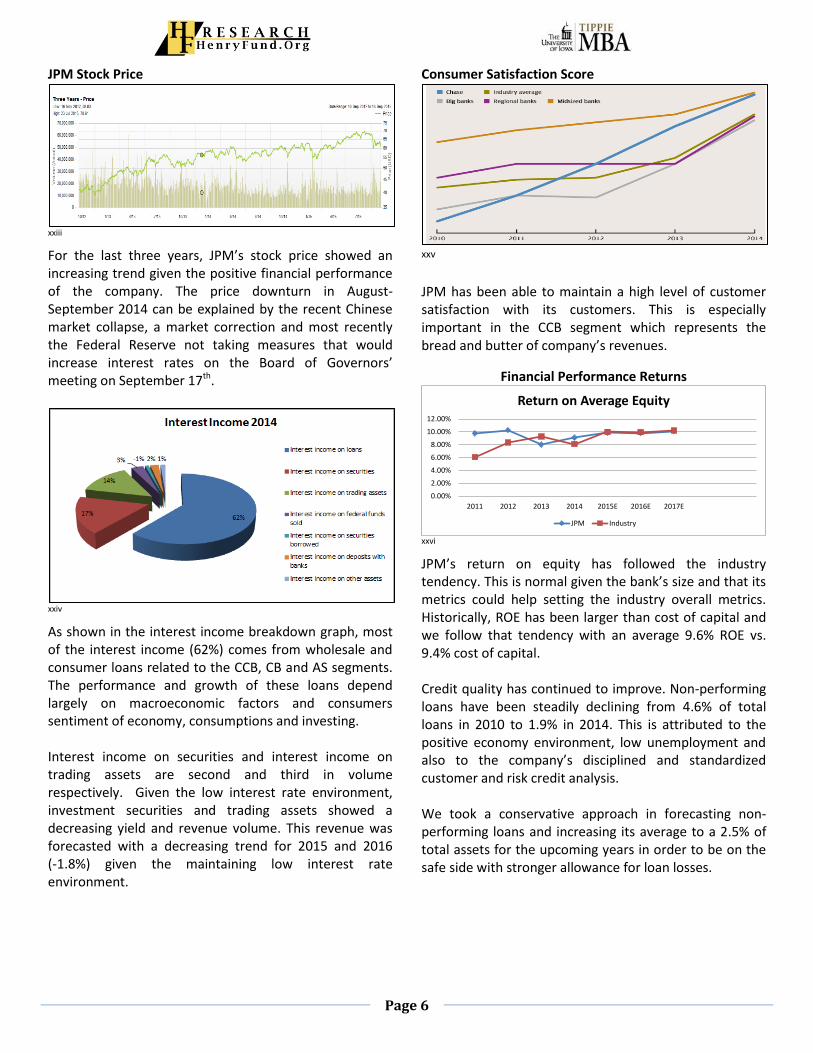
xxiii For the last three years, JPM’s stock price showed an increasing trend given the positive financial performance of the company. The price downturn in August-September 2014 can be explained by the recent Chinese market collapse, a market correction and most recently the Federal Reserve not taking measures that would increase interest rates on the Board of Governors’ meeting on September 17th.
xxiv As shown in the interest income breakdown graph, most of the interest income (62%) comes from wholesale and consumer loans related to the CCB, CB and AS segments. The performance and growth of these loans depend largely on macroeconomic factors and consumers sentiment of economy, consumptions and investing. Interest income on securities and interest income on trading assets are second and third in volume respectively. Given the low interest rate environment, investment securities and trading assets showed a decreasing yield and revenue volume. This revenue was forecasted with a decreasing trend for 2015 and 2016 (-1.8%) given the maintaining low interest rate environment.
Consumer Satisfaction Score
xxv
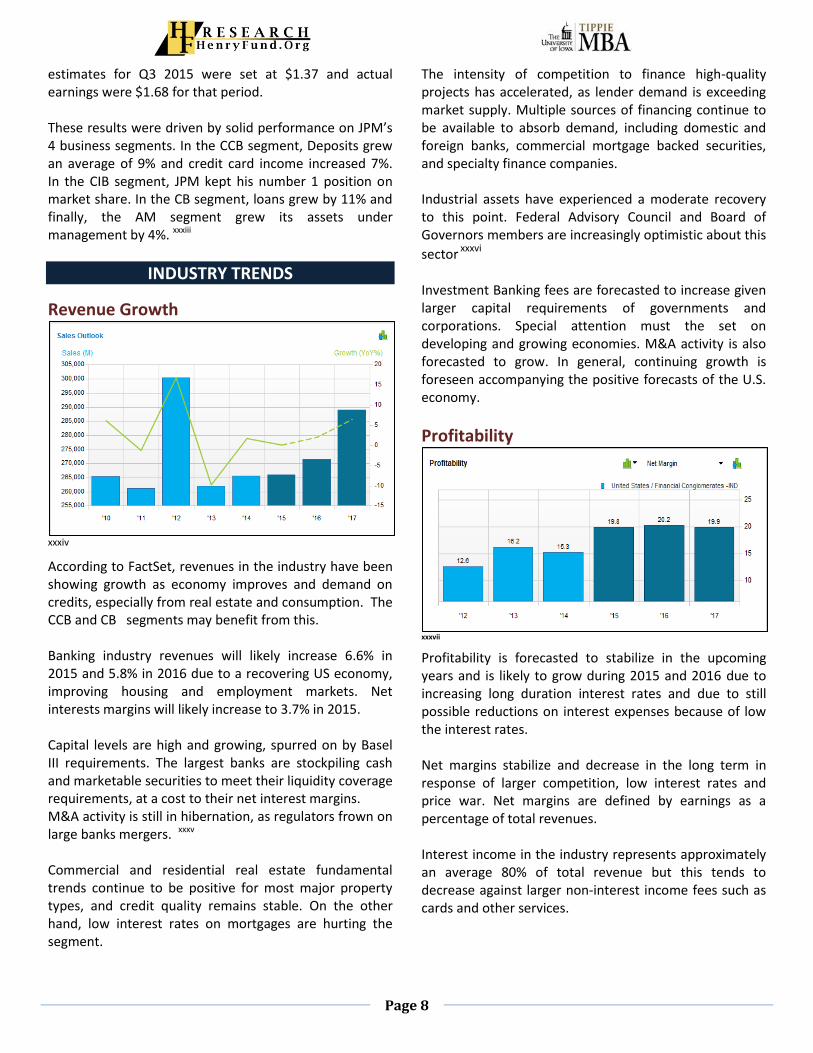
JPM has been able to maintain a high level of customer satisfaction with its customers. This is especially important in the CCB segment which represents the bread and butter of company’s revenues.
Financial Performance Returns
xxvi JPM’s return on equity has followed the industry tendency. This is normal given the bank’s size and that its metrics could help setting the industry overall metrics. Historically, ROE has been larger than cost of capital and we follow that tendency with an average 9.6% ROE vs. 9.4% cost of capital. Credit quality has continued to improve. Non-performing loans have been steadily declining from 4.6% of total loans in 2010 to 1.9% in 2014. This is attributed to the positive economy environment, low unemployment and also to the company’s disciplined and standardized customer and risk credit analysis. We took a conservative approach in forecasting non-performing loans and increasing its average to a 2.5% of total assets for the upcoming years in order to be on the safe side with stronger allowance for loan losses.
0.00%
2.00%
4.00%
6.00%
8.00%
10.00%
12.00%
2011 2012 2013 2014 2015E 2016E 2017E
Return on Average Equity
JPM Industry

Page 7
xxvii We project an increasing ROA trend for the next upcoming periods, taking into consideration larger Net Income attributable to better company performance and increasing interest rates after 2015.
RECENT DEVELOPMENTS
U.S. Banks, in a majority have reported stronger credit and borrowings quality trends over 2010-2014. Banks reported stronger loan growth in 2014 than in any of the past 5 years and expect continued growth in 2015. Consumer confidence in particular has improved, with very strong spending in the fourth quarter of 2014. Consumer borrowing demand, with the exception of auto lending, has not fully reflected this increased confidence. Overall credit structures continue to loosen and credit spreads continue to tighten, as competition for good loans intensifies. Supply of credit continues to outpace
demand. xxviii In the industry, nonperforming loans have continued to decrease. Write-offs of nonperforming loans also have continued to fall. These facts have allowed banks to reduce its reserves to cover the losses from
nonperforming loans. xxix
2014 Industry Earnings The industry reported slightly higher earnings in 2014 compared to the previous year, but with a slower growth rate because of maintaining lower Net Interest Margins and fierce competition which is still driving interest spreads lower than pre-crisis times. According to S&P Capital IQ, “Q4 banking earnings, in total are down about 3% from a year ago. However, we keep a positive outlook for these shares, as we see their loan growth and capital levels benefiting from an improving U.S. economy.”xxx This report supports the stated theory behind lower interest rates with the consensus of the analysts in the industry.
Industry Revenue Growth
xxxi
In the industry, earnings growth as a total in 2014 compared with the previous year have decreased but revenue growth has increased; meaning that the overall industry expectations for earnings growth have not been met once again because of competition, costs and low interest margins. It can be analyzed from the data in the table above, that economic recovery from the 2008 financial crisis has been slow but steady and that no aggressive growth trend like in pre-crisis times can be expected in the future.
Low interest rates in the U.S. On Thursday, September 17th, the Federal Reserve Board of Governors decided to keep the benchmark interest rates pegged at 0%-0.25%. This interest rate has not been modified since December 2008 as reaction to the Financial Crisis. The Federal Reserve Committee stated that this decision is to support continued progress toward maximum employment and price stability. In determining how long to maintain this target range, the Committee will assess progress both realized and expected toward its objectives of maximum employment and 2 percent inflation.xxxii The current low interest environment can be still expected until major macroeconomic changes happen in the U.S. This means that the industry dynamics will remain as they have been on recent years. In one hand, low cost of funding can be expected, but also, low interest yield in loans and securities will prevail.
JPM Earnings Q1, Q2 and Q3 2015 JPM beat earnings estimates for Q1, Q2 and Q3 2015. Earnings estimates for Q1 2015 were set at $1.41 per share and actual earnings were $1.45 for that period. Also, earnings estimates for Q2 2015 were set at $1.44 and actual earnings were $1.54 for that period. Earnings
0.00%
0.20%
0.40%
0.60%
0.80%
1.00%
1.20%
1.40%
2011 2012 2013 2014 2015E 2016E 2017E
Return on Average Assets
JPM Industry
Page 8
estimates for Q3 2015 were set at $1.37 and actual earnings were $1.68 for that period. These results were driven by solid performance on JPM’s 4 business segments. In the CCB segment, Deposits grew an average of 9% and credit card income increased 7%. In the CIB segment, JPM kept his number 1 position on market share. In the CB segment, loans grew by 11% and finally, the AM segment grew its assets under management by 4%. xxxiii
INDUSTRY TRENDS
Revenue Growth
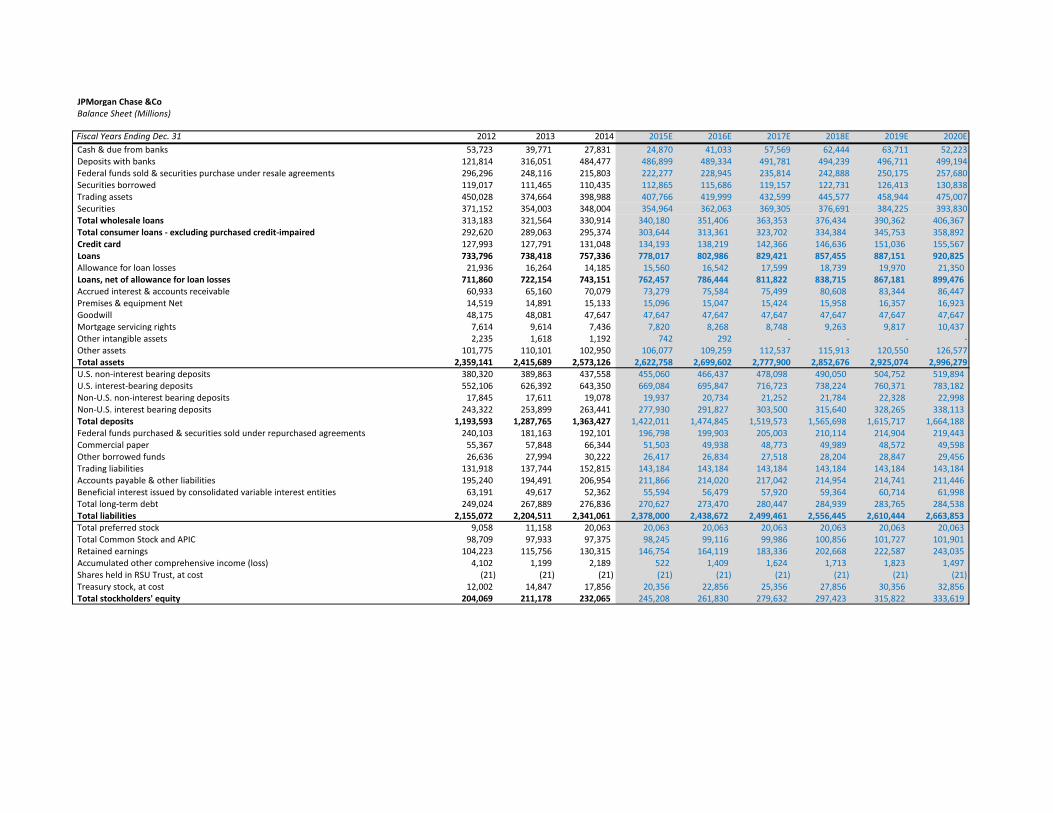
xxxiv
According to FactSet, revenues in the industry have been showing growth as economy improves and demand on credits, especially from real estate and consumption. The CCB and CB segments may benefit from this. Banking industry revenues will likely increase 6.6% in 2015 and 5.8% in 2016 due to a recovering US economy, improving housing and employment markets. Net interests margins will likely increase to 3.7% in 2015. Capital levels are high and growing, spurred on by Basel III requirements. The largest banks are stockpiling cash and marketable securities to meet their liquidity coverage requirements, at a cost to their net interest margins. M&A activity is still in hibernation, as regulators frown on large banks mergers. xxxv Commercial and residential real estate fundamental trends continue to be positive for most major property types, and credit quality remains stable. On the other hand, low interest rates on mortgages are hurting the segment.
The intensity of competition to finance high-quality projects has accelerated, as lender demand is exceeding market supply. Multiple sources of financing continue to be available to absorb demand, including domestic and foreign banks, commercial mortgage backed securities, and specialty finance companies. Industrial assets have experienced a moderate recovery to this point. Federal Advisory Council and Board of Governors members are increasingly optimistic about this
sector xxxvi
Investment Banking fees are forecasted to increase given larger capital requirements of governments and corporations. Special attention must the set on developing and growing economies. M&A activity is also forecasted to grow. In general, continuing growth is foreseen accompanying the positive forecasts of the U.S. economy.
Profitability
xxxvii
Profitability is forecasted to stabilize in the upcoming years and is likely to grow during 2015 and 2016 due to increasing long duration interest rates and due to still possible reductions on interest expenses because of low the interest rates. Net margins stabilize and decrease in the long term in response of larger competition, low interest rates and price war. Net margins are defined by earnings as a percentage of total revenues. Interest income in the industry represents approximately an average 80% of total revenue but this tends to decrease against larger non-interest income fees such as cards and other services.

Page 9
MARKETS AND COMPETITION
xxxviii This is a very fragmented and highly competitive industry. The 4 largest banks hold over 74.4% of market share. Market share is distributed with JPM holding 20.8%, Wells Fargo & Co. 18.8%, Bank of America 18.6% and Citigroup Inc. 16.2%. Competition is fierce especially among these 4 Money Center Banks. An approximate value for Banking total market size in the U.S. is $443 Billion.xxxix Other smaller players in the market and their market share are: SunTrust Banks (1.96%), Fifth Third Bancorp (1.5%), Citizens Financial Group (1.25%), MT Bank (1.1%), Northern Trust (1.05%) and Cadence Bancorp (1.05%). The basis for market segmentation in the consumer and commercial banking businesses is mostly geographic competition given the bank presence in the region. Due to acquisitions of competition, banks have been able to expand its geographic presence across different states. A common space for competition in the banking industry in general is Consumer and Commercial. The Consumer segment is specially a service-oriented business and banks are competing to attract individual consumers investing in large ATM networks, online banking, etc. JPM competes with other money center banks, regional banks, savings and loans, credit unions, finance, insurance and other non-depository companies operating in its market areas. The Bank is subject to substantial competition for loans and deposits from other financial institutions. Some of its competitors are not subject to the same degree of regulation and restriction as the Bank. If the Bank is unable to effectively compete in its
market areas, the Bank’s business, results of operations and prospects could be adversely affected. Competition is also increasing for deposit and lending services from internet-based competitors. Non-depository financial service institutions, primarily in the securities, insurance and retail industries, have also become competitors for retail savings, investment funds and lending activities. The primary factors in competing for loans are interest rates and rate adjustment provisions, loan maturities, loan fees, and the quality of service to borrowers and brokers.
Peer Comparisons
xl As noted in the peer comparison table above, JPM is trading at a similar P/B multiple (1.0x) than its peers (1.1x). The company also shows similar EPS and ROE numbers than its peers and industry average. Price to Tangible book is also in the same range as the industry average with no significant M&A activity since 2000. Higher ROA is indicator that the years of financial distress are behind since in the financial crisis period, it was normal for the industry to show ROA below 1%. Regulation The Basel Committee has suggested different measures in order to harmonize global bank regulation. For example, Basel II is based on 3 pillars: minimum capital requirements, supervisory review process and market discipline. After the 2008, the Basel Committee made changes again resulting in Basel III. It is focused on capital definitions, capital conservation buffers, leverage ratios and global liquidity standards.
EPS EPS
Ticker Company Market Cap (B) Price 2015E 2016E P/E 15 P/E 16 P/B 15 P/B 16
P/Tangible Book
Value 15
P/Tangible Book
Value 16
BAC-US Bank of America 167.4 16.0 1.4 1.6 11.1 10.0 0.7 0.7 1.0 0.9
BMO-CA Bank of Montreal (BMO) 60.01 (79.56) 79.6 6.6 7.1 12.0 11.2 1.2 1.2 1.6 1.6
BARC-GB BARCLAYS PLC 66.97 (43.36) 2.6 0.2 0.3 11.2 9.2 0.8 0.7 0.9 0.9
C-US Citi Group 155.0 51.1 5.6 6.0 9.1 8.5 0.7 0.7 0.8 0.8
DBK-DE DEUTSCHE BANK AG- 40.13 (35.36) 25.6 2.3 2.9 11.1 8.9 0.5 0.5 0.6 0.6
GS Goldman Sachs 80.2 185.3 17.7 19.9 10.5 9.3 1.0 1.0 1.1 1.0
MS-US MORGAN STANLEY 66.4 34.0 3.0 3.4 11.2 9.9 0.9 0.9 1.1 1.0
PNC-US PNC 46.4 90.4 7.3 7.8 12.4 11.7 1.1 1.0 1.4 1.3
STI-US SUNTRUST BANKS INC 31.8 39.5 3.3 3.5 11.8 11.2 0.9 0.9 1.3 1.2
UBSSG-CH UBS 79.67 (77.17) 20.1 1.5 1.7 13.5 12.1 1.4 1.3 1.6 1.6
USB-US U.S. Bancorp 72.3 41.1 3.2 3.5 12.8 11.7 1.8 1.6 2.4 2.1
WFC-US Wells Fargo 270.1 52.6 4.2 4.5 12.6 11.6 1.6 1.5 1.8 1.7
Average 11.6 10.4 1.1 1.0 1.3 1.2
JPM JPMorgan Chase &Co 231.4 $63.80 6.34 6.73 10.1 9.5 1.0 1.0 1.3 1.2

Page 10
xli It is inferred that the implementation of these rules will require modifying the type of assets that banks will hold. As a consequence, the length of the liabilities’ maturity will raise and the costs relating to this will have a similar effect, creating a drop in profitability. With banks facing tighter regulation, adjusting business models and attempting to engage into new drivers for revenue and higher earnings will be unlikely to happen as it was more usual the pre-2008 crisis. Also, the company shows Minimum Tier 1 capital of 11.6%, 11.9%, 12.6%, 12.3% for the 2014, 2013, 2012 and 2010 periods respectively, which is above Basel III
requirements. xlii
ECONOMIC OUTLOOK Interest Rates Maintain Low
xliii It was expected that interest rates would rise in September 2015, but this did not happen. It is seen for example that the 1-Yr Treasury bill maintains at a low 0.35% and it is also noticed that the 30 Year Bond interest increased from 2.75% at the end of December 2014 to 2.93% at mid-September 2015. This is not a significant change. The Henry Fund consensus is that interest rates of the 1-Yr Treasury bill will maintain low level of 0.36% for the next 6 months.
This trend is to keep affecting the net margin of the financial services institutions (19.6% - 5Yr Average) with a
slow growth tendency.xliv
Low interest rates in short maturities, help banks with low cost funding from deposits. This trend might not be the case for JPM due to the offsetting effect of investment in securities developing low interest returns for the money center bank in the mid to long term.
Fed funds have maintained at a low 0.25% and have not showed sign of increasing.
Better Unemployment Outlook
xlv
Unemployment has continued to improve and dropped from 6.6% in January 2014 to 5.1% in August 2015. This is coherent with the Henry Fund Consensus of unemployment averaging 5.34% for the next 6 months. This stat is positive for the development of new loans especially for the consumer loan segment in automobile, personal loans, credit cards and mortgage loans. It is also a good sign for default and delinquencies rate dropping. This trend has been proved during the 2014 period with JPM decreasing its non-performing assets and allowances for loan losses.
GDP Growth
xlvi

Page 11
The Henry Fund consensus for GDP growth during 2015 is 2.31%, which is similar to GDP growth in 2014. GDP growth for Q2 2015 was 2.3%. This is a favorable and stable trend for the development of economic activities and hence, for the increase of deposits and loans, confirming that recession has come to an end and those years of economic growth are expected.
Consumer Confidence The Conference Board Consumer Confidence Index®, which had increased in December 2014, rose sharply in January 2015. The latest Index data for August 2015 stands at 101.5 (1985=100), up from 93.1 in December 2014. With this data, we infer that consumers are likely to start spending more and relying more on credit. This trend is interesting for the consumer banking segment and specifically for products like personal credits. It is Henry Fund Consensus that the Consumer Confidence is expected to maintain neutral for the next months of 2015, which is coherent with a moderate positive economic environment that is surrounding the U.S.
CATALYSTS FOR GROWTH
Growing U.S. economy, increase in personal consumption through credit and increase in housing mortgage market.
Increase in M&A activity, corporate and sovereign capital raising.
Lower provision for loan losses because of improved credit quality.
Low unemployment and increment in the consumer confidence index.
Continued organic deposit and loan growth accompanied by cost saving efforts.
Improvement of the housing market given new regulation given by the Consumer Financial Protection Bureau (CPFB).
INVESTMENT POSITIVES
Increasing earnings growth for the past years, accompanied by an increasing dividend pay-out policy.
Solid deposits and loan growth originated from a combination of organic growth and market share from competitors.
Continuous growth in assets under custody and administration along with growth in asset management fees and product development.
Continued market share gain and holding position in Investment Banking fees.
High asset quality and solid credit risk assessment.
Better position on investment and trading securities when increasing interest rate environment.
INVESTMENT NEGATIVES
Increased competition in the consumer and commercial loan segment which would bring yields down.
Tougher regulation regarding capital requirements, quality of assets, restrictive scope of operations and restriction on dividend paying policy.
Lower or stagnant interest rates in long term maturities could affect the Net Interest Spread and Net Interest Margin in the long term.
Earnings expectations not being met and earnings decreasing due to high competition.
Focusing on short-term growth could prove to be misleading without taking into account for example the quality of the loans its long-term consequences due to risk.
Low current yields on investment securities.
Economic recession accompanied by real estate market crash and investment decrease.
Increasing operational costs.
VALUATION
Discounted Cash Flow Model Assumptions The most important assumptions for the valuation model among others are interest rates for interest bearing revenues and expenses, salaries and employee benefits, assets and liabilities growth, provision for loan losses, market risk premium, Beta and thus cost of equity and CV Growth rate Beta was calculated as an average of 1, 2, 3 and 5 year weekly and monthly data. JPM’s beta was calculated as 1.34. The bank displays the same risk level than industry average. The market risk premium used was the Henry Fund consensus for 2015 (4.85%), resulting in a Cost of Equity equal to 9.46%. Provision for loan losses is calculated by taking an historic average as a percentage of total loans. Since 2009, JPM

Page 12
has showed a decrease trend from 5.5% of total loans to 0.41% in 2014. The allowance for loan losses growth used is calculated as a percentage of total loans and increased by a factor of 3% yearly compared to the previous year because a higher than historical average, reflects a slowing economy and riskier assets from higher growth. We preferred to be conservative with this number. The growth in loans was calculated by taking and historical yearly average for loan growth and by type of loan (4.35% as total loan average); but we decided to adjust the growth rate according to business segment trends because financial institutions cannot grow at accelerated paces without increasing its equity and increasing risk. Long-term and short-term borrowings are calculated as percentages of the previous years’ total liabilities. These liabilities maintain, grow or decrease according to historical values since 2008. Salaries and employee benefits are the largest portion of the non-interest expense. This is calculated as a per employee average. The historical growth in number of employees is calculated and forecasted. Inflation rate of 3% is used in order to grow the expense. This inflation rate chose for salary expense increase, takes into account that average inflation in the U.S. is 2% in order to not underestimate the effect. The number of employees is decreased during 2015 and 2016 and stated under JPM’s management discussion from 2014 10-K. Interest rates Interest rates are the most sensitive variables in the model because they determine the revenues, expenses and hence the earnings of the model along with the volume of loans and deposits. Interest income on loans during 2015 and 2016 are forecasted at the same rate as 2014, due to the same low interest rate environment. After 2016, interest rate on loans increases gradually from an average of 4.36% to 4.6%. This is lower than the high 5.35% in 2011. Interest expense in interest-bearing deposits, interest expense on short-term and other liabilities and interest expense on long-term debt and other interest expense in gradually increased from 2016 on according to The EDCF valuation method arrives at a per share value of
$66.12, with the terminal value accounting for 85% of the total value. The DCF value is similar the current price. Dividend Discount Valuation (DDM) The DDM valuation gives a per share value of $64.80. The payout ratio remains constant at 30% as it was in the 2014 business period. Relative Valuation (RV) The relative valuation gives a share value of $ 73.70, $65.60 and $65.30 for P/E, P/BV and P/TB respectively. JPM trades closely to its peers in the multiples approaches.
KEYS TO MONITOR
Asset quality and non-performing loan metrics increasing. A severe increase to 7% of allowance for loan losses to total loan could drive earning to negative numbers.
Interest rates rising in a position where the increase in longer-term lending rates does not exceed the increase in short-term funding costs.
Tighter and more aggressive regulation which would let to the bank failing stress tests.
Large decrease in deposits and sources of cheap funding.
IMPORTANT DISCLAIMER
Henry Fund reports are created by student enrolled in the Applied Securities Management (Henry Fund) program at the University of Iowa’s Tippie School of Management. These reports are intended to provide potential employers and other interested parties an example of the analytical skills, investment knowledge, and communication abilities of Henry Fund students. Henry Fund analysts are not registered investment advisors, brokers or officially licensed financial professionals. The investment opinion contained in this report does not represent an offer or solicitation to buy or sell any of the aforementioned securities. Unless otherwise noted, facts and figures included in this report are from publicly available sources. This report is not a complete compilation of data, and its accuracy is not guaranteed. From time to time, the University of Iowa, its faculty, staff, students, or the Henry Fund may hold a financial interest in the companies mentioned in this report.

Page 13
REFERENCES
i 2015 Global 2000: The World's Largest Bank; Forbes; http://www.forbes.com/sites/liyanchen/2015/05/06/2015-global-2000-the-worlds-largest-banks/ ii http://www.institutionalinvestorsalpha.com/profile/3287866/4689/hedge-fund-100-firm-profiles.html
iii JP Morgan Chase & Co. 2014 10-K
iv Graph constructed with data from JP Morgan Chase & Co. 2014 10-K
v Investment & Pensions Erope; Top 400 Asset Managers 2015, June 2015; http://www.ipe.com/reports/top-400-asset-
managers/top-400-asset-managers-2015-global-assets-top-50trn/10008262.fullarticle vi FactSet
vii FactSet
viii Line of Business CEO letters to shareholders; JPM Annual Report 2014
ix Valuation Model Forecasts and Assumptions
x ACSI; http://www.theacsi.org/industries/finance-and-insurance/bank
xi Management Discussion and Guidance; JPM Annual Report 2014
xii JPM Investor Day Presentation 2015
xiii JPM Investor Day Presentation 2015
xiv Dealogic; M&A StatShot; http://www.dealogic.com/media/market-insights/ma-statshot/
xv Dealogic
xvi JPM Annual Report 2014
xvii Management Discussion and Guidance; JPM Annual Report 2014
xviii JPM Annual Report 2014.
xix Management Discussion and Guidance; JPM Annual Report 2014
xx Management Discussion and Guidance; JPM Annual Report 2014
xxi http://www.nasdaq.com/earnings/report/jpm
xxii WallStreet Journal; http://quotes.wsj.com/JPM/research-ratings
xxiii FactSet
xxiv Chart constructed with JPM 10-K Financial information
xxv J.D. Power U.S. Retail Banking Satisfaction Studies; Big Banks defines as Chase, Citi Bank, US Bank, PNC Bank.
xxvi FactSet – Industry comparison data
xxvii FactSet – Industry comparison data
xxviii Federal Reserve; Record of Meeting, Federal Advisory Council and Board of Governors; February 6th, 2015;
http://www.federalreserve.gov/aboutthefed/fac-20150206.pdf xxix
http://www.netadvantage.standardandpoors.com.proxy.lib.uiowa.edu/NASApp/NetAdvantage/simpleSearchRun.do?ControlName=IndustriesSurveySearch xxx
http://www.netadvantage.standardandpoors.com.proxy.lib.uiowa.edu/NASApp/NetAdvantage/i/displayIndustryFocusEditorialStory.do?subtype=INDI&pc=NET&tracking=NET&context=IndustryFocus&prefix=i xxxi
FactSet Market Aggregates
xxxii Business Insider; FED DOES NOTHING, KEEPS THE WORLD WAITING FOR THE END OF 0% INTEREST RATES
http://www.businessinsider.com/federal-reserve-announcement-september-17-2015-9 xxxiii
JPM 2Q15 Earnings Presentation; http://files.shareholder.com/downloads/ONE/677899915x0x839054/5BAFD42C-2134-4AEE-9E19-7DD72C54D55F/2Q15_Earnings_Presentation_FINAL.pdf xxxiv
Factet – Industry Sales Outlook xxxv
Industry Surveys- Banks; Erik Oja; S&P Capital IQ; February 2015. xxxvi
Federal Reserve; Record of Meeting, Federal Advisory Council and Board of Governors; February 6th, 2015; http://www.federalreserve.gov/aboutthefed/fac-20150206.pdf xxxvii
FactSet xxxviii
S&P Capital IQ xxxix
Commercial Banking in the U.S.: Market Research Report. http://www.ibisworld.com/industry/default.aspx?indid=1288 xl Table constructed with data from FactSet
xli Ken Fisher; Fisher Investments on Financials, page 53;
Basel III: Implementation Timeline; xlii
JPM 2014 10-K; Selected Ratios and other Data

Page 14
xliii
Source: U.S. Department of Treasury; http://www.treasury.gov/resource-center/data-chart-center/interest-rates/Pages/Historic-Yield-Data-Visualization.aspx xliv
FactSet, Industry Estimates xlv
Federal Reserve Data Base; xlvi
Tending Economics; http://www.tradingeconomics.com/united-states/gdp-growth

JPMorgan Chase &Co 2015 2016 2017 2018 2019 CV (2020)
2008-
Present
Key Assumptions of Valuation Model Investment Banking Growth 66.12 1.10 1.15 1.20 1.25 1.30 1.35 1.40 1.45 1.50 1.55
Global Investment Banking Revenue Growth 1.50% 1.50% 1.50% 1.50% 1.50% 1.50% -0.26% 2.0% 80.28 76.97 73.90 71.04 68.38 65.90 63.57 61.39 59.34 57.42
Ticker Symbol JPM JPM Market Share 8.60% 8.50% 8.55% 8.60% 8.50% 8.50% 8.37% 2.5% 81.08 77.51 74.23 71.19 68.38 65.76 63.32 61.04 58.91 56.91
Current Share Price $63.80 3.0% 82.02 78.15 74.61 71.36 68.36 65.59 63.03 60.64 58.42 56.34
Current Model Date 08/28./015 Asset Management 3.5% 83.16 78.92 75.07 71.56 68.35 65.40 62.69 60.18 57.85 55.68
Fiscal Year End Dec. 31 Assets under custody Growth 1.00% 1.00% 1.00% 1.00% 1.00% 1.50% 6.34% 4.0% 84.57 79.86 75.62 71.80 68.34 65.18 62.29 59.63 57.19 54.93
4.5% 86.35 81.03 76.31 72.10 68.32 64.91 61.81 58.99 56.41 54.05
Beta 1.34 Interest Income: 5.0% 88.67 82.53 77.17 72.47 68.30 64.58 61.24 58.22 55.49 53.00
Market Risk Free Rate 2.96% Interest Income on loans 4.36% 4.40% 4.45% 4.50% 4.55% 4.60% 5.13%
Market Rate (S&P500) 7.81% Interest income on securities 2.55% 2.60% 2.70% 2.80% 2.90% 2.95% 3.07%
Market Risk Premium 4.85% Interest income on trading assets 1.95% 2.00% 2.50% 2.10% 2.15% 2.20% 2.20% 66.12 0.5% 1.0% 1.5% 2.0% 2.5% 3.0% 3.5% 4.0% 4.5% 5.0%
Cost of Equity 9.46%
Interest income on federal funds sold & securities
purchased under resale agreements 0.66% 0.70% 0.74% 0.79% 0.83% 0.88% 0.88% 1.5% 100.98 91.64 83.75 77.01 71.18 66.10 61.62 57.66 54.12 50.95
Interest income on securities borrowed -0.45% -0.10% 0.10% 0.20% 0.20% 0.30% -0.05% 2.0% 103.60 93.30 84.74 77.50 71.32 65.97 61.31 57.20 53.57 50.32
Interest income on deposits with banks 0.37% 0.45% 0.50% 0.60% 0.65% 0.70% 1.10% 2.5% 106.81 95.30 85.90 78.08 71.48 65.84 60.96 56.69 52.94 49.62
CV Growth Rate 3.00% Interest income on other assets 0.60% 0.55% 0.50% 0.48% 0.48% 0.48% 0.48% 3.0% 110.81 97.74 87.30 78.77 71.67 65.68 60.55 56.11 52.24 48.83
Current Dividend Yield 2.86% 3.5% 115.96 100.79 89.00 79.59 71.89 65.49 60.08 55.45 51.45 47.95
Interest Expense: 4.0% 122.82 104.71 91.14 80.59 72.16 65.27 59.54 54.69 50.54 46.94
Interest Paid on Interest Bearing Deposits 0.20% 0.23% 0.26% 0.32% 0.40% 0.50% 0.61% 4.5% 132.43 109.94 93.88 81.85 72.49 65.01 58.89 53.80 49.49 45.80
Effective Tax Rate 28.48% Interest expense on short-term & other liabilities 0.35% 0.38% 0.43% 0.48% 0.55% 0.60% 0.76%
Interest expense on Long-Term Debt 1.62% 1.75% 1.84% 1.93% 2.04% 2.10% 2.28%
Expected Inflation rate 2.50%
Interest expense on beneficial interest issued by
consolidated variable interest entities 0.80% 0.83% 0.90% 1.00% 1.10% 1.15% 1.52% 66.12 4.0% 4.5% 5.0% 5.5% 6.0% 6.5% 7.0% 7.5% 8.0% 8.5%
0.90 125.26 110.42 98.60 88.96 80.95 74.20 68.42 63.44 59.09 55.26
Target to maintain 1.00 111.90 98.60 87.99 79.35 72.17 66.12 60.95 56.48 52.59 49.16
Total Equity / Total Assets 8% above Asset Growth Rates: 1.10 101.01 88.96 79.35 71.52 65.02 59.54 54.86 50.82 47.30 44.20
Securities Borrowed 2.20% 2.50% 3.00% 3.00% 3.00% 3.50% -1.45% 1.20 91.97 80.95 72.17 65.02 59.09 54.09 49.81 46.13 42.92 40.09
Trading Assets 2.20% 3.00% 3.00% 3.00% 3.00% 3.50% -3.08% 1.30 84.33 74.20 66.12 59.54 54.09 49.49 45.56 42.18 39.23 36.64
Securities 2.00% 2.00% 2.00% 2.00% 2.00% 2.50% 12.25% 1.40 77.81 68.42 60.95 54.86 49.81 45.56 41.94 38.81 36.08 33.69
Loans Receivable: 1.50 72.17 63.44 56.48 50.82 46.13 42.18 38.81 35.90 33.37 31.15
Total wholesale loans 2.80% 3.30% 3.40% 3.60% 3.70% 4.10% 10.14%
Total consumer loans 2.80% 3.20% 3.30% 3.30% 3.40% 3.80% -2.50%
Credit cards 2.40% 3.00% 3.00% 3.00% 3.00% 3.00% -1.19% 66.12 2.0% 2.5% 3.0% 3.5% 4.0% 4.5% 5.0% 5.5% 6.0% 6.5%
Allowance for loan losses increase 3.00% 3.00% 3.00% 3.00% 3.00% 3.00% -5.02% 7.0% 97.47 104.44 111.41 118.38 125.35 132.32 139.28 146.25 153.22 160.19
7.5% 86.13 92.20 98.27 104.34 110.40 116.47 122.54 128.61 134.68 140.74
Liability Growth Rates: 8.0% 77.07 82.42 87.77 93.12 98.47 103.83 109.18 114.53 119.88 125.23
U.S. non-interest bearing deposits 4.00% 2.50% 2.50% 2.50% 3.00% 3.00% 14.15% 8.5% 69.67 74.44 79.20 83.97 88.74 93.50 98.27 103.04 107.80 112.57
U.S. interest-bearing deposits 4.00% 4.00% 3.00% 3.00% 3.00% 3.00% 4.34% 9.0% 63.52 67.80 72.08 76.36 80.64 84.92 89.20 93.49 97.77 102.05
Non-U.S. non-interest bearing deposits 4.50% 4.00% 2.50% 2.50% 2.50% 3.00% 19.03% 9.5% 58.32 62.19 66.06 69.94 73.81 77.68 81.56 85.43 89.30 93.18
Non-U.S. interest bearing deposits 5.50% 5.00% 4.00% 4.00% 4.00% 3.00% -0.56% 10.0% 53.87 57.40 60.92 64.45 67.97 71.50 75.02 78.55 82.07 85.60
66.12 1.10 1.15 1.20 1.25 1.30 1.35 1.40 1.45 1.50 1.55
28.5% 82.01 78.15 74.61 71.35 68.36 65.59 63.02 60.63 58.41 56.33
29.0% 81.20 77.37 73.87 70.65 67.68 64.94 62.40 60.04 57.84 55.78
30.0% 79.63 75.87 72.44 69.29 66.38 63.70 61.21 58.89 56.74 54.72
31.0% 78.06 74.38 71.02 67.93 65.09 62.46 60.02 57.75 55.64 53.66
32.0% 76.49 72.89 69.60 66.57 63.79 61.21 58.83 56.61 54.54 52.60
33.0% 74.92 71.40 68.18 65.22 62.49 59.97 57.63 55.46 53.44 51.55
40.0% 63.95 60.97 58.24 55.73 53.42 51.29 49.31 47.47 45.75 44.15
Tax
Rat
e
Beta
Market Risk Premium
Be
ta
Price Interest Income Yield on Securities at CV
Co
st o
f Eq
uit
y
Price Beta
CV
Gro
wth
Price
Price Market Free Risk Rate
CV
Gro
wth

JPMorgan Chase &CoIncome Statement (Millions)
Fiscal Years Ending Dec. 31 2012 2013 2014 2015E 2016E 2017E 2018E 2019E 2020E
Underwriting 4,316 5,036 4,911 4,871 4,887 4,989 5,094 5,110 5,187 Advisory 1,492 1,318 1,631 1,769 1,774 1,812 1,850 1,856 1,883 Investment banking fees 5,808 6,354 6,542 6,640 6,661 6,801 6,943 6,966 7,070 Principal transactions 5,536 10,141 10,531 10,754 11,026 11,313 11,607 11,908 12,278 Lending & deposit-related fees 6,196 5,945 5,801 5,946 6,157 6,348 6,773 6,762 6,743 Fees & commissions - - - - - - - - - Asset management, administration & commissions 13,868 15,106 15,931 15,953 15,737 15,928 16,112 16,260 16,088 Securities gains (losses) 2,110 667 77 92 111 133 160 192 230 Mortgage fees & related income 8,687 5,205 3,563 4,882 5,038 5,205 5,376 5,559 5,770 Card income 5,658 6,022 6,020 5,998 6,013 6,008 6,012 6,041 6,067 Other income 4,258 3,847 2,106 2,159 2,213 2,268 2,325 2,383 2,442 Total noninterest revenue 52,121 53,287 50,571 52,425 52,955 54,003 55,308 56,072 56,688 Interest income on loans 35,832 33,489 32,218 33,922 35,331 36,909 38,585 40,365 42,358 Interest income on securities 7,939 7,812 9,040 8,874 9,229 9,776 10,341 10,924 11,335 Interest income on trading assets 9,039 8,426 7,312 7,780 8,155 10,500 9,085 9,580 10,097 Interest income on federal funds sold & securities purchased under resale agreements 2,442 1,940 1,642 1,424 1,556 1,694 1,863 2,016 2,202 Interest income on securities borrowed (3) (127) (501) (497) (113) 116 238 245 379 Interest income on deposits with banks 555 918 1,157 1,793 2,191 2,447 2,951 3,213 3,477 Interest income on other assets 259 538 663 618 583 546 542 559 581 Interest income 56,063 52,996 51,531 53,914 56,933 61,988 63,605 66,902 70,428 Interest expense on interest-bearing deposits 2,655 2,067 1,633 1,894 2,272 2,653 3,372 4,355 5,606 Interest expense on short-term & other liabilities 1,788 2,125 1,450 1,463 1,595 1,825 2,071 2,395 2,650 Interest expense on long-term debt 6,062 5,007 4,409 4,384 4,786 5,160 5,499 5,789 5,975 Interest expense on beneficial interest issued by consolidated variable interest entities 648 478 405 445 469 521 594 668 713 Interest expense 11,153 9,677 7,897 8,186 9,122 10,159 11,536 13,206 14,945 Net interest income 44,910 43,319 43,634 45,728 47,812 51,828 52,068 53,695 55,483 Total net revenue 97,031 96,606 94,205 98,153 100,767 105,831 107,376 109,767 112,172 Provision for credit losses 3,385 225 3,139 1,375 981 1,057 1,141 1,231 1,380 Compensation expense 30,585 30,810 30,160 30,605 31,056 31,514 31,979 32,451 32,930 Occupancy expense 3,925 3,693 3,909 3,899 3,887 3,984 4,122 4,225 4,371 Technology, communications & equipment expense 5,224 5,425 5,804 6,036 6,278 6,529 6,725 6,926 7,134 Professional & outside services 7,429 7,641 7,705 7,044 7,186 7,322 7,401 7,390 7,384 Marketing expense 2,577 2,500 2,550 2,601 2,653 2,706 2,760 2,815 2,872 Other expense 14,032 19,761 11,146 11,425 11,710 12,003 12,303 12,611 12,926 Total noninterest expense 64,729 70,467 61,274 61,610 62,770 64,058 65,291 66,418 67,617 Total Income Before Income Tax 28,917 25,914 29,792 35,167 37,016 40,716 40,945 42,118 43,175 Income tax expense (benefit) 7,633 7,991 8,030 10,014 10,540 11,594 11,659 11,993 12,294 Net income (loss) 21,284 17,923 21,762 25,153 26,476 29,122 29,286 30,125 30,881 Less: Preferred stock dividends 653 805 1,125 1,125 1,125 1,125 1,125 1,125 1,125 Dividends & undistributed earnings allocated to participating securities 754 525 544 544 544 544 544 544 544 Net income (loss) applicable to common stock 19,877 16,593 20,093 23,484 24,807 27,453 27,617 28,456 29,212
Weighted average shares outstanding - basic 3,809 3,782 3,764 3,705 3,687 3,672 3,660 3,651 3,636 Year end shares outstanding 3,804 3,756 3,715 3,695 3,678 3,665 3,655 3,647 3,626 Earnings per Share 5.22 4.39 5.34 6.34 6.73 7.48 7.55 7.79 8.03 Dividends per share 1.20 1.44 1.58 1.90 2.02 2.24 2.26 2.34 2.41 Dividends paid 5,194 6,056 6,990 7,045 7,442 8,236 8,285 8,537 8,764 Cash dividends declared per common share 1.20 1.44 1.58 1.90 2.02 2.24 2.26 2.34 2.41 Pay-Out Ratio 0.23 0.33 0.30 0.30 0.30 0.30 0.30 0.30 0.30 Retention Ratio 0.77 0.67 0.70 0.70 0.70 0.70 0.70 0.70 0.70

JPMorgan Chase &CoCommon Size Income Statement
Fiscal Years Ending Dec. 31 2012 2013 2014 2015E 2016E 2017E 2018E 2019E 2020E
Investment banking fees 0.25% 0.26% 0.25% 0.25% 0.25% 0.24% 0.24% 0.24% 0.24%Principal transactions 0.23% 0.42% 0.41% 0.41% 0.41% 0.41% 0.41% 0.41% 0.41%Lending & deposit-related fees 0.26% 0.25% 0.23% 0.23% 0.23% 0.23% 0.24% 0.23% 0.23%Asset management, administration & commissions 0.59% 0.63% 0.62% 0.61% 0.58% 0.57% 0.56% 0.56% 0.54%Securities gains (losses) 0.09% 0.03% 0.00% 0.00% 0.00% 0.00% 0.01% 0.01% 0.01%Mortgage fees & related income 0.37% 0.22% 0.14% 0.19% 0.19% 0.19% 0.19% 0.19% 0.19%Card income 0.24% 0.25% 0.23% 0.23% 0.22% 0.22% 0.21% 0.21% 0.20%Other income 0.18% 0.16% 0.08% 0.08% 0.08% 0.08% 0.08% 0.08% 0.08%Total noninterest revenue 2.21% 2.21% 1.97% 2.00% 1.96% 1.94% 1.94% 1.92% 1.89%Interest income on loans 1.52% 1.39% 1.25% 1.29% 1.31% 1.33% 1.35% 1.38% 1.41%Interest income on securities 0.34% 0.32% 0.35% 0.34% 0.34% 0.35% 0.36% 0.37% 0.38%Interest income on trading assets 0.38% 0.35% 0.28% 0.30% 0.30% 0.38% 0.32% 0.33% 0.34%Interest income on federal funds sold & securities purchased under resale agreements 0.10% 0.08% 0.06% 0.05% 0.06% 0.06% 0.07% 0.07% 0.07%Interest income on securities borrowed 0.00% -0.01% -0.02% -0.02% 0.00% 0.00% 0.01% 0.01% 0.01%Interest income on deposits with banks 0.02% 0.04% 0.04% 0.07% 0.08% 0.09% 0.10% 0.11% 0.12%Interest income on other assets 0.01% 0.02% 0.03% 0.02% 0.02% 0.02% 0.02% 0.02% 0.02%Interest income 2.38% 2.19% 2.00% 2.06% 2.11% 2.23% 2.23% 2.29% 2.35%Interest expense on interest-bearing deposits 0.11% 0.09% 0.06% 0.07% 0.08% 0.10% 0.12% 0.15% 0.19%Interest expense on short-term & other liabilities 0.08% 0.09% 0.06% 0.06% 0.06% 0.07% 0.07% 0.08% 0.09%Interest expense on long-term debt 0.26% 0.21% 0.17% 0.17% 0.18% 0.19% 0.19% 0.20% 0.20%Interest expense on beneficial interest issued by consolidated variable interest entities 0.03% 0.02% 0.02% 0.02% 0.02% 0.02% 0.02% 0.02% 0.02%Interest expense 0.47% 0.40% 0.31% 0.31% 0.34% 0.37% 0.40% 0.45% 0.50%Net interest income 1.90% 1.79% 1.70% 1.74% 1.77% 1.87% 1.83% 1.84% 1.85%Total net revenue 4.11% 4.00% 3.66% 3.74% 3.73% 3.81% 3.76% 3.75% 3.74%Provision for credit losses 0.14% 0.01% 0.12% 0.05% 0.04% 0.04% 0.04% 0.04% 0.05%Compensation expense 1.30% 1.28% 1.17% 1.17% 1.15% 1.13% 1.12% 1.11% 1.10%Occupancy expense 0.17% 0.15% 0.15% 0.15% 0.14% 0.14% 0.14% 0.14% 0.15%Technology, communications & equipment expense 0.22% 0.22% 0.23% 0.23% 0.23% 0.24% 0.24% 0.24% 0.24%Professional & outside services 0.31% 0.32% 0.30% 0.27% 0.27% 0.26% 0.26% 0.25% 0.25%Marketing expense 0.11% 0.10% 0.10% 0.10% 0.10% 0.10% 0.10% 0.10% 0.10%Other expense 0.59% 0.82% 0.43% 0.44% 0.43% 0.43% 0.43% 0.43% 0.43%Total noninterest expense 2.89% 2.78% 2.74% 2.92% 2.38% 2.35% 2.33% 2.31% 2.29%Total Income Before Income Tax 1.17% 1.18% 1.23% 1.07% 1.16% 1.34% 1.37% 1.47% 1.44%Income tax expense (benefit) 0.35% 0.34% 0.32% 0.33% 0.31% 0.38% 0.39% 0.42% 0.41%Net income (loss) 0.82% 0.84% 0.90% 0.74% 0.85% 0.96% 0.98% 1.05% 1.03%Less: Preferred stock dividends 0.03% 0.03% 0.03% 0.03% 0.04% 0.04% 0.04% 0.04% 0.04%Dividends & undistributed earnings allocated to participating securities 0.05% 0.03% 0.03% 0.02% 0.02% 0.02% 0.02% 0.02% 0.02%Net income (loss) applicable to common stock 0.74% 0.78% 0.84% 0.69% 0.78% 0.90% 0.92% 0.99% 0.97%
JPMorgan Chase &CoBalance Sheet (Millions)
Fiscal Years Ending Dec. 31 2012 2013 2014 2015E 2016E 2017E 2018E 2019E 2020E
Cash & due from banks 53,723 39,771 27,831 24,870 41,033 57,569 62,444 63,711 52,223 Deposits with banks 121,814 316,051 484,477 486,899 489,334 491,781 494,239 496,711 499,194 Federal funds sold & securities purchase under resale agreements 296,296 248,116 215,803 222,277 228,945 235,814 242,888 250,175 257,680 Securities borrowed 119,017 111,465 110,435 112,865 115,686 119,157 122,731 126,413 130,838 Trading assets 450,028 374,664 398,988 407,766 419,999 432,599 445,577 458,944 475,007 Securities 371,152 354,003 348,004 354,964 362,063 369,305 376,691 384,225 393,830 Total wholesale loans 313,183 321,564 330,914 340,180 351,406 363,353 376,434 390,362 406,367 Total consumer loans - excluding purchased credit-impaired 292,620 289,063 295,374 303,644 313,361 323,702 334,384 345,753 358,892 Credit card 127,993 127,791 131,048 134,193 138,219 142,366 146,636 151,036 155,567 Loans 733,796 738,418 757,336 778,017 802,986 829,421 857,455 887,151 920,825 Allowance for loan losses 21,936 16,264 14,185 15,560 16,542 17,599 18,739 19,970 21,350 Loans, net of allowance for loan losses 711,860 722,154 743,151 762,457 786,444 811,822 838,715 867,181 899,476 Accrued interest & accounts receivable 60,933 65,160 70,079 73,279 75,584 75,499 80,608 83,344 86,447 Premises & equipment Net 14,519 14,891 15,133 15,096 15,047 15,424 15,958 16,357 16,923 Goodwill 48,175 48,081 47,647 47,647 47,647 47,647 47,647 47,647 47,647 Mortgage servicing rights 7,614 9,614 7,436 7,820 8,268 8,748 9,263 9,817 10,437 Other intangible assets 2,235 1,618 1,192 742 292 - - - - Other assets 101,775 110,101 102,950 106,077 109,259 112,537 115,913 120,550 126,577 Total assets 2,359,141 2,415,689 2,573,126 2,622,758 2,699,602 2,777,900 2,852,676 2,925,074 2,996,279 U.S. non-interest bearing deposits 380,320 389,863 437,558 455,060 466,437 478,098 490,050 504,752 519,894 U.S. interest-bearing deposits 552,106 626,392 643,350 669,084 695,847 716,723 738,224 760,371 783,182 Non-U.S. non-interest bearing deposits 17,845 17,611 19,078 19,937 20,734 21,252 21,784 22,328 22,998 Non-U.S. interest bearing deposits 243,322 253,899 263,441 277,930 291,827 303,500 315,640 328,265 338,113 Total deposits 1,193,593 1,287,765 1,363,427 1,422,011 1,474,845 1,519,573 1,565,698 1,615,717 1,664,188 Federal funds purchased & securities sold under repurchased agreements 240,103 181,163 192,101 196,798 199,903 205,003 210,114 214,904 219,443 Commercial paper 55,367 57,848 66,344 51,503 49,938 48,773 49,989 48,572 49,598 Other borrowed funds 26,636 27,994 30,222 26,417 26,834 27,518 28,204 28,847 29,456 Trading liabilities 131,918 137,744 152,815 143,184 143,184 143,184 143,184 143,184 143,184 Accounts payable & other liabilities 195,240 194,491 206,954 211,866 214,020 217,042 214,954 214,741 211,446 Beneficial interest issued by consolidated variable interest entities 63,191 49,617 52,362 55,594 56,479 57,920 59,364 60,714 61,998 Total long-term debt 249,024 267,889 276,836 270,627 273,470 280,447 284,939 283,765 284,538 Total liabilities 2,155,072 2,204,511 2,341,061 2,378,000 2,438,672 2,499,461 2,556,445 2,610,444 2,663,853 Total preferred stock 9,058 11,158 20,063 20,063 20,063 20,063 20,063 20,063 20,063 Total Common Stock and APIC 98,709 97,933 97,375 98,245 99,116 99,986 100,856 101,727 101,901 Retained earnings 104,223 115,756 130,315 146,754 164,119 183,336 202,668 222,587 243,035 Accumulated other comprehensive income (loss) 4,102 1,199 2,189 522 1,409 1,624 1,713 1,823 1,497 Shares held in RSU Trust, at cost (21) (21) (21) (21) (21) (21) (21) (21) (21) Treasury stock, at cost 12,002 14,847 17,856 20,356 22,856 25,356 27,856 30,356 32,856 Total stockholders' equity 204,069 211,178 232,065 245,208 261,830 279,632 297,423 315,822 333,619

JPMorgan Chase &Co
Common Size Balance Sheet
Fiscal Years Ending Dec. 31 2012 2013 2014 2015E 2016E 2017E 2018E 2019E 2020E
Cash & due from banks 2.28% 1.65% 1.08% 0.95% 1.52% 2.07% 2.19% 2.18% 1.74%
Deposits with banks 5.16% 13.08% 18.83% 18.56% 18.13% 17.70% 17.33% 16.98% 16.66%
Federal funds sold & securities purchase under resale agreements 12.56% 10.27% 8.39% 8.47% 8.48% 8.49% 8.51% 8.55% 8.60%
Securities borrowed 5.04% 4.61% 4.29% 4.30% 4.29% 4.29% 4.30% 4.32% 4.37%
Trading assets 19.08% 15.51% 15.51% 15.55% 15.56% 15.57% 15.62% 15.69% 15.85%
Securities 15.73% 14.65% 13.52% 13.53% 13.41% 13.29% 13.20% 13.14% 13.14%
Total wholesale loans 13.28% 13.31% 12.86% 12.97% 13.02% 13.08% 13.20% 13.35% 13.56%
Total consumer loans - excluding purchased credit-impaired 12.40% 11.97% 11.48% 11.58% 11.61% 11.65% 11.72% 11.82% 11.98%
Credit card 5.43% 5.29% 5.09% 5.12% 5.12% 5.12% 5.14% 5.16% 5.19%
Loans
Allowance for loan losses 0.93% 0.67% 0.55% 0.59% 0.61% 0.63% 0.66% 0.68% 0.71%
Loans, net of allowance for loan losses 30.17% 29.89% 28.88% 29.07% 29.13% 29.22% 29.40% 29.65% 30.02%
Accrued interest & accounts receivable 2.58% 2.70% 2.72% 2.79% 2.80% 2.72% 2.83% 2.85% 2.89%
Premises & equipment Net 0.62% 0.62% 0.59% 0.58% 0.56% 0.56% 0.56% 0.56% 0.56%
Goodwill 2.04% 1.99% 1.85% 1.82% 1.76% 1.72% 1.67% 1.63% 1.59%
Mortgage servicing rights 0.32% 0.40% 0.29% 0.30% 0.31% 0.31% 0.32% 0.34% 0.35%
Other intangible assets 0.09% 0.07% 0.05% 0.03% 0.01% 0.00% 0.00% 0.00% 0.00%
Other assets 4.31% 4.56% 4.00% 4.04% 4.05% 4.05% 4.06% 4.12% 4.22%
Total assets 100.00% 100.00% 100.00% 100.00% 100.00% 100.00% 100.00% 100.00% 100.00%
U.S. non-interest bearing deposits 16.12% 16.14% 17.00% 17.35% 17.28% 17.21% 17.18% 17.26% 17.35%
U.S. interest-bearing deposits 23.40% 25.93% 25.00% 25.51% 25.78% 25.80% 25.88% 25.99% 26.14%
Non-U.S. non-interest bearing deposits 0.76% 0.73% 0.74% 0.76% 0.77% 0.77% 0.76% 0.76% 0.77%
Non-U.S. interest bearing deposits 11.29% 11.52% 11.25% 11.69% 11.97% 12.14% 12.35% 12.58% 12.69%
Total deposits 50.59% 53.31% 52.99% 54.22% 54.63% 54.70% 54.89% 55.24% 55.54%
Federal funds purchased & securities sold under repurchased agreements 10.18% 7.50% 7.47% 7.50% 7.40% 7.38% 7.37% 7.35% 7.32%
Commercial paper 2.35% 2.39% 2.58% 1.96% 1.85% 1.76% 1.75% 1.66% 1.66%
Other borrowed funds 1.13% 1.16% 1.17% 1.01% 0.99% 0.99% 0.99% 0.99% 0.98%
Trading liabilities 5.59% 5.70% 5.94% 5.46% 5.30% 5.15% 5.02% 4.90% 4.78%
Accounts payable & other liabilities 8.28% 8.05% 8.04% 8.08% 7.93% 7.81% 7.54% 7.34% 7.06%
Total long-term debt 10.56% 11.09% 10.76% 10.32% 10.13% 10.10% 9.99% 9.70% 9.50%
Total liabilities 91.35% 91.26% 90.98% 90.67% 90.33% 89.98% 89.62% 89.24% 88.91%
Total preferred stock 0.38% 0.46% 0.78% 0.76% 0.74% 0.72% 0.70% 0.69% 0.67%
Common stock 0.17% 0.17% 0.16% 0.16% 0.15% 0.15% 0.14% 0.14% 0.14%
Additional paid-in capital 4.01% 3.88% 3.62% 3.59% 3.52% 3.45% 3.39% 3.34% 3.26%
Retained earnings 4.42% 4.79% 5.06% 5.60% 6.08% 6.60% 7.10% 7.61% 8.11%
Accumulated other comprehensive income (loss) 0.17% 0.05% 0.09% 0.02% 0.05% 0.06% 0.06% 0.06% 0.05%
Shares held in RSU Trust, at cost 0.00% 0.00% 0.00% 0.00% 0.00% 0.00% 0.00% 0.00% 0.00%
Treasury stock, at cost 0.51% 0.61% 0.69% 0.78% 0.85% 0.91% 0.98% 1.04% 1.10%
Total stockholders' equity 9.47% 9.58% 9.91% 10.31% 10.74% 11.19% 11.63% 12.10% 12.52%
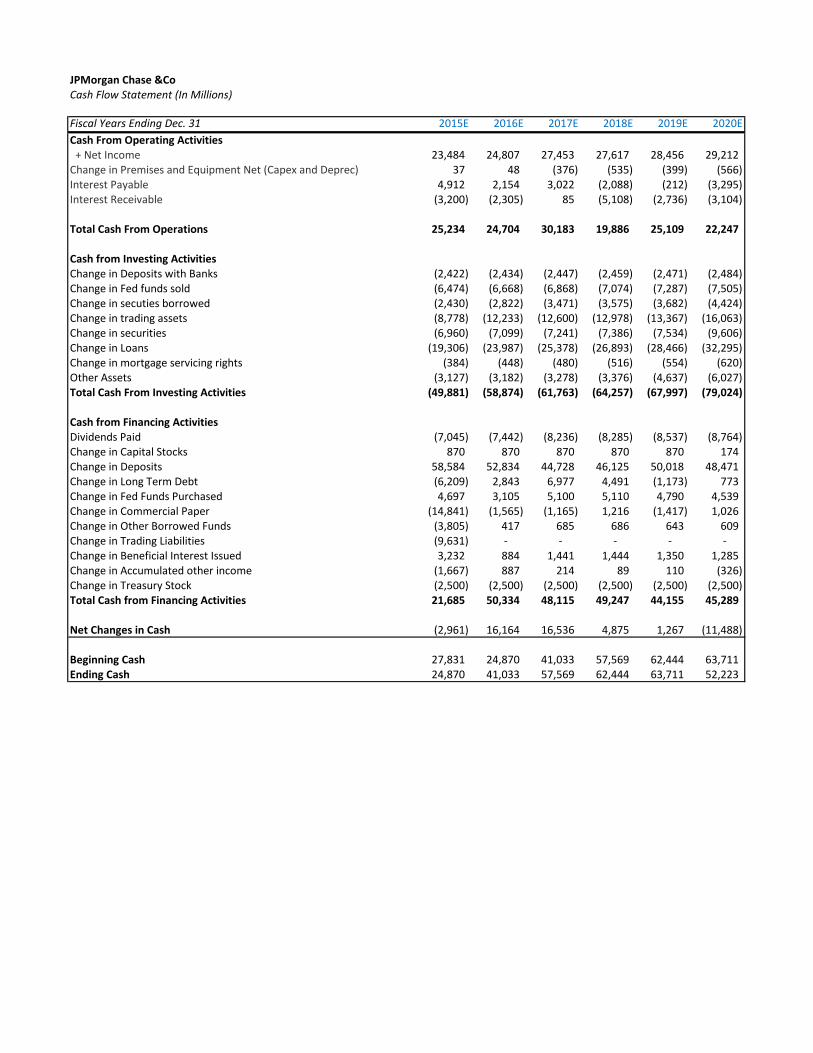
JPMorgan Chase &CoCash Flow Statement (In Millions)
Fiscal Years Ending Dec. 31 2015E 2016E 2017E 2018E 2019E 2020E
Cash From Operating Activities + Net Income 23,484 24,807 27,453 27,617 28,456 29,212 Change in Premises and Equipment Net (Capex and Deprec) 37 48 (376) (535) (399) (566) Interest Payable 4,912 2,154 3,022 (2,088) (212) (3,295) Interest Receivable (3,200) (2,305) 85 (5,108) (2,736) (3,104)
Total Cash From Operations 25,234 24,704 30,183 19,886 25,109 22,247
Cash from Investing ActivitiesChange in Deposits with Banks (2,422) (2,434) (2,447) (2,459) (2,471) (2,484) Change in Fed funds sold (6,474) (6,668) (6,868) (7,074) (7,287) (7,505) Change in secuties borrowed (2,430) (2,822) (3,471) (3,575) (3,682) (4,424) Change in trading assets (8,778) (12,233) (12,600) (12,978) (13,367) (16,063) Change in securities (6,960) (7,099) (7,241) (7,386) (7,534) (9,606) Change in Loans (19,306) (23,987) (25,378) (26,893) (28,466) (32,295) Change in mortgage servicing rights (384) (448) (480) (516) (554) (620) Other Assets (3,127) (3,182) (3,278) (3,376) (4,637) (6,027) Total Cash From Investing Activities (49,881) (58,874) (61,763) (64,257) (67,997) (79,024)
Cash from Financing ActivitiesDividends Paid (7,045) (7,442) (8,236) (8,285) (8,537) (8,764) Change in Capital Stocks 870 870 870 870 870 174 Change in Deposits 58,584 52,834 44,728 46,125 50,018 48,471 Change in Long Term Debt (6,209) 2,843 6,977 4,491 (1,173) 773 Change in Fed Funds Purchased 4,697 3,105 5,100 5,110 4,790 4,539 Change in Commercial Paper (14,841) (1,565) (1,165) 1,216 (1,417) 1,026 Change in Other Borrowed Funds (3,805) 417 685 686 643 609 Change in Trading Liabilities (9,631) - - - - - Change in Beneficial Interest Issued 3,232 884 1,441 1,444 1,350 1,285 Change in Accumulated other income (1,667) 887 214 89 110 (326) Change in Treasury Stock (2,500) (2,500) (2,500) (2,500) (2,500) (2,500) Total Cash from Financing Activities 21,685 50,334 48,115 49,247 44,155 45,289
Net Changes in Cash (2,961) 16,164 16,536 4,875 1,267 (11,488)
Beginning Cash 27,831 24,870 41,033 57,569 62,444 63,711 Ending Cash 24,870 41,033 57,569 62,444 63,711 52,223

JPMorgan Chase &CoRevenue Decomposition (Millions)
Fiscal Years Ending Dec. 31 2012 2013 2014 2015E 2016E 2017E 2018E 2019E 2020E
Interest income on loans 35,832 33,489 32,218 33,922 35,331 36,909 38,585 40,365 42,358 Interest income on securities 7,939 7,812 9,040 8,874 9,229 9,776 10,341 10,924 11,335 Interest income on trading assets 9,039 8,426 7,312 7,780 8,155 10,500 9,085 9,580 10,097 Interest income Fed Funds sold & securities 2,442 1,940 1,642 1,424 1,556 1,694 1,863 2,016 2,202 Interest income on securities borrowed (3) (127) (501) (497) (113) 116 238 245 379 Interest income on deposits with banks 555 918 1,157 1,793 2,191 2,447 2,951 3,213 3,477 Interest income on other assets 259 538 663 618 583 546 542 559 581 Interest income 56,063 52,996 51,531 53,914 56,933 61,988 63,605 66,902 70,428 Investment banking fees 5,808 6,354 6,542 6,640 6,661 6,801 6,943 6,966 7,070 Principal transactions 5,536 10,141 10,531 10,754 11,026 11,313 11,607 11,908 12,278 Lending & deposit-related fees 6,196 5,945 5,801 5,946 6,157 6,348 6,773 6,762 6,743 Asset management, administration & commissions 13,868 15,106 15,931 15,953 15,737 15,928 16,112 16,260 16,088 Securities gains (losses) 2,110 667 77 92 111 133 160 192 230 Mortgage fees & related income 8,687 5,205 3,563 4,882 5,038 5,205 5,376 5,559 5,770 Card income 5,658 6,022 6,020 5,998 6,013 6,008 6,012 6,041 6,067 Other income 4,258 3,847 2,106 2,159 2,213 2,268 2,325 2,383 2,442 Total noninterest revenue 52,121 53,287 50,571 52,425 52,955 54,003 55,308 56,072 56,688
Total Revenue 108,184 106,283 102,102 106,338 109,889 115,991 118,913 122,973 127,116
Interest expense on interest-bearing deposits 2,655 2,067 1,633 1,894 2,272 2,653 3,372 4,355 5,606 Interest expense on short-term & other liabilities 1,788 2,125 1,450 1,463 1,595 1,825 2,071 2,395 2,650 Interest expense on long-term debt 6,062 5,007 4,409 4,384 4,786 5,160 5,499 5,789 5,975 Interest expense on beneficial interest issued by
consolidated variable interest entities 648 478 405 445 469 521 594 668 713 Interest expense 11,153 9,677 7,897 8,186 9,122 10,159 11,536 13,206 14,945
Compensation expense 30,585 30,810 30,160 30,605 31,056 31,514 31,979 32,451 32,930 Occupancy expense 3,925 3,693 3,909 3,899 3,887 3,984 4,122 4,225 4,371 Technology, communications & equipment expense 5,224 5,425 5,804 6,036 6,278 6,529 6,725 6,926 7,134 Professional & outside services 7,429 7,641 7,705 7,044 7,186 7,322 7,401 7,390 7,384 Marketing expense 2,577 2,500 2,550 2,601 2,653 2,706 2,760 2,815 2,872 Other expense 14,032 19,761 11,146 11,425 11,710 12,003 12,303 12,611 12,926 Total noninterest expense 64,729 70,467 61,274 61,610 62,770 64,058 65,291 66,418 67,617
Total expenses 75,882 80,144 69,171 69,796 71,891 74,218 76,827 79,625 82,562
Net interest income 44,910 43,319 43,634 45,728 47,812 51,828 52,068 53,695 55,483 Provision for credit losses 3,385 225 3,139 1,375 981 1,057 1,141 1,231 1,380 Provision for loan losses as percentage of Total Loans 0.46% 0.03% 0.41% 0.18% 0.12% 0.13% 0.13% 0.14% 0.15%Net interest income after provision for loan losses 41,525 43,094 40,495 44,353 46,831 50,771 50,928 52,465 54,103
Net Interest Margin 2.44% 2.20% 2.13% 2.19% 2.23% 2.35% 2.29% 2.30% 2.33%Interest Margin Growth -9.97% -9.80% -3.15% 2.89% 1.93% 5.33% -2.49% 0.26% 1.24%

JPMorgan Chase &Co
Value Driver Estimation
Fiscal Years Ending Dec. 31 2012 2013 2014 2015E 2016E 2017E 2018E 2019E 2020E
Net Income 19,877 16,593 20,093 23,484 24,807 27,453 27,617 28,456 29,212
Total Stockholders Equity 204,069 211,178 232,065 245,208 261,830 279,632 297,423 315,822 333,619
ROE = (Net Income / Beg. TSE) 10.83% 8.13% 9.51% 10.12% 10.12% 10.49% 9.88% 9.57% 9.25%
Equity Economic Profit (EEP) = Beg. TSE * (ROE – Cost of equity) 2,511 (2,712) 116 1,532 1,611 2,684 1,164 320 (664)
Total Assets 2,359,141 2,415,689 2,573,126 2,622,758 2,699,602 2,777,900 2,852,676 2,925,074 2,996,279
Change in Total Assets 93,349 56,548 157,437 49,632 76,844 78,298 74,775 72,399 71,205
Total Liabilities 2,155,072 2,204,511 2,341,061 2,378,000 2,438,672 2,499,461 2,556,445 2,610,444 2,663,853
Change in Total Liabilities 72,853 49,439 136,550 36,939 60,672 60,788 56,984 53,999 53,409
Equity Free Cash Flow (FCFE) Simple Approach= NI – (change in total assets) +
(change in total liabilities) (619) 9,484 (794) 10,792 8,635 9,943 9,826 10,057 11,415
Net income 19,877 16,593 20,093 23,484 24,807 27,453 27,617 28,456 29,212
Change in Depreciation and Capex (478) (372) (242) 37 48 (376) (535) (399) (566)
Cash from Operations 19,399 16,221 19,851 23,522 24,855 27,077 27,082 28,057 28,646
Sources of Cash
Deposits 65,787 94,172 75,662 58,584 52,834 44,728 46,125 50,018 48,471
Borrowings and others 22,472 (62,849) 39,478 (20,348) 2,841 6,062 8,456 5,366 7,459
Accounts Payable (7,655) (749) 12,463 4,912 2,154 3,022 (2,088) (212) (3,295)
Long Term Debt (7,751) 18,865 8,947 (6,209) 2,843 6,977 4,491 (1,173) 773
Total Sources of Cash 72,853 49,439 136,550 36,939 60,672 60,788 56,984 53,999 53,409
Uses of Cash
Securities held 43,896 (72,881) (39,342) 15,864 16,589 17,580 18,035 18,502 21,535
Cash and cash equivalents 30,656 180,285 156,486 (539) 18,598 18,982 7,334 3,738 (9,005)
New Loans 15,749 10,294 20,997 19,306 23,987 25,378 26,893 28,466 32,295
Trading Assets 6,065 (75,364) 24,324 8,778 12,233 12,600 12,978 13,367 16,063
Accrued interest receivable (545) 4,227 4,919 3,200 2,305 (85) 5,108 2,736 3,104
Other Assets (1,965) 10,326 (9,329) 3,511 3,630 3,758 3,892 5,190 6,648
Total Uses of Cash 93,856 56,887 158,055 50,119 77,343 78,214 74,240 72,000 70,640
Equity Free Cash Flow (FCFE) Formal Approach (1,604) 8,773 (1,654) 10,342 8,185 9,651 9,826 10,057 11,415

JPMorgan Chase &Co
Cost of Equity Estimation
1 Year Weekly 1.08
Beta 1.34 2 Year Weekly 1.15
Market Risk Free Rate 2.96% 3 Year Weekly 1.14
Market Rate (S&P500) 7.81% 5 Year Weekly 1.34
Market Risk Premium 4.85% 1 Year Monthly 1.53
Cost of Equity 9.46% 2 Year Monthly 1.19
3 Year Monthly 1.19
Beta calculated doing the average of different time Beta values from Bloomberg 5 Year Monthly 1.76
Market Risk Premium established by using Henry Fund Consensus Total Average 1.34
Rf equal to T-30 year Bond
Market Risk Premium according to Henry Fund consensus
Bloomberg Beta

JPMorgan Chase &CoDiscounted Cash Flow (DCF) and Economic Profit (EP) Valuation Models
Key Inputs: CV Growth 3.00% CV ROE 9.25% Cost of Equity 9.46%Net Income in CV 29,212 Dividend Yield 2.86%
Fiscal Years Ending Dec. 31 2015E 2016E 2017E 2018E 2019E 2020E
Period 1 2 3 4 5 6DCF Model
Equity Free Cash Flow (FCFE) Formal Approach 10,342 8,185 9,651 9,826 10,057 11,415
CV 305,539 Discounted FCFE 9,448 6,831 7,359 6,845 6,400 194,443
V Equity 231,326 Less PV (ESOP) 2,023 Present Values (Equity) 229,303 Shares Outstanding end of the year 3,626
Intrinsic Value as 01/01/2015 63.25Target Price as today 66.12
EP ModelBeg TSE (2014) 232,065
Fiscal Year endinf Dec. 31 2015E 2016E 2017E 2018E 2019 2020(CV)
Equity EP 1,532 1,611 2,684 1,164 320 (664) CV (10,283) Discounted EEP 1,399 1,344 2,047 811 204 (6,544)
V Equity 231,326 Less PV (ESOP) 2,022.72$ Present Values (Equity) 229,303$ Shares Outstanding end of the year 3,626
Intrinsic Value as 01/01/2015 63.25Target Price as today 66.12
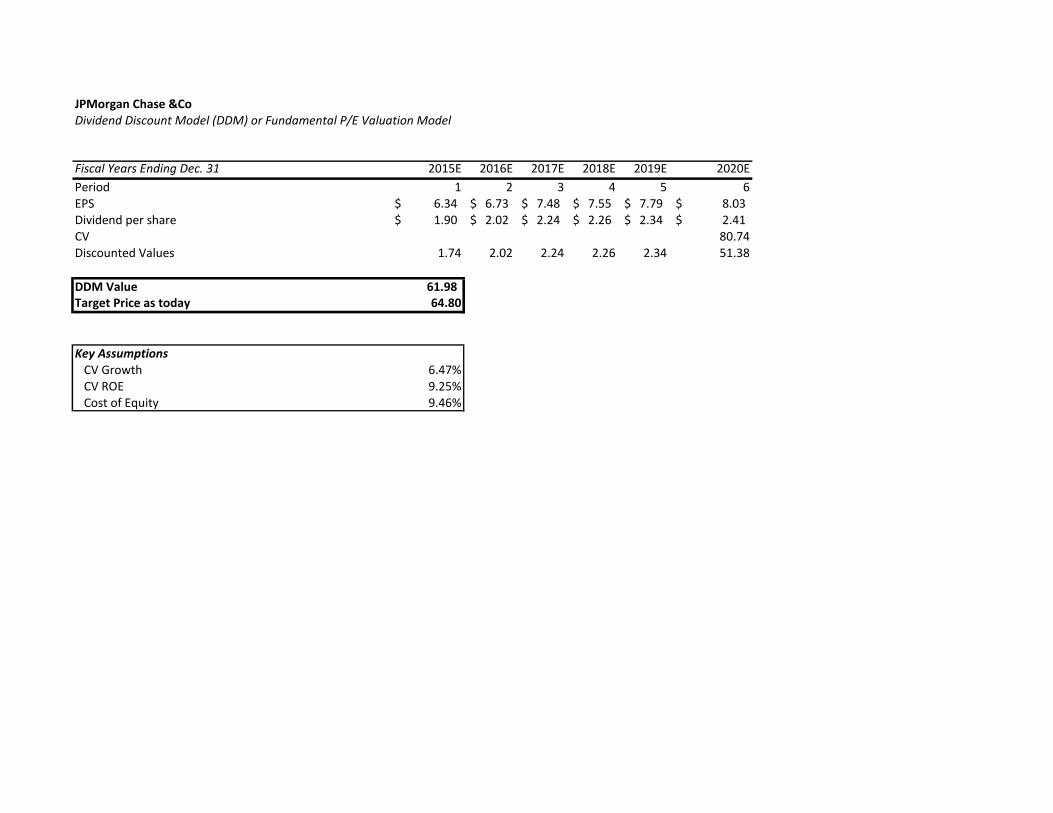
JPMorgan Chase &CoDividend Discount Model (DDM) or Fundamental P/E Valuation Model
Fiscal Years Ending Dec. 31 2015E 2016E 2017E 2018E 2019E 2020E
Period 1 2 3 4 5 6EPS 6.34$ 6.73$ 7.48$ 7.55$ 7.79$ 8.03$ Dividend per share 1.90$ 2.02$ 2.24$ 2.26$ 2.34$ 2.41$ CV 80.74Discounted Values 1.74 2.02 2.24 2.26 2.34 51.38
DDM Value 61.98 Target Price as today 64.80
Key Assumptions CV Growth 6.47% CV ROE 9.25% Cost of Equity 9.46%

JPMorgan Chase &Co
Relative Valuation Models
Ticker Company Market Cap (B) Price 2015 EPS 2016 EPS P/E 15 P/E 16 P/B 15 P/B 16
P/Tangible Book
Value 15
P/Tangible Book
Value 16
BAC-US Bank of America 167.4 16.0 1.4 1.6 11.1 10.0 0.7 0.7 1.0 0.9
BMO-CA Bank of Montreal (BMO) 60.01 (79.56) 79.6 6.6 7.1 12.0 11.2 1.2 1.2 1.6 1.6
BARC-GB BARCLAYS PLC 66.97 (43.36) 2.6 0.2 0.3 11.2 9.2 0.8 0.7 0.9 0.9
C-US Citi Group 155.0 51.1 5.6 6.0 9.1 8.5 0.7 0.7 0.8 0.8
DBK-DE DEUTSCHE BANK AG- 40.13 (35.36) 25.6 2.3 2.9 11.1 8.9 0.5 0.5 0.6 0.6
GS Goldman Sachs 80.2 185.3 17.7 19.9 10.5 9.3 1.0 1.0 1.1 1.0
MS-US MORGAN STANLEY 66.4 34.0 3.0 3.4 11.2 9.9 0.9 0.9 1.1 1.0
PNC-US PNC 46.4 90.4 7.3 7.8 12.4 11.7 1.1 1.0 1.4 1.3
STI-US SUNTRUST BANKS INC 31.8 39.5 3.3 3.5 11.8 11.2 0.9 0.9 1.3 1.2
UBSSG-CH UBS 79.67 (77.17) 20.1 1.5 1.7 13.5 12.1 1.4 1.3 1.6 1.6
USB-US U.S. Bancorp 72.3 41.1 3.2 3.5 12.8 11.7 1.8 1.6 2.4 2.1
WFC-US Wells Fargo 270.1 52.6 4.2 4.5 12.6 11.6 1.6 1.5 1.8 1.7
Average 11.6 10.4 1.1 1.0 1.3 1.2
JPM JPMorgan Chase &Co 231.4 $63.80 6.34 6.73 10.1 9.5 1.0 1.0 1.3 1.2
Implied Value:
Relative P/E (EPS15) $ 73.64
Relative P/E (EPS16) 70.22$
JPM BV 2015 (per share) 62.47
JPM BV 2016 (per share) 66.36
Relative P/B 2015 65.59$
Relative P/B 2016 66.36$
JPM TBV 2015 (per share) 49.32
JPM TBV 2016 (per share) 53.27
Relative P/TB 2015 64.12$
Relative P/TB 2016 65.25$

JPMorgan Chase &Co
Key Management Ratios
Fiscal Years Ending Dec. 31 2012 2013 2014 2015E 2016E 2017E 2018E 2019E 2020E
Income
Net Interest Margin (Net Interest Income / Earning Assets) 2.44% 2.20% 2.13% 2.19% 2.23% 2.35% 2.29% 2.30% 2.33%
Net Interest Spread (Interest Income/Avrg Earning Assets - Interest expense/Interest
Paying Liabilities) 2.28% 2.07% 2.01% 2.04% 2.07% 2.18% 2.09% 2.06% 2.05%
Interest Income/Average Earning Assets 3.11% 2.78% 2.56% 2.61% 2.69% 2.85% 2.84% 2.91% 2.99%
Interest Income/Total Assets (Interest Income / Average Total Assets) 2.4% 2.2% 2.1% 2.1% 2.1% 2.3% 2.3% 2.3% 2.4%
Interest Expense/Int Pay Liabilities 0.83% 0.71% 0.55% 0.57% 0.62% 0.68% 0.75% 0.85% 0.94%
Interest Expense/Total Liabilities 0.52% 0.44% 0.34% 0.34% 0.37% 0.41% 0.45% 0.51% 0.56%
Efficiency Ratio (Non-Interest Expense / Net Interest Income + Non-Interest Income) 66.71% 72.94% 65.04% 62.77% 62.29% 60.53% 60.81% 60.51% 60.28%
Loan Loss Provision/Loans Outstanding 0.46% 0.03% 0.42% 0.18% 0.12% 0.13% 0.14% 0.14% 0.15%
B/S Ratios
Loan to Asset Ratio (Total Loans / Total Assets) 31.10% 30.57% 29.43% 29.66% 29.74% 29.86% 30.06% 30.33% 30.73%
Total Equity to Total Assets (Equity / Total Assets) 8.65% 8.74% 9.02% 9.35% 9.70% 10.07% 10.43% 10.80% 11.13%
Provision Loan Losses/Total Loans 0.46% 0.03% 0.41% 0.18% 0.12% 0.13% 0.13% 0.14% 0.15%
Loan Growth (Loan t / Loan t-1) -1 1.39% 0.63% 2.56% 2.73% 3.21% 3.29% 3.38% 3.46% 3.80%
Total Asset Growth (Assets t / Aseets t-1) - 1 4.12% 2.40% 6.52% 1.93% 2.93% 2.90% 2.69% 2.54% 2.43%
Asset turnover (Total operating income / Average Assets) 4.79% 4.53% 4.26% 3.93% 4.00% 4.01% 4.12% 4.12% 4.15%
Interest Earning Assets/Total Assets 78.10% 81.56% 79.63% 79.58% 79.30% 79.32% 79.58% 79.83% 79.54%
Deposit Growth (Deposits t / Deposits t-1) - 1 5.83% 7.89% 5.88% 4.30% 3.72% 3.03% 3.04% 3.19% 3.00%
Deposit Asset Ratio (Total Deposits / Total Assets) 50.59% 53.31% 52.99% 54.22% 54.63% 54.70% 54.89% 55.24% 55.54%
Total Liabilities to Equity (Total Liabilities / Total Equity) 1056% 1044% 1009% 970% 931% 894% 860% 827% 798%
Total Liabilities to Assets (Total Liabilities / Total Assets) 91.35% 91.26% 90.98% 90.67% 90.33% 89.98% 89.62% 89.24% 88.91%
Total Debt to Equity (Total Debt / Total Equity) 765.26% 758.86% 722.85% 689.67% 663.59% 637.65% 615.17% 591.67% 572.36%
Total Debt to Assets (Total Debt / Total Assets) 66.20% 66.34% 65.19% 64.48% 64.36% 64.19% 64.14% 63.88% 63.73%
Return Metrics
Return On Average Assets (ROA) (NI / Average Assets) 0.86% 0.70% 0.81% 0.90% 0.93% 1.00% 0.98% 0.99% 0.99%
Retun On Average Equity (ROE) (NI / Average Equity) 10.26% 7.99% 9.07% 9.84% 9.78% 10.14% 9.57% 9.28% 9.00%
Book Value Per Share (Equity / Number of Shares outstanding) 48.66 53.65 56.22 62.47 66.36 71.18 76.30 81.38 86.61
Tangible Book Value per Share (Tangible equity/Number of Shares outstanding) 35.04 40.39 42.99 49.32 53.27 58.15 63.30 68.35 73.54