jpmorgan smartretirement® funds
TRANSCRIPT

NOT FDIC INSURED • NO BANK GUARANTEE • MAY LOSE VALUE
jpmorganfunds.com
JPMorgan SmartRetirement® FundsTarget date retirement strategies designed for real life
RETIREMENT ISN’T JUST ABOUT PORTFOLIOS. IT ’S ALSO ABOUT PEOPLE.
People work hard to save for retirement. One of their biggest challenges is determining how to make the most of those savings once they retire — balancing their ability to spend with the risk of outliving their assets.
With JPMorgan SmartRetirement Funds, plan participants get a target date strategy1 built around real-life behavior. It’s an all-in-one solution for anyone at any point on their retirement journey — from maximizing savings during working years to making those assets last throughout retirement.
And, plan sponsors may select the series that best meets their plan’s needs:
• SmartRetirement Funds hold only J.P. Morgan strategies, mostly actively managed mutual funds that leverage our extensive research and experience to pursue above-market returns.
• SmartRetirement Blend Funds combine active mutual funds with lower-cost passive ETFs from J.P. Morgan as well as third-party managers.
What makes SmartRetirement Funds smart?
Designing target date strategies around real-life saving and
spending behavior
Using participant and market insights to build
people-centered portfolios
Retirement investment strategies designed to deliver
optimal outcomes
PEOPLE INSIGHTS INVESTMENT EXPERTISE RESULTS
1 2 3
1 Target date funds (TDFs) may suffer investment losses, including near and following retirement. There is no guarantee that a TDF will provide adequate retirement income.

2 JPMORGAN SMARTRETIREMENT FUNDS
PEOPLE INSIGHTSDesigning target date strategies around real-life saving and spending behavior1
DEEPER PARTICIPANT INSIGHTS LEAD TO SMARTER RETIREMENT INVESTING
Access to proprietary data across millions of JPMorgan Chase customers and retirement plan participants allows us to understand people better than most other target date managers. We analyze everyday saving and spending habits and use those insights to inform glide path design, asset allocation, risk management, fund selection and other key aspects of our investment process. The result is a series of solutions that adapts to the way participants actually invest, borrow and withdraw money throughout their lives, as opposed to making assumptions about what they do.
Real-life participant behavior informs the design of the SmartRetirement Funds
Low Savings
Participants don’t save enough throughout their
working years
High Loan Usage
Participants take out loans during peak savings years
and take contribution “holidays”
Spending Volatility
Participants increasingly take withdrawals as they near retirement. When
participants retire, spending volatility persists
Spending Curve
Over time, retirees spend less as they age
EARLY CAREER(UP TO AGE 39)
MID CAREER(AGES 40-55)
PRE-RETIREMENT(AGES 56-65)
POST RETIREMENT(AGE 66 OR OLDER)
Source: J.P. Morgan retirement research, 2018-2019. Total spending and all category sub-totals except checks, cash and health care costs: Chase data including aggregated and de-identified Chase data including Chase credit card, debit card, electronic payment, ATM withdrawal and check transactions from October 2012 to December 2016 and from January to December 2019; J.P. Morgan analysis. Data from some co-branded cards may be excluded. Outliers in each asset group were excluded (0.1% of top spenders in each spending category). Information that would have allowed identification of specific customers was removed prior to each analysis.

J .P. MORGAN ASSET MANAGEMENT 3
PARTICIPANT BEHAVIOR POWERS OUR PLAN COMMUNICATIONS TOO
Our proprietary insights into human behavior not only inform our investment process, but just as importantly, they inform the design of our plan participant communications and educational content.
Communications that connect
Behavior-driven SmartRetirement Funds make smart choices for participants and empower participants to make smart choices for themselves.

4 JPMORGAN SMARTRETIREMENT FUNDS
■ Cash & Cash Equivalents
■ Inflation Managed
■ U.S. Fixed Income
■ High Yield
■ Emerging Markets Debt
■ REITs
■ Emerging Markets Equity
■ International Equity**
■ U.S. Small/Mid Cap
■ U.S. Large Cap
% o
f Por
tfol
io A
lloca
tion
SAVINGS PHASE (Years to retirement)
SPENDING PHASE (Years after retirement)
Fixe
d In
com
eCa
sh*
Equi
ties
100%
80%
60%
40%
20%
0%
40+ 25 0 35
INVESTMENT EXPERTISEUsing participant and market insights to build people-centered portfolios2
A GLIDE PATH DESIGNED FOR REAL-WORLD PARTICIPANT BEHAVIOR AND MARKET REALITIES
The strategic asset allocation depicts the Fund’s targeted weights based on J.P. Morgan’s internal analysis. The Fund’s actual allocations may differ due to changes to these allocations. Diversification and asset allocation do not guarantee investment returns and do not eliminate the risk of loss. Past performance does not guarantee future results.* Cash and cash equivalents.** As represented by the EAFE Index. Inflation Managed is allocated to TIPS (Treasury Inflation-Protected Securities): Treasury bonds adjusted to eliminate the inflation effects on interest and principal payments, as measured by the Consumer Price Index (CPI). REITs (Real Estate Investment Trusts): Companies that own or finance income-producing real estate, providing investors of all types regular income streams, diversification and long-term capital appreciation.
We measure success by the number of participants meeting goals at each point on the glide path.
Maintain higher equity exposure
designed to deliver growth
Balance growth and control risk to support long-term
spending needs
Provide annual spending insights
EARLY CAREER(UP TO AGE 39)
MID CAREER(AGES 40-55)
PRE-RETIREMENT(AGES 55-65)
POST RETIREMENT(AGE 65 OR OLDER)

J .P. MORGAN ASSET MANAGEMENT 5
2 F or illustrative purposes only. Number of simulations may vary from year to year and is based on number of glide paths tested through our proprietary modeling. The projections or other information generated by regarding the likelihood of various investment outcomes are hypothetical in nature, do not reflect actual investment results and are not guarantees of future results. Other investments not considered may have characteristics similar or superior to those being analyzed. The results may vary with each use and over time.
Glide path highlights
Use global diversification to effectively deliver growth and balance risks at different points along the glide path — from economic and market risks to participant actions and longevity
Make allocation adjustments to portfolio holdings as our research uncovers short-term opportunities and risks, while maintaining broad diversification at all times
Select investment strategies that best align with portfolio time frame and risk profile while complementing each other
Run over 250,000 simulations to ensure the glide path can endure a wide range of market environments and participant reactions2
Upcoming modifications to the SmartRetirement Funds• A supplement to the Fund’s prospectus dated 9/8/21 describes the integration of the JPMorgan SmartRetirement 2020-2060 Funds and
JPMorgan SmartRetirement Blend 2020-2060 Funds with the JPMorgan SmartSpending strategies.
• On or around March 18, 2022, each of the Funds anticipates modifying its investment strategy after it reaches its respective target retirement year (the year in its name) to incorporate the methodology used by the JPMorgan SmartSpending Funds, thereby integrating the two strategies.
• The integrated Funds will use an asset allocation strategy designed with two main goals in mind:
— Promoting asset accumulation prior to the target retirement year (the “Savings Phase”) and
— Supporting investors withdrawing a portion of their investment in the integrated Fund each year over a 35-year period until the Fund’s target maturity year (the “Spending Phase”).
• During the Spending Phase, investors will have access to a “sample withdrawal amount” calculated each year. The sample withdrawal amount is a generic hypothetical example that investors may use as a consideration in determining how much of their investment to withdraw each year during the Spending Phase.

6 JPMORGAN SMARTRETIREMENT FUNDS
A DEDICATED TEAM FOCUSED ON MANAGING PORTFOLIOS
With SmartRetirement Funds, plan participants invest with experienced professionals whose primary focus is portfolio construction and oversight. Funds are managed by J.P. Morgan’s Multi-Asset Solutions team, the same professionals entrusted with billions of dollars from some of the world’s largest and most sophisticated investors.
Together, the team researches markets, develops asset allocation strategies, selects and monitors individual underlying strategies and fine-tunes portfolios — drawing on research, resources, technology and talent from across our global investment platform.
Participants simply select the vintage most closely matching their target retirement date and leave the complex allocation and investment decisions to experienced managers.
Multi-Asset Solutions team
3 J.P. Morgan Asset Management, as of 9/30/21. Assets under management exclude custom glide path and retail advisory assets.
100+ INVESTMENT
PROFESSIONALS
50 years MANAGING MULTI-ASSET
PORTFOLIOS
$297+ bil. ASSETS UNDER MANAGEMENT3

J .P. MORGAN ASSET MANAGEMENT 7
RESULTSRetirement investment strategies designed to deliver optimal outcomes3
SmartRetirement performance starts on the next page v
STRONG LONG-TERM PERFORMANCE THAT INSPIRES CONFIDENCE
Diversifying globally across a broader investment universe is key to our strong, consistent risk-adjusted returns through a range of market environments. In addition, factoring human behavior into portfolio decisions allows managers to better balance the return potential needed to achieve retirement goals with risk controls that keep participants invested and on course.

8 JPMORGAN SMARTRETIREMENT FUNDS
PERFORMANCE HIGHLIGHTSSmartRetirement Blend Funds
LOW FEES
ALL 10 SMARTRETIREMENT BLEND VINTAGES HAVE LOWER EXPENSE RATIOS than 93% of their peers.5
1%
4%
7%
10%
13%
16%
2% 4% 6% 8% 10% 12% 14% 16%
RETU
RN
SR Blend Income
SR Blend 2020
SR Blend 2025
SR Blend 2035 SR Blend 2040
SR Blend 2030
SR 2045SR 2050SR 2055SR 2060
VOLATILITY (Standard deviation)
5 Source: Morningstar, Inc.; as of 9/30/21. Based on prospectus net expense ratio rankings for the R6 share class of each vintage in JPMorgan SmartRetirement Blend Funds series versus their relevant Morningstar target date category. Morningstar’s source for prospectus net expense ratio is each fund’s most recent prospectus. Different share classes may have different rankings. Please see page 11 for individual fund rankings and inception dates.
Analyst Rating GOLD4 AWARDED TO ENTIRE SERIES
4 Source: Morningstar, US Fund Target Date categories. Analyst rating as of 10/4/21; applies to SmartRetirement Blend R6 mutual funds only. The Morningstar Analyst Rating™ is not a credit or risk rating. It is a subjective evaluation performed by various Morningstar, Inc. subsidiaries (“Manager Research Group”) which, in the U.S., is Morningstar Research Services LLC, registered with and governed by the U.S. Securities and Exchange Commission. Funds are evaluated based on weightings across three key pillars – people, process and parent – to determine how they may likely perform relative to a benchmark over the long term on a risk-adjusted basis. The Analyst Rating scale is Gold, Silver, Bronze, Neutral, Negative. A rating of Gold, Silver or Bronze reflects the expectation of a fund’s prospects for outperformance. The expectations and methodologies differ between active and passive funds. Analyst Ratings ultimately reflect the Manager Research Group’s overall assessment, are overseen by an Analyst Rating Committee and are continuously monitored and reevaluated at least every 14 months.
For more details about Morningstar’s Analyst Rating, including its methodology, go to https://shareholders.morningstar.com/investor-relations/governance/Compliance--Disclosure/default.aspx
The Morningstar Analyst Rating should not be used as the sole basis in evaluating a fund, involves unknown risks and uncertainties which may cause the Manager Research Group’s expectations not to occur or to differ significantly from what they expected, and should not be considered an offer or solicitation to buy or sell the fund.
CONSISTENTLY STRONG RETURNS WITH LOWER RELATIVE RISK
Five-year return/volatility comparison vs. other target date fund providers
Source: Morningstar, J.P. Morgan Asset Management. R6 shares as of 9/30/21. Other target date fund providers shown are all target date funds in the Morningstar universe. Please see page 11 for standardized performance for each of the funds listed in the chart above.
Past performance is not a guarantee of future results.

J .P. MORGAN ASSET MANAGEMENT 9
PERFORMANCE HIGHLIGHTSSmartRetirement Funds
Analyst Rating SILVER6 AWARDED TO ENTIRE SERIES
6 Source: Morningstar, US Fund Target Date categories. Analyst rating as of 10/4/21; applies to the SmartRetirement R6 mutual funds. The Morningstar Analyst Rating™ is not a credit or risk rating. It is a subjective evaluation performed by various Morningstar, Inc. subsidiaries (“Manager Research Group”) which, in the U.S., is Morningstar Research Services LLC, registered with and governed by the U.S. Securities and Exchange Commission. Funds are evaluated based on weightings across three key pillars – people, process and parent – to determine how they may likely perform relative to a benchmark over the long term on a risk-adjusted basis. The Analyst Rating scale is Gold, Silver, Bronze, Neutral, Negative. A rating of Gold, Silver or Bronze reflects the expectation of a fund’s prospects for outperformance. The expectations and methodologies differ between active and passive funds. Analyst Ratings ultimately reflect the Manager Research Group’s overall assessment, are overseen by an Analyst Rating Committee and are continuously monitored and reevaluated at least every 14 months.
For more details about Morningstar’s Analyst Rating, including its methodology, go to https://shareholders.morningstar.com/investor-relations/governance/Compliance--Disclosure/default.aspx
The Morningstar Analyst Rating should not be used as the sole basis in evaluating a mutual fund. Morningstar Analyst Ratings involve unknown risks and uncertainties that may cause Morningstar’s expectations not to occur or to differ significantly from what we expected.
CONSISTENTLY STRONG RETURNS WITH LOWER RELATIVE RISK
10-year return/volatility comparison vs. other target date fund providers
Source: J.P. Morgan Asset Management, Morningstar. R6 shares as of 9/30/21. R6 shares only available through retirement plans.
Note: The SmartRetirement mutual funds were incepted on 5/15/06. The first full month of competitive data was June 2006. The providers shown are all target date funds in the Morningstar universe. Please see page 10 for standardized performance for each of the funds listed in the chart above.
Past performance is not a guarantee of future results.
OUTPERFORMING PEERS
8 OUT OF 10 VINTAGES ranked in the TOP QUARTILE of their peer group since inception.7
7 Past performance is no guarantee of future results. Source: Morningstar, Inc. Based on performance percentile rankings for the R6 share class of each fund versus their relevant Morningstar target date category as of 6/30/21. Different share classes may have different rankings. Please see page 10 for individual fund rankings and inception dates.
1%
4%
7%
10%
13%
16%
Other target date fund providers
2% 4% 6% 8% 10% 12% 14% 16%
RETU
RN
SR Income
SR 2020
SR 2025
SR 2035
SR 2030
SR 2040SR 2045SR 2050
VOLATILITY (Standard deviation)

10 JPMORGAN SMARTRETIREMENT FUNDS
PERFORMANCE HISTORYSmartRetirement Funds
8 Inception dates: 5/15/06 for Income, 2020, 2030 and 2040 Funds. July 31, 2007 for 2025, 2035, 2045 and 2050 Funds. 1/31/12 for 2055 Fund. 8/31/16 for 2060 Fund. 9 ANNUAL OPERATING EXPENSES: Effective date: 11/1/21. Total annual operating expenses reflect the expenses of the Fund before any fee waivers and/or reimbursements.
Net expenses reflect the operating expenses after fee waivers and/or reimbursements. The Investment Advisor, Administrator and Distributor have contractually agreed to waive fees and/or reimburse expenses through the expense cap expiration date (refer to detailed expense table) at which time they will determine whether or not to renew or revise the contract. Please refer to the prospectus for more information. R6 shares only available through retirement plans.
The performance quoted is past performance and is not a guarantee of future results. Mutual funds are subject to certain market risks. Investment returns and principal value of an investment will fluctuate so that an investor’s shares, when redeemed, may be worth more or less than original cost. Current performance may be higher or lower than the performance data shown. For performance current to the most recent month-end, please call 1-800-480-4111 or visit jpmorganfunds.com.
Total returns Average annual total returns
Quarterly returns (%) R6 shares as of 9/30/21 3 mo. YTD 1 year 3 years 5 years 10 years
Since inception8
Gross expenses9
Net expense9
SmartRetirement Income Fund (JSIYX) -0.43 3.54 10.87 7.36 6.59 6.59 5.6 0.42% 0.39%
S&P Target Date Retirement Income Index -0.03 3.06 8.14 6.88 5.94 5.8 5.01
Morningstar Percentile Ranking — — 26 (48/167) 38 (57/150) 24 (33/120) 20 (/78) 22 (14/75)
SmartRetirement 2020 Fund (JTTYX) -0.49 3.47 11.35 7.52 7.36 8.45 6.32 0.41% 0.40%
S&P Target Date 2020 Index -0.24 5.17 12.92 8.1 7.98 8.51 6.27
Morningstar Percentile Ranking — — 79 (133/174) 82 (124/161) 76 (79/122) 66 (/66) 16 (7/54)
SmartRetirement 2025 Fund (JNSYX) -0.69 4.94 15.13 8.71 8.68 9.69 6.51 0.42% 0.41%
S&P Target Date 2025 Index -0.33 6.57 16.17 8.95 9.01 9.42 6.18
Morningstar Percentile Ranking — — 60 (121/222) 72 (138/204) 66 (96/163) 38 (/90) 16 (10/77)
SmartRetirement 2030 Fund (JSMYX) -0.92 6.1 18.19 9.5 9.79 10.63 7.29 0.43% 0.42%
S&P Target Date 2030 Index -0.46 7.82 19.16 9.64 9.93 10.25 7.02
Morningstar Percentile Ranking — — 55 (116/223) 69 (131/203) 65 (98/163) 36 (/86) 7 (4/68)
SmartRetirement 2035 Fund (SRJYX) -1.3 8.13 22.55 10.79 10.94 11.57 7.36 0.45% 0.44%
S&P Target Date 2035 Index -0.61 9.24 22.56 10.43 10.88 11.01 6.8
Morningstar Percentile Ranking — — 32 (72/215) 54 (101/201) 56 (82/160) 30 (/87) 11 (13/77)
SmartRetirement 2040 Fund (SMTYX) -1.5 9.17 25.21 11.46 11.73 12.05 8.06 0.46% 0.45%
S&P Target Date 2040 Index -0.7 10.23 24.96 10.98 11.54 11.55 7.6
Morningstar Percentile Ranking — — 33 (75/217) 49 (99/203) 50 (77/163) 31 (/86) 4 (3/68)
SmartRetirement 2045 Fund (JSAYX) -1.61 10.2 27.49 12.02 12.15 12.26 7.91 0.47% 0.45%
S&P Target Date 2045 Index -0.75 10.82 26.36 11.29 11.93 11.9 7.13
Morningstar Percentile Ranking — — 26 (59/215) 43 (87/201) 50 (73/160) 25 (/86) 11 (11/73)
SmartRetirement 2050 Fund (JTSYX) -1.66 10.19 27.46 12.02 12.13 12.26 7.92 0.47% 0.45%
S&P Target Date 2050 Index -0.8 11.1 27.11 11.43 12.19 12.16 7.27
Morningstar Percentile Ranking — — 36 (77/217) 49 (94/203) 62 (87/163) 39 (/78) 15 (11/56)
SmartRetirement 2055 Fund (JFFYX) -1.61 10.24 27.47 12.04 12.13 N/A 11.01 0.48% 0.45%
S&P Target Date 2055 Index -0.8 11.27 27.47 11.5 12.33 N/A 11.17
Morningstar Percentile Ranking — — 46 (98/215) 50 (95/201) 64 (88/157) N/A 43 (44/101)
SmartRetirement 2060 Fund (JAKYX) -1.6 10.26 27.45 12.03 12.29 N/A 12.16 0.53% 0.44%
S&P Target Date 2060 Index -0.83 11.15 27.33 11.53 12.46 N/A 12.33
Morningstar Percentile Ranking — — 53 (108/210) 54 (95/187) 68 (71/124) N/A 69 (84/140)
J .P. MORGAN ASSET MANAGEMENT 11
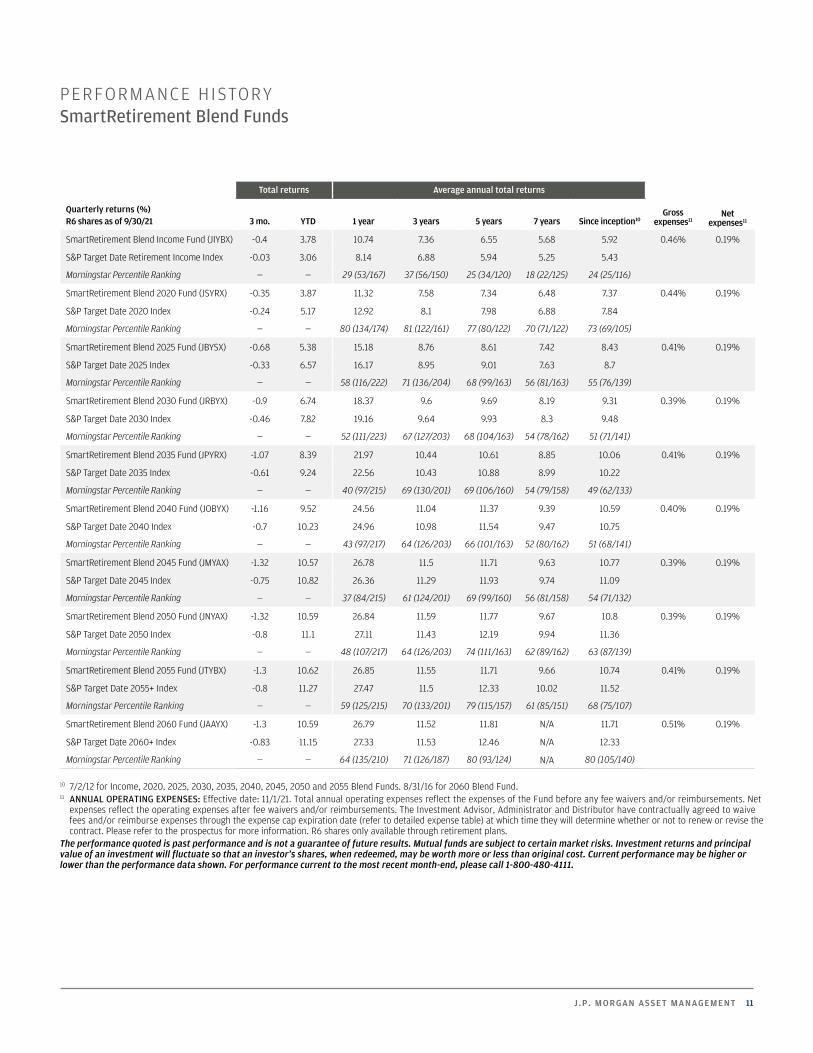
PERFORMANCE HISTORYSmartRetirement Blend Funds
Total returns Average annual total returns
Quarterly returns (%) R6 shares as of 9/30/21 3 mo. YTD 1 year 3 years 5 years 7 years Since inception10
Grossexpenses11
Net expenses11
SmartRetirement Blend Income Fund (JIYBX) -0.4 3.78 10.74 7.36 6.55 5.68 5.92 0.46% 0.19%
S&P Target Date Retirement Income Index -0.03 3.06 8.14 6.88 5.94 5.25 5.43
Morningstar Percentile Ranking — — 29 (53/167) 37 (56/150) 25 (34/120) 18 (22/125) 24 (25/116)
SmartRetirement Blend 2020 Fund (JSYRX) -0.35 3.87 11.32 7.58 7.34 6.48 7.37 0.44% 0.19%
S&P Target Date 2020 Index -0.24 5.17 12.92 8.1 7.98 6.88 7.84
Morningstar Percentile Ranking — — 80 (134/174) 81 (122/161) 77 (80/122) 70 (71/122) 73 (69/105)
SmartRetirement Blend 2025 Fund (JBYSX) -0.68 5.38 15.18 8.76 8.61 7.42 8.43 0.41% 0.19%
S&P Target Date 2025 Index -0.33 6.57 16.17 8.95 9.01 7.63 8.7
Morningstar Percentile Ranking — — 58 (116/222) 71 (136/204) 68 (99/163) 56 (81/163) 55 (76/139)
SmartRetirement Blend 2030 Fund (JRBYX) -0.9 6.74 18.37 9.6 9.69 8.19 9.31 0.39% 0.19%
S&P Target Date 2030 Index -0.46 7.82 19.16 9.64 9.93 8.3 9.48
Morningstar Percentile Ranking — — 52 (111/223) 67 (127/203) 68 (104/163) 54 (78/162) 51 (71/141)
SmartRetirement Blend 2035 Fund (JPYRX) -1.07 8.39 21.97 10.44 10.61 8.85 10.06 0.41% 0.19%
S&P Target Date 2035 Index -0.61 9.24 22.56 10.43 10.88 8.99 10.22
Morningstar Percentile Ranking — — 40 (97/215) 69 (130/201) 69 (106/160) 54 (79/158) 49 (62/133)
SmartRetirement Blend 2040 Fund (JOBYX) -1.16 9.52 24.56 11.04 11.37 9.39 10.59 0.40% 0.19%
S&P Target Date 2040 Index -0.7 10.23 24.96 10.98 11.54 9.47 10.75
Morningstar Percentile Ranking — — 43 (97/217) 64 (126/203) 66 (101/163) 52 (80/162) 51 (68/141)
SmartRetirement Blend 2045 Fund (JMYAX) -1.32 10.57 26.78 11.5 11.71 9.63 10.77 0.39% 0.19%
S&P Target Date 2045 Index -0.75 10.82 26.36 11.29 11.93 9.74 11.09
Morningstar Percentile Ranking — — 37 (84/215) 61 (124/201) 69 (99/160) 56 (81/158) 54 (71/132)
SmartRetirement Blend 2050 Fund (JNYAX) -1.32 10.59 26.84 11.59 11.77 9.67 10.8 0.39% 0.19%
S&P Target Date 2050 Index -0.8 11.1 27.11 11.43 12.19 9.94 11.36
Morningstar Percentile Ranking — — 48 (107/217) 64 (126/203) 74 (111/163) 62 (89/162) 63 (87/139)
SmartRetirement Blend 2055 Fund (JTYBX) -1.3 10.62 26.85 11.55 11.71 9.66 10.74 0.41% 0.19%
S&P Target Date 2055+ Index -0.8 11.27 27.47 11.5 12.33 10.02 11.52
Morningstar Percentile Ranking — — 59 (125/215) 70 (133/201) 79 (115/157) 61 (85/151) 68 (75/107)
SmartRetirement Blend 2060 Fund (JAAYX) -1.3 10.59 26.79 11.52 11.81 N/A 11.71 0.51% 0.19%
S&P Target Date 2060+ Index -0.83 11.15 27.33 11.53 12.46 N/A 12.33
Morningstar Percentile Ranking — — 64 (135/210) 71 (126/187) 80 (93/124) N/A 80 (105/140)
10 7/2/12 for Income, 2020, 2025, 2030, 2035, 2040, 2045, 2050 and 2055 Blend Funds. 8/31/16 for 2060 Blend Fund.11 ANNUAL OPERATING EXPENSES: Effective date: 11/1/21. Total annual operating expenses reflect the expenses of the Fund before any fee waivers and/or reimbursements. Net
expenses reflect the operating expenses after fee waivers and/or reimbursements. The Investment Advisor, Administrator and Distributor have contractually agreed to waive fees and/or reimburse expenses through the expense cap expiration date (refer to detailed expense table) at which time they will determine whether or not to renew or revise the contract. Please refer to the prospectus for more information. R6 shares only available through retirement plans.
The performance quoted is past performance and is not a guarantee of future results. Mutual funds are subject to certain market risks. Investment returns and principal value of an investment will fluctuate so that an investor’s shares, when redeemed, may be worth more or less than original cost. Current performance may be higher or lower than the performance data shown. For performance current to the most recent month-end, please call 1-800-480-4111.

12 JPMORGAN SMARTRETIREMENT FUNDS
STRATEGIC ALLOCATION OF UNDERLYING FUNDSSmartRetirement Funds
12 Strategies that we split between multiple asset classes. 13 Enhanced Index Strategy Effective 4/1/21. No changes made since last quarter.Funds in blue denote strategies that we split between multiple asset classes. Over time the asset allocation becomes more conservative for the target retirement date funds (that is, excluding the Income Fund). Furthermore, the products shown are likely to change to ensure that optimal portfolio construction is maintained. As of 4/20/20, the International Unconstrained Equity Fund has been renamed to International Focus Fund.
Asset Class/Strategy Benchmark Ticker Income 2020 2025 2030 2035 2040 2045-2060
Total Equities 32.50% 32.50% 48.50% 61.00% 73.00% 82.00% 91.00%
JPM US Equity S&P 500 JUEMX 9.26% 9.26% 13.85% 17.42% 8.75% 9.79% 10.88%
JPM Equity Income Russell 1000 Value OIEJX 4.99% 4.99% 7.46% 9.38% — — —
JPM US Research Enhanced Equity S&P 500 JDEUX — — — — 8.75% 9.79% 10.88%
JPM Growth Advantage12 Russell 3000 Growth JGVVX — — — — 7.30% 8.19% 9.10%
JPM Value Advantage12 Russell 3000 Value JVAYX — — — — 7.30% 8.19% 9.10%
JPM BetaBuilders US Mid Cap Equity ETF Morningstar US Mid Cap Target Market Exposure Extended BBMC 1.98% 1.98% 2.94% 3.69% 1.85% 2.10% 2.33%
JPM Small Cap Equity Russell 2000 VSENX 0.66% 0.66% 0.98% 1.23% 0.93% 1.05% 1.16%
JPM Small Cap Growth Russell 2000 Growth JGSMX 0.33% 0.33% 0.49% 0.62% 0.46% 0.53% 0.58%
JPM Small Cap Value Russell 2000 Value JSVUX 0.33% 0.33% 0.49% 0.62% 0.46% 0.53% 0.58%
JPM Realty Income MSCI REIT JPINX 1.46% 1.46% 2.18% 2.74% 3.26% 3.71% 4.09%
JPM BetaBuilders MSCI US REIT ETF MSCI REIT BBRE 0.49% 0.49% 0.73% 0.91% 1.09% 1.24% 1.36%JPM International Research Enhanced Equity MSCI EAFE JEIQX 3.41% 3.41% 5.09% 6.41% 6.57% 7.38% 8.19%
JPM International Equity MSCI EAFE JNEMX 6.34% 6.34% 9.46% 11.90% 4.38% 4.92% 5.46%
JPM International Focus Fund MSCI ACWI ex. US IUENX — — — — 10.95% 12.30% 13.65%
JPM Emerging Markets Equity MSCI EM Free JEMWX 3.25% 3.25% 4.85% 6.10% — — —JPM Emerging Markets Research Enhanced Equity MSCI EM Free EMRSX — — — — 7.30% 8.20% 9.10%
Fixed Income 62.50% 62.50% 51.50% 39.00% 27.00% 18.00% 9.00%
JPM Inflation Managed Bond Barclays Capital US TIPS 1—10 Year JIMMX 7.50% 7.50% 3.00% — — — —
JPM Floating Rate Income Credit Suisse Leveraged Loan Index JPHRX 1.25% 1.25% 1.00% — — — —
JPM Income Fund Barclays Capital Aggregate JMSFX 1.75% 1.75% 1.23% 1.00% — — —
JPM High Yield Bond Barclays Capital High Yield 2% Issuer Capped JHYUX 3.50% 3.50% 2.46% 2.00% 1.70% 1.40% 0.98%
JPMorgan High Yield Research Enhanced ETF13
Barclays Capital High Yield 2% Issuer Capped JPHY 3.50% 3.50% 2.46% 2.00% 1.70% 1.40% 0.98%
JPM Emerging Markets Debt JPM EMBI Global Diversified JEMVX 1.88% 1.88% 1.60% 1.40% 1.00% 0.75% 0.48%
JPM Emerging Markets Strategic Debt JPM EMBI Global Diversified JECUX 1.88% 1.88% 1.60% 1.40% 1.00% 0.75% 0.48%
JPM Short Duration Core Plus Barclays 1—5 Year JSDRX 14.44% 14.44% 13.35% 10.92% — — —
JPM Core Bond Barclays Capital Aggregate JCBUX 26.81% 26.81% 24.80% 20.28% 5.40% 3.43% 1.53%
JPM Core Plus Bond Barclays Capital Aggregate JCPUX — — — — 16.20% 10.28% 4.58%
Total Cash Alternatives 5.00% 5.00% — — — — —
JPM U.S. Government Money Market US T-Bills MGMXX 5.00% 5.00% — — — — —

J .P. MORGAN ASSET MANAGEMENT 13
STRATEGIC ALLOCATION OF UNDERLYING FUNDSSmartRetirement Blend Funds
Effective 5/1/21. Funds in blue denote strategies that are passively implemented. Over time the asset allocation becomes more conservative for the target retirement date funds (that is, excluding the Income Fund). Furthermore, the products shown are likely to change to ensure that optimal portfolio construction is maintained. * Enhanced index strategy.** For the JPM Core Bond Strategy, we are invested in a separate account in the Income to 2030 funds and the mutual fund in the 2035 to 2060 funds.
Asset Class/Strategy Benchmark Income 2020 2025 2030 2035 2040 2045-2060
Total Equities 32.50% 32.50% 48.50% 61.00% 73.00% 82.00% 91.00%
JPM Equity Index S&P 500 14.25% 14.25% 21.30% 26.80% 32.10% 35.95% 39.95%
JPM BetaBuilders US Mid Cap Equity ETF Morningstar US Mid Cap Target Market Exposure Extended 1.98% 1.98% 2.94% 3.69% 4.41% 4.98% 5.52%
JPM BetaBuilders US Small Cap Equity ETF Morningstar US Small Cap Target Market Exposure Extended 1.32% 1.32% 1.96% 2.46% 2.94% 3.32% 3.68%
JPM BetaBuilders International Equity ETF Morningstar Developed Markets ex-North America Target Market Exposure 9.75% 9.75% 14.55% 18.30% 21.90% 24.60% 27.30%
JPM Emerging Markets Research Enhanced Equity MSCI EM Free — — 4.85% 6.10% 7.30% 8.20% 9.10%
iShares Core MSCI Emerging Markets ETF MSCI EM Free 3.25% 3.25% — — — — —
JPM BetaBuilders MSCI US REIT ETF MS REIT 1.95% 1.95% 2.90% 3.65% 4.35% 4.95% 5.45%
Total Fixed Income 62.50% 62.50% 51.50% 39.00% 27.00% 18.00% 9.00%
JPM Inflation Managed Bond Barclays Capital US TIPS 1—10 Year 7.50% 7.50% 3.00% — — — —
JPM Floating Rate Income Credit Suisse Leveraged Loan Index 1.25% 1.25% 1.00% — — — —
JPM Income Barclays Capital Aggregate 1.75% 1.75% 1.23% 1.00% — — —
JPM High Yield Bond Barclays Capital High Yield 2% Issuer Capped 3.50% 3.50% 2.46% 2.00% 1.70% 1.40% 0.98%
JPM High Yield Research Enhanced ETF* Barclays Capital High Yield 2% Issuer Capped 3.50% 3.50% 2.46% 2.00% 1.70% 1.40% 0.98%
JPM Emerging Markets Debt JPM EMBI Global Diversified 1.88% 1.88% 1.60% 1.40% 1.00% 0.75% 0.48%
JPM Emerging Markets Strategic Debt JPM EMBI Global Diversified 1.88% 1.88% 1.60% 1.40% 1.00% 0.75% 0.48%
JPM Short Duration Core Plus Barclays 1-5 Year 8.25% 8.25% 7.63% 6.24% — — —
JPM Core Bond** Barclays Capital Aggregate 24.75% 24.75% 22.89% 18.72% 4.32% 2.74% 1.22%
JPM Core Plus Bond Barclays Capital Aggregate — — — — 12.96% 8.22% 3.66%
JPM US Aggregate Bond ETF* Barclays Capital Aggregate 8.25% 8.25% 7.63% 6.24% 4.32% 2.74% 1.22%
Total Cash Alternatives 5.00% 5.00% — — — — —
JPM U.S. Government Money Market US T-Bills 5.00% 5.00% — — — — —
Total Passive Exposure 32.50% 32.50% 43.65% 54.90% 65.70% 73.80% 81.90%

14 JPMORGAN SMARTRETIREMENT FUNDS
COMPARISON OF UNDERLYING FUNDSSmartRetirement and SmartRetirement Blend
JPMorgan SmartRetirement Funds JPMorgan SmartRetirement Blend Funds
ASSET CLASS/STRATEGY ASSET CLASS/STRATEGY
TOTA
L CA
SH
& C
ASH
EQ
UIV
ALEN
TS
JPM U.S. Government Money Market JPM U.S. Government Money Market
FIXE
D IN
COM
E
JPM Floating Rate Income JPM Floating Rate Income
JPM High Yield Bond JPM High Yield Bond
JPM High Yield Research Enhanced ETF JPM High Yield Research Enhanced ETF
JPM Income JPM Income
JPM Short Duration Core Plus JPM Short Duration Core Plus
JPM Core Bond JPM Core Bond
JPM Core Plus Bond JPM Core Plus Bond
JPM Emerging Markets Debt JPM Emerging Markets Debt
JPM Emerging Markets Strategic Debt JPMorgan US Aggregate Bond ETF
JPM Emerging Markets Strategic Debt
U.S
. LAR
GE C
AP
JPM US Equity
JPM Equity Index14
JPM Equity Income
JPM Growth Advantage15
JPM Value Advantage15
JPM US Research Enhanced Equity
U.S
. SM
ALL/
MID
CAP JPM Growth Advantage15
JPM BetaBuilders US Small Cap Equity ETF14
JPM BetaBuilders US Mid Cap Equity ETF14
JPM Value Advantage15
JPM BetaBuilders US Mid Cap Equity ETF14
JPM Small Cap Equity
JPM Small Cap Growth
JPM Small Cap Value
INTE
RNAT
ION
AL
EQU
ITY
JPM International Research Enhanced Equity JPM BetaBuilders International Equity ETF14
JPM Emerging Markets Research Enhanced Equity
iShares Core MSCI Emerging Markets ETF14
JPM International Equity
JPM International Focus
JPM Emerging Markets Equity
JPM Emerging Markets Research Enhanced Equity
REIT
s JPM Realty IncomeJPM BetaBuilders MSCI US REIT ETF14
JPM BetaBuilders MSCI US REIT ETF14
INFL
ATIO
N
MAN
AGED
JPM Inflation Managed Bond JPM Inflation Managed Bond
Effective 9/30/21. 14 Denotes passively managed strategies.15 All-cap strategy.
SmartRetirement Funds invest primarily in actively managed mutual funds, while SmartRetirement Blend Funds include more passive ETFs. In general, we use active strategies in asset classes where our managers and research analysts can add the most value, such as bonds and emerging markets stocks. Passive strategies are used to gain low-cost access to more efficient markets where benchmarks can be easily replicated.

J .P. MORGAN ASSET MANAGEMENT 15
LEARN MORE
Contact your J.P. Morgan representative for
more information about SmartRetirement Funds and
additional target date solutions available to
retirement plans, including custom strategies.

NOT FDIC INSURED • NO BANK GUARANTEE • MAY LOSE VALUE
jpmorganfunds.com
Contact J.P. Morgan Funds Advisor Service Center at 1-800-480-4111 or visit jpmorganfunds.com for a fund prospectus. Investors should carefully consider the investment objectives and risks as well as charges and expenses of the mutual fund before investing. The prospectus contains this and other information about the mutual fund. Read the prospectus carefully before investing.
This document is a general communication being provided for informational purposes only. It is educational in nature and not designed to be a recommendation for any specific investment product, strategy, plan feature or other purposes. By receiving this communication you agree with the intended purpose described above. Any examples used in this material are generic, hypothetical and for illustration purposes only. None of J.P. Morgan Asset Management, its affiliates or representatives is suggesting that the recipient or any other person take a specific course of action or any action at all. Communications such as this are not impartial and are provided in connection with the advertising and marketing of products and services. Prior to making any investment or financial decisions, an investor should seek individualized advice from personal financial, legal, tax and other professionals that take into account all of the particular facts and circumstances of an investor’s own situation. This fund incorporates Environmental, Social and Governance (ESG) information as part of the investment decision-making process. Investing on the basis of sustainability/ESG criteria involves qualitative and subjective analysis. There is no guarantee that the determinations made by the adviser will align with the beliefs or values of a particular investor. Companies identified by an ESG policy may not operate as expected, and adhering to an ESG policy may result in missed opportunities.TARGET DATE FUNDS: The JPMorgan SmartRetirement Funds are target date funds with the target date being the approximate date when investors plan to retire. Generally, the asset allocation of each Fund will change on an annual basis with the asset allocation becoming more conservative as the Fund nears the target retirement date. The principal value of the Fund(s) is not guaranteed at any time, including at the target date. CONFLICTS OF INTEREST: Refer to the Conflicts of Interest section of the Fund’s Prospectus. RISKS ASSOCIATED WITH INVESTING IN THE FUNDS: The underlying funds may use derivatives, which are instruments that have a value based on another instrument, exchange rate or index. In addition, the Fund may invest directly in derivatives. Derivatives may be riskier than other types of investments because they may be more sensitive to changes in economic and market conditions and could result in losses that significantly exceed the Fund’s or the underlying Funds’ original investments. Many derivatives will give rise to a form of leverage. As a result, the Fund or an underlying fund may be more volatile than if the Fund or the underlying Fund had not been leveraged because the leverage tends to exaggerate the effect of any increase or decrease in the value of the Fund’s or the underlying Fund’s portfolio securities. Derivatives are also subject to the risk that changes in the value of a derivative may not correlate perfectly with the underlying asset, rate or index. The use of derivatives for hedging or risk management purposes or to increase income or gain may not be successful, resulting in losses and the cost of such strategies may reduce the Fund’s or the underlying funds’ returns. Derivatives also expose the Fund or the underlying funds to the credit risk of the derivative counterparty.To achieve its strategy, the Fund may invest in other underlying collective trust fund and exchange-traded fund, so the Fund’s investment performance is directly related to the performance of the underlying funds. The investment objective of an underlying fund may differ from, and an underlying fund may have different risks than, the Fund. There is no assurance that the underlying funds will achieve their investment objectives. International investing involves increased risk and volatility due to possibilities of currency exchange rate volatility, political, social or economic instability, foreign taxation and differences in auditing and other financial standards. The Fund may invest a portion of its securities in small-cap stocks. Small-capitalization funds typically carry more risk than stock funds investing in well-established “blue-chip” companies since smaller companies generally have a higher risk of failure. Historically, smaller companies’ stock has experienced a greater degree of market volatility than the average stock. The Fund may invest in securities that are below investment grade (i.e., “high yield” or “junk bonds”) that are generally rated in the fifth or lower rating categories of Standard & Poor’s and Moody’s Investors Service. Although these securities tend to provide higher yields than higher-rated securities, there is a greater risk that the Fund’s share price will decline.Real estate investing may be subject to a higher degree of market risk because of concentration in a specific industry, sector or geographical sector. Real estate investing may be subject to risks including, but not limited to, declines in the value of real estate, risks related to general and economic conditions, changes in the value of the underlying property owned by the trust and defaults by borrower.There may be additional fees or expenses associated with investing in a Fund of Funds strategy.Asset allocation/diversification does not guarantee investment returns and does not eliminate the risk of loss.MORNINGSTAR DISCLOSURE: The Morningstar RatingTM for funds, or “star rating,” is calculated for managed products (including mutual funds, variable annuity and variable life subaccounts, exchange-traded funds, closed-end funds and separate accounts) with at least a three-year history. Exchange-traded funds and open-ended mutual funds are considered a single population for comparative purposes. It is calculated based on a Morningstar Risk-Adjusted Return measure that accounts for variation in a managed product’s monthly excess performance, placing more emphasis on downward variations and rewarding consistent performance. The top 10% of products in each product category receive 5 stars, the next 22.5% receive 4 stars, the next 35% receive 3 stars, the next 22.5% receive 2 stars and the bottom 10% receive 1 star. The Overall Morningstar Rating for a managed product is derived from a weighted average of the performance figures associated with its three-, five- and 10-year (if applicable) Morningstar Rating metrics. The weights are: 100% three-year rating for 36-59 months of total returns, 60% five-year rating/40% three-year rating for 60-119 months of total returns and 50% 10-year rating/30% five-year rating/20% three-year rating for 120 or more months of total returns. While the 10-year overall star rating formula seems to give the most weight to the 10-year period, the most recent three-year period actually has the greatest impact because it is included in all three rating periods. Rankings do not take sales loads into account.Some of Morningstar’s proprietary calculations, including the Morningstar Rating™, are not customarily calculated based on adjusted historical returns. However, for new share classes/channels, Morningstar may calculate an extended performance Morningstar Rating. The extended performance is calculated by adjusting the historical total returns of the oldest share class of a fund to reflect the fee structure of the younger share class/channel, attaching this data to the younger share class’ performance record and then compounding the adjusted plus actual monthly returns into the extended performance Morningstar Risk-Adjusted Return for the three-, five- and 10-year time periods. The Morningstar Risk-Adjusted Returns are used to determine the extended performance Morningstar Rating. The extended performance Morningstar Rating for this fund does not affect the retail fund data published by Morningstar, as the bell curve distribution on which the ratings are based includes only funds with actual returns. The Overall Morningstar Rating for multi-share funds is based on actual performance only or extended performance only. Once the share class turns three years old, the Overall Morningstar Rating will be based on actual ratings only. The Overall Morningstar Rating for multi-share variable annuities is based on a weighted average of any ratings that are available. There can be no assurance that the professionals currently employed by JPMAM will continue to be employed by JPMAM or that the past performance or success of any such professional serves as an indicator of such professional’s future performance or success.Total return assumes reinvestment of dividends and capital gains distributions and reflects the deduction of any sales charges, where applicable. Performance may reflect the waiver of a portion of the Fund’s advisory or administrative fees for certain periods since the inception date. If fees had not been waived, performance would have been less favorable.J.P. Morgan Funds are distributed by JPMorgan Distribution Services, Inc., which is an affiliate of JPMorgan Chase & Co. Affiliates of JPMorgan Chase & Co. receive fees for providing various services to the funds. JPMorgan Distribution Services, Inc. is a member of FINRA.J.P. Morgan Asset Management is the marketing name for the asset management business of JPMorgan Chase & Co. and its affiliates worldwide.If you are a person with a disability and need additional support in viewing the material, please call us at 1-800-343-1113 for assistance.© JPMorgan Chase & Co., November 2021BRO-SR-SRB097e210909163849