july 26 – 28, 2004 renaissance cleveland hotel cleveland, ohio 2004 economic development &...
TRANSCRIPT

July 26 – 28, 2004Renaissance Cleveland Hotel
Cleveland, Ohio
2004 Economic Development
& Utility Marketing Workshop
American Public Power Association

Corporate December
2003
AREADEVELOPMENTSITE AND FACILITY PLANNING
18th Annual2003
SurveyTo read the full corporate survey go to: www.AreaDevelopment.com/FrameCorpSurvey.html

Titles 2003 2002
Chairman, President, Partner, CEO or Owner 30% 28%
V.P., Treasurer, Secretary, or Other Corporate Officer
42% 39%
Real Estate Mgr./Dir.; Facility Mgr./Dir.; Development Mgr./Dir.; V.P. Real Estate
19% 25%
Corporate Manager 9% 8%
Respondent’s level of involvement in company’s location decision: 2003 2002
Final decision 38% 45%
Preliminary decision 31% 18%
Information Gathering 30% 31%
Not involved 1% 6%
RESPONDENT DEMOGRAPHICS
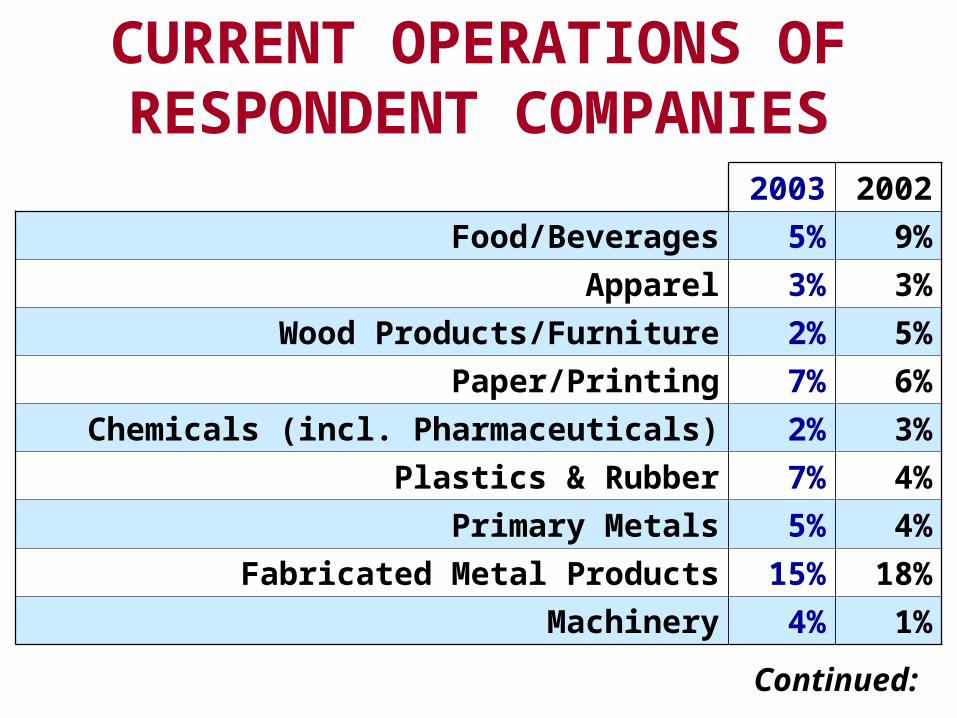
2003 2002
Food/Beverages 5% 9%
Apparel 3% 3%
Wood Products/Furniture 2% 5%
Paper/Printing 7% 6%
Chemicals (incl. Pharmaceuticals) 2% 3%
Plastics & Rubber 7% 4%
Primary Metals 5% 4%
Fabricated Metal Products 15% 18%
Machinery 4% 1%
CURRENT OPERATIONS OF RESPONDENT COMPANIES
Continued:

2003 2002
Computers & Electric Products 4% 6%
Electrical Equipment & Components 10% 9%
Transportation Equip. (incl. Motor Vehicles) 7% 6%
Warehousing/Distribution 3% 6%
Software Development 4% 3%
Retail 2% 1%
Consulting/Professional Services 4% 2%
Financial Services, Ins., R.E. 1% 2%
Other 15% 9%
Continued:
CURRENT OPERATIONS OF RESPONDENT COMPANIES

2003 2002
50 – 99 7% 5%
100 – 499 51% 44%
500 – 999 13% 16%
1,000 OR MORE 29% 34%
COMPANIES’ GLOBAL EMPLOYMENT
Number of Employees
(All Facilities)

2003 2002 2001
Increased number of facilities by
3 or more
3% 14% 13%
Increased number of facilities by
2 or fewer
13% 15% 17%
Number of facilities not changed 67% 56% 52%
Decreased number of facilities by
3 or more
11% 7% 8%
Decreased number of facilities by
2 or fewer
6% 8% 10%
FACILITIES (12-MONTH COMPARISON)

Number of domestic facilities currently operated:
2003 2002
1 25% 24%
2 22% 13%
3 11% 11%
4 4% 8%
5 OR MORE 38% 44%
Number of foreign facilities currently operated worldwide:
2003 2002
1 22% 25%
2 12% 12%
3 15% 4%
4 2% 2%
5 OR MORE 49% 57%
WHERE ARE YOUR FACILITIES?
SITE SELECTION FACTORS
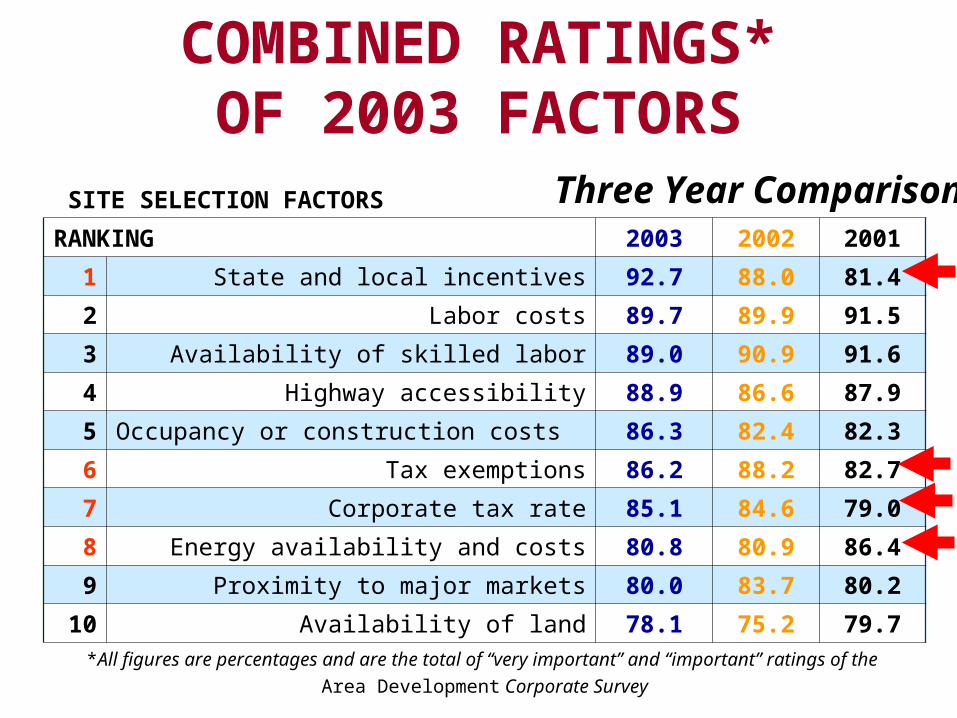
RANKING 2003 2002 2001
1 State and local incentives 92.7 88.0 81.4
2 Labor costs 89.7 89.9 91.5
3 Availability of skilled labor 89.0 90.9 91.6
4 Highway accessibility 88.9 86.6 87.9
5 Occupancy or construction costs 86.3 82.4 82.3
6 Tax exemptions 86.2 88.2 82.7
7 Corporate tax rate 85.1 84.6 79.0
8 Energy availability and costs 80.8 80.9 86.4
9 Proximity to major markets 80.0 83.7 80.2
10 Availability of land 78.1 75.2 79.7*All figures are percentages and are the total of “very important” and “important” ratings of the
Area Development Corporate Survey
COMBINED RATINGS*OF 2003 FACTORS
Three Year Comparison

SITE SELECTION FACTORS
RANKING 2003 2002 2001
11 Availability of telecom services 77.9 76.1 83.3
12 Cost of land 77.3 74.0 77.3
13 Environmental regulations 72.9 76.7 78.8
14 Low union profile 71.6 69.4 78.0
15 Availability of broadband telecom 67.4 66.7 61.3
16 Right-to-work state 60.8 58.0 67.6
17 Proximity to suppliers 58.5 61.8 67.1
18 Availability of long-term financing 57.5 60.0 48.7
19T Raw materials availability 55.8 56.0 64.6
19T Availability of unskilled labor 55.8 55.1 59.5
*All figures are percentages and are the total of “very important” and “important” ratings of the Area Development Corporate Survey
CONTINUED –
Three Year Comparison
COMBINED RATINGS*OF 2003 FACTORS
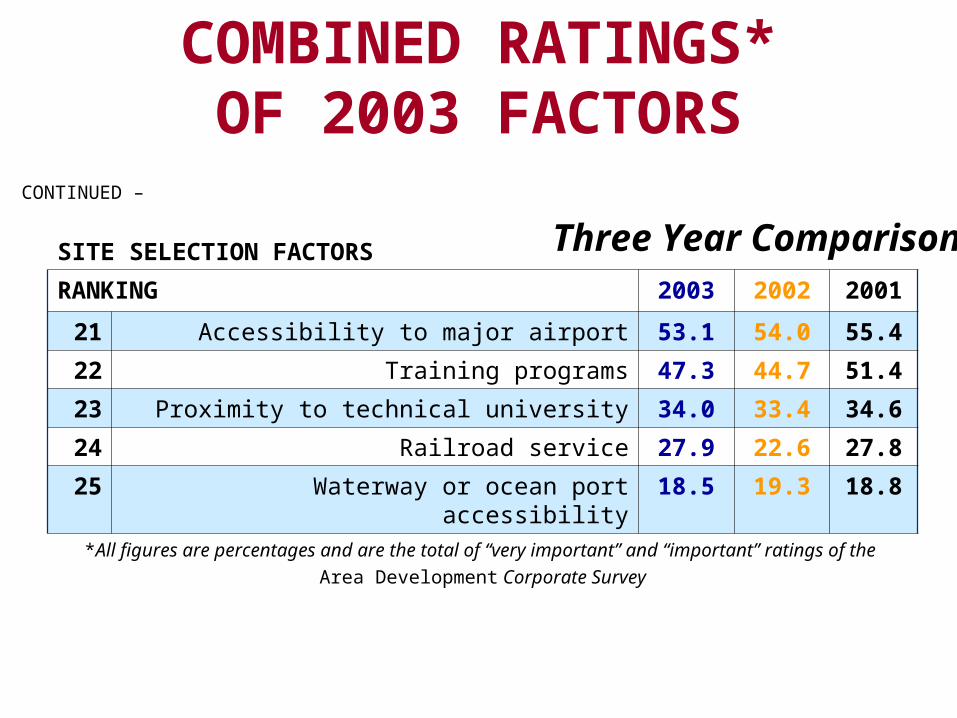
SITE SELECTION FACTORS
RANKING 2003 2002 2001
21 Accessibility to major airport 53.1 54.0 55.4
22 Training programs 47.3 44.7 51.4
23 Proximity to technical university 34.0 33.4 34.6
24 Railroad service 27.9 22.6 27.8
25 Waterway or ocean port accessibility 18.5 19.3 18.8*All figures are percentages and are the total of “very important” and “important” ratings of the
Area Development Corporate Survey
CONTINUED –
Three Year Comparison
COMBINED RATINGS*OF 2003 FACTORS

QUALITY-OF-LIFE FACTORS
RANKING 2003 2002 2001
1 Low crime rate 69.8 75.9 74.4
2 Health facilities 64.2 67.2 65.3
3 Housing availability 59.0 64.2 57.3
4 Ratings of public schools 57.3 65.7 57.2
5 Housing costs 56.3 63.0 60.6
6 Climate 49.5 43.5 47.4
7 Colleges and universities in area 49.0 48.1 44.8
8 Recreational opportunities 47.9 45.9 39.2
9 Cultural opportunities 46.3 46.3 40.3
*All figures are percentages and are the total of “very important” and “important” ratings of the
Area Development Corporate Survey
Three Year Comparison
COMBINED RATINGS*OF 2003 FACTORS

FINANCIAL FACTORS
RANKING 2003 2002 2001
1 State and local incentives 92.7 88.0 81.4
6 Tax exemptions 86.2 88.2 82.7
7 Corporate tax rate 85.1 84.6 79.0
18 Availability of long-term financing 57.5 60.0 48.7*All figures are percentages and are the total of
“very important” and “important” ratings of the
Area Development Corporate Survey
Three Year Comparison
COMBINED RATINGS*OF 2003 FACTORS

INCENTIVES #1
“For the first time in the history of the survey, state and local incentives has eclipsed labor costs and availability of skilled labor as the number-one factor in corporate site selection decisions. States and areas that have chosen to believe that incentives don’t matter are in for a shock”.
By James H. Renzas; President
Location Management Services, LLC
Mission Viejo, CA

INCENTIVES #2
“Incentives, incentives, incentives is the new mantra of American manufacturers. Has this mantra replaced location, location, location? Certainly, for the United States, Canada, and increasingly Mexico, incentives have rapidly grown to be the critical key to unlocking the door to job and investment growth.”
By Ronald R. Pollina, Ph.D.
Pollina Corporate Real Estate, Inc.
Park Ridge, IL

INCENTIVES #3
“It’s not surprising that incentives continue to play a critical role in the site selection decisions of the manufacturing respondents. In fact, 48 percent said they are even more important now than in the past. As the battle over attracting certain target industries continues, the offering of incentives will continue to differentiate a community.”
By John M. Rhodes; President
Moran, Stahl & Boyer, LLC
Duluth, GA

TAXES #1
“In today’s highly competitive job environment, states need every tool they can get. A good tax climate is often not enough. The U.S. Congress, as well as state governments, must offer tax credits or other incentives to those companies willing to invest in technology and training in order to allow low-skilled workers to produce products at competitive costs.”
By Ronald R. Pollina, Ph.D.
Pollina Corporate Real Estate, Inc.
Park Ridge, IL

TAXES #2
“When the scores for tax exemptions (number six) and state and local incentives are combined to reflect the fact that many incentives come in the form of tax exemptions, the evidence is overwhelming – incentives do matter”.
By James H. Renzas; President
Location Management Services, LLC
Mission Viejo, CA

SITE FACTORS
RANKING 2003 2002 2001
5 Occupancy or construction costs 86.3 82.4 82.3
10 Availability of land 78.1 75.2 79.7*All figures are percentages and are the total of
“very important” and “important” ratings of the
Area Development Corporate Survey
Three Year Comparison
COMBINED RATINGS*OF 2003 FACTORS

BUILDING AVAILABILITY
“To the extent that companies will be investing capital in new facilities, there is a gradual but material shift toward production, operational, or other income-producing assets and away from corporate-level, back office, or R&D assets.”
By Rhett L. Weiss, Esq.; CEO
Dealtek, LTD.
Skaneateles, NY

WORK FORCE FACTORS
RANKING 2003 2002 2001
2 Labor costs 89.7 89.9 91.5
3 Availability of skilled labor 89.0 90.0 91.6*All figures are percentages and are the total of
“very important” and “important” ratings of the
Area Development Corporate Survey
Three Year Comparison
COMBINED RATINGS*OF 2003 FACTORS

“Last year’s number-one ranked factor, availability of skilled labor, slid to number three, while labor costs, number two last year, continues to hold this rank. If we continue to lose manufacturing jobs, availability of skilled labor will continue to slide down the chart.”
By Ronald R. Pollina, Ph.D.
Pollina Corporate Real Estate, Inc.
Park Ridge, IL
WORK FORCE #1

WORK FORCE #2
“Work force productivity and quality are an integral part of the “cost-of-doing-business” equation, and communities should be prepared to offer a high-performance work force – trained and ready to go at the start of operations for new facilities.”
By Ed McCallum; Senior Principal
McCallum Sweeney Consulting, Inc.
Greenville, SC
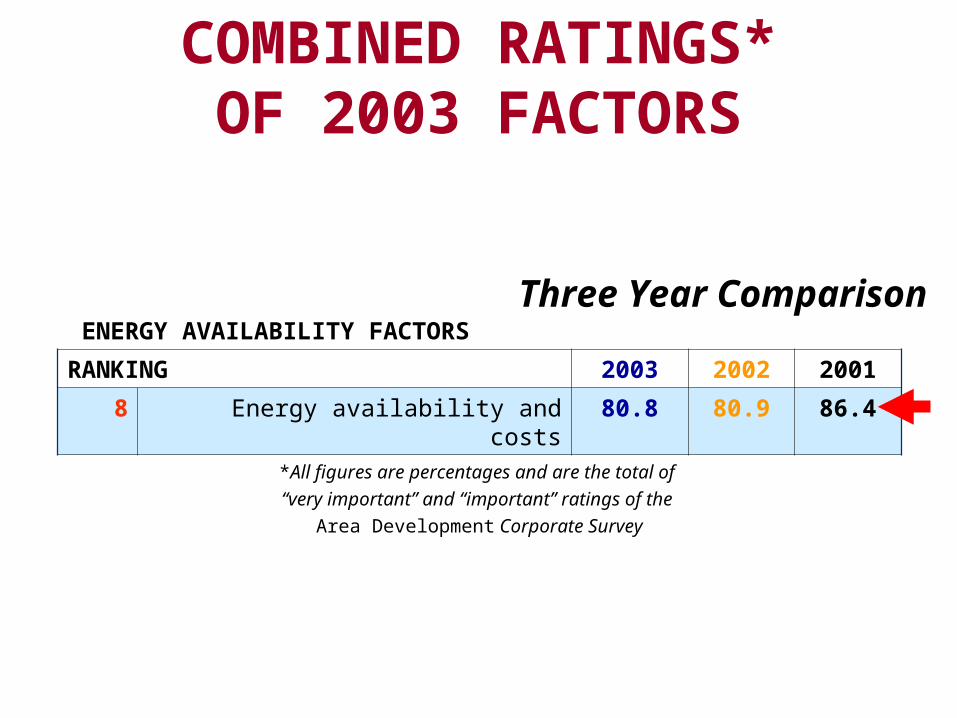
ENERGY AVAILABILITY FACTORS
RANKING 2003 2002 2001
8 Energy availability and costs 80.8 80.9 86.4*All figures are percentages and are the total of
“very important” and “important” ratings of the
Area Development Corporate Survey
Three Year Comparison
COMBINED RATINGS*OF 2003 FACTORS

2003 2002 2001
1 year 13% 18% 20%
2 years 15% 16% 15%
3 years 9% 13% 10%
4 years plus 5% 5% 5%
No plans 58% 48% 51%
GROWTH PROSPECTS
Expect to open new facilities within:
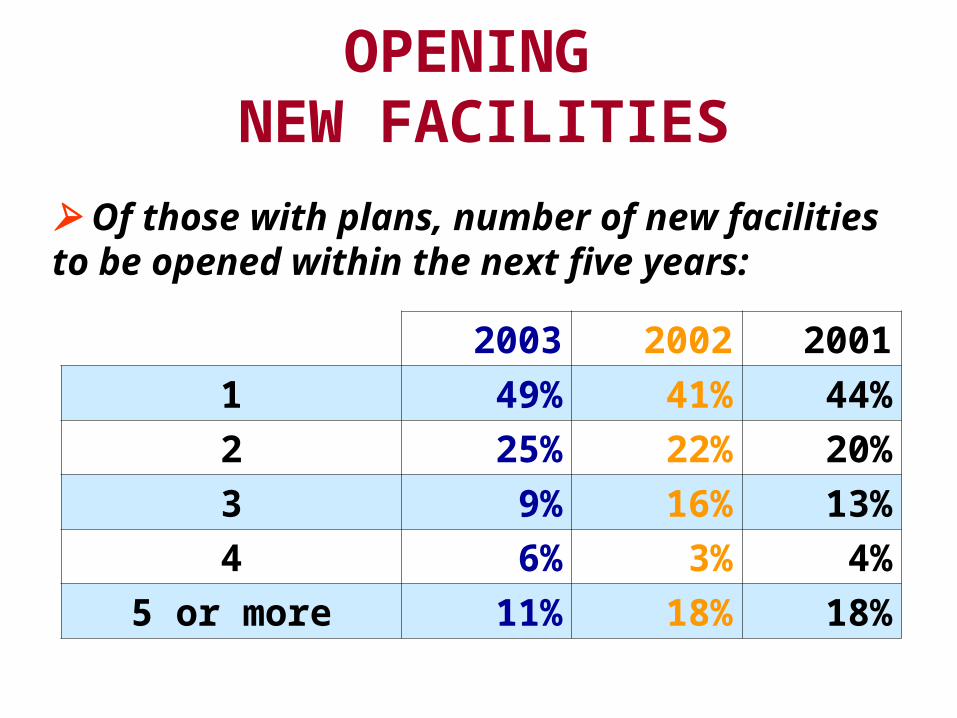
2003 2002 2001
1 49% 41% 44%
2 25% 22% 20%
3 9% 16% 13%
4 6% 3% 4%
5 or more 11% 18% 18%
OPENING NEW FACILITIES
Of those with plans, number of new facilities to be opened within the next five years:
BUILDING AVAILABILITY
“Yet, there are clearly downward trends over the last four years in the number of companies expecting to open new facilities over the one-to-three-year time horizon as well as in the number of expected new facilities. In other words, improving economic conditions do not necessarily mean a bunch of new facilities. Rather, companies plan to be judicious in their use of capital for bricks and mortar, even as their businesses improve.”
By Rhett L. Weiss, Esq.; CEO,
Dealtek, LTD.
Skaneateles, NY

Expect to relocate a facility within: 2003 2002 2001
1 year 6% 14% 18%
2 years 15% 5% 4%
3 years 4% 6% 6%
4 years or more 7% 2% 2%
No plans 68% 73% 71%
RELOCATION OR EXPANSION
Expect to expand existing facilities within: 2003 2002 2000
1 year 18% 21% 19%
2 years 14% 15% 21%
3 years 10% 13% 8%
4 years or more 11% 3% 5%
No plans 47% 48% 46%

2003 2002 2001
Labor costs 19% 16% 23%
Labor availability 9% 11% 11%
Operating/Occupancy Costs 22% 23% 23%
Proximity to suppliers/markets served 20% 30% 31%
Need for improved business climate 15% 9% 6%
Other 15% 11% 17%
PLANT RELOCATION
Of those planning a relocation, the primary reason is:

2003 2002 2001 2000 1999
New England 7% 8% 8% 7% 5%
Middle Atlantic 8% 10% 7% 10% 9%
South Atlantic 8% 4% 10% 10% 11%
Mid-South 12% 10% 9% 9% 11%
South 9% 11% 11% 13% 12%
Midwest 13% 13% 16% 14% 18%
Plains 8% 6% 7% 8% 6%
Mountain 5% 6% 6% 3% 4%
Southwest 11% 11% 12% 12% 10%
West 14% 15% 11% 12% 11%
P.R. / U.S. V.I. 5% 5% 4% 3% 3%
SURVEY TREND OVER 5 YEARS Where will new domestic facilities be located?
(Percent of total projects)

Domestic Facilities: 2003 2002 2001
Manufacturing 45% 37% 45%
Headquarters 8% 10% 3%
Distribution/Warehouse 21% 22% 22%
Office 8% 12% 20%
Call Center 2% 5% N/A
R&D 6% 6% 6%
Other 10% 8% 3%
Type of new domestic facilities to be opened:

2003 2002 2001 2000 1999
Mexico 10% 20% 21% 22% 28%
Caribbean NR 2% 2% 4% 2%
Canada 7% 13% 7% 9% 13%
South America 5% 4% 12% 7% 9%
Western Europe 20% 15% 16% 18% 18%
Eastern Europe 7% 13% 12% 11% 3%
Middle East NR 4% 2% 4% 3%
Africa 2% 3% 2% 2% 2%
Asia 44% 21% 21% 16% 16%
Australia 2% 4% 5% 2% N/A
SURVEY TREND OVER 5 YEARS Where will new foreign facilities be located?
(Percent of total projects)

FOREIGN OPERATIONS“Many companies are finding it difficult not to take advantage of the economies offered in Asian manufacturing for materials and component sourcing. In addition, there are greater expectations of work force quality than ever before. Therefore, in order to compete, companies must find the best skills for a particular operation at the best price. Increasingly, Russia, India, China, and other Asian countries are able to meet this challenge. High-level capabilities at an affordable price are creating increased pressure to improve skill levels in the United States.”
By Ed McCallum; Senior Principal
McCallum Sweeney Consulting, Inc.
Greenville, SC

FOREIGN OPERATIONS
“The 2002 and 2003 responses both indicated that the top-three choices for foreign facilities are Asia, Western Europe, and Mexico. However, their relative proportions have changed dramatically. This reflects the continued slowing of the NAFTA region, the “hockey stick” rise of Asia, and the resurgence of Western Europe as the preferred places for U.S.-originated FDI.”
By Rhett L. Weiss, Esq.; CEO,
Dealtek, LTD.
Skaneateles, NY

Foreign Facilities: 2003 2002 2001
Manufacturing 50% 38% 56%
Headquarters 5% 6% N/A%
Distribution/Warehouse 18% 21% 12%
Office 20% 19% 17%
Call Center N/A 4% 2%
R&D 3% 8% 7%
Other 4% 4% 5%
Type of new foreign facilities to be opened:

CONSULTING
2003 2002 2001 2000
Yes 48% 47% 40% 48%
No 51% 53% 60% 52%
Does your company use outside consultants when site selecting?

2003 2002
YES 66% 68%
NO 34% 32%
2003 2002
More important in your decision than other factors
15% 22%
Less important than other factors 38% 34%
Equally important 47% 44%
BUILDING FACTOR
Are available buildings at location under consideration a factor in your location decision?
When choosing a location, would an available building be:
BUILDING AVAILABILITY
“Building availability remains quite important as a factor in the location decisions. Why? Three words: speed to market. The faster to market, the more competitive advantage.”
By Rhett L. Weiss, Esq.; CEO
Dealtek, LTD.
Skaneateles, NY

INTERNET USAGE
2003 2002 2001 2000
Regularly 72% 62% 53% 61%
Occasionally 25% 35% 42% 35%
Never 3% 3% 5% 4%
How often do you use the Internet to obtain business information?

INTERNET USAGE
“All of the typical sources are being used, but almost all are just being used less. I find that savvy companies are increasingly using the Internet to access web-enabled decision-support software to assess and model their strategic decisions.”
By Rhett L. Weiss, Esq.; CEO
Dealtek, LTD.
Skaneateles, NY

2003 2002 2001 2000
Internet 51% 74% 82% 44%
CD-ROMs/Other software 16% 22% 28% N/A
Site magazines (Area Development, etc.) 62% 77% 85% 62%
Vertical industry magazines (Modern Plastics, etc.)
16% 17% 18% 13%
General business magazines (Business Week, etc.)
22% 33% 38% 29%
Financial publications (The Wall Street Journal, etc.)
32% 30% 33% 28%
Response to
direct mail/e-mail
15% 17% 23% 15%
Response to telemarketing 4% 4% 8% 7%
FINDING INFORMATION
Sources of site selection information used during the past year:

FINDING INFORMATION
2003 2002 2001 2000
Yes, within the last 6 months
5% 12% 14% 19%
Yes, within the
last year
10% 14% 14% 16%
Yes, within the last
2 years or more
21% 9% 15% 19%
Have you recently used Area Development magazine for projects concerning site selection or facility planning?

Thank you for your attention.
AREADEVELOPMENT
400 Post Avenue, Westbury, NY 11590 USA 800-735-2732 Fax: 516-338-0100
To read the full corporate survey go to: www.AreaDevelopment.com/FrameCorpSurvey.html
SITE AND FACILITY PLANNING