juncus roemerianus production and decomposition along
TRANSCRIPT

MARINE ECOLOGY PROGRESS SERIES Mar. Ecol. Prog. Ser.
Published December 15
Juncus roemerianus production and decomposition along gradients of salinity and
hydroperiod
Robert R. Christian, Wade L. Bryant Jr*, Mark M. Brinson
Department of Biology, East Carolina University. Greenville, North Carolina 27858, USA
ABSTRACT: Juncus roemerianus Scheele, the black needlerush, dominates much of an irregularly flooded salt marsh at the Cedar Island National Wildhfe Refuge, North Carolina, USA. We examined its dynamics of growth, senescence, and decomposition along a 1.6 km transect into the marsh over salinity and hydroperiod gradients passing successively through 3 distinct vegetational zones. Little difference was noted among zones in any of the dynamic aspects examined. Aerial, annual net primary production of J. roernerianus averaged 812 g dry mass m-2. This rate is comparable to that of J. roemerianusin other North Carolina marshes. Measured parameters for production estimates were production-to-biomass ratio, frequency of replacement of growing leaves (number of times per year in which leaf cohorts grow to maximum height), and standing crop of growing leaves. Only the latter parameter revealed statistically significant change with distance into the marsh with the most inner zone having the least biomass of leaves. Senescence of leaves progressed similarly along the transect, as did decomposition. A lack of dominance by J. roemerianus in the inner zone may be a consequence of competitive advantages of other species in an environment of lower salinity and shorter hydroperiod. On average, Juncus roemerianus leaves grow for 259 d and senesce for 312 d. The rate of decomposition of standing dead leaves is slow (-0.25 F-'). Thus it would not be uncommon for a leaf to remain standing for several years. Given this longevity and persistence, biomass removal by physical processes such as storms and fire may be important.
INTRODUCTION
Where present, the salt marsh plant Juncus roemerianus Scheele acts often as a major structural component of marshes. The life history of this stress- tolerator (sensu Grime 1979) is such that throughout the year leaf recruitment occurs and leaves continue to grow, and dead leaves remain standing for long periods of time (Williams & Murdoch 1972, Eleuterius 1975, Eleuterius & Caldwell 1981). The result is a dense assemblage that can easily exceed 1000 leaves, both living and dead, per m'. Little light penetrates to the soil surface, and this thicket provides habitat for a variety of marsh animals (Stout 1984).
While primary production and decomposition of salt marsh plants have received considerable attention for over a quarter of a century, these processes are not well known in Juncus roemerianus. One of the earliest and
Present address: Department of Environmental Engineer- ing, University of Florida, Gainsville, Florida 32611, USA
C3 Inter-Research/Printed in Germany
most complete studies of primary productivity in this plant was done by Williams & Murdoch (1972). They analyzed the results of changes in height of 92 tagged leaves in the context of harvested biomass to derive production and senescence rates in a North Carolina marsh. Their technique has been used by others (Hop- kinson et al. 1980). As the detritus food web is consi- dered of great importance to marsh ecosystems, decomposition studies of marsh plants, especially with 'litter bags', have also been widely conducted (Brinson et al. 1981, Christian 1984). We used both tagging and litter bag approaches to study J. roemerianus at Cedar Island National Wildlife Refuge, North Carolina, USA.
Salt marshes are often characterized, from edge to interior, by changes in salinity and hydroperiod. Extent and direction of these changes depend on a variety of factors including source waters, marsh size, elevational changes, tidal amplitudes and frequencies, and neigh- boring landscapes. The most widely considered para- digm is that of a regularly flooded marsh positioned between diurnally tidal waters and upland (Turner
138 Mar. Ecol. Prog. Ser.
1976, Pomeroy & Wiegert 1981, Bertness & Ellison 1987). In such marshes, dominated by Spartina spp., plant dynamics vary considerably along transects from edge to interior and along salinity and hydroperiod gradients. In contrast, the marsh at Cedar Island National Wildlife Refuge is irregularly flooded, lacks dominance by Spartina spp., and is an island rather than having an upland edge. Nevertheless, changes in salinity and hydroperiod occur from edge to interior. Little is known about such marshes and the interrela- tions between changes in such physical factors and plant dynamics. Therefore the objective of the study was to determine the aerial, annual net primary pro- duction (ANPP), senescence, and decomposition rates of Juncus roemerianus in relation to gradients of salin- ity and hydroperiod and through 3 zones of community structure. We also compared these rates and standing crops of growing, senescing, and standing dead leaves relative to the population's biomass dynamics and dis- tribution. This work is part of a larger program reported in Brinson (1990).
STUDY SITE
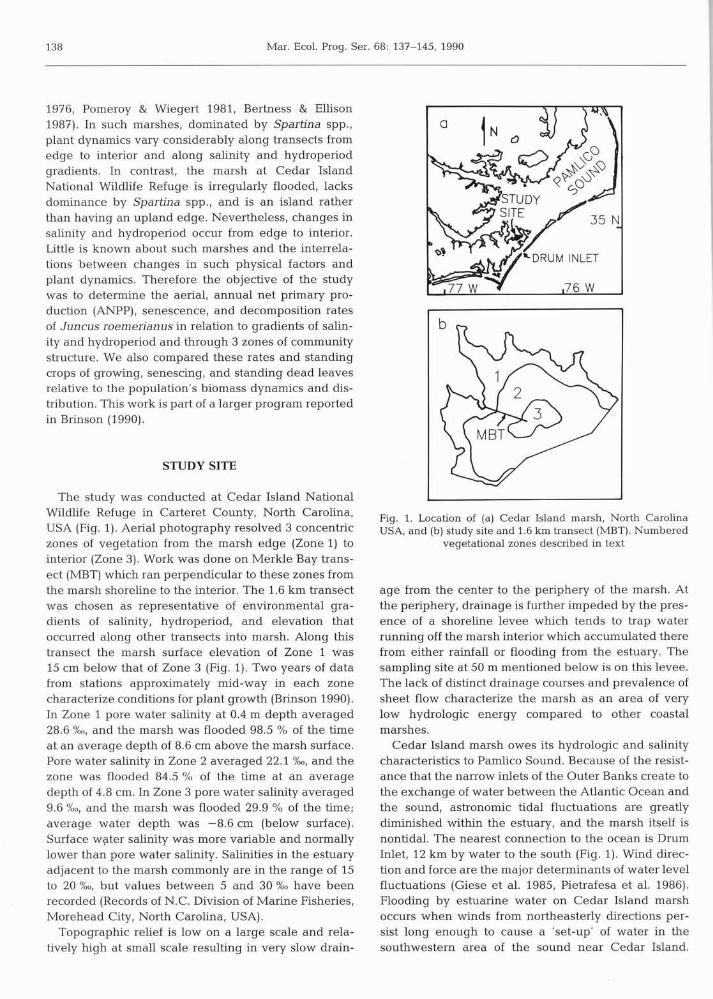
The study was conducted at Cedar Island National Wildlife Refuge in Carteret County, North Carolina, USA (Fig. 1). Aerial photography resolved 3 concentric zones of vegetation from the marsh edge (Zone 1) to interior (Zone 3). Work was done on Merkle Bay trans- ect (MBT) which ran perpendicular to these zones from the marsh shoreline to the interior. The 1.6 km transect was chosen as representative of environmental gra- dients of salinity, hydroperiod, and elevation that occurred along other transects into marsh. Along this transect the marsh surface elevation of Zone 1 was 15 cm below that of Zone 3 (Fig. 1). Two years of data from stations approximately mid-way in each zone characterize conditions for plant growth (Brinson 1990). In Zone 1 pore water salinity at 0.4 m depth averaged 28.6 %o, and the marsh was flooded 98.5 % of the time at an average depth of 8.6 cm above the marsh surface. Pore water salinity in Zone 2 averaged 22.1 and the zone was flooded 84.5 % of the time at an average depth of 4.8 cm. In Zone 3 pore water salinity averaged 9.6 %o, and the marsh was flooded 29.9 % of the time; average water depth was -8.6 cm (below surface). Surface water salinity was more variable and normally lower than pore water salinity. Salinities in the estuary adjacent to the marsh commonly are in the range of 15 to 20 %o, but values between 5 and 30 %O have been recorded (Records of N.C. Division of Marine Fisheries, Morehead City, North Carolina, USA).
Topographic relief is low on a large scale and rela- tively high at small scale resulting in very slow drain-
Fig. 1. Location of (a) Cedar Island marsh, North Carolina USA, and (b) study site and 1.6 km transect (MBT). Numbered
vegetational zones described in text
age from the center to the periphery of the marsh. At the periphery, drainage is further impeded by the pres- ence of a shoreline levee which tends to trap water running off the marsh interior which accumulated there from either rainfall or flooding from the estuary. The sampling site at 50 m mentioned below is on this levee. The lack of distinct drainage courses and prevalence of sheet flow characterize the marsh as an area of very low hydrologic energy compared to other coastal marshes.
Cedar Island marsh owes its hydrologic and salinity characteristics to Pamlico Sound. Because of the resist- ance that the narrow inlets of the Outer Banks create to the exchange of water between the Atlantic Ocean and the sound, astronomic tidal fluctuations are greatly diminished within the estuary, and the marsh itself is nontidal. The nearest connection to the ocean is Drum Inlet, 12 km by water to the south (Fig. 1). Wind direc- tion and force are the major determinants of water level fluctuations (Giese et al. 1985, Pietrafesa et al. 1986). Flooding by estuarine water on Cedar Island marsh occurs when winds from northeasterly directions per- sist long enough to cause a 'set-up' of water in the southwestern area of the sound near Cedar Island.

Christian et al.: Juncus roemerianus production and decomposition 139
Such 'northeaster' storms may flood the marsh more than l m deep.
Vegetation analysis revealed that species composi- tion and dominance on the transect were representa- tive of other areas in the marsh (Knowles 1989). Although Juncus roemerianus was the dominant species in all 3 zones, its importance decreased from Zone 1 where Distichlis spicata (L.) Greene was subdo- minant, to Zone 2 where Spartina patens (Aiton) Muhl and Fimbristylis spadicea (L.) Vahl were subdominant, and to Zone 3 where S. patens and Panicum virgatum L. were subdominant. Also, scattered shrubs, primarily Myrica cerifera L., were diagnostic of Zone 3.
MATERIALS AND METHODS
Study transect. Seventeen sites along Merkle Bay transect were set for aerial, annual net primary produc- tion (ANPP), and senescence studies at 50, 90, and approximately every 100 m from 90 m inland through 1590 m. Care was taken to ensure that each study site was within a stand of Juncus roemerianus and not where the species was an obvious subdominant. Decomposition studies were conducted at 200, 500, 800, 1200, and 1600 m.
Sampling overview. We generally followed the pro- cedures of Williams & Murdoch (1972) to determine ANPP and senescence rates. However, enough modifi- cations were made to warrant the detailed descriptions below. Juncus roemerianus leaves were tagged on 4 occasions: 13 March 1986, 27 May 1986, 11 November 1986, and 5 May 1987. We placed over each leaf a small ring of numbered Tygon tubing to which a colored strip of tape was tied. We chose leaves to be tagged on the basis of their height and relationship between their total height and the height of their green portion. Young cohorts were considered as less than 30 cm total height and mostly or all green. Older, growing leaves were considered as over ca 30 cm total height but still largely green (> 95 %). Senescing leaves were consid- ered as greater than 50 cm in total height and having considerable browning from the tip. On 13 March 1986, 3 leaves of each cohort were tagged at each of the 17 sites (Cohorts 1, 2, and 3 in order of probable age). On the 2 subsequent dates (27 May 1986 and 11 Nov 1986) of tagging, 3 young cohort leaves were tagged at each site (Cohorts 4 and 5 in order of date of tagging). On 5 May 1987, 3 young cohort leaves were tagged at 190, 490,790, 1190, and 1590 m (Cohort 6). Thus 270 leaves were tagged over the course of the study.
Growth and senescence of tagged leaves were fol- lowed from 13 March 1986 through 29 March 1988. Total height and height of the green portion of each leaf were measured on 24 dates using meter sticks until
the leaf turned completely brown. When the height of the green portion was not the same around the circum- ference of the leaf, maximum height of the green por- tion was measured. Occasionally new leaves of a com- parable size and condition to lost leaves were tagged as replacements.
Biomass estimates were derived from 4 harvests of above-ground plant material: March 1986, May 1986, September 1986, and February 1987. For each of the harvests one 0.0625 m2 plot was randomly chosen along each of two 10 m transects at each site. All material was clipped within 2 cm of the marsh surface and returned to the laboratory for separation and analysis.
Litter bags of standing dead Juncus roemerianus were sampled from each of the 5 locations previously described. We harvested senescent (brown) leaves that had a slight amount of green at the base. They were air dried, and 15 g were placed into each litter bag. The bags were cylindrical, having a height of 80 cm and a diameter of 10 cm, and were made of l mm mesh fiberglass screening. On 23 September 1986, at 5 sites 34 bags were hung vertically from 0.8 m high monofila- ment line stretched around the periphery of a square to simulate standing dead leaves. Bases of the bags were in contact with the marsh surface. Periodically until 29 March 1988, 2 bags were randomly chosen from each site and were returned to the laboratory for analysis.
Sample analysis. Harvested plant material was sepa- rated into Juncus roemenanus leaves which had some green (living leaves), those that were all brown (dead leaves), and material from other plant species (other). For all dates the numbers of living and dead leaves per plot were determined. Further, the living leaves were sorted into categories based on the heights of the green portion and total leaf. A matrix was developed by which leaves were classified according to 20 cm increments of both measured heights. For example, categories included living leaves that had both green and total heights between 0 and 20 cm; green height between 0 and 20 cm but total height between 20 and 40 cm; and so on for longer leaves. On dates after the first harvest, living leaves, dead leaves, and other material were separately dried at 85 "C, and weighed to 0.1 g.
Representative leaves from the first harvest were used to establish the relationship between leaf height and mass. Living leaves were cut into green and brown portions. The length of each portion was measured to the nearest mm; the portions were dried at 85 "C and then weighed. Decomposing leaves from litter bags were also dried at 85 "C and weighed.
Data analysis. ANPP (g m-' yr-l) was calculated as the product of above-ground biomass (AVE BIOM) (g m-'), production-to-biomass ratio (P/B) (dimension-
140 Mar. Ecol. Prog. Ser. 68: 137-145, 1990
less), and annual frequency of replacement of growing In (mass in dry g) = 1.3398 [In (height in cm]) - 6.266 (3) leaves (days of leaf growth divided into 365 days per year) (FREQ) (yr-l). The latter 2 components were derived from the tagging studies, and the former from harvesting.
Cohorts 1, 2, 4, 5, and 6 were tagged while growing, and thus used for estimates of ANPP. For the length of growing time required for the calculations we incorpo- rated an estimate of when the leaves began to grow. In contrast Williams & Murdoch (1972) assumed that this 'zero time' (To) occurred when a young leaf was tag- ged. We extrapolated backwards to To assuming a linear relationship between height and time:
The r for this relationship was 0.979 (p G 0.01). The biomass per leaf of average height for each size
class category in the matrix previously described was determined from the aforementioned regression. This value was multiplied by the number of leaves in a size class category from a harvest. After conversion of plot area to m2, the density data could be thus expressed as g mp2. Growing leaves were taken as those in which the green and total heights were within the same 20 cm increment. The sum of biomass of all such leaves per m2 from each location was used as the total biomass of growing leaves for that location. These values were
To = T1-Hi. (T2-Tl) f (H2-Hi) (1) averaged by location for the 4 harvests providing the
where T1 = date of tagging; T2 = next sampling date; H1 = height at the day of tagging; H2 = height at the next sampling.
This calculation was made for both the green and total heights of each leaf, and the average To from both was taken as the zero time for the leaf. This procedure worked well for most leaves. However, Cohort 5 was begun in autumn when growth had slowed resulting in inordinately long intervals between T1 and calculated To. When this occurred, To was assumed to be 1 or 2 sampling dates prior to tagging depending on the height of the leaf at tagging. The number of days from To to the date at which green height was maximum was desig- nated the replacement time for each growing leaf, and FREQ was this value divided into 365 days per year.
The total height for the date when the green portion of the leaf was maximum was considered the maximum height of the leaf (MAX HT in cm). The production to biomass (P/B) ratio was mathematically equivalent to the ratio of MAX HT to average total height during the period of growth (AVE HT in cm). This latter ratio was considered P/B, where AVE HT was calculated as:
AVE HT = 1 { [ H ~ - ~ + (Hi - Hi - 1)/2] X (Ti - Ti - l)/(Tn - To) ) fori=Oton (2)
where Hi (cm) = total height at date Ti; n = sampling date for MAX HT. This was calculated for each leaf in the cohorts under consideration.
The average biomass (AVE BIOM) of growing leaves per m2 of marsh was obtained by combining 2 sets of information: the relation between height and biomass per leaf and the density of growing leaves. The natural logarithms of biomass of green and brown leaf portions were regressed against the natural logarithms of height, both separately and combined (Williams & Murdoch 1972). Little difference was found between the regression equations of biomass with green and brown portions; thus an equation for the combined data set was used. A total of 372 leaf portions were used in the analysis providing the equation:
estimate of AVE BIOM. The averages of FREQ and P/B for each cohort from
each location were determined. ANPP (g m-2 yr-l) for each cohort was calculated as: ANPP = P/B (dimen- sionless) X FREQ (yr-l) X AVE BIOM (g m-2). We then averaged all variables from cohorts 1, 2, 4, and 5 by location.
The residence time for leaf senescence was consid- ered the interval between maximum green height and loss of all green for Cohorts 1 and 2. The date of maximum height was determined as described. We considered that loss of all green occurred at a date midway between the sampling date when green was last detected and the subsequent sampling date. The inverse of residence time in the units yr-l is frequency with which senescence occurs. This can be directly compared to FREQ for growth.
RESULTS
Aerial annual net primary production
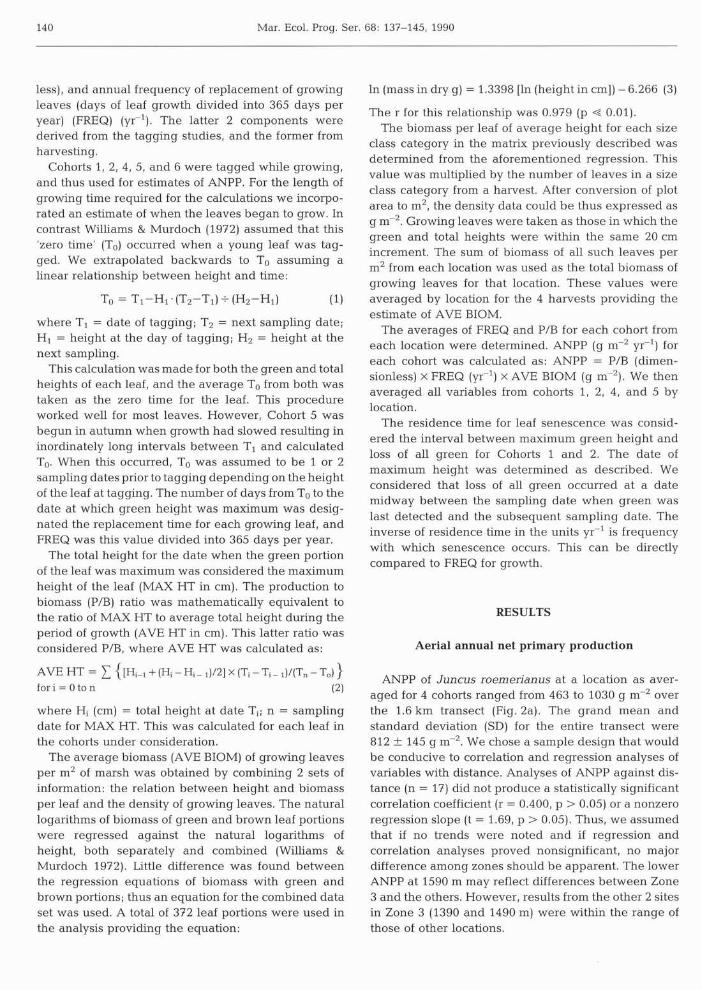
ANPP of Juncus roemerianus at a location as aver- aged for 4 cohorts ranged from 463 to 1030 g m-' over the 1.6 km transect (Fig. 2a). The grand mean and standard deviation (SD) for the entire transect were 812 + 145 g m-'. We chose a sample design that would be conducive to correlation and regression analyses of variables with distance. Analyses of ANPP against dis- tance (n = 17) did not produce a statistically significant correlation coefficient (r = 0.400, p > 0.05) or a nonzero regression slope (t = 1.69, p > 0.05). Thus, we assumed that if no trends were noted and if regression and correlation analyses proved nonsignificant, no major difference among zones should be apparent. The lower ANPP at 1590 m may reflect differences between Zone 3 and the others. However, results from the other 2 sites in Zone 3 (1390 and 1490 m) were within the range of those of other locations.

Christian et al.: Juncus roemenanus production and decomposition 141
Fig. 2. Juncus roemenanus. (a) 2.00 n 500 Aerial, annual net primary pro- /-. N
duction (g m-' yr-l); (b) produc- 1 L 1.50 'E 400
tion to biomass ratio; (c) frequency 5 cn v 300
of growth ( ~ r - ' ) to maximum l,oo height; (d) average growing bio- W 5 200 mass (g m-') along Merkle Bay E o,so - transect. Bars overlap for data m loo
W from 50 and 90 m because of the
o,oo proximity of sites o 200 400 600 800 1000 1200 1400 1600 Q '0 o 200 400 600 800 1000 1200 1400 1600
DISTANCE FROM EDGE (m)
The P/B ratio was relatively constant varying only from 1.81 to 2.09 (Fig. 2b). Average and standard devi- ation for all locations were 1.96 + 0.36. Again there were no statistically significant trends for this parame- ter along the transect (r = 0.003, p > 0.05; t = 0.00, p > 0.05). Even at 1590 m leaves possessed a comparable P/B to other locations.
The frequency of replacement of growing leaves (FREQ) averaged by location ranged from 1.10 to 1.92 y ~ - l over the transect (Fig. 2c) with a grand mean and standard deviation of 1.41 * 0.33 yr-l. This corresponds to an average time of 259 d for a leaf to achieve max- imum height. No statistically significant trends were noted in FREQ along the transect (r = 0.250, p > 0.05; t = 1.00, p > 0.05). FREQ values within each zone were comparable to those in others as was the FREQ at 1590 m (1.37 yr-l).
AVE BIOM ranged from 427 g m-2 at 50 m to 172 g m-' at 1590 m (Fig. 2d). The mean and standard devia- tion for alI locations were 307 + 72 g m-'. A statistically significant correlation was noted (r = -0.531, p < 0.05), and the regression slope was nonzero (t = 2.43, p < 0.05). This may have been a consequence of minimum and maximum values at opposite ends of the transect rather than a real decrease with distance. For example, the penultimate locations had biomasses of 317 g m-' (90 m) and 290 g m-2 (1490 m) which were close to the mean, and the second highest biomass was at 790 m.
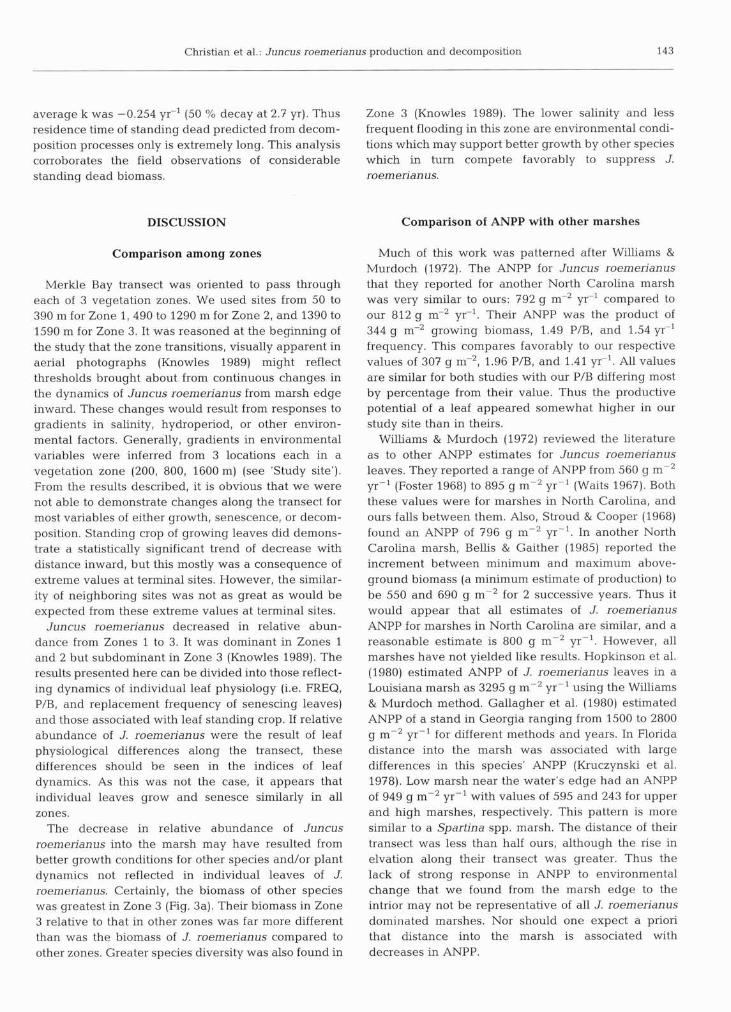
Emphasis in this study was placed on the production of Juncus roemerianus, but other species contribute to the total above-ground standing crop and production of the marsh community. Biomass of other species near the end of the growing season (Sep 1986) ranged from 67 g m-' at 50 m to 1398 g m-' at 1590 m with an average of 524 t 385 g m-' (Fig. 3a). These other species (Spar-
DISTANCE FROM EDGE (m)
tina patens, DistichLis spicata, Fimbristylis spadicea, Panicum virgatum) become dominant toward the inte- rior of the marsh. However, our study sites were inten- tionally selected for areas where J, roemerianus was visibly dominant or at least plentiful. Thus these estimates may underestimate the importance of other species to a zone.
Cohorts 1 and 6 were tagged as young leaves ca 1 yr apart (Mar 1986 and May 1987). The ANPPs for Cohort 1 (1986) at 190, 490, 790, 1190, and 1590 m were 784, 981, 1259, 863, and 720 g m-2 yr-l, respectively. The respective ANPP values for Cohort 6 (1987) were 141 1, 1212, 1483, 151 1, and 495 g m-2 yrrl. Thus interannual differences in ANPP may be large. The summer of 1986 was considerably drier than that of 1987. At 800 m, for example, the percent of time flooded in summer was 59 % in 1986 and 86 % in 1987. At 1600 m, correspond- ing flooding time was 8 % in 1986 and 27 % in 1987. This or some other environmental factor may have led to these differences in ANPP.
Senescence and longevity
The biomass of senescing leaves was obtained from the matrix of biomasses of size class categories. All live leaves in which the green height category was shorter than the total height category were considered senes- cing. At 15 of 17 locations biomass of senescing leaves exceeded that of growing leaves (Fig. 3b compared to Fig. 2d). Biomass of senescing leaves ranged from 247 g m-' at 1590 m to 723 g m-' at 50 m. Larger bio- masses were found near the marsh edge and from 490 to 990 m. Overall mean senescing biomass was 411 + 108 g m-' compared to 307 + 72 g m-' for grow- ing biomass.

142 Mar. Ecol. Prog. Ser. 68: 137-145, 1990
n 1400 800
'E 1200 /--. N
(J, ~ 1 0 0 0
800 .- F"0 v 400 F 600 z ; < 400 W 200
1 200 m 3 C -3 0 0 0 Z 0 200 400 600 800 1000 1200 1400 1600 o 200 400 600 800 1000 I 200 I 400 1600 Fig. 3. (a) Live biomass of
species other than Juncus -- 2.00, I 1400 I I roemerianus (g m-'); (b) sen- A
CC ' L =N 1200 escing biomass (g m-') of J. 03 1.50 z l E loo0 roemerianus; (c) frequency 0". 800 of total senescence (yr-l) of
1.00 J. roemerianus; (d) standing ZI Q .c 3 600 dead biomass of J. roem-
g 0.50 ? 2 400 erianus along Merkle Bay 0 3 tj -, 200 transect. Bars overlap for
C 0 data from 50 and 90 m be- (n 0.00 0
o 200 400 600 BOO 1000 1200 1400 1600 o 200 400 600 800 1000 1200 1400 1600 cause of the proximity of sites DISTANCE FROM EDGE (m) DISTANCE FROM EDGE (m)
Cohorts 1 and 2 had long enough sampling durations for all leaves to die. The average times required for a leaf to senesce from maximum green height to zero were 369 k 61 d and 255 + 98 d for Cohorts 1 and 2, respectively. Cohort 1 was tagged as young leaves; Cohort 2 was older, but leaves were still growing when tagged. Thus Cohort 1 generally reached maximum heights near the end of summer or in autumn, and Cohort 2 reached maximum heights in summer. The higher temperatures available during initial senes- cence of Cohort 2 may have allowed more rapid aging and hence shorter times of senescence. Longevity of a leaf is the sum of the time of both growth and senes- cence. Average time of growth was 259 d; for senes- cence, 312 d ; thus totaling 571 d, or an average of 1.56 yr from 'birth to death'.
Average frequency of leaf senescence was calculated for each location. It ranged from 0.90 to 1.77 yr-l over the transect (Fig. 3c). No trends with distance were noted, and the grand mean was 1.22 f 0.26 yr-l. This compares to a mean frequency of replacement of grow- ing leaves of 1.41 & 0.33 y r l (Fig. 2c).
Decomposition
Density and biomass of standing dead Juncus roemerianus generally exceeded that of live leaves. Average standing dead biomass along the transect was 1001 + 139 g m-' ranging from 774 to 1264 g m-' (Fig. 3d). Again, no trends of increase or decrease along the transect were noted. Standing dead biomass was 1.39 times that for biomass of growing and senes- cing leaves, 3.26 times that for growing biomass, and 2.44 times that for senescing biomass. If we assume that
senescing leaves were on average one-half dead, then the total amount of dead J. roemerianus leaf tissue was approximately 1200 g m-', while the total amount of living tissue was approximately 500 g m-'.
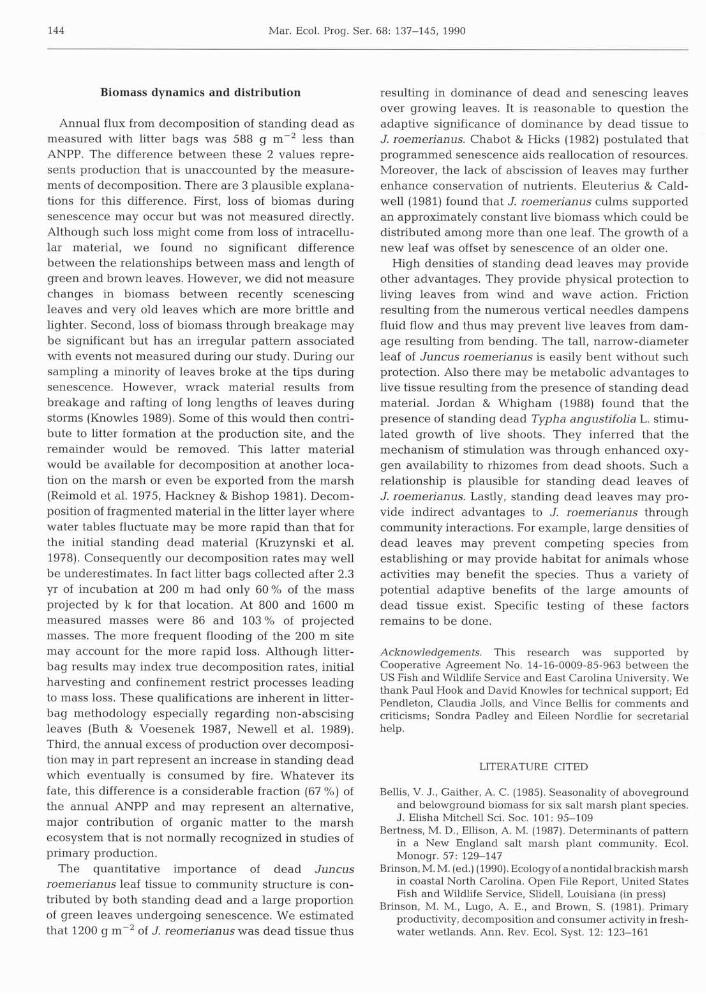
The rates of decomposition estimated from vertically standing litter bag studies at 200, 500, 800, 1200, and 1600 m were slow and similar at all sites (Fig. 4). After 1.5 yr of incubation, between 65 and 74 % of the original biomass remained. Exponential decay was assumed for calculating decomposition rates by regression analysis of remaining masses over time at each site. Specific decomposition rates (k) were -0.282 k 0.030 (standard error of coefficient), -0.219 * 0.038, -0.227 + 0.041, -0.300 + 0.038, and -0.241 k 0.034 yr-I for 200, 500, 800, 1200, and 1600 m, respectively. No trends were noted, and the
8.0 - 0 100 200 300 400 500 600
TIME (days)
Fig. 4. Juncus roemerianus. Mass remaining of leaves in vertical litter bags at 200, 500, 800, 1200, and 1600 m along
Merkle Bay transect
Christian et al.: Juncus roemerianus production and decomposition 143
average k was -0.254 yr-l (50 % decay at 2.7 yr). Thus Zone 3 (Knowles 1989). The lower salinity and less residence time of standing dead predicted from decom- frequent flooding in this zone are environmental condi- position processes only is extremely long. This analysis tions which may support better growth by other species corroborates the field observations of considerable which in turn compete favorably to suppress J. standing dead biomass. roem erian us.
DISCUSSION
Comparison among zones
Merkle Bay transect was oriented to pass through each of 3 vegetation zones. We used sites from 50 to 390 m for Zone 1,490 to 1290 m for Zone 2, and 1390 to 1590 m for Zone 3. It was reasoned at the beginning of the study that the zone transitions, visually apparent in aerial photographs (Knowles 1989) might reflect thresholds brought about from continuous changes in the dynamics of Juncus roemerianus from marsh edge inward. These changes would result from responses to gradients in salinity, hydroperiod, or other environ- mental factors. Generally, gradients in environmental variables were inferred from 3 locations each in a vegetation zone (200, 800, 1600 m) (see 'Study site'). From the results described, it is obvious that we were not able to demonstrate changes along the transect for most variables of either growth, senescence, or decom- position. Standing crop of growing leaves did demons- trate a statistically significant trend of decrease with distance inward, but this mostly was a consequence of extreme values at terminal sites. However, the similar- ity of neighboring sites was not as great as would be expected from these extreme values at terminal sites.
Juncus roemerianus decreased in relative abun- dance from Zones 1 to 3. It was dominant in Zones 1 and 2 but subdominant in Zone 3 (Knowles 1989). The results presented here can be divided into those reflect- ing dynamics of individual leaf physiology (i.e. FREQ, P/B, and replacement frequency of senescing leaves) and those associated with leaf standing crop. If relative abundance of J. roemerianus were the result of leaf physiological differences along the transect, these differences should be seen in the indices of leaf dynamics. As this was not the case, it appears that individual leaves grow and senesce similarly in all zones.
The decrease in relative abundance of Juncus roemerianus into the marsh may have resulted from better growth conditions for other species and/or plant dynamics not reflected in individual leaves of J. roemerianus. Certainly, the biomass of other species was greatest in Zone 3 (Fig. 3a). Their biomass in Zone 3 relative to that in other zones was far more different than was the biomass of J. roemerianus compared to other zones. Greater species diversity was also found in
Comparison of ANPP with other marshes
Much of this work was patterned after Williams & Murdoch (1972). The ANPP for Juncus roemerianus that they reported for another North Carolina marsh was very similar to ours: 792 g m-' yr-' compared to our 812 g m-' yr-'. Their ANPP was the product of 344 g m-' growing biomass, 1.49 P/B, and 1.54 v-' frequency. This compares favorably to our respective values of 307 g m-', 1.96 P/B, and 1.41 F-'. All values are similar for both studies with our P/B differing most by percentage from their value. Thus the productive potential of a leaf appeared somewhat higher in our study site than in theirs.
Williams & Murdoch (1972) reviewed the Literature as to other ANPP estimates for Juncus roemerianus leaves. They reported a range of ANPP from 560 g m-' yr-' (Foster 1968) to 895 g m-' yr-' (Waits 1967). Both these values were for marshes in North Carolina, and ours falls between them. Also, Stroud & Cooper (1968) found an ANPP of 796 g m-' F-'. In another North Carolina marsh, Bellis & Gaither (1985) reported the increment between minimum and maximum above- ground biomass (a minimum estimate of production) to be 550 and 690 g m-' for 2 successive years. Thus it would appear that all estimates of J. roemerianus ANPP for marshes in North Carolina are similar, and a reasonable estimate is 800 g m-' yr-'. However, all marshes have not yielded like results. Hopkinson et al. (1980) estimated ANPP of J. roemerianus leaves in a Louisiana marsh as 3295 g m-2 yr-' using the Williams & Murdoch method. Gallagher et al. (1980) estimated ANPP of a stand in Georgia ranging from 1500 to 2800 g m-' for different methods and years. In Florida distance into the marsh was associated with large differences in this species' ANPP (Kruczynski et al. 1978). Low marsh near the water's edge had an ANPP of 949 g mP2 yr-l with values of 595 and 243 for upper and high marshes, respectively. This pattern is more similar to a Spartina spp. marsh. The distance of their transect was less than half ours, although the rise in elvation along their transect was greater. Thus the lack of strong response in ANPP to environmental change that we found from the marsh edge to the intrior may not be representative of all J. roemerianus dominated marshes. Nor should one expect a priori that distance into the marsh is associated with decreases in ANPP.
144 Mar. Ecol. Prog. Ser.
Biomass dynamics and distribution
Annual flux from decomposition of standing dead as measured with litter bags was 588 g m-* less than ANPP. The difference between these 2 values repre- sents production that is unaccounted by the measure- ments of decomposition. There are 3 plausible explana- tions for this difference. First, loss of biomas during senescence may occur but was not measured directly. Although such loss might come from loss of intracellu- lar material, we found no significant difference between the relationships between mass and length of green and brown leaves. However, we did not measure changes in biomass between recently scenescing leaves and very old leaves which are more brittle and lighter. Second, loss of biomass through breakage may be significant but has an irregular pattern associated with events not measured during our study. During our sampling a minority of leaves broke at the tips during senescence. However, wrack material results from breakage and rafting of long lengths of leaves during storms (Knowles 1989). Some of this would then contri- bute to litter formation at the production site, and the remainder would be removed. This latter material would be available for decomposition at another loca- tion on the marsh or even be exported from the marsh (Reimold et al. 1975, Hackney & Bishop 1981). Decom- position of fragmented material in the litter layer where water tables fluctuate may be more rapid than that for the initial standing dead material (Kruzynski et al. 1978). Consequently our decomposition rates may well be underestimates. In fact litter bags collected after 2.3 yr of incubation at 200 m had only 60 % of the mass projected by k for that location. At 800 and 1600 m measured masses were 86 and 103% of projected masses. The more frequent flooding of the 200 m site may account for the more rapid loss. Although litter- bag results may index true decomposition rates, initial harvesting and confinement restrict processes leading to mass loss. These qualifications are inherent in litter- bag methodology especially regarding non-abscising leaves (Buth & Voesenek 1987, Newell et al. 1989). Third, the annual excess of production over decomposi- tion may in part represent an increase in standing dead which eventually is consumed by fire. Whatever its fate, this difference is a considerable fraction (67 %) of the annual ANPP and may represent an alternative, major contribution of organic matter to the marsh ecosystem that is not normally recognized in studies of primary production.
The quantitative importance of dead Juncus roemerianus leaf tissue to community structure is con- tributed by both standing dead and a large proportion of green leaves undergoing senescence. We estimated that 1200 g m-' of J, reomerianus was dead tissue thus
resulting in dominance of dead and senescing leaves over growing leaves. It is reasonable to question the adaptive significance of dominance by dead tissue to J. roemerianus. Chabot & Hicks (1982) postulated that programmed senescence aids reallocation of resources. Moreover, the lack of abscission of leaves may further enhance conservation of nutrients. Eleuterius & Cald- well (1981) found that J. roemerianus culms supported an approximately constant live biomass which could be distributed among more than one leaf. The growth of a new leaf was offset by senescence of an older one.
High densities of standing dead leaves may provide other advantages. They provide physical protection to living leaves from wind and wave action. Friction resulting from the numerous vertical needles dampens fluid flow and thus may prevent live leaves from dam- age resulting from bending. The tall, narrow-diameter leaf of Juncus roemerianus is easily bent without such protection. Also there may be metabolic advantages to live tissue resulting from the presence of standing dead material. Jordan & Whigham (1988) found that the presence of standing dead Typha angustifolia L. stimu- lated growth of live shoots. They inferred that the mechanism of stimulation was through enhanced oxy- gen availability to rhizomes from dead shoots. Such a relationship is plausible for standing dead leaves of J. roemerianus. Lastly, standing dead leaves may pro- vide indirect advantages to J. roemerianus through community interactions. For example, large densities of dead leaves may prevent competing species from establishing or may provide habitat for animals whose activities may benefit the species. Thus a variety of potential adaptive benefits of the large amounts of dead tissue exist. Specific testing of these factors remains to be done.
Acknowledgements. This research was supported by Cooperative Agreement No. 14-16-0009-85-963 between the US Fish and Wildlife Service and East Carolina University. We thank Paul Hook and David Knowles for technical support; Ed Pendleton, Claudia Jolls, and Vince Bellis for comments and criticisms; Sondra Padley and Eileen Nordlie for secretarial help.
LITERATURE CITED
Bellis, V. J., Gaither, A. C. (1985). Seasonality of aboveground and belowground biomass for six salt marsh plant species. J. Elisha Mitchell Sci. Soc. 101: 95-109
Bertness, M. D., Ellison, A. M. (1987). Determinants of pattern in a New England salt marsh plant community. Ecol. Monogr. 57: 129-147
Brinson, M. M. (ed.) (1990). Ecology of a nontidalbrackishmarsh in coastal North Carolina. Open File Report, United States Fish and Wildlife Service, Slidell, Louisiana (in press)
Brinson, M. M,, Lugo, A. E., and Brown, S. (1981). Primary productivity, decomposition and consumer activity in fresh- water wetlands. Ann. Rev. Ecol. Syst. 12: 123-161
Christian et al.: Juncus roemerianu s production and decomposition 145
Buth, G. J. C., Voesenek, L. A. C. J. (1987). Decomposition of standing and fallen litter of halophytes in a Dutch salt marsh. In: Huiskes, A. H. L., Blom, C. W. P. M,, Rozema, J. (eds.) Vegetation between land and sea. Dr. W. Junk, Dordrecht, p. 146-162
Chabot, A. J. , Hicks, D. J. (1982). The ecology of leaf life spans. Ann. Rev. Ecol. Syst. 13: 229-259
Christian, R. R. (1984). A life-table approach to decomposition studies. Ecology 65: 1693-1697
Eleuterius, L. N. (1975). The life history of the salt marsh rush, Juncus roemerianus. Bull. Torrey Bot. Club 102: 135-140
Eleuterius, L. N., Caldwell, J. D. (1981). Growth kinetics and longevity of the salt marsh rush Juncus roemerianus. Gulf Res. Rep. 7: 27-34
Foster, W. A. (1968). Studies on the distribution and growth of Juncus roemerianus in southeastern Brunswick County, North Carolina, M. S. thesis, North Carolina State Univer- sity, Raleigh
Gallagher, J . R., Reimold, R. J., Linthurst, R. A., Pfeiffer, W. J. (1980). Aerial production, mortality, and mineral accumu- lation-export dynamics in Spartina alterniflora and Juncus roemerianus plant stands in a Georgia salt marsh. Ecology 61: 302-312
Giese, G. L., Wilder, H. B., Parker, Jr, G. G. (1985). Hydrology of major estuaries and sounds of North Carolina. U.S. Geological Survey Water-Supply Paper 2221, U.S. Govern- ment Printing Office, Washington, D.C.
Grime, J. P. (1979). Plant strategies and vegetation processes. Wiley, Chichester
Hackney, C. T., Bishop, T. D. (1981). A note on the relocation of marsh debris during storm surge. Estuar, coast. Shelf Sci. 12: 621-624
Hopkinson, C. S., Gosselink, J. G., Parrondo, R. T. (1980). Production of coastal Louisiana marsh plants calculated from phenometric techniques. Ecology 61: 1091-1098
Jordan, T. E., Whigham, D. F. (1988). The importance of standing dead shoots of the narrow leaved cattail, Typha angustifolia L. Aquat. Bot. 29: 319-328
Knowles, D. B. (1989). Vegetation patterns and wrack-initi-
This manuscript was presented by Dr S. Y. Newell, Sapelo Island, Georgia, USA
ated disturbance in a nontidal brackish marsh in North Carolina. M. S. thesis, East Carolina University, Greenville
Kruczynski, W. L., Subrahmanyam, C. B., Drake, S. H. (1978). Studies on the plant community of a north Florida salt marsh. Part I. Primary production. Bull, mar. Sci. 28: 316-334
Newell, S. Y., Fallon, R. D., Miller, J. D. (1989). Decomposition and microbial dynamics for standing, naturally positioned leaves of the salt-marsh grass Spartina alterniflora. Mar. Biol. 101: 471481
Pietrafesa, L. J. , Janowitz, G. S. Chao, T.-Y., Weisberg, R. H., Askari, F., Noble, E. (1986). The physical oceanography of Pamlico Sound. Department of Marine, Earth, and Atmos- pheric Sciences, North Carolina State University, Raleigh
Pomeroy, L. R., Wiegert, R. G. (ed.) (1981). The ecology of a salt marsh. Springer-Verlag, New York
Reimold, R. J., Gallagher, J. L., Linthurst, R. A., Pfeiffer, W. J. (1975). Detritus production in coastal Georgia salt mar- shes. In: Cronin, L. E. (ed.) Estuarine research, Vol. I, Chemistry, biology, and the estuarine system. Academic Press, New York, p. 217-228
Stout, J . (1984). The ecology of irregularly flooded salt mar- shes of the northeastern Gulf of Mexico: a community profile. U.S. Fish and Wildl. Serv. Biol. Rep. 85 (7.1). Washington, D. C., USA
Stroud, L. M., Cooper, A. W. (1968). Color-infrared aerial photographic interpretation and net primary productivity of regularly-flooded North Carolina salt marsh. Univ. of North Carolina Water Resources Research Institute, Report No. 14, Raleigh
Waits, E. D. (1967). Net primary productivity of an irregularly- flooded North Carolina salt marsh. Ph. D. thesis, North Carolina State University, Raleigh
Turner, R. E. (1976). Geographic variations in salt marsh macrophyte production: a review. Univ. Texas Contrib. mar. Sci. 20: 47-68
Williams, R. B., Murdoch, M. B. (1972). Compartmental analy- sis of the production of Juncus roemerianus in a North Carolina salt marsh. Chesapeake Sci. 13: 69-79
Manuscript first received: February 12, 1990 Revised version accepted: August 27, 1990