june 2005 chartbook - investment industry regulatory ...€¦ · rejuvenated investors sparked a...
TRANSCRIPT

Securities Industry & Capital Markets Developments
Chartbook
JUNE 2005

The Investment Dealers Association of Canada is the national self-regulatory organization and representative of the securities industry. The Association’s mission is to protect investors and enhance the efficiency and competitive-ness of the Candadian capital markets.
Prepared by the Capital Markets Department
Jon Cockerline, Director Stan Kumagai, Economist Jack Rando, Financial Analyst Sherry Hum, Research Analyst Jennifer Shreve, Research Coordinator

Preface
Record activity levels and profitability in many lines of business contributed to an extraordinary year for the industry in 2004! This Chartbook presents a summary of key facets of this performance and presents it graphically in the context of the last ten years. Financial markets took their lead from a number of factors, including the continuing strength in commodity prices, a resurgence of equity buying, particularly in Canadian resources and energy stocks, and unabated appreciation of the Canadian dollar. Easing in monetary policy in the first half of the year gave way to some moderate tightening in the second – two consecutive 25 bps increases in the Bank Rate.
These latter moves, however, did little to dampen enthusiasm in markets. Strong buying interest from domestic and foreign investors helped the Canadian market outperform US markets and boosted equity trading to record levels. A more active retail investor stocked up on exchange traded funds, wrap programs, and various structured products, while mutual fund sales also caught a significant updraft for the first time since 2001 . This latter development occurred despite the increased controversy surrounding market timing – a credit to the quick and decisive actions taken by the industry and regulators to mitigate its effects on investor confidence. Meanwhile, fixed income markets were supported by increased foreign demand and a second-half rally in bond trading. In the less active category were income trusts, as rising interest rates and a portfolio shift favouring growth stalled out the four-year growth trend of this sector.
The foregoing developments contributed to what was a banner year for the industry, with total revenues and profits reaching historic highs, and the return on shareholders' equity at levels not seen since the bull market of 2000. The large integrated firms continued to lead the way in industry ROE. Firms with a focus on retail, however, were the real growth story with double-digit growth in commission revenues and a further acceleration of fee-based business. Institutionally-based firms also prospered due to the bounce-back in M&A and record corporate financings. While trading revenues were down overall, reflecting a more challenging mid-year trading environment for bonds, they recovered in the final quarter due to rallying bond and equity markets.
IDA CHARTBOOK – JUNE 2005

ALL-TIME HIGHS The securities industry continued on a roll in 2004 as it racked up historic high revenues of $12.5 billion. A hot equity market led to a double-digit increase in commissions that represent the single largest part of total industry revenues. Record levels of corporate financings, meanwhile, boosted income substantially from underwriting activities and advisory services. A notable development has been the growth in fee-based income as retail firms aggressively cater to individual investor interests.
IDA CHARTBOOK – JUNE 2005
A BANNER YEAR The sun shone on the securities industry in 2004 as profits reached an historic high of $3.7 billion. All main lines of business prospered. Rejuvenated investors sparked a jump in fee-based income for retail firms, new issues boosted investment banking revenues for institutional firms and equity sales generated strong commission revenues. Notable in the 2004 results were exceptional increases in profits for retail and institutional firms of 70% and 63%, respectively. While down slightly from a year earlier, profits for the integrated firms were still the third highest on record at $2.5 billion.
CAPITAL AND INDUSTRY ON THE RISE The steady rise in regulatory capital is reflective of a thriving industry. The number of firms has grown to over 200 in line with the industry’s prosperity. Industry revenues have been on a more than decade long climb that reached an historic high in 2004. And annual returns, an important measure of industry success, have typically been a solid 21% in recent years. Notable in the make up of regulatory capital has been an increase shareholders’ equity relative to debt as investors took a greater equity stake in firms.
Industry2
0
3
6
9
12
15
0403020100999897969594
SECURITIES INDUSTRYTotal Revenues
$ B
ILL
ION
S
0.5
1.0
1.5
2.0
2.5
3.0
3.5
4.0
0403020100999897969594
SECURITIES INDUSTRYOperating Profit
$ B
ILL
ION
S
0
5
10
15
20
0403020100999897969594
SECURITIES INDUTRYRegulatory Capital
$ B
ILL
ION
S
SHAREHOLDERS’ EQUITY SUBORDINATED DEBT

IDA CHARTBOOK – JUNE 2005
SOURCE OF ATTRACTION 205 firms competed in Canada’s securities industry in 2004, down slightly from the peak of 207 firms in 2003. The general upward trend over the previous ten years indicates the securities industry has succeeded in attracting firms under various market conditions. The majority of new firms entering the industry continue to be focused on the retail client and the area of wealth management. With the Canadian economy on a sound economic footing, individuals, including aging baby boomers, are amassing great wealth, which has led to an increase in demand for wealth management services.
SIZE MATTERS In 2004 securities firms continued to generate a solid return on their invested capital. Return on Shareholders’ Equity (ROE) was 21%, unchanged from the previous year, and above the ten year average of 18%. The large integrated firms continue to be the biggest driver of industry ROE. In 2004, the ROE for the integrated group of firms was 24% compared to 17% for the institutional firm grouping and 7% for the retail firm grouping. These levels were very similar to those generated during the bull market of 2000.
HELP WANTED! Despite the fewer number of firms in 2004, industry year end employment was still able to increase from the previous year. Almost 38,000 individuals were directly employed by the securities industry in 2004, nearly a 60% increase from 10 years ago. 2004 Employment was only down 4% from the peak level achieved during the height of the bull market, indicating the industry’s versatile use of resources under varying market conditions. The challenges, rewards, and career opportunities within the securities industry also help attract top talent into the industry.
Industry 3
0
5
10
15
20
25
30
35
40
0403020100999897969594
SECURITIES INDUSTRYTotal Employment
TH
OU
SA
ND
S
150
175
200
225
0403020100999897969594
SECURITIES INDUSTRYNumber of Firms
0
5
10
15
20
25
0403020100999897969594
SECURITIES INDUSTRYReturn on Shareholders’ Equity
PE
R C
EN
T

IDA CHARTBOOK – JUNE 2005
Industry4
0
1
2
3
4
5
6
0403020100999897969594
SECURITIES INDUSTRYTotal Commission Revenue
$ B
ILLO
NS
0.0
0.5
1.0
1.5
2.0
2.5
3.0
3.5
0403020100999897969594
SECURITIES INDUSTRYInvestment Banking Revenue
$ B
ILLO
NS
2
3
4
5
6
0403020100999897969594
SECURITIES INDUSTRYOperating Expenses
$ B
ILLO
NS
TRADING PICKS UP Overall good market performance, coupled with a strong Canadian dollar and very healthy resource prices led to increased trading activity as evidenced by industry commission revenue. Commission revenue spiked 18% in 2004 to hit $4.8 billion. This is second only to the level of $5.9 billion hit in 2000. Mutual funds accounted for $1.4 billon or 30% of commission revenue. Commissions comprised 39% of industry total operating revenue in 2004, compared to nearly 50% in 2000.
LET’S MAKE A DEAL Investment banking revenue broke new ground in 2004, surpassing the $3 billion watermark for the first time. It also represented a 17% increase from the previous high recorded in 2003. Equity new issue business accounted for the lions share of investment banking revenue, 70%, followed by debt new issues and corporate advisory fees at 16% and 14% respectively. In 2004 our members helped raise nearly $49 billion in equity financings on over 2,700 deals. The strong showing was due largely to a strong Canadian dollar and booming resource prices. The resource sector accounted for approximately 40% of all equity issuance in 2004.
MARGINS LOOK HEALTHY Record revenues in 2004 also lead to a record level of expenses. Operating expenses hit $5.2 billion in 2004, a 16% increase from the previous year. Increased expenses may be partly attributed to higher staffing levels, and other expenses related to increased market activity. The higher expenses, however, did not dampen profitability. Industry operating profits hit a new high of $3.9 billion in 2004 and was on equal footing with the prior year’s healthy operating profit margin of 31%. Over the past five years, industry operating profit margins have averaged 29%.

IDA CHARTBOOK – JUNE 2005
LET THE GOOD TIMES ROLL! The S&P/TSX Composite Index ended 2004 on a high note with an impressive increase of 12% from 2003 levels. A strong Canadian dollar, healthy corporate profits and a red-hot commodities – especially energy – sector helped buoy the resource-laden index to another round of double-digit gains. This favorable investment backdrop also attracted global interest – foreign investors purchased a record $53.2 billion in Canadian securities in 2004. Last year’s advance brings the index closer to the 10,000 level.
IT’S HOTTER UP NORTH Following a year of underperformance in 2003, the S&P/TSX Composite Index outpaced the S&P 500 in 2004. While both indexes enjoyed positive returns last year, the S&P/TSX Composite Index advanced 12% compared to the 9% increase in the S&P 500. Within the S&P/TSX, most sub-groups scored solid gains last year except for health care, gold and industrials. Not surprisingly, the energy index was the star performer in 2004 with a 28% jump over 2003 levels.
BLUE CHIP BLUES? The S&P/TSX Composite Index also outperformed the Dow Jones Industrial Average (DJIA) Index. While the S&P/TSX recorded double-digit gains in 2004, the DJIA only advanced 4% over 2003 levels. Why the gap? In contrast to the blue chip DJIA, Canada’s resource-heavy equity market was a prime beneficiary of record-breaking oil prices last year. Also, Corporate Canada did a better job than Corporate America in the profits department: pre-tax profits in Canada last year grew 17% compared with 11% in the U.S.
Equity 5
4,000
6,000
8,000
10,000
12,000
05*0403020100999897969594
S&P/TSX COMPOSITE INDEX
*as at February 2005
-25
-20
-15
-10
-5
0
5
10
15
20
25
30
35
S&P 500S&P/TSX Composite Index
04030201009998979695
CHANGE IN S&P/TSX COMPOSITE INDEX VS S&P 500 INDEX
PE
R C
EN
T
4,000
6,000
8,000
10,000
12,000
DJIAS&P/TSX Composite Index
040302010099989796
S&P/TSX COMPOSITE INDEX VS DOW JONES INDUSTRIAL AVERAGE

IDA CHARTBOOK – JUNE 2005
Equity6
0
10
20
30
40
50
60
70
80
Junior MarketsSenior Markets
0403020100999897969594
TRADINGCanadian Stock Exchanges
BIL
LIO
NS
OF
SH
AR
ES
Sou
rce:
TSX
150
175
200
225
250
0403020100999897969594
CANADIAN INTERLISTED STOCKS
N
UM
BE
R
Sou
rce:
TSX
Rev
iew
RECORD HIGH! The TSX racked up a banner trading year in 2004 – trading volume on the TSX surged to 61.2 billion shares, beating the previous record in 2003 by 10%. Contributing to the high stock turnover was an active retail, institutional and mutual fund market, and strong foreign interest. Meanwhile, trading on the TSX Venture also entered record territory in 2004 with 17 billion shares exchanged, up 27% over 2003.
ON THE REBOUND The number of interlisted stocks halted its three-year slide by rebounding to 222 firms last year from 184 firms in 2003. The appeal of a strong Canadian dollar coupled with a broad-based sector uptrend – especially resources – may have been big positives for the increased listings of Canadian stocks south of the border.
NICE PICK UP Trading of interlisted companies in the Canadian and U.S. markets perked up in 2004 after sluggish activity in 2003. Interlisted trading in Canada stood at $ 533 billion, up 23% over 2003. Meanwhile, interlisted trading in the U.S. was at a more robust pace last year at $603 billion, a 109% surge from 2003 levels.
0
100
200
300
400
500
600
700
800
TRADING ON CANADIAN EXCHANGES
TRADING ON US EXCHANGES
0403020100999897969594
INTERLISTED TRADING
$ B
ILL
ON
S
Sou
rce:
TSX
Rev
iew
Sou
rce:
Ban
k o
f C
anad
a

IDA CHARTBOOK – JUNE 2005
M&A MANIA RETURNS Mergers and acquisitions was back in vogue last year as the value of deals increased to $115 billion in 859 transactions, up 39% in value and 3% in volume. The rebound in deal-making last year followed three years of decline, with 2004 activity marking the highest transactions value since 2001. The bump in M&A activity was boosted significantly from a boom in cross-border, high-profile mega-deals – transactions valued over $1 billion. TD Bank’s $4.97 billion acquisition of the Banknorth Group led the mega deal pack last year.
DOWN IN THE RECORD BOOKS A new record set for equity issuance! Total common financings zoomed to a record $25.6 billion, up 36% over 2003 and beating the previous record set in 1997. The flurry of mega issues last year such as the record $3.1 billion issuance by Petro-Canada and $2.2 billion secondary offering by TELUS Corporation helped buoy equity financings in Canada to record levels in 2004. Once again, resources accounted for the lion’s share of common equity issuance with 53% of the total common financings in 2004.
A MATTER OF TRUST Income trust issuance has slowed from the meteoric pace recorded over the last five years. Income trust financings totaled $16.8 billion in 170 issues last year, down 2% in value but up 19% in deals over 2003. Despite the slower pace last year, trust activity is still at record high levels. Undoubtedly, persistently low interest rates last year continued to benefit the trust market as investors are attracted by the higher yields and/or tax advantage distribution offered by income trusts. In 2004, the financial sector was the most active, raising 36% of the industry total.
Equity 7
0
50
100
150
200
250
0403020100999897969594
MERGERS AND ACQUISITIONSValue of Transactions
$ B
ILLO
NS
Sou
rce:
Cro
sbie
& C
o. I
nc.
0
5
10
15
20
25
30
0403020100999897969594
COMMON EQUITY FINANCINGS
$ B
ILLO
NS
0
5
10
15
20
04030201009998979695
TRUST UNITS ANNUAL ISSUANCE
$ B
ILLO
NS
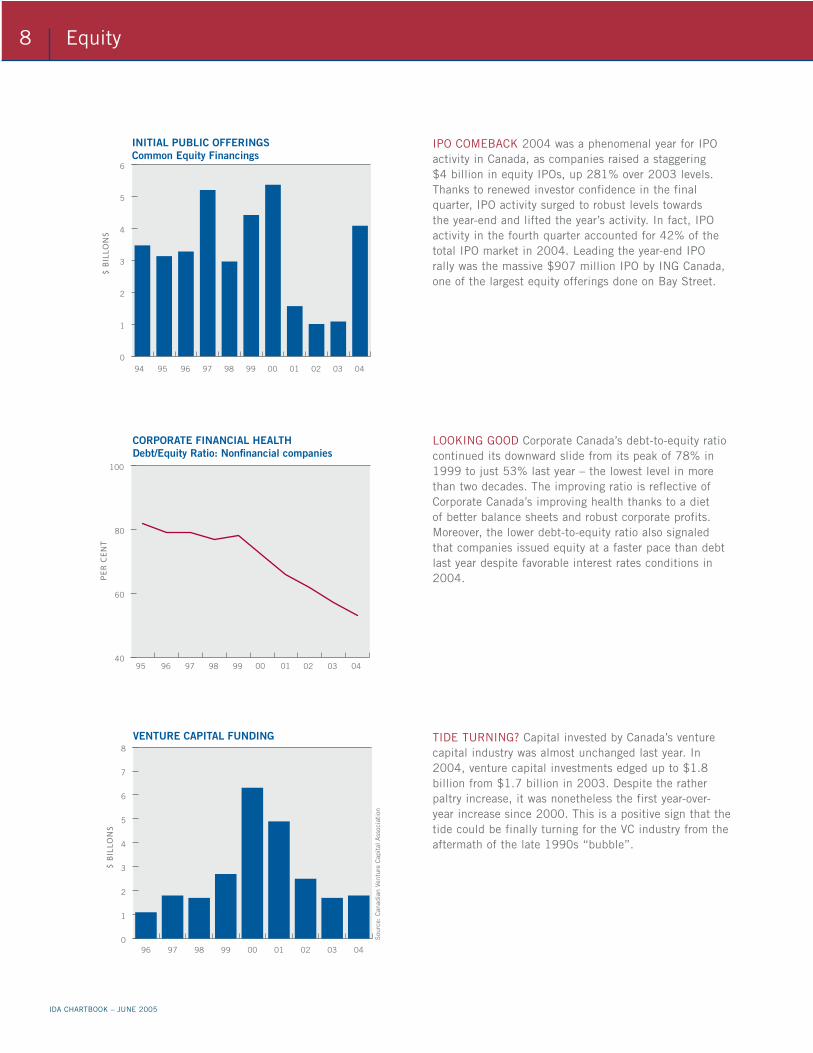
IPO COMEBACK 2004 was a phenomenal year for IPO activity in Canada, as companies raised a staggering $4 billion in equity IPOs, up 281% over 2003 levels. Thanks to renewed investor confidence in the final quarter, IPO activity surged to robust levels towards the year-end and lifted the year’s activity. In fact, IPO activity in the fourth quarter accounted for 42% of the total IPO market in 2004. Leading the year-end IPO rally was the massive $907 million IPO by ING Canada, one of the largest equity offerings done on Bay Street.
IDA CHARTBOOK – JUNE 2005
LOOKING GOOD Corporate Canada’s debt-to-equity ratio continued its downward slide from its peak of 78% in 1999 to just 53% last year – the lowest level in more than two decades. The improving ratio is reflective of Corporate Canada’s improving health thanks to a diet of better balance sheets and robust corporate profits. Moreover, the lower debt-to-equity ratio also signaled that companies issued equity at a faster pace than debt last year despite favorable interest rates conditions in 2004.
TIDE TURNING? Capital invested by Canada’s venture capital industry was almost unchanged last year. In 2004, venture capital investments edged up to $1.8 billion from $1.7 billion in 2003. Despite the rather paltry increase, it was nonetheless the first year-over-year increase since 2000. This is a positive sign that the tide could be finally turning for the VC industry from the aftermath of the late 1990s “bubble”.
Equity8
0
1
2
3
4
5
6
0403020100999897969594
INITIAL PUBLIC OFFERINGSCommon Equity Financings
$ B
ILLO
NS
40
60
80
100
04030201009998979695
CORPORATE FINANCIAL HEALTHDebt/Equity Ratio: Nonfinancial companies
PE
R C
EN
T
0
1
2
3
4
5
6
7
8
040302010099989796
VENTURE CAPITAL FUNDING
$ B
ILLO
NS
Sou
rce:
Can
adia
n Ve
ntur
e C
apit
al A
ssoc
iati
on

IDA CHARTBOOK – JUNE 2005
REVENUE SLOWDOWN Equity trading revenues last year were slightly lower at $666 million, off 3% from 2003 levels. While revenues remain at healthy levels, last year’s slowdown clearly reflected the challenging mid-year trading environment. Investor worries over rising interest rates, record oil prices and earnings outlook in the second and third quarters squeezed trading activity and revenues.
BUYERS FOCUS ON CANADA The soaring Canadian dollar and a broad-based equity rally, especially in energy stocks, fuelled foreign purchases of Canadian equity in 2004. Net foreign purchases hit a record high $35.8 billion, more than double a year earlier. In contrast, Canadians snubbed foreign stocks last year. Net purchases sunk to a decade low $1.1 billion, down 76% from 2003. The strong loonie, favourable investment conditions and better equity market performance domestically kept Canadian investors close to home.
PURCHASES PICK UP Canadian investors have been big buyers of foreign bonds over the past three years. Net purchases nearly doubled to $15 billion in 2004, by far the largest yearly purchase ever. This partly reflected rising US yields that resulted in a marked narrowing in the spreads between Canadian and US bonds. Similarly, Canadian bonds have been generally attractive to foreign investors, partly reflecting the stronger Canadian dollar and improving corporate sector fundamentals. Foreign net purchases of Canadian bonds nearly tripled to $20 billion in 2004 from $7 billion a year earlier. The majority of purchases in the past two years were for corporate bonds, with US buyers the largest investor, accounting for about 70% of overall purchases last year.
Equity 9
0
200
400
600
800
1,000
1,200
0403020100999897969594
SECURITIES INDUSTRY Equity Trading Revenues
$ M
ILLO
NS
-10
0
10
20
30
40
50
60
Foreign Net Purchases of Canadian Stocks
Canadian Net Purchases of Foreign Stocks
0403020100999897969594
Source: Statistics Canada
INTERNATIONAL TRANSACTIONS IN EQUITIES
$ B
ILLO
NS
So
urc
e: S
tati
stic
s C
an
ad
a
-30
-20
-10
0
10
20
30
40
50
Foreign Net Purchases of Canadian Bonds
Canadian Net Purchases of Foreign Bonds
0403020100999897969594
Source: Statistics Canada
INTERNATIONAL TRANSACTIONS IN DEBT
$ B
ILLO
NS
So
urc
e: S
tati
stic
s C
an
ad
a

DEBT ISSUANCE DROPS Corporations reduced their reliance on the debt markets for financings in 2004. Gross debt issuance declined 18% from $86 billion in 2003 to $71 billion last year. Most of last year’s financings were used to cover maturing bonds as new cash amounted to a relatively small $13 billion compared with $34 billion in 2003. The reduced reliance on debt financing partly reflected increased equity issuance and a healthy rise in corporate profits. The strength of the Canadian dollar influenced financings in 2004 as more than half of the total was completed in the domestic market for the first time in four years.
IDA CHARTBOOK – JUNE 2005
MBSS LEAD ADVANCE Canada’s robust residential housing market has spurred exceptional growth in the mortgage-backed securities (MBS) sector. MBSs outstanding increased by more than 30% annually in the three years to 2004 and, totalling $79 billion in 2004, accounted for two-thirds of total asset-backed securities compared with about 60% four years ago. The fast rise in MBSs led to a doubling in total asset-backed securities outstanding to a record $117 billion at the end of 2004 from four years earlier.
STILL POPULAR Medium-term notes, introduced to the Canadian debt market over two decades ago, have proven to be an efficient way for companies to receive debt funding on a regular and continuous basis. They have provided investors with securities from companies in a range of different industries, thereby helping to diversify risks and returns. While issuance in 2004 was lower than a year earlier, the $32 billion in MTNs issued were the second highest on record. Foreign investors are active in Canada’s MTN market, purchasing a quarter of issuance in 2004.
Fixed Income10
0
20
40
60
80
100
120
Abroad
Canada
0403020100999897969594
CORPORATE DEBT FINANCINGSCANADA AND ABROAD
$ B
ILLO
NS
So
urc
e: B
an
k o
f C
an
ad
a
0
20
40
60
80
100
120
Other term securities
Mortgage-backed securities
0403020100999897969594
ASSET-BACKED SECURITES OUTSTANDING
$ B
ILLO
NS
, EN
D P
ER
IOD
So
urc
e: D
om
inio
n B
on
d R
ati
ng
Se
rvic
e, C
MH
C
0
5
10
15
20
25
30
35
40
0403020100999897969594
CORPORATE DEBT OFFERINGSMedium Term Notes
$ B
ILLO
NS

IDA CHARTBOOK – JUNE 2005
STILL BEING TRIMMED The government announced a strategy in the 2003 budget of gradually reducing the fixed-rate portion of market debt from two-thirds in 2002-03 to 60% in 2007-08. In line with this strategy, maturing Government of Canada bonds continue to exceed new issues. Last year’s net redemptions of over $19 billion were the largest in five years and raised total net redemptions to $63 billion. With this reduction, the fixed-rate ratio declined to about 63% at the end of 2004. Since longer-term debt incurs a higher cost, this strategy is designed to result in sizeable savings in overall debt servicing.
PROVINCES INCREASE BORROWING A deterioration in some provinces’ finances was reflected in an increase in total provincial bonds outstanding last year. All of this increase represented domestic issuance as the level of foreign currency bonds declined for a second straight year. Corporations also lowered foreign currency bonds outstanding which led to a slight reduction in total corporate bonds outstanding in 2004. The strengthening in the Canadian dollar in the past two years provided an opportunity for issuers to reduce their foreign currency exposure.
HELPING TO CONTAIN COSTS A steady rise in treasury bills outstanding will continue for a few more years as the government pursues its strategy of increasing the share of short-term securities in total debt to 40% by 2007/08 (from 34% on 2002/03). This year’s debt strategy report projected T-bills to rise about $10 billion to $140 billion by March 2006. An integral part of the debt management strategy is to take advantage of relatively low short-term interest rates to reduce overall borrowing costs.
Fixed Income 11
-20
-10
0
10
20
30
40
50
60
70
80
0403020100999897969594
GOVERNMENT OF CANADA BONDS New Issues and Retirements
Source: Bank of Canada
$ B
ILLO
NS
MATURING BONDS NEW CASHSo
urc
e: B
ank
of
Can
ada
-10
-5
0
5
10
15
20
25
CORPORATE PROVINCIALCANADAS
0403020100999897969594
GROWTH IN OUTSTANDING BONDS
PE
R C
EN
T
Sou
rce:
Ban
k of
Can
ada
0
50
100
150
200
0403020100999897969594
CANADA TREASURY BILLSOutstanding
$ B
ILL
ION
S
Sou
rce:
Ban
k of
Can
ada

SUBDUED TRADING CONTINUES Treasury bill trading has inched up in the past three years, but remained in a relatively low daily range of $4-6 billion. T-bill trading has suffered from a period of low interest rates that fell to an over four-decade low average of 2.2% in 2004. These low rates have largely offset the positive impact that a nearly 50% increase in T-bills outstanding in the past four years has had on trading volumes.
IDA CHARTBOOK – JUNE 2005
RATE VOLATILITY BOOSTS TURNOVER Trading in BAX, or 3-month bankers’ acceptances futures, increased sharply in the second half 2004 when short-term interest rates reversed direction and began climbing. Unexpected changes in the direction of short-term rates tend to spur BAX trading which is linked hedging activity. Investors in the financial markets use hedging as an integral part of managing interest rate risk. Over the past decade, BAX have become a more dynamic money market instrument than T-bills.
RALLY SPURS TURNOVER A second-half market rally helped spur Canada bond trading in 2004. The average yield for the 10-year Canada bond declined about a quarter-point to 4.6% last year, helping turnover edge up to its highest level in seven years. This result was notable as it comes in the face of declines in outstanding Canada bonds. This has been steadily shrinking, falling 15% to $283 billion in the five years to 2004.
Fixed Income12
0
5
10
15
20
04030201009998979695
TREASURY BILL TRADINGDaily Average
$ B
ILLO
NS
0
5
10
15
20
5
10
15
20
25
30
35
40
0403020100999897969594
TRADING IN T-BILLS AND BAXDaily Average
$ B
ILL
ION
S
BA
X T
RA
DE
D C
ON
TR
AC
TS
(‘0
00
)
T-BILLS BAX
Source: Bank of Canada
600
900
1,200
1,500
0403020100999897969594
GOVERNMENT OF CANADA BONDS*Quarterly Trading Volumes
*excluding crown corporations
$ B
ILL
ION
S

IDA CHARTBOOK – JUNE 2005
TRADING WITHIN RANGE Quarterly trading in Canada bond repos has remained in a narrow $4 - $5 trillion range since 2002. In part, this reflects the relatively small quarter-to-quarter changes in bond trading that has limited opportunities for repo transactions. Historically, repo trading has had a fairly close relationship with Government of Canada bonds during periods of rapid turnover, such as in the late 1990s.
BONDS OUT OF FAVOUR The convergence of Canada bonds and treasury bills will continue over the next few years as the government pursues its target of reducing the fixed-rate portion of its debt to 60% of the total by 2007-08. The 2005-2006 Debt Management Strategy report indicated that gross issuance of marketable bonds will decline about $3 billion in 2005-06 to approximately $33 billion. At the same time, an increase in T-bills issuance will raise outstanding T-bills by about $10 billion to $140 billion by March 2006.
DODGING THE CUT Despite the government’s goal of reducing the fixed-rate portion of market debt, the issuance of Real Return Bonds (RRB) in 2005-06 will remain similar to the $1.4 billion in 2004-05, according to this year’s Debt Management Strategy report. RRBs represent a relatively small part of marketable bonds outstanding, amounting to about $19 billion or approximately 5% of the total. Pension funds are major investors in RRBs and quarterly trading volumes are relatively small, with investors tending to buy and hold RRBs to maturity.
Fixed Income 13
0
2,000
4,000
6,000
8,000
0403020100999897969594
GOVERNMENT OF CANADA BOND REPOSQuarterly Trading Volumes
$ B
ILLO
NS
50
100
150
200
250
300
350
0403020100999897969594
GOVERNMENT OF CANADA SECURITIESOutstanding by Type
$ B
ILLO
NS
, EN
D P
ER
IOD
TREASURY BILLS TOTAL BONDS
Sou
rce:
Ban
k o
f C
anad
a
0
1
2
3
4
5
6
0403020100999897969594
REAL RETURN BONDSQuarterly Trading Volumes
$ B
ILLO
NS

MUTUAL FUND BUSINESS BOUNCES BACK IN 04 Commissions from mutual fund sales, including trailers, surged over 30% in 2004 to top $1.41 billion. This level comes close to matching the all time high of $1.46 billion hit in 2000. Despite increasing competition from products such as exchange traded funds, wrap programs, and various structured products, advisors are still utilizing conventional mutual funds in client portfolios. Representing 11% of total industry revenue, mutual funds continue to be a staple for the Canadian securities industry.
IDA CHARTBOOK – JUNE 2005
INCREASED INVESTOR CONFIDENCE = INCREASED INVESTOR DEMAND: Mutual funds comprised nearly 30% of the securities industry total commission revenues in 2004, up form 27% in 2003. The increase can mainly be attributed to improved investor confidence, brought about by a well performing equity market, a strong Canadian dollar, healthy corporate profits, and an attractive resources sector. In 2004 regulators also took decisive action to defend the integrity of the mutual fund industry and further foster a fair and efficient marketplace for mutual fund investors.
BALANCE AND INCOME Balanced funds and bond and income funds continue to increase their share of the mutual fund wallet, accounting for approximately 40% of all mutual fund assets. This comes as a result of investors taking a more cautious approach to their investing. Investors are placing higher importance on yield and income than the lure of capital gains from equity funds. Money Market funds are also at their lowest relative value over the eight year period. This is likely a result of investors switching into the popular balanced and income funds.
Retail14
0
300
600
900
1,200
1,500
0403020100999897969594
SECURITIES INDUSTRYMutual Fund Commissions
$ M
ILLO
NS
15
20
25
30
35
0403020100999897969594
MUTUAL FUND COMMISSION REVENUEas a share of total commissions
PE
R C
EN
T
0
10
20
30
40
50
60
70
80
90
100
0504030201009998
COMPOSITION OF MUTUAL FUNDS
PE
R C
EN
T
FOREIGNFOREIGN
BONDBOND
EQUITYEQUITY
BALANCEDBALANCED (as at March)(as at March)
MONEY MARKETMONEY MARKET

IDA CHARTBOOK – JUNE 2005
TALK ABOUT A SHARP TURNAROUND Despite the years highly publicized “market timing scandal”, investors still flocked to mutual funds. Mutual fund assets topped $497 billion at the end of 2004, an increase of $58 billion or 13% from the previous year. More importantly, a significant portion of this growth came from net new purchases. Investors in 2004 made new mutual fund purchases, excluding reinvested distributions, of $14.7 billion. This is in sharp contrast to 2003 when investors had net redemptions of over $600 million.
IT’S NOT AS GOOD AS IT LOOKS Canadian equity funds continued the rise started in early 2003. Over $120 billion dollars was held in Canadian equity funds as of early this year, the highest level on record and nearly a 50% rise from the trough hit in 2003. However, equity funds are still suffering from large net redemptions. Investors redeemed $1.5 billion from Canadian equity funds in 2004, after already having redeemed $2.4 billion in 2003. The growth in equity fund assets is therefore stemming from positive market performance and not from investor demand.
A SEPARATE BREED Investors increased their holdings of segregated funds by 13% in 2004, which now stand at $97 billion in assets. The growth in segregated funds partly stems from their resilience to mass redemptions, an infliction suffered by conventional mutual funds in 2003. Investors concerned with preserving their principal continue to be attracted to seg funds, which allow for equity market participation while offering downside protection in the form of a principal guarantee. The sale of seg funds, and other insurance products, within the securities industry is expected to increase as the number of dual licensed advisors within our member firms swell.
Retail 15
0
100
200
300
400
500
0403020100999897969594
MUTUAL FUND ASSETS
Sou
rce:
Inve
stm
ent
Fun
ds
Inst
itu
te o
f C
anad
a
$ B
ILLO
NS
0
30
60
90
120
150
05*0403020100999897969594
CANADIAN EQUITY FUNDSTotal Assets
*as at March 2005
Sou
rce:
Inve
stm
ent
Fun
ds
Inst
itu
te o
f C
anad
a
$ B
ILLO
NS
0
20
40
60
80
100
120
0403020100999897969594
SEGREGATED FUNDS
Sou
rce:
Inve
stm
ent
Fun
ds
Inst
itu
te o
f C
anad
a
$ B
ILLO
NS

WILL YOU BE PAYING FOR THAT IN CASH OR MARGIN? The level of debt outstanding in client margin accounts stood at $9.5 billion as at December 31st 2004. This is a $1.9 billion or 24% increase from the levels witnessed one year prior. Investors' use of leverage in their portfolios is still far below the levels witnessed in 2000, indicating investors in 2004, with the market collapse of 2001 and 2002 still fresh in their minds, were still taking a more cautious investing approach relative to four years ago.
IDA CHARTBOOK – JUNE 2005
PLENTY OF CASH STILL AROUND Over $22 billion in cash was held in client accounts in 2004, a 7% increase form 2003. This marks a third consecutive year of rising cash balances and signals that a significant pool of capital is still waiting on the sidelines. Some investors may be taking precaution and postponing the deployment of funds into the markets until they affirm the market recovery of 2003 and 2004 is more than just a touch of luck. Client cash balances also contributed to the $1 billion in net interest income earned by IDA member firms.
A SHIFT TO FEE-BASED Industry fee based revenue continue to break previous highs. At $1.4 billion, fee based revenues in 2004 grew 23% from the previous year and once again rival revenue levels derived from mutual fund sales. Advisory fees levied on proprietary and third party managed accounts or wraps continue to constitute a major component of this revenue segment. With attractive features such as periodic rebalancing and enhanced tax reporting, available in many of these programs, they continue to attract both advisor and investor attention.
Retail16
6
8
10
12
14
0403020100*
SECURITIES INDUSTRYMargin Debt
*begins in April
$ B
ILLO
NS
5
10
15
20
25
0403020100999897969594
SECURITIES INDUSTRY Client Free Credits
$ B
ILLO
NS
0
300
600
900
1,200
1,500
0403020100999897
SECURITIES INDUSTRYFee Based Revenue
$ M
ILLO
NS


CALGARY Suite 2300, 355 Fourth Avenue S.W. Calgary, Alberta T2P 0J1 T: (403) 262-6393 F: (403) 265-4603
HALIFAX Suite 1620, TD Centre, 1791 Barrington Street Halifax, Nova Scotia B3J 3K9 T: (902) 423-8800 F: (902) 423-0629
MONTRÉAL Suite 2802, 1 Place Ville Marie Montréal,Quebec H3B 4R4 T: (514) 878-2854 F: (514) 878-3860
TORONTO Suite 1600, 121 King Street West Toronto, Ontario M5H 3T9 T: (416) 364-6133 F: (416) 364-0753
VANCOUVER Suite 1325, P.O. Box 11614 650 West Georgia Street Vancouver, British Columbia V6B 4N9 T: (604) 683-6222 F: (604) 683-3491
WWW.IDA.CA