justification file
TRANSCRIPT

Geodetic Institute EGNOS RIMS Cor. Field Survey
Doc.Id: ET-NMA-RICO-DL5A Version 1 � 0
Justification File
for EGNOS Geodetic Coordinate Determination
22 May 2004Determination of Geodetic Coordinates for
EGNOS RIMS and NLES Antennae
ET-NMA-RICO-DL5A
ON
SALA
RYMDOBSERVATO
RIU
M
TEKNISKA HÖGSKOLACHALMERS

Geodetic Institute EGNOS RIMS Cor. Field Survey
Doc.Id: ET-NMA-RICO-DL5A Version 1 � 01
REVISION HISTORY
Rev. Description Date
0.1 Draft 19 December 20030.2 Revised Draft; revision according to ESA Comments 18 March 20041.0 Issue 22 May 2004
Prepared by: Date: 18 May 2004Torbjørn Nørbech & Knut Aksel Røysland Signature:Controlled by: Date: 22 May 2004Hans-Peter Plag Signature:Accepted by: Date:
Signature:

Geodetic Institute EGNOS RIMS Cor. Field Survey
Doc.Id: ET-NMA-RICO-DL5A Version 1 � 02
Contents
About this document 3
Scope/objective . . . . . . . . . . . . . . . . . . . . . . . . . . . . . . . . . . . . . . . . . . . . . 3
Applicable Documents . . . . . . . . . . . . . . . . . . . . . . . . . . . . . . . . . . . . . . . . . 3
Reference Documents . . . . . . . . . . . . . . . . . . . . . . . . . . . . . . . . . . . . . . . . . . 3
Definitions . . . . . . . . . . . . . . . . . . . . . . . . . . . . . . . . . . . . . . . . . . . . . . . . 4
Acronyms and abreviations . . . . . . . . . . . . . . . . . . . . . . . . . . . . . . . . . . . . . . . 5
1 Introduction 6
2 Conclusion 7
3 Error Budget/accuracy 8
3.1 GPS instrument calibration . . . . . . . . . . . . . . . . . . . . . . . . . . . . . . . . . . . . 10
3.2 GPS observations . . . . . . . . . . . . . . . . . . . . . . . . . . . . . . . . . . . . . . . . . 10
3.3 GPS analysis . . . . . . . . . . . . . . . . . . . . . . . . . . . . . . . . . . . . . . . . . . . 10
3.4 Local ties . . . . . . . . . . . . . . . . . . . . . . . . . . . . . . . . . . . . . . . . . . . . . 11
4 Coordinates reliability/quality 12
4.1 Step 1: Field work . . . . . . . . . . . . . . . . . . . . . . . . . . . . . . . . . . . . . . . . 12
4.2 Product 1: Report text files, GPS observation files, and EGNOS site log files . . . . . . . . . . 12
4.3 Step 2: Scripts and programs 1 . . . . . . . . . . . . . . . . . . . . . . . . . . . . . . . . . . 14
4.4 Product 2: TEQC summary files, IGS log files, RINEX day files . . . . . . . . . . . . . . . . 14
4.5 Step 3: NMA/OSO/GMV GPS analysis . . . . . . . . . . . . . . . . . . . . . . . . . . . . . 14
4.6 Product 3: NMA/OSO/GMV coordinate result files . . . . . . . . . . . . . . . . . . . . . . . 15
4.7 Step 4: Scripts and programs 2 . . . . . . . . . . . . . . . . . . . . . . . . . . . . . . . . . . 16
4.8 Product 4: ‘ARP’ coordinate solution file . . . . . . . . . . . . . . . . . . . . . . . . . . . . 16
4.9 Step 5: Scripts and programs 3 . . . . . . . . . . . . . . . . . . . . . . . . . . . . . . . . . . 16
4.10 Product 5: CHTP coordinate file, local tie file, CMGL coordinate file . . . . . . . . . . . . . . 17
4.11 Step 6: Scripts and programs 4 . . . . . . . . . . . . . . . . . . . . . . . . . . . . . . . . . . 17
4.12 Product 6: PDF field survey report . . . . . . . . . . . . . . . . . . . . . . . . . . . . . . . . 17
5 Coordinate degradation 21

Geodetic Institute EGNOS RIMS Cor. Field Survey
Doc.Id: ET-NMA-RICO-DL5A Version 1 � 03
About this document
Scope/objective
This document has the intention to justify that the EGNOS RIMS/NLES geodetic coordinates expressed atcentral epoch of observation are:
� of globally homogeneous accuracy
� accurate enough for the specified need, 3cm/1sigma
� reliable, of good quality, and certifiable.
Furthermore, the document provides a velocity model with associate uncertainties, which describe the degra-dation of coordinates with time beyond the central epoch of observation. In particular, the velocity model isused to quantify the degradation until the Operation Readines Review (ORR) in mid2004.
Applicable Documents
AD1: E-SW-SYS-E21-0021-ESA: Statement of Work, Determination of geodetic coordinates for EGNOSRIMS and NLES antennas.
AD2: ITT/1-4186/2002/F/WE: Appendix 3: Special Conditions of Tender.
AD3: EGNOS AOC Design Document — Deployed baseline summary EGN-ASPI-SYST-DRD105/0002 rev2D.
AD4: Determination of geodetic coordinates for EGNOS RIMS and NLES antennas. Technical proposal.ET-NMA-RICI-TEC.
AD5: Determination of geodetic coordinates for EGNOS RIMS and NLES antennas. Financial Managementand Administrative proposal. ET-NMA-RICI-FMA.
AD6: Amendment — Determination of geodetic coordinates for EGNOS RIMS and NLES antennas. ET-NMA-RICI-AM1 (issue 1.3, 16 January 2003).
Reference Documents
RD1: NIMA Technical Report — TR 8350.2 Ed3 dated 01/00.
RD2: ”EGNOS Geodetic coordinates project: Software validation document”
RD3: DL1: ”Comparison of geodetic survey methods for EGNOS and recommendations”
RD4: DL2: ”Geodetic coordinates accuracy reliability and certifiability”
RD5: DL3: ”Characterisation of coordinate accuracy degradation”
RD6: DL5: ”EGNOS RIMS geodetic survey report”

Geodetic Institute EGNOS RIMS Cor. Field Survey
Doc.Id: ET-NMA-RICO-DL5A Version 1 � 04
Definitions
Accuracy of the estimated antenna position: estimate of the magnitude of the error with respect to the trueantenna position in WGS84.
Reliability of the estimated antenna position and its accuracy: characterises the degree of confidence onecan have in the estimated position and its associated accuracy.
Certifiability of the antenna position: the coordinates are considered certifiable if there is no obvious andimmediate reason why they should not be accepted without signficant extra work by regulation authori-ties in Geodesy.
Station: for the purpose of this report, a station denotes one RIMS or NLES location. A station may have oneor several antennas.
Site: for the purpose of this report, a site is either one RIMS mast or otherwise a geodetic marker (for eccentricpoints).

Geodetic Institute EGNOS RIMS Cor. Field Survey
Doc.Id: ET-NMA-RICO-DL5A Version 1 � 05
Acronyms and abreviations
AD Applicable documentAOC Advance Operation CapabilityARP Antenna Reference PointBIH Bureau International del’HeureCFI Customer furnished ItemCGPS Continuous GPSCHTP Center of Hole Top PlateCME Common mode errorCMGL Center of Mast Ground LevelDGPS Differential GPSDoD Department of DefenceDORIS Doppler Orbitography and Radiopositioning integrated by SatellitesDRL DeliverableEGM Earth Gravity ModelEGNOS European Geostationary Navigation Overlay ServiceEOP Earth Orientation ParametersESA European Space AgencyESOC European Space Operation CentreETRS European Terrestrial Reference SystemEUREF European Reference FrameGAMIT GPS Analysis Software of MITGIPSY/OASIS-II GPS Inferred Positioning SYstem/Orbit Analysis and Simulation SoftwareGLONASS Global Navigation Satellite SystemGNS Global Network SolutionGPS Global Positioning SystemH.E. Hosting EntityIERS International Earth Rotation ServiceIGS International GPS ServiceITRF International Terrestrial Reference FrameIVS International VLBI ServiceJPL Jet Propulsion LaboratoryLGRP Local Geodetic Reference PointMARK Geodetic Reference MarkerMIT Massachusetts Institute of TechnologyNIMA National Imagery and Mapping AgencyNNSS Navy Navigation satellite systemNLES Navigation Land Earth StationNMA Norwegian Mapping AuthorityOSO Onsala Space ObservatoryPM Progress meetingPPP Precise Point PositioningRE ReportRIMS Ranging and Integrity Monitoring StationRINEX Receiver independent exchange formatRNS Regional Network SolutionSLR Satellite Laser RangingSWEPOS Swedish GPS NetworkSATREF Satellite based reference systemTN Technical NoteWP Work packageWGS84 World Geodetic System 1984VLBI Very Long Baseline Interferometry

Geodetic Institute EGNOS RIMS Cor. Field Survey
Doc.Id: ET-NMA-RICO-DL5A Version 1 � 06
1 Introduction
The task was to determine certifiable coordinates for the EGNOS RIMS and NLES sites (see Figure 1 for thestation locations) with reliable accuracy estimates and an accuracy of 5 cm or better in ITRF/WGS84. The fulldescription of the methodology is given in RD3 and detailed specifications are given in RD6. Here, materialis provided to demonstrate the quality of the coordinates as well as to justify the reliability of the coordinatesand the error estimates.
The basic tool for the determination of the geodetic coordinates has been the GPS system. Calibrated GPS re-ceivers from the manufacturer Ashtech were used to collect GPS raw data. Classical measuring intruments liketheodolite, measuring tape or rod, and magnetic compass were used for the on site ‘local tie’ measurements.Three different analysis strategies were used to analyse the GPS observations to determine the final geodeticcoordinates.
Figure 1: Location of the EGNOS RIMS and NLES stations.
The philosophy was to have as few basic information sources as possible, and to feed this information through areliable production chain which produces for each station and each stie on the station the basic final coordinatefile and the field survey reports with tables.
This is achieved by extensive use of computer scripts and programs, many of them specially designed for thisproject. The advantage of this approach is that the production procedures are self-documenting, traceable, andreliable. The scripts and programs have carefully been checked and validated (see RD2). In case of necessarychanges or correction, it is relatively easy to rerun the process, and all relevant outputs are produced with

Geodetic Institute EGNOS RIMS Cor. Field Survey
Doc.Id: ET-NMA-RICO-DL5A Version 1 � 07
minimal probability for typing errors.
To justify the reliability of the result including the error estimates, in this document the error budget and allelements of the processing are discussed in detail. In Section 2, the main conclusions are summarised. InSection 3, the different contributions to the error budget of the point coordinates are discussed individually.Focus is on the data analysis algorithms and instrument performance. Section 4 discusses the data flow duringprocessing. The purpose of focusing on the data flow is to demonstrate the reliability of the coordinates byshowing the extensive effort made to minimise the probability for typing errors and other blunders. Finally,in Section 5, the degradation of the coordinates with time is considered on the basis of the velocity modeldiscussed in RD5.
Sections 3 to 5 give a complete picture of the the whole process used to arrive at the geodetic coordinates. Thesesections demonstrate the quality and reliability of the coordinates, both at the Central Epoch of Observation(CEO) and at a common reference epoch at a later time.
2 Conclusion
The final coordinates are the results of three different analysis methods based on three different softwares,namely GIPSY/OASIS-II, GAMIT/GLOBK, and BAHN. The given total error estimates are one 1-sigma level.The main contribution to this total error comes from the GPS analysis. This error contribution is estimated onthe basis of a comparison of the three independent solutions. However, every individual solution shows amuch better precision. The relatively big differences between the precision of the individual solutions andthe accuracy estimates obtained from a comparison of the results from three different analysis strategies aremainly due to different approaches used to fix the reference frame to ITRF2000. Thus the stated error estimatesgive a realistic picture of the accuracy with which coordinates are given in ITRF2000. Moreover, the accuracyestimates turn out to be
The data flow is considered to be reliable due to extensive use of scripts and programs. Blunders are checkedfor by different means including manual checks, double checking, control plots, and proof reading.
In the total process, the local tie values are considered as the weakest part. It is important to notice that thetotal local tie from the GPS Antenna Reference Point (ARP) to the CMGL/MARK has two components for theRIMS sites, namely the component from ARP to CHTP and the component from CHTP to CMGL/MARK. Formost sites, the local tie between ARP and CMGL is very well determined through the use of a fixed adopter.For the other sites, ARP is identical to CHTP. Thus, speaking of the local tie as the weakest part refers solely tothe component CHTP to CMGL. Consequently, the coordinates of the CHTP are very reliable and not affectedby the mentioned weakness of the local ties. Only for a small number of sites, no mast was avilable during thefield survey or the GPS antenna could not be mounted on the mast. For these sites, the local tie between ARPand CHTP is more complex and introduce contribution to the total error budget of the CHTP.
In the very unlikely case of an error in the local ties component between CHTP to CMGL, this would resultin the coordinates of the geodetic reference marker (either CMGL or MARK) being in error, while the CHTPcoordinates are not affected. However, if changes in the antenna position are required and new local ties haveto be determined, then such errors may surface if the CMGL/MARK coordinates are used. Therefore, it isrecommend to carry out an independent check of the local ties between CMGL and CHTP before any oldmonument is dismounted. In the very unlikely case of discrepances between the new local ties and thoseinlude in the deliverable egnos_local_ties_reference_to_chtp.dat are found, then the coordinates forthis CMGL/MARK given in the deliverable egnos_geodetic_reference_marker.dat would have to becorrected accordingly.

Geodetic Institute EGNOS RIMS Cor. Field Survey
Doc.Id: ET-NMA-RICO-DL5A Version 1 � 08
3 Error Budget/accuracy
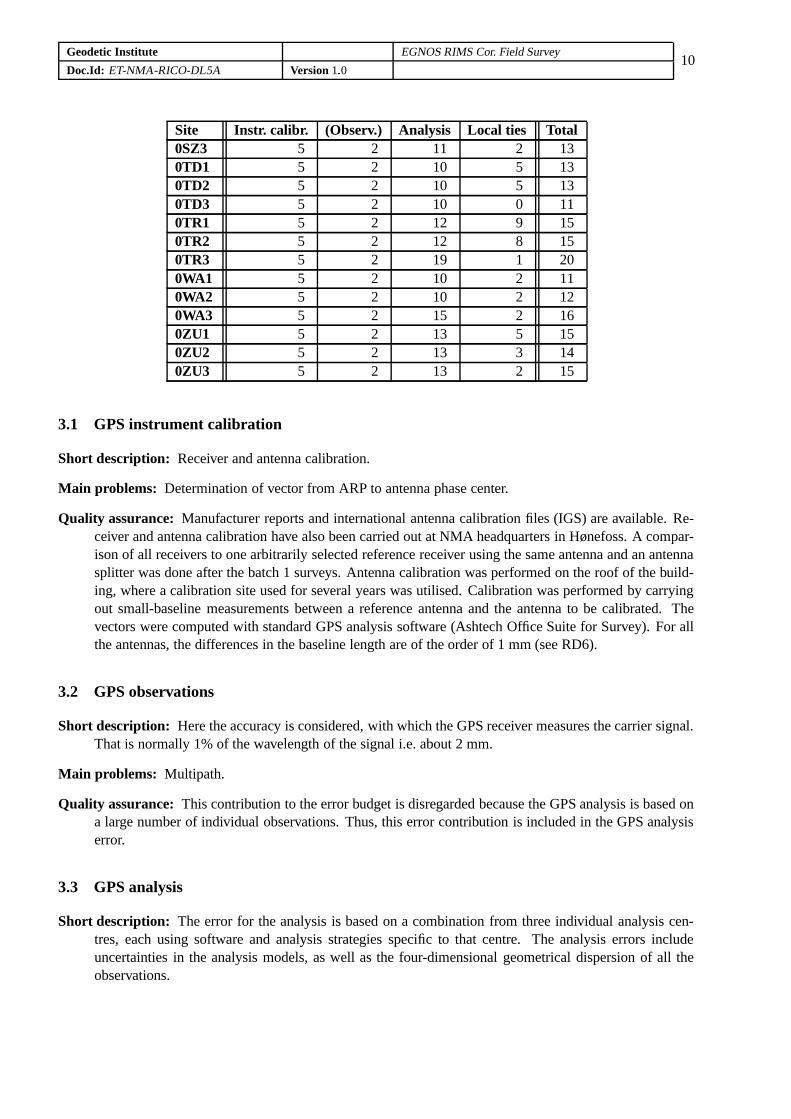
Table 1 gives a quantitative overview of the total error budget for all sites. The individual contributions arediscussed in detail in the subsequent subsection of this section.
Table 1: Error budget of the geodetic coordinates.
Site Instr. calibr. (Observ.) Analysis Local ties Total(mm) (mm) (mm) (mm) (mm)
0AA1 5 2 10 2 120AA2 5 2 11 2 120AA3 5 2 12 2 130AU1 5 2 8 2 100AU2 5 2 9 11 150AU3 5 2 7 2 90AU4 5 2 9 4 110BL1 5 2 7 8 120BL2 5 2 7 5 100BL3 5 2 7 2 90CI1 5 2 9 2 110CI2 5 2 7 5 100CI3 5 2 9 1 100CO1 5 2 10 2 110CO2 5 2 7 2 90CO3 5 2 5 2 70CT1 5 2 10 4 120CT2 5 2 20 4 210CT3 5 2 14 2 150DJ1 5 2 9 3 110DJ2 5 2 9 3 110DJ3 5 2 8 2 100EI1 5 2 18 2 190EI2 5 2 19 2 200EI3 5 2 20 3 210FU1 5 2 13 5 150FU3 5 2 15 2 160GC1 5 2 14 4 150GC2 5 2 13 4 150GC3 5 2 12 2 130GE1 5 2 10 3 120GE2 5 2 10 3 110GL1 5 2 15 2 160GL2 5 2 8 2 100GL3 5 2 6 2 80GO1 5 2 10 16 200GO2 5 2 9 14 180GO3 5 2 6 2 8

Geodetic Institute EGNOS RIMS Cor. Field Survey
Doc.Id: ET-NMA-RICO-DL5A Version 1 � 09
Site Instr. calibr. (Observ.) Analysis Local ties Total0HA1 5 2 18 4 200HA2 5 2 19 8 210HA3 5 2 21 2 210HT1 5 2 9 6 120HT2 5 2 10 4 120HT3 5 2 9 2 100KI1 5 2 11 3 130KI2 5 2 13 3 140KI3 5 2 14 2 150KO1 5 2 12 4 140KO2 5 2 4 5 80KO3 5 2 4 1 70LA1 5 2 11 7 140LA2 5 2 8 7 120LA3 5 2 10 2 110LS1 5 2 7 3 90LS2 5 2 10 3 120LS3 5 2 10 2 110MD1 5 2 19 2 200MD2 5 2 26 3 270MD3 5 2 15 2 160ML1 5 2 10 3 110ML2 5 2 9 5 120ML3 5 2 10 2 120MO1 5 2 14 3 150MO2 5 2 16 3 170MO3 5 2 15 2 160PA1 5 2 19 7 210PA3 5 2 19 2 200PA4 5 2 49 2 500PM1 5 2 12 3 130PM2 5 2 12 3 140PM3 5 2 12 2 130RE1 5 2 11 3 120RE2 5 2 11 2 120RE3 5 2 15 2 160SC1 5 2 11 4 120SC2 5 2 12 3 140SC3 5 2 12 2 140SO1 5 2 10 3 120SO2 5 2 10 3 120SO3 5 2 12 2 130SW1 5 2 13 2 140SW2 5 2 18 2 180SW3 5 2 18 2 180SZ1 5 2 9 2 11
Geodetic Institute EGNOS RIMS Cor. Field Survey
Doc.Id: ET-NMA-RICO-DL5A Version 1 � 010
Site Instr. calibr. (Observ.) Analysis Local ties Total0SZ3 5 2 11 2 130TD1 5 2 10 5 130TD2 5 2 10 5 130TD3 5 2 10 0 110TR1 5 2 12 9 150TR2 5 2 12 8 150TR3 5 2 19 1 200WA1 5 2 10 2 110WA2 5 2 10 2 120WA3 5 2 15 2 160ZU1 5 2 13 5 150ZU2 5 2 13 3 140ZU3 5 2 13 2 15
3.1 GPS instrument calibration
Short description: Receiver and antenna calibration.
Main problems: Determination of vector from ARP to antenna phase center.
Quality assurance: Manufacturer reports and international antenna calibration files (IGS) are available. Re-ceiver and antenna calibration have also been carried out at NMA headquarters in Hønefoss. A compar-ison of all receivers to one arbitrarily selected reference receiver using the same antenna and an antennasplitter was done after the batch 1 surveys. Antenna calibration was performed on the roof of the build-ing, where a calibration site used for several years was utilised. Calibration was performed by carryingout small-baseline measurements between a reference antenna and the antenna to be calibrated. Thevectors were computed with standard GPS analysis software (Ashtech Office Suite for Survey). For allthe antennas, the differences in the baseline length are of the order of 1 mm (see RD6).
3.2 GPS observations
Short description: Here the accuracy is considered, with which the GPS receiver measures the carrier signal.That is normally 1% of the wavelength of the signal i.e. about 2 mm.
Main problems: Multipath.
Quality assurance: This contribution to the error budget is disregarded because the GPS analysis is based ona large number of individual observations. Thus, this error contribution is included in the GPS analysiserror.
3.3 GPS analysis
Short description: The error for the analysis is based on a combination from three individual analysis cen-tres, each using software and analysis strategies specific to that centre. The analysis errors includeuncertainties in the analysis models, as well as the four-dimensional geometrical dispersion of all theobservations.

Geodetic Institute EGNOS RIMS Cor. Field Survey
Doc.Id: ET-NMA-RICO-DL5A Version 1 � 011
The analysis approaches are in detail described and justified in RD3. Common to all three approches isthe use of global products, namely the satellite orbits and clocks and Earth orientation parameters, whichare determined on the basis of a global network of tracking stations. Using global products ensures aglobally homogeneous accuracy of the resulting coordinates. In the analyses, different global productswere used, namely the products provided by IGS and those provided by the Jet Propulsion Laboratory,Pasadena, USA. Moreover, different methods were used to fix the solutions to the ITRF. Consequently,the spreading of the three independent solutions give a reasonable estimate of the uncertainty of thereference frame fixing.
The resulting coordinates are referred to central epoch of observation (CEO). The degradation of coordi-nates with time depends on the velocity of the point with respect to ITRF. The velocities of the EGNOSRIMS stations relative to ITRF are discussed in RD5. The error due to transferring coordinates to otherepochs without new surveys or processing of measurements depends on the accuracy of the velocitymodel used and the time span between CEO and the new reference epoch. This error is discussed inSection 5.
Main problems: In fixing the global products and station coordinates to the ITRF, typically a subset of 20to 50 stations of the global IGS station network are used. For these stations, ITRF2000 coordinates aregiven together with their velocities. The solutions of each independent analysis are dependent on theselection of stations actually used to fix the frame to ITRF. The network of available station may vary intime due to drop-outs of individual stations.
Quality assurance: Three different analysis approaches are used by three different groups. The three ap-proaches differ in software, processing strategies, global products, and subsets of the global trackingnetwork. Error estimates provided by the individual programs are ignored in the computation of theerror of the combined solution as these error estimates are considered to be very optimistic and morerelated to precision than accuracy. This means that each solution is treated with equal weight in thecombination. The error estimates for each individual solution are however used to assess the quality ofthis solution. The individual solutions are also checked against ITRF2000 stations in the IGS netvorkand the European Permanent Network EPN not used in the analysis.
3.4 Local ties
Short description: A local tie is the 3-dimensional vector between two reference points not too far away fromeach other. Here, two specific local ties are considered, namely the local tie from ARP to CHTP andthe local tie from CHTP to CMGL/MARK. For eccentric points and RIMS where no mast was availableat the time of the survey, the local tie is from ARP directly to MARK/CMGL. At RIMS sites wherea mast was available at the time of the survey, the local tie ARP to CHTP is very reliable due to theuse of a fixed adapter, ”Kolstad adapter”. At these sites, the local tie from CHTP to CMGL/MARK ismeasured manually by the surveyor. The horizontal components of the local tie vector (north and east)are measured by a theodolite, measuring tape or rod, and a magnetic compass. The vertical component ismeasured with a measuring tape or rod. At sites without mast, the local tie from ARP to CMGL/MARKis measured in the same way as the local tie from CHTP to CMGL/MARK.
Main problems: The main problem is that the process is manual and is done mostly by only one person butmostly two times. Another problem is the determination of geodetic azimuth which is required in orderto be able to compute the north and east components from the vector length.
Quality assurance: Work is done after specifications given in Chapter 3 of RD6. The work was done care-fully, but this step is considered to be the weakest point in the chain. However, as explained in Section 4under ‘Product 5’, an error in the local ties does not effect the CHTP coordinates.

Geodetic Institute EGNOS RIMS Cor. Field Survey
Doc.Id: ET-NMA-RICO-DL5A Version 1 � 012
The length of the horizontal local tie vectors is in the range 0–16 cm. The determination of geodeticazimuth for the vector was done by a magnetic compass. At most sites, no adjustment for the deviationbetween magnetic north and geodetic north (magnetic declination) was required due to the horizontalcomponent being very small. For example, a deviation of 20
�would cause a maximum error of the
horizontal components of a local tie vector with a length of 4 cm of 14 mm. In the few sites wherethe local tie vector length exceeds 4.4 cm the magnetic declination was checked by measuring magneticazimuth in directions with known geodetic azimuth, and thus estimated the geodetic azimuth for thelocal tie vector and its accuracy. For most of the stations with horizontal local tie vector length lessthan 4.4 cm, the magnetic azimuth was used instead of the geodetic azimuth. This may introduce apossible error. Therefore a very pessimistic error on the magnetic azimuth of 18
�is introduced, based
on information from a US/UK World Magnetic Chart, taken from the web adress http://www.ngdc.noaa.gov. The local tie error estimates were adjusted based on this pessimistic azimuth error.
4 Coordinates reliability/quality
Figure 2 presents an overview of the data flow. The flowchart is organised in steps and products which aredescribed in the following subsections. The version and validation status of all software referred to in thissection are given in RD2.
4.1 Step 1: Field work
Short description: This is the process of collecting GPS observations (i.e. setting up the GPS antenna on themonument, connecting the GPS receiver to the antenna, initialising and running the GPS receiver fortwo full days, and down loading the GPS data to a computer), carrying out the local ties measurements,taking photos, preparing a log file for each site, and describing the station.
Main problems: Partly manual and partly automatic process. Collecting GPS observations is done automat-ically by the receiver and stored locally in it. Local tie measurements and documentation of the site aremanual processes. Some results are stored in a traditional, hand-written log-book, and some are writtenon a laptop computer.
Quality assurance: Work is done after agreed specifications given in Chapter 3 of RD6. The log books arechecked manually.
4.2 Product 1: Report text files, GPS observation files, and EGNOS site log files
Short description: The field observation are stored in 3 basic information sources. Moreover, common re-port text files contain text that is common to all field reports. Field report text files are specific for astation and include also station dependent sketches, and pictures. GPS observation files are the binaryfiles containing the GPS receiver recordings of GPS observations. EGNOS site log files contain basicinformation needed in the coordinate processing. In these latter files, the critical information is ”antennatype” and ”local ties”.
Main problems: The main problem in the EGNOS site log files is the “antenna type” and “local ties” infor-mation. It is also a possibility to have in the Field report text files a type of errors we call blunders. Anexample could be in a sketch or picture saying that site 0 ��� 1 is 0 ��� 2 and vice versa.

Geodetic Institute EGNOS RIMS Cor. Field Survey
Doc.Id: ET-NMA-RICO-DL5A Version 1 � 013
Step 1 Field work
Product 1 Common reporttext files
Field report textfiles
GPS observationfiles
EGNOS log files
Step 2Scripts andprograms 1
Product 2 TEQC summaryfiles
IGS log files RINEX day files
Step 3NMA GPS
analysisOSO GPSanalysis
GMV GPSanalysis
Product 3 NMA coordinateresult file
OSO coordinateresult file
GMV coordinateresult file
Step 4Scripts andprograms 2
Product 4 “ARP” coordinatesolution file
Step 5Scripts andprograms 3
Product 5 chtp coordinatefile
cmgl coordinatefile
local tie file
Step 6Scripts andprograms 4
Product 6PDF field survey
report
Figure 2: Data flowchart

Geodetic Institute EGNOS RIMS Cor. Field Survey
Doc.Id: ET-NMA-RICO-DL5A Version 1 � 014
Quality assurance: Blunders in Field report text files, GPS observation files, and EGNOS site log files arechecked for by using plots of the sites produced from egnos_geodetic_reference_markers.dat (foran example, see Figure 3). These plots are manually checked by comparison with the content of the fieldreport.
“Antenna type” errors in EGNOS site log files are minimised because all antennas have approximatelythe same characteristics i.e. the nominal distance from antenna phase centre to ARP is the same for allantennas. This is also verified by our instrument calibration, see Section 3.1. The nominal values aretaken from IGS antenna.gra file.
“Local ties” errors in EGNOS site log files are checked for manually by another person who has notcarried out the field work.
4.3 Step 2: Scripts and programs 1
Short description: Convert from Ashtech binary format to RINEX format and carry out a quality check of theGPS observations. The program TEQC is used for that purpose. Producing IGS log files from EGNOSsite log files. Scripts and programs specially design at NMA for this project are used for that purpose.Scripts designed at NMA are used to tie the process together. Some manual interaction remains at thisstage, namely typing of input file and output file names.
Main problems: Scripts and programs may contain bugs. Blunders may occur in manual command typing.
Quality assurance: TEQC is a well-known program used in the international GPS community for many years.No known bugs. Scripts and programs designed at NMA are manually checked. No known bugs.Possible blunders that may occur in manual command typing is taken care of both by doing some logicalself-checking and by producing plots.
4.4 Product 2: TEQC summary files, IGS log files, RINEX day files
Short description: These files are intermediate products in the process. The TEQC summary file is a file thatprovides a quality information. Some information from the file is used for quality control, in particu-lar approximate station coordinates, observation window, number of measurement, multipath condition.These are used only for information. The output has no consequence on the data processing. The vali-dation of coordinate accuracy is taken from the 3 individual GPS analysis methods and the combinationanalysis of these 3 solutions. See step 3 and step 4.
Main problems: Files are moved manually between servers.
Quality assurance: Potential errors will be blunders and are checked for by plots.
4.5 Step 3: NMA/OSO/GMV GPS analysis
Short description: Three different institutions have performed independent GPS analysis (see RD3 for alldetails). NMA used the software package GIPSY/OASIS-II, OSO used the software package GAMIT/-GLOBK, and GMV used the software package BAHN. The packages were used with different analysisstrategies. Common input files for all three software packages are the IGS site log files and the dailyRINEX files. Each institution carried out the analysis with their specific software with a strategy giv-ing best results for this particular software. This also means that program parameters and additionalinformation like ocean loading, atmospheric mapping, elevation cut-off, and the choise of stations for

Geodetic Institute EGNOS RIMS Cor. Field Survey
Doc.Id: ET-NMA-RICO-DL5A Version 1 � 015
reference frame fixing were not agreed or homogeneised. Each institution also interpreted the antennatype information in the IGS log file and found the vector from the antenna phase center to ARP individ-ually. See also the comments concerning this point in ‘Product 1’ above. Each institution produces acoordinate output file.
A brief description of the three software packages is given here with focus on ephemeris used and themethod of reference frame fixing applied.
OSO with GAMIT/GLOBK works in short as follows:
� Apriori orbits from SOPAC are used.� Clock information is not important because of double differencing� Orbits and station co-ordinates are computed while constraining the combined solution (Swedish
network + SOPAC global networks) to roughly 30 globally distributed stations. The stabilisationincludes corrections to orbits and stations and a 3D transformation (rotations and translations, (butusually no scale)) of the computed combined GPS network to the ITRF2000 frame.
NMA with GIPSY/OASIS-II works in short as follows:
� JPL precise no-fiducial orbits, clocks and epo’s� Seven parameter/Helmert transformation from the free GPS solution to ITRF2000 using quick
transformation parameters from JPL global solution. No orbit relaxation.
GMV with BAHN works in short as follows:
� Apriori orbit information is GPS broadcast.� Precise orbits, clocks and EOP’s are computed internally. (only leap second information external).� The analysis is based on a selection of IGS stations in ITRF2000. Coordinates and velocities are
taken from http://lareg.ensg.edu.fr/ITRF/ITRF2000/results/ITRF2000GPS.SSC.
Main problems: Fixing the reference frame to ITRF2000 (see RD3 for a detailed discussion).
Quality assurance: Each institution performs their own internal quality checking of their own process. Thisincludes the determination of coordinates of ITRF or EUREF sites with the same approach.
4.6 Product 3: NMA/OSO/GMV coordinate result files
Short description: NMA/OSO/GMV coordinate result files are the result of the individual computation ateach institution. Files are sent by mail or uploaded to the egnos server. They are further transferred toa certain directory for each institution. These coordinates are referred to the ARP point of the antenna.Originally, it was intended to use the SINEX format for these files. However, since the combination isbased on equal-weight averages (see Step 4, below), a more simple format containing only Station IDand the X, Y, Z coordinates and their errors was used for the exchange of the information.
Main problems: The three individual coordinate files are in slightly different formats. The Step 4 script andprograms read each specific format.
Quality assurance: The test plots showing the discrepancies between each individual solution and the com-bined solution made from the ‘ARP’ coordinate solution file are checked manually (see Figure 4).

Geodetic Institute EGNOS RIMS Cor. Field Survey
Doc.Id: ET-NMA-RICO-DL5A Version 1 � 016
4.7 Step 4: Scripts and programs 2
Short description: Compute a combined solution file out of the three different solutions. Each solution istreated with equal weight. This simple method was considered to give a good estimate of the accuracywith respect to ITRF2000 of each individual solution as well as of the averaged final solution. Thediscrepancies between the individual solution are small compared to the accuracy requirement. There isalways a problem to chose a right weight function based on the variance/covariance information fromthree different analysis strategies. The advantage of using an equal-weight approach is that this doesnot favour any approach to fixing the reference frame to ITRF2000. With a few exceptions (in partic-ular Paris), the internal accuracy of the individual solutions was rather homogeneous. The discrepancybetween the three individual solutions turns out to be the main contribution to the total error budget.
There are a two exceptions from the above specified production procedure:
� In site 0sw3, due to a power failure during the field survey, the observation interval was only afew hours. Therefore, a standard analysis with GIPSY/OASIS-II, GAMIT/GLOBK, or BAHN wasnot possible. The coordinates for 0sw3 were found by computing vectors (Ashtech AOS) from0sw1 and 0sw2. The coordinates are therefore hard-coded in the script in step 4. The results aredocumented in the output of the program.
� For the sites 0ko2 and 0ko3, GMV could not provide a solution. The combined solutions aretherefore combinations of the OSO and NMA solutions, only.
Main problems: We regard the fixing of the reference frame to ITRF2000 as the main problem. Internalaccuracy within each software was usually very good.
Quality assurance: By comparing the three different analysis strategies, a good check on reference frame fix-ing is obtained. Plots showing the discrepancies between the combined (equal-weight average) solutionsand the individual solutions are used for verification (see Figure 4 and Table 2)
4.8 Product 4: ‘ARP’ coordinate solution file
Short description: This is a coordinate file where the coordinates are referring to the ARP. This is an in-termediate file, which is used to produce the files egnos_CHTP_extended.dat and egnos_geodetic_reference_markers.dat.
Main problems: The GPS observations are referring to the antenna phase centre. To be able to refer coordi-nates to the ARP, it is necessary to know the antenna characteristics.
Quality assurance: The information of the antenna characteristics is found independently by each analysinginstitution.
4.9 Step 5: Scripts and programs 3
Short description: Production of the CHTP coordinate file, the CMGL coordinate file and local tie file.
Main problems: Programming bugs.
Quality assurance: The scripts and programs are tested on different input, and the produced output is checkedfor consistency. No bugs are known to exist.

Geodetic Institute EGNOS RIMS Cor. Field Survey
Doc.Id: ET-NMA-RICO-DL5A Version 1 � 017
4.10 Product 5: CHTP coordinate file, local tie file, CMGL coordinate file
Short description: The CHTP coordinate file is named egnos_chtp_extended.dat. The CMGL coordinatefile is named egnos_geodetic_reference_markers.dat. The local tie file is named egnos_local_ties_reference_to_chtp.dat. The coordinates are given as geocentric coordinates X,Y,Z expressedin reference frame ITRF2000 at the central epoch of observation.
Main problems: Coordinates of CMGL/MARK are influenced by local tie values which are originally fromthe field work and stored in the EGNOS log file.
Quality assurance: In the total process, we regard the local ties values as the weakest part (see Section 3.4for more details). In a very unlikely case of an error in the local ties, this would result in geodeticmarker coordinates being in error. However, such errors do not affect the CHTP coordinates included inegnos_chtp_extended.dat.
4.11 Step 6: Scripts and programs 4
Short description: Production of PDF field survey report.
Main problems: Programming bugs.
Quality assurance: The scripts and programs are tested on different input, and the produced output is checkedfor consistency. No bugs are known to exits.
4.12 Product 6: PDF field survey report
Short description: Field survey reports in Portable Document Format (PDF).
Main problems: None identified.
Quality assurance: The field survey reports are proof read.

Geodetic Institute EGNOS RIMS Cor. Field Survey
Doc.Id: ET-NMA-RICO-DL5A Version 1 � 018
Table 2: Difference tableDEVIATION FROM COMBINED SOLUTION(m)
GMV NMA OSOSite no north east up north east up north east up0AA1 1 -0.009 0.001 -0.007 0.005 0.001 0.004 0.005 -0.002 0.0030AA2 2 -0.009 0.000 -0.007 0.004 0.002 0.005 0.005 -0.002 0.0020AA3 3 -0.010 0.001 -0.008 0.005 0.001 0.008 0.005 -0.002 0.0000AU1 4 -0.008 -0.001 0.002 0.006 -0.001 0.001 0.003 0.002 -0.0030AU2 5 -0.008 -0.002 0.004 0.006 0.000 -0.001 0.002 0.002 -0.0030AU3 6 -0.008 0.000 0.002 0.005 0.000 0.002 0.003 0.001 -0.0040AU4 7 -0.005 -0.006 0.006 0.002 0.002 0.000 0.003 0.003 -0.0060BL1 8 -0.002 -0.004 -0.004 -0.001 0.003 -0.001 0.003 0.001 0.0050BL2 9 -0.002 -0.006 -0.004 0.000 0.005 0.002 0.003 0.001 0.0030BL3 10 -0.002 -0.003 -0.006 -0.001 0.002 0.001 0.003 0.001 0.0050CI1 11 -0.007 -0.002 -0.007 0.004 -0.001 0.005 0.003 0.003 0.0020CI2 12 -0.008 -0.001 -0.002 0.005 -0.001 0.002 0.003 0.003 0.0000CI3 13 -0.008 0.000 -0.006 0.005 -0.002 0.004 0.002 0.002 0.0030CO1 14 -0.007 -0.002 -0.007 0.004 0.002 0.008 0.003 0.000 -0.0010CO2 15 -0.007 -0.002 -0.001 0.005 0.001 0.005 0.002 0.001 -0.0030CO3 16 -0.005 -0.001 0.002 0.002 0.000 -0.001 0.003 0.001 -0.0010CT1 17 -0.001 0.002 0.007 0.003 0.001 0.004 -0.002 -0.003 -0.0100CT2 18 0.003 -0.017 -0.014 -0.001 0.010 0.011 -0.003 0.007 0.0030CT3 19 -0.003 0.009 0.011 0.003 -0.003 0.002 0.000 -0.006 -0.0120DJ1 20 -0.005 -0.006 -0.003 0.002 0.002 0.006 0.003 0.004 -0.0030DJ2 21 -0.004 -0.005 -0.006 0.001 0.001 0.007 0.003 0.005 -0.0010DJ3 22 -0.005 -0.006 -0.005 0.002 0.002 0.004 0.003 0.005 0.0010EI1 23 -0.010 -0.002 -0.018 0.008 0.002 0.009 0.002 0.000 0.0090EI2 24 -0.011 -0.001 -0.019 0.008 0.001 0.009 0.003 0.000 0.0100EI3 25 -0.010 -0.003 -0.020 0.008 0.001 0.012 0.003 0.001 0.0090FU1 26 -0.013 -0.001 -0.007 0.007 0.002 0.006 0.006 -0.001 0.0010FU3 27 -0.013 -0.001 -0.010 0.007 0.001 0.011 0.006 0.000 -0.0010GC1 28 -0.012 0.002 0.005 0.006 -0.003 0.006 0.006 0.001 -0.0100GC2 29 -0.013 0.001 0.005 0.007 -0.001 0.004 0.006 -0.001 -0.0090GC3 30 -0.012 0.002 0.002 0.006 -0.002 0.003 0.006 0.000 -0.0050GE1 31 -0.010 -0.003 -0.004 0.007 0.000 0.004 0.003 0.002 0.0000GE2 32 -0.010 -0.001 -0.004 0.007 -0.001 0.001 0.003 0.002 0.0030GL1 33 -0.004 0.000 -0.015 0.002 0.001 0.013 0.003 0.000 0.0030GL2 34 -0.004 -0.001 0.009 0.001 0.000 -0.005 0.003 0.001 -0.0030GL3 35 -0.004 0.001 -0.002 0.001 -0.001 0.005 0.003 -0.001 -0.0040GO1 36 -0.007 -0.003 -0.007 0.004 0.003 0.008 0.003 0.000 -0.0010GO2 37 -0.006 -0.001 -0.005 0.004 0.000 0.008 0.002 0.001 -0.0030GO3 38 0.000 0.000 0.000 0.001 0.001 0.005 -0.001 -0.001 -0.0050HA1 39 0.000 0.019 0.007 -0.002 -0.009 0.002 0.002 -0.010 -0.0090HA2 40 0.001 0.019 0.006 -0.003 -0.008 0.003 0.002 -0.011 -0.0090HA3 41 0.001 0.021 0.006 -0.003 -0.009 0.005 0.003 -0.012 -0.0110HT1 42 -0.007 -0.003 0.007 0.003 0.000 -0.002 0.005 0.003 -0.0050HT2 43 -0.007 -0.003 0.007 0.002 0.001 -0.001 0.005 0.002 -0.0060HT3 44 -0.008 -0.003 0.003 0.002 0.002 0.002 0.005 0.001 -0.0050KI1 45 -0.009 -0.005 -0.007 0.004 0.003 0.004 0.005 0.002 0.0020KI2 46 -0.009 -0.006 -0.010 0.005 0.004 0.007 0.005 0.002 0.0020KI3 47 -0.009 -0.005 -0.011 0.005 0.003 0.009 0.004 0.002 0.0020KO1 48 -0.004 0.001 0.013 0.000 0.000 -0.007 0.004 -0.001 -0.0050KO2 49 0.000 0.000 0.000 -0.003 0.000 -0.003 0.003 0.000 0.0030KO3 50 0.000 0.000 0.000 -0.003 0.002 0.002 0.003 -0.002 -0.0020LA1 51 -0.007 0.000 -0.006 0.004 0.001 0.011 0.003 0.000 -0.0050LA2 52 -0.007 0.000 -0.002 0.004 0.000 0.006 0.003 0.000 -0.0040LA3 53 -0.006 -0.002 -0.003 0.003 -0.001 0.008 0.003 0.003 -0.0050LS1 54 -0.006 -0.002 -0.002 0.001 0.004 0.003 0.005 -0.002 -0.0010LS2 55 -0.008 0.004 0.007 0.002 0.000 -0.002 0.005 -0.004 -0.0060LS3 56 -0.006 -0.003 0.007 0.001 0.005 -0.004 0.005 -0.001 -0.0030MD1 57 -0.012 -0.005 0.018 0.008 -0.001 -0.006 0.004 0.007 -0.0110MD2 58 -0.012 -0.004 0.027 0.007 -0.002 -0.012 0.005 0.006 -0.0160MD3 59 -0.012 -0.005 0.008 0.007 0.000 0.002 0.005 0.005 -0.0100ML1 60 -0.010 -0.001 -0.003 0.004 0.000 0.000 0.006 0.001 0.0040ML2 61 -0.011 -0.003 0.000 0.004 0.001 0.001 0.006 0.002 0.0000ML3 62 -0.011 -0.001 -0.004 0.004 0.000 0.003 0.007 0.001 0.0010MO1 63 -0.012 -0.002 0.009 0.006 0.000 -0.004 0.006 0.001 -0.0050MO2 64 -0.012 0.000 0.014 0.006 -0.001 -0.004 0.006 0.001 -0.0100MO3 65 -0.013 -0.003 0.009 0.007 0.000 -0.004 0.006 0.003 -0.0060PA3 66 -0.013 -0.002 0.002 0.011 0.002 -0.016 0.001 0.000 0.0140PA4 67 -0.017 0.001 0.041 0.019 0.012 -0.046 -0.002 -0.012 0.0050PM1 68 -0.011 -0.001 0.003 0.006 -0.001 0.005 0.005 0.002 -0.0080PM2 69 -0.011 -0.001 0.002 0.006 -0.001 0.006 0.005 0.002 -0.0080PM3 70 -0.011 -0.001 0.007 0.006 -0.002 0.000 0.005 0.003 -0.0070RE1 71 -0.007 -0.008 0.003 0.004 0.003 0.004 0.003 0.005 -0.0060RE2 72 -0.006 -0.009 -0.003 0.004 0.004 0.006 0.002 0.005 -0.0030RE3 73 -0.007 -0.009 -0.010 0.004 0.004 0.013 0.003 0.005 -0.0030SC1 74 -0.009 -0.007 0.002 0.004 0.001 0.002 0.005 0.006 -0.0040SC2 75 -0.011 -0.007 0.001 0.005 0.001 0.003 0.006 0.007 -0.0040SC3 76 -0.010 -0.006 -0.003 0.003 0.000 0.007 0.006 0.006 -0.0040SO1 77 -0.002 -0.005 -0.002 0.004 0.003 0.009 -0.001 0.002 -0.0070SO2 78 -0.002 -0.006 -0.001 0.003 0.004 0.009 -0.001 0.002 -0.0080SO3 79 -0.003 -0.006 -0.004 0.004 0.003 0.011 -0.001 0.003 -0.0070SW1 80 -0.012 0.000 -0.007 0.006 0.002 0.008 0.005 -0.002 -0.0010SW2 81 -0.012 -0.002 -0.014 0.005 0.002 0.014 0.007 0.000 0.0000SZ1 82 -0.007 -0.005 0.005 0.007 0.005 -0.001 0.001 0.000 -0.0030SZ3 83 -0.008 -0.005 -0.009 0.006 0.004 0.007 0.002 0.001 0.0010TD1 84 -0.011 -0.001 0.001 0.007 0.003 -0.001 0.005 -0.002 0.0010TD2 85 -0.011 -0.001 0.001 0.007 0.000 0.002 0.004 0.000 -0.0030TD3 86 -0.010 -0.001 -0.003 0.005 0.003 0.005 0.004 -0.002 -0.0020TR1 87 -0.009 0.000 -0.005 0.007 0.006 0.005 0.002 -0.006 0.0000TR2 88 -0.008 -0.002 -0.007 0.007 0.006 0.007 0.002 -0.004 0.0010TR3 89 -0.009 -0.002 -0.019 0.008 0.004 0.013 0.002 -0.001 0.0060WA1 90 -0.010 0.000 0.005 0.005 0.000 0.001 0.005 0.000 -0.0060WA2 91 -0.011 -0.001 0.001 0.005 0.001 0.004 0.006 0.000 -0.0050WA3 92 -0.010 -0.001 -0.012 0.005 0.001 0.012 0.005 0.000 0.0000ZU1 93 -0.013 0.000 -0.008 0.008 0.002 0.005 0.005 -0.002 0.0030ZU2 94 -0.012 0.000 -0.007 0.007 0.002 0.006 0.005 -0.002 0.0010ZU3 95 -0.012 0.000 -0.009 0.008 0.002 0.007 0.004 -0.001 0.002

Geodetic Institute EGNOS RIMS Cor. Field Survey
Doc.Id: ET-NMA-RICO-DL5A Version 1 � 019
0
2
4
6
8
10
12
14
16
18
20
22
24
26
0 2 4 6 8 10 12 14 16 18 20 22
0GL1
0GL2
0GL3
Figure 3: Local plot for station Glasgow. Units are m.

Geodetic Institute EGNOS RIMS Cor. Field Survey
Doc.Id: ET-NMA-RICO-DL5A Version 1 � 020
0 1 2 3 4 5 6 7 8 9 10 11 12 13 14 15 16 17 18 19 20 21 22 23 24 25 26 27 28 29 30 31 32 33 34 35 36 37 38 39 40 41 42 43 44 45 46 47 48 49 50 51 52 53 54 55 56 57 58 59 60 61 62 63 64 65 66 67 68 69 70 71 72 73 74 75 76 77 78 79 80 81 82 83 84 85 86 87 88 89 90 91 92 93 94 95 96STATIONS
-0.05
-0.04
-0.03
-0.02
-0.01
0
0.01
0.02
0.03
0.04
0.05
DE
VIA
TIO
N F
RO
M C
OM
BIN
ED
SO
LUT
ION
(m)
0 1 2 3 4 5 6 7 8 9 10 11 12 13 14 15 16 17 18 19 20 21 22 23 24 25 26 27 28 29 30 31 32 33 34 35 36 37 38 39 40 41 42 43 44 45 46 47 48 49 50 51 52 53 54 55 56 57 58 59 60 61 62 63 64 65 66 67 68 69 70 71 72 73 74 75 76 77 78 79 80 81 82 83 84 85 86 87 88 89 90 91 92 93 94 95 96STATIONS
North
0 1 2 3 4 5 6 7 8 9 10 11 12 13 14 15 16 17 18 19 20 21 22 23 24 25 26 27 28 29 30 31 32 33 34 35 36 37 38 39 40 41 42 43 44 45 46 47 48 49 50 51 52 53 54 55 56 57 58 59 60 61 62 63 64 65 66 67 68 69 70 71 72 73 74 75 76 77 78 79 80 81 82 83 84 85 86 87 88 89 90 91 92 93 94 95 96STATIONS
-0.05
-0.04
-0.03
-0.02
-0.01
0
0.01
0.02
0.03
0.04
0.05
DE
VIA
TIO
N F
RO
M C
OM
BIN
ED
SO
LUT
ION
(m)
0 1 2 3 4 5 6 7 8 9 10 11 12 13 14 15 16 17 18 19 20 21 22 23 24 25 26 27 28 29 30 31 32 33 34 35 36 37 38 39 40 41 42 43 44 45 46 47 48 49 50 51 52 53 54 55 56 57 58 59 60 61 62 63 64 65 66 67 68 69 70 71 72 73 74 75 76 77 78 79 80 81 82 83 84 85 86 87 88 89 90 91 92 93 94 95 96STATIONS
East
0 1 2 3 4 5 6 7 8 9 10 11 12 13 14 15 16 17 18 19 20 21 22 23 24 25 26 27 28 29 30 31 32 33 34 35 36 37 38 39 40 41 42 43 44 45 46 47 48 49 50 51 52 53 54 55 56 57 58 59 60 61 62 63 64 65 66 67 68 69 70 71 72 73 74 75 76 77 78 79 80 81 82 83 84 85 86 87 88 89 90 91 92 93 94 95 96STATIONS
-0.05
-0.04
-0.03
-0.02
-0.01
0
0.01
0.02
0.03
0.04
0.05
DE
VIA
TIO
N F
RO
M C
OM
BIN
ED
SO
LUT
ION
(m)
0 1 2 3 4 5 6 7 8 9 10 11 12 13 14 15 16 17 18 19 20 21 22 23 24 25 26 27 28 29 30 31 32 33 34 35 36 37 38 39 40 41 42 43 44 45 46 47 48 49 50 51 52 53 54 55 56 57 58 59 60 61 62 63 64 65 66 67 68 69 70 71 72 73 74 75 76 77 78 79 80 81 82 83 84 85 86 87 88 89 90 91 92 93 94 95 96STATIONS
Vertical
EGNOS ALL STATIONS 20040212Blue dot is GMV
Red triangle is NMAGreen filled square is OSO
Figure 4: Difference plot

Geodetic Institute EGNOS RIMS Cor. Field Survey
Doc.Id: ET-NMA-RICO-DL5A Version 1 � 021
5 Coordinate degradation
The different processes causing point movements of the Earth surface with respect to a global geodetic refer-ence frame are in detail discused in RD5. A major source of coordinate degradation is due to three-dimensionalsecular motion of all points on the Earth surface caused by geodynamic processes. The secular motion canbe described by a velocity model with constant velocity. However, in large regions, knowledge of the secularvelocity is still poor thus introducing considerable degradation of the accuracy of coordinates with time.
In tectonically active areas, non-linear motion can be expected. In such areas, degradation of coordinateaccuracy may be considerable and, in the absence of permanent monitoring, is diffcult to assess.
In this section, a justification for the error estimates of the velocity model for the EGNOS sites provided inRD5 is given. These errors determine how much the accuracy of the coordinates degrade if the velocity modelis used to update the coordinates from the central epoch of observation to another reference epoch. In Table 3,the error estimates for each RIMS station are given.
Without updating coordinates to a reference epoch close to presence, the degradation of the coordinates israther rapid. The velocities given for the individual stations in RD5 reach more than 20 mm/yr and 10 mm/yrin the horizontal and vertical components, respectively. Therefore, it is assumed here that a frequent update ofcoordinates is performed, so that the degradation is solely due to the error in the velocity model.
The velocity model is mainly validated on the basis of the ITRF reference sites. IERS provides both coordinatesand secular velocities for these sites. The coordinates of each site are determined through combination ofseveral independent solutions taking into account the full variance-covariance matrix of the solutions. In thisway, the reliability of these coordinates and velocities is high.
For the stable part of the European plate, a velocity model is available which, based on the comparison withall available ITRF stations, has an accuracy of
�1 mm/yr in each horizontal component and
�2 mm/yr in the
vertical. At sites on the Iberian Penninsula, observations are rather sparse and indicate that the model errorsare rather
�2 mm/yr in each horizontal component and
�3 mm/yr in the vertical.
Close to plate boundaries of the Eurasian plate, such as in Southern Italy, Iceland, the Azores, the velocitymodel has larger error. In these location, preference is given to actual, near-by observations, if available.Comparison between these observations and the velocity model gives an estimate of the maximum error. Basedon the available information, the errors for these sites are estimated to be in the worst case
�4 mm/yr in each
horizontal component and�
5 mm/yr in the vertical.
For the RIMS locations outside the Eurasian plate, it is noted that all these sites are in stable areas, where thetectonic plate model provides good estimates of the horizontal velocity. Again, the model is validated againstthe ITRF sites on the same plate. The velocity and error estimates are based on a combination of the availableinformation.

Geodetic Institute EGNOS RIMS Cor. Field Survey
Doc.Id: ET-NMA-RICO-DL5A Version 1 � 022
Table 3: Accuracy of the EGNOS Velocity Model.
Station East North Upmm/yr mm/yr mm/yr
0AA 1.0 1.0 2.00AU 1.0 1.0 2.00BL 1.0 1.0 2.00CO 1.0 1.0 2.00GE 1.0 1.0 2.00GL 1.0 1.0 2.00GO 1.0 1.0 2.00KI 1.0 1.0 2.00LA 1.0 1.0 2.00SW 1.0 1.0 2.00TD 1.0 1.0 2.00TR 1.0 1.0 2.00WA 1.0 1.0 2.00ZU 1.0 1.0 2.00PA 1.0 1.0 2.00LS 2.0 2.0 3.00ML 2.0 2.0 3.00SC 2.0 2.0 3.00PM 2.0 2.0 3.00SZ 3.0 3.0 4.00CT 3.0 3.0 4.00CI 3.0 4.0 4.00FU 3.0 4.0 4.00SO 3.0 3.0 4.0ORE 2.0 2.0 3.0OEI 3.0 3.0 4.00MO 2.0 2.0 2.00KO 2.0 2.0 3.00HA 2.0 2.0 3.00DJ 3.0 3.0 3.00GC 2.0 2.0 3.00MD 2.0 2.0 4.00HT 4.0 4.0 5.0