statistical justification of model b4 for multi-decade ... · statistical justification of model...
TRANSCRIPT

ORIGINAL ARTICLE
Statistical justification of model B4 for multi-decadeconcrete creep using laboratory and bridge databasesand comparisons to other models
Roman Wendner • Mija H. Hubler •
Zdenek P. Bazant
Received: 5 June 2014 / Accepted: 2 December 2014 / Published online: 15 January 2015
� RILEM 2015
Abstract This paper presents: (1) statistical justifi-
cation and calibration of model B4 using laboratory
creep data and long-term bridge deflection data, and
(2) statistical comparisons of various types with the
existing creep prediction models of engineering soci-
eties. The comparisons include the 1995 RILEM
Recommendation (Model B3), fib Model Code 1999,
Model Code 2010, ACI Committee-209 Model, and
the 2000 Canadian Model by Gardner and Lockman.
The statistics and comparisons rely on a separately
presented combined database of laboratory tests and
multi-decade bridge deflection measurements, which
has been developed at Northwestern University (NU).
The laboratory data assembled in the NU database
more than double the size of the previous RILEM
database. The collected bridge data include multi-
decade deflections of 69 large-span prestressed bridge
spans, most of them excessive. The multi-decade
bridge data are the only available and a significant
source for long-term calibration because only 5 % of
laboratory creep tests in the database had durations[6
years, and only 3 % are[12 years. Joint optimization
of the laboratory and bridge data is conducted.
Improved equations are obtained to predict the basic
parameters of the compliance function for creep from
the environmental conditions and concrete composi-
tion parameters, including the water-cement and
aggregate-cement ratios, cement content and type,
and admixture content. Comparisons with measured
individual compliance curves are included as an
essential check to validate the form of the compliance
function.
Keywords Creep � Database � Calibration �Concrete � Long-term bridge deflections � Statistical
evaluation
1 Nature of problem
Within the service stress range of structures, the
constitutive law for concrete creep may be assumed to
be linear in stress, i.e., to follow the principle of
superposition in time. The creep Poisson’s ratio is
R. Wendner � M. H. Hubler
Civil and Evironmental Engineering, Northwestern
University, Evanston, IL, USA
Present Address:
R. Wendner
Christian–Doppler Laboratory on Life-Cycle Robustness
of Fastening Technology, Institute of Structural
Engineering, University of Natural Resources and Life
Sciences, Vienna, Austria
Present Address:
M. H. Hubler
Civil and Environmental Engineering, Massachusettes
Institute of Technology, Cambridge, MA, USA
Z. P. Bazant (&)
Civil and Mechanical Engineering and Materials Science,
Northwestern University, Evanston, IL, USA
e-mail: [email protected]
Materials and Structures (2015) 48:815–833
DOI 10.1617/s11527-014-0486-1

approximately constant and the material can be treated
as isotropic. These facts make it possible to charac-
terize the creep of concrete in terms of a uniaxial
compliance function, whose generalization to a three-
dimensional constitutive law is straightforward. But
there are some complications.
One is the aging of concrete, which is caused by
cement hydration during the first year (or first few
years), and by microprestress relaxation for multi-year
and multi-decade creep. Another is the effect of drying
and heating, and generally the environmental condi-
tions, which are accompanied by cracking damage and
greatly modify creep. The fact that there are numerous
concretes with different compositions and that the
designer needs to predict the composition effect on
creep is a further complication. So is the need to predict
the effects of humidity and temperature. A major
complication is that the current design practice needs the
creep to be characterized by its cross section average,
even though the cross sections of beams or plates
exposed to the environment are in a nonuniform stress
state, with an evolving pore humidity distribution and
growth of microcracking. In view of all these compli-
cations, it is not surprising that the progress in mathe-
matical modeling of creep has occupied several
generations of engineering researchers and is still
incomplete.
It should be emphasized, however, that the future
doubtless is a local (or point-wise) material constitu-
tive law for concrete considered as a homogenized
continuum. In that case, the creep evolution is
different at different points of the cross section,
residual stresses and cracking develop, and the
environmental conditions become the boundary con-
ditions of a moisture diffusion problem. The local
constitutive law is much simpler than that for average
cross section behavior but its development and use
runs into two problems:
(1) Inverse three-dimensional finite element ana-
lysis of stresses, moisture and heat transport,
and cracking of the test specimens is necessary
to extract the creep law; and
(2) the designer must analyze the structure as a
three-dimensional finite element system and the
diffusion of moisture as well as heat conduction
must be included in the analysis.
The first problem has already been coped with deter-
ministically, for limited data, but at present is hardly
tractable for statistical optimization of fits of data from
the tests of thousands of specimens. The second
problem is forbidding for the current state of design
practice. Therefore, one must accept creep character-
ization in terms of the average creep of a cross section of
long members. Only in the case of sealed specimens that
are in a homogeneous state with constant moisture
content does such a characterization represent a locally
applicable point-wise constitutive law.
Here the goal is to calibrate a new prediction model
B4 for the average cross-section compliance function.
The development of model B4 has been the subject of
three preceding papers [1–3] presenting the model
equations, the optimization method and the statistics
of the shrinkage formulation. Model B4 is a general-
ization and improvement of model B3, which became
a RILEM Recommendation in 1995 [4–6], and of the
slightly updated version in [7].
The functions defining the relations of the basic
parameters of the compliance function to the compo-
sition and strength of concrete and to the environmen-
tal conditions are here identified and optimized. This is
done with the help of a new large laboratory database
featuring about 1400 creep tests, and another database
featuring multi-decade deflections of 69 bridge spans,
both assembled at Northwestern University [1, 8].
Model B4 is then statistically compared to the
preceding RILEM Model B3 and to four other
prediction models of engineering societies.
1.1 Overview and explanations of B4
and compliance functions to be compared
The compliance function in model B4 has the same
form as in model B3 [4, 9], with two exceptions. One is
that minor improvements are made in the equivalent
times introducing the temperature effect. The second
is that, unlike B3, the drying creep part of the B4
compliance is related only to the drying part of
shrinkage, rather then to the total shrinkage, since in
model B4 the drying and autogenous parts of shrink-
age are split into separate functions. This is a
refinement that is important primarily for high strength
concretes for which, in contrast to normal concretes,
the autogenous shrinkage is not a negligible part of
total shrinkage.
The B4 compliance function represents a smooth
transition from the double-power law for short creep
durations ðt � t0Þ [10–13] to a logarithmic law for long
816 Materials and Structures (2015) 48:815–833

multi-decade durations [14–16]. The compliance
function is a linear combination of the instantaneous
compliance, three terms for the basic creep (i.e., creep
at constant humidity and temperature, as in sealed
specimens) and one more term for the drying creep
(also called the Pickett effect). The three terms for
basic creep consist of the aging and non-aging creep
terms, and the long-time age-dependent viscous flow.
An important advantage of the B4 and B3 models is
that the compliance function satisfies the non-diver-
gence condition. This ensures that the creep recovery
curves obtained by superposition are always mono-
tonic, with no recovery reversal which is unrealistic
and thermodynamically objectionable [17]. Other
models (e.g., ACI209, MC99, MC10, GL) violate
the non-divergence condition, which is a fundamental
shortcoming, amply discussed before. Another condi-
tion is that the relaxation curves calculated by the
principle of superposition must never cross into the
opposite stress sign, which is again satisfied by models
B3 and B4, see Figs. 1 and 2, but not others.
The aging aspect is based on the microprestress
solidification theory [18]. The drying creep term has
the size effect and asymptotic properties based on
diffusion theory of moisture transport. Despite com-
bining several terms reflecting various creep mecha-
nisms, the B4 (as well as B3) functional form retains
smoothness. This form was shown to be able to fit
accurately complete test curves of normal concretes
over a broad time range, for the longest as well as the
shortest load durations in [13], and probably the same
applies to high strength concrete (except that there
seem to be deviations from this form at very early ages
for concretes with high contents of some admixtures,
which would probably require introducing an addi-
tional term). The basis of model B4, as well as B3, is
the solidification theory, which is important from a
fundamental theoretical point of view. It is generally
impossible to define thermodynamic potentials when
the material properties are considered as functions of
time. One must choose material properties that can be
defined so as to be constant. In the solidification
theory, this is achieved by considering that the
properties of a constituent, the hydrated cement gel,
are constant while the aging on macro-scale results
from an increase of the mass fraction (or concentra-
tion) of this constituent, as new hydration products are
gradually attached to the pore surfaces and thus stiffen
the material. After the hydration ceases, the multi-year
and multi-decade aging is, in the microprestress
theory, fundamentally explained by relaxation of the
tensile microprestress, which balances the disjoining
pressures in nanopores and facilitates the shear
ruptures of interatomic bonds responsible for creep.
The formulation based on these two mechanisms of
aging violates no tenets of thermodynamics.
Note that all the creep tests used for calibration
were conducted under centric uniaxial compression.
Therefore, the available models including B4 can have
large errors in the case of bending or highly eccentric
loads. The reason is that the microcracking distribu-
tion and the interaction of stress distribution with pore
humidity are different. However this is not a problem
for bridge box girders when the walls are subdivided
into through-thickness finite elements because the
eccentricity of the compression resultant in each such
element is always minor.
Also note the reason for introducing t00 ¼maxðt0; t0Þ
into Eq. 35 of [2], along with restricting that equation
to t� t00 and redefining Cdðt; t0; t0Þ ¼ 0 if t\t00. This
modification, introduced earlier in the 2000 version of
B3 [7, Eq. 1.14], prevents Cd from becoming negative
when t0\t0, i.e., when the load is applied before
exposure to drying. This case is infrequent in practice
but may occur, e.g., in segmental cantilever concreting
of box girders if the prestress is applied before striping
the form or another sealant. It must be admitted that
there are no longer-term creep data for this case, but
the use of t00 is the most logical fix.
The ACI [19–21], MC99 [22], and GL00 [23, 24]
compliance functions for creep are not composed of
separate additive terms for the basic and drying creep.
This split and the logarithmic form of long-time basic
creep were co-opted from B3 (and its predecessors) for
the latest revision of MC10 [25] in 2012. In all the
models, except MC10 as adjusted in 2012, the
compliance curve for basic creep reaches a horizontal
asymptote. The existence of such an asymptote has
been an illusion for a century (stemming from the
unfortunate habit to plot the creep curves in a linear
scale). In the ACI model, this asymptote is reached
very soon, which is why that model badly underesti-
mates multi-decade creep. On the other hand, in the
GL model the approach to this fictitious asymptote is
postponed beyond the times of practical interest. The
violation of the non-divergence condition, the cases of
Materials and Structures (2015) 48:815–833 817

relaxation ending by a change of sign, and the
impossibility to formulate properly the thermodynam-
ics in presence of aging are what plagues all these
models.
Additionally, the effect of the specimen size is
incorrectly introduced in ACI and MC99 models by
vertical scaling of the compliance function rather than
by its horizontal shift in the log-scale. None of the
established models is able to predict realistically the
effects of concrete composition, cement type and, in
particular, the effects of admixtures and aggregate
type. These effects, which represent a major improve-
ment of model B4 over Model B3, are the focus of this
work.
1.2 Engineering practice, creep coefficient
and choice of E-modulus
It is important to comment on the historical preference
of engineers to calculate creep effects in structures
using the creep coefficient /ðt; t0Þ, as opposed to the
total compliance Jðt; t0Þ. As long as the approximate
age-adjusted modulus method (AAEM, [17, 26–28]) is
used there is, of course, nothing wrong in using /,
provided that /ðt; t0Þ is calculated from compliance
Jðt; t0Þ.The AAEM (recommended by ACI-209 since
1982, by CEB since 1990, and by Model Code 2010)
represents a significant improvement over the 1967
Trost method [29] which is still used in commercial
bridge creep programs although it is not simpler and is
often quite inaccurate due to its shortcomings. The
Trost method uses a semi-empirical ‘‘relaxation coef-
ficient’’ unrelated to Jðt; t0Þ. It does not take into
account the ageing of elastic modulus E and expresses
the incremental Young’s modulus for the time period
from t0 to t simply by E00 ¼ E28=½1þ q/ðt; t0Þ�, where
q is Trost’s empirical relaxation coefficient (typically
fixed as 0.8) and E28 is the constant 28-day modulus. A
simple replacement of E28 by EðtÞ and of q by the
Fig. 1 Relaxation curves
calculated by the principle
of superposition for sealed
conditions (solid lines) and
relative humidity of 60 %
(dashed lines)
818 Materials and Structures (2015) 48:815–833

aging coefficient v, as shown in [27], ensures exact
results according to the principle of superposition for a
broad range of strain histories and provides simple yet
accurate approximations for many practical problems
[26, e.g.].
The creep coefficient / by itself is meaningless as a
material characteristic, even though engineering soci-
eties suggest otherwise. The only thing that matters for
creep effects in structures is the total compliance,
which may be obtained as Jðt; t0Þ ¼ ½1þ /ðt; t0Þ�=EðtÞ. For long-time creep effects in structures the
choice of the E value is unimportant provided that the
creep coefficient is calculated from Jðt; t0Þ as
/ðt; t0Þ ¼ E Jðt; t0Þ � 1. In other words, what is essen-
tial is to use the correct combination of / and E.
Based on the compliance, Eðt0Þ ¼ 1=Jðt0 þ D; t0Þ.In testing practice, the choice of D can vary from 0.1 s
(as in creep tests started by releasing a compressed gas
valve) to D ¼ 0:1 day (as in standard creep frames
with a manually tightened spring). Because of high
(usually ignored) short-time creep, the difference in E
can be as big as 25 %. Nevertheless, when both E and
/ are calculated from J, the long-time structural creep
effects obtained using AAEM are about the same
regardless of the choice of D.
Unfortunately, many experimenters report only the
creep coefficient and do not give enough information
about the corresponding elastic modulus value. Many
data sets report nothing in this regard and thus the
compliance cannot be uniquely reconstructed.
Because of this, dozens of such data sets had to be
omitted from the present analysis.
A further problem arises from the fact that most
engineers evaluate E from the code formulas of ACI,
CEB and fib and then combine it with the recom-
mended / value which is incompatible. The code
formulas are intended mainly for determining the
deflections under traffic loads and the vibration
frequencies (since E is measured after several
unload-reload cycles). Big mistakes occur when this
Fig. 2 Creep strain
development due to loading
at t01 ¼1 day and unloading
at t02 ¼28 days
Materials and Structures (2015) 48:815–833 819

kind of E is combined with / determined from tests as
the ratio of creep strain to some unspecified sort of
initial deformation.
The subsequent sections will show that the B4
compliance predictions are superior to those obtained
by other widely used models, in particular ACI92 and
MC99. This statistical proof outweighs any intuitive
considerations based on the fact that some of the
empirical formulations linking the parameters of the
B4 (or B3) creep model to composition information
deviate from the trends suggested in other models.
Some may, for example, object that, according to
B4, the creep coefficient / increases with increasing
strength while the fib formulation (MC99,MC10)
indicates a decrease of /. But there is nothing
fundamentally illogical about this B4 feature. Indeed,
physical reasoning suggests that lowering the water-
cement ratio, w=c, should have more effect on the
increase of elastic modulus, due to stiffening of the
porous microstructure, than it does on the decrease of
creep rate, which is governed by the rate of breakage
of C-S-H bonds on the atomic scale. These are
physically different phenomena, with different mech-
anisms. Of course, if the increase of E due to decrease
of w=c is considered smaller than the correct value,
then one can incorrectly infer an increase of /. For
similar reasons, one cannot object to an increase of /with the age age t0 at loading.
1.3 Effects of temperature, cement type
and admixtures
Model B4 [2] introduces equivalent times based on
Arrhenius-type equations for the temperature effects
on the creep rate, aging (or hydration) rate, and drying
shrinkage rate. In principle, their activation energies
can be different but, because of data ambiguity, the
activation energy U of each is considered the same
(U=R � 4,000 �K, R = gas constant), as formulated in
[13] and roughly supported by several experimental
studies [30, 31]. This temperature dependence does
not apply above 75 �C, because of phase changes and
because different activation energies dominate in
different temperature ranges.
In basic creep, the activation energies of creep rate
and of hydration compete with each other, the former
accelerating and the latter decelerating the creep as
temperature rises. The effect of the latter disappears
once hydration is complete (i.e., after about 1 year).
The drying part of creep also depends on the activation
energy of drying (or diffusion process), which leads to
an acceleration of the drying creep term when the
temperature is raised. These effects are captured in
model B4 by a series of scaling parameters.
Admixtures have a smaller effect on creep than on
shrinkage. The effects of water-reducers, retarders,
superplasticizers, air-entraining agents, accelerators,
shrinkage reducing agents and mineral admixtures
have been studied for creep. Many test data on the
effects of cement type and of admixture type and
amount exist, but they are so scattered that no
systematic trends can be detected.
The differences in the effects on the rate and the
magnitude of total creep attributable to admixtures
depend on their diverse effects on evolution of
microstructure. There is no consensus on the contri-
bution of water-reducers and superplasticizers, as the
data lie in the range of experimental uncertainty.
While some tests in the database indicate that the
addition of accelerators and the fly ash replacement
exceeding 15 % systematically cause some increase of
creep, generally the air-entraining agents, shrinkage
reducing admixtures, and low amounts of fly ash
replacement are found to have no consistent, system-
atic and statistically verifiable effect on creep.
The high strength concrete has been shown by
various researchers [32–34] to have a creep coeffi-
cient about 1.8–2.4 times smaller, However, the
creep effects on the structural scale are often greater
because the cross sections are often much thinner and
the elastic modulus is about 2–4 times larger. The
creep reduction is due to the lower w=c ratio and the
addition of silica fume or fly ash. The self-consolidat-
ing concrete has similar creep as the normal concrete
[35].
What is clear at present is that the effects of these
six admixtures are highly variable statistically and no
unique time functions exist. For the mean behavior it
seems sufficient to introduce empirical coefficients
that scale only the creep magnitude. As for the effect
on multi-decade creep in particular, no data exist.
Recalibrations should be performed in the future as
new data become available.
Similar studies were made for the effect of cement
type on the basic and drying creep. Calibrated
parameters capturing the cement type dependence
exist in all models for creep. The European classifi-
cation of R—normal, RS—rapid hardening and SL—
820 Materials and Structures (2015) 48:815–833

slow hardening is selected for model B4 since it is
directly related to the reaction rate of the cement
instead of the type of application, which is the basis of
other classification systems.
Predictions are complicated by the fact that cement
classifications as well as cement products and pro-
duction standards have changed over time and various
cement replacements have been introduced. This
engenders a large scatter and uncertainty in the model
calibration. The type of cement used shows a strong
correlation to the observed basic and drying creep
when using the data in the NU database. On the other
hand, contrary to shrinkage, there is little correlation to
the aggregate type classes. Even though an effect of
the aggregate type is perceived to exist [36] there is a
lack of consistent and repeated test data. For each type
of aggregate there exist only a limited few curves, in
the current NU database at most 6, which is not enough
for statistical inferences.
1.4 Optimization of fit of combined laboratory
and bridge databases
Large bridges and other creep sensitive structures are
generally designed for service lives of 50–150 years.
However, 95 % of the laboratory creep tests available
in the largest worldwide laboratory database [1] with
1370 creep curves do not exceed 6 years in duration.
Only 3 % of the data sets, many of them with
questionable reliability of long-term measurements,
exceed 12 years.
Consequently, the laboratory data used for calibra-
tion of a creep model must be supplemented by inverse
inference from multi-decade structural observations.
Most informative for that purpose are the data on
deflections of large-span prestressed concrete seg-
mental box girder bridges, provided that the deflec-
tions are excessive (if they are not, it means that a large
gravity deflection is offset by a large upward deflec-
tion due to prestress, which is a small difference of two
large random numbers and is too scattered to be
useful). Data on multi-decade shortening of pre-
stressed bridge girders would be useful even if the
deflections are small, but such data are unavailable.
Data on multi-decade shortening of columns of tall
buildings would also be useful but are unavailable as
well.
The most useful bridge paradigm is the K-B bridge
in Palau [37], built in 1977. Within 18 years it
deflected by 1.61 m compared to the design camber.
Probably it would not have received special attention
if remedial prestressing in 1976 did not cause it to
collapse (after a three-month delay, with falalities).
The data, sealed in perpetuity after court litigation,
were fortunately released in 2008 (as a result of a
resolution of Structural Engineers World Congress). It
was found [37] that the creep equations in the standard
recommendations or design codes of engineering
societies severely underestimated the mid-span deflec-
tions. Their predictions amounted to 31–43 % of the
measured values, and 57 % for the theoretically based
Model B3, which is a 1995 RILEM recommendation.
The new Northwestern University (NU) [1] data-
base, which more than doubles the size of the previous
laboratory database [38], includes also the data on
relative multi-decade deflection histories of 69 large
bridge spans from nine countries and four continents
[8]. These data are used in statistical inverse analysis,
and are crucial for calibrating the terminal trend of
creep. A complete inverse analysis was unfortunately
impossible due to a lack of information on the concrete
composition and strength, structural geometry and
prestressing for most of the bridges.
Instead, based on the method formulated in [8], the
mean terminal deflection development was trans-
formed into an approximate terminal compliance
evolution based on estimating likely average proper-
ties of these bridges and their concretes. These
estimated properties included: the required design
strength, which was converted to the mean strength of
concrete, the average effective cross-section thick-
ness, the environmental humidity (based on the bridge
location), and the cement composition. Errors stem-
ming from these simplifying assumptions mostly
compensate each other in a statistical sense, and so
the mean relative compliance development deduced
from all the 69 bridge spans is probably roughly
correct even though the absolute residuals J � J are, of
course, rendered meaningless by these estimations.
The analysis of bridge data showed a systematic
underestimation of the terminal trend of creep and led
to an adjustment of the compliance function that
minimizes the error in matching the terminal deflec-
tions of these 69 bridges. In the optimization, the
Materials and Structures (2015) 48:815–833 821

transformed bridge deflection data were considered to
have 1/3 of the total weight (and the laboratory
database 2/3). The terminal bridge deflections were
introduced only for optimizing the parameters that
control the terminal slope of the compliance function
in the logarithmic time scale. Since the database
mostly contains data of much shorter durations (\6
years), only the scaling parameters (and not the
formulas for the intrinsic and extrinsic influences)
were optimized for the bridges. Thus the optimization
of the effects of concrete composition and environ-
ment was not biased by the incompleteness of bridge
data.
1.5 Parameter identification and optimization
method
While the initial goal of the update of the creep model
was solely a recalibration (keeping the functional form
and theoretical foundation of Model B3), five assump-
tions in the model were re-examined before proceed-
ing with the optimization process.
The first is the initial elastic modulus for static load
application. As mentioned in Model B3 RILEM
recommendation 107-GCS [4], the inverse of the
28-day elastic modulus given by the ACI empirical
equation corresponds to the compliance for 5–20 min
after load application. However, a better agreement
can be reached between the standard 28-day modulus
and total compliance after roughly 1–2 min
(D ¼ 0:001 days). This conclusion is the basis of the
calibration of Model B4 as well as B4s. Figure 3 shows
the comparison of the B4 and B4s compliance
predictions with E28.
The approximate age independence of q1 ¼ 1=E0
(previously shown in Fig. 6 of [5]) has been verified
and is illustrated in Fig. 4.
Second, the exponents n and m of the load duration
and age [2] were calibrated by short to medium range
data from the NU database as well as nano-indentation
creep data for cement paste obtained by Vandamme
et al. [39]. Only the basic creep tests of normal
concrete, unaffected by drying and autogenous shrink-
age, were used in this analysis. Unbiased optimiza-
tions with different starting points confirmed that, in
an average sense, the previously assumed parameters
n ¼ 0:1 and m ¼ 0:5 [5] still provide the best and,
(a) (b)Fig. 3 Agreement between
E28 and creep compliance
after D ¼ 0:001 days for
a Model B4, and b Model
B4s
Fig. 4 Fit of the Dworshak Dam data demonstrating that the
short-time creep data confirms the age-independence of
q1 ¼ 1=E0
822 Materials and Structures (2015) 48:815–833

more importantly, consistently good, fits. For certain
compositions, the prediction quality could be
improved by varying n between 0.08 and 0.12.
However, no consistent trend or dependency on
composition parameters or cement type could be
identified.
Third, the calibration of the creep model was in
general highly sensitive to the value of the initial
elastic strain. So, exponent p1 in the estimation of the
instantaneous compliance in terms of the 28-day
Young’s modulus [2] had to be optimized first and
then prescribed for all the subsequent optimization
steps. Two approaches were pursued and turned out to
yield similar results: optimization of the full formu-
lation of model B4 (with fixed average long-term
parameters) and a linear fit in power-law scale of the
short-term test data with at least 3 measured data
points within the first minutes to hours of measure-
ment, depending on the age of concrete at load
application (e.g., up to 4 hours for concretes loaded at
7 days). The limit is based on an empirical formulation
that is derived for the functional form of model B4
based on sensitivity studies.
Fourth, as in Model B3, the basic creep formula for
the aging viscoelastic compliance rate is given in a
closed form, which is all that is needed for step-by-
step computer analysis of structures. But its integra-
tion leads to a binomial integral Qðt; t0Þ that cannot be
evaluated in closed form. Although its numerical
evaluation is easy, an approximate formula for func-
tion Qðt; t0Þ is available [2, 4, 7]. It applies equally to
model B4 and it has been checked that it has a four
digit accuracy within the range of interest.
Fifth, recent important test data from M.I.T. on
nano-indentation creep [39] have also been analyzed,
for validation purposes. Since the tests were made on
hardened cement paste, the compliance magnitude
cannot be compared with the tests on concrete, but the
exponent n of the load duration must be about the
same. Figure 5 shows the measurement data for
durations t � t0 from 0.1 to 200 s, compared to the best
fits by a logarithmic time function, by a power law
with exponent n ¼ 0:1, and a power law with optimum
exponent. Sampling bias towards later ages with
denser point spacing was removed through a weight-
ing scheme with equal weights for each half-decade in
the log-scale.
The overall fit in Fig. 5 clearly shows that an
exponent n ¼ 0:10 is a good approximation. The best
fit, with R2 [ 0:99, is attained for n ¼ 0:089 (R =
coefficient of determination). The logarithmic time-
function (which corresponds to n! 0) is a fair
approximation but by no means an optimum. Figure
5b shows the fit to the first measurements for durations
\1 s and its extrapolations to longer times. Again
n ¼ 0:10 works well [the optimum fit within (0.1, 1 s)
leads to exponent n ¼ 0:577, but the reason is that
inserting the indenter took much longer than 0.1s].
The next stage required re-evaluating the form of
the dependence of material parameters on concrete
composition. The existing model (B3) depended on
both the mix characteristics (i.e., the water-cement
ratio, aggregate-cement ratio, and cement content) and
the mean mechanical characteristics (i.e, the 28-day
strength and the Young’s modulus). It is well known
that water-cement ratio, compressive strength and
(a) (b)Fig. 5 Best fit of nano-
indentation test data by
Vandamme et al. [39] by
logarithmic time function,
power law with exponent
n ¼ 0:1, and power law with
optimum exponent: a fit of
the full data range, b fit of
first second only
Materials and Structures (2015) 48:815–833 823

Young’s modulus are highly correlated. With decreas-
ing w=c, both the strength and the elastic modulus
increase. As a consequence of this high correlation, a
simultaneous use of the strength and w=c brings about
little gain and in fact makes the optimization problem
ill-conditioned, yielding arbitrary and non-unique
results. Furthermore, the compressive strength typi-
cally only serves as a convenient indicator for other
material properties.
Therefore, two sets of predictor equations, for two
versions of model B4, have been formulated and
calibrated, one using the mix proportions only (named
B4), and one using the mean compressive strength
only (named B4s). Young’s modulus is used in both
versions since it is the most important characteristic
for the instantaneous deformation.
All the effects of composition and strength enter the
material parameters in the form of products of power
functions. This has the advantage of a linear relation
between the logarithms of the input and response and
thus helps convergence of the optimization (another
reason for power functions is that they are self-similar,
which is appropriate when no characteristic value is
known). To keep the input values dimensionless, these
functions have all been normalized by their respective
mean values. This avoids most dimensional inputs,
which also minimizes the chance of user’s error in
dimensions.
The water-cement ratio was found to be the most
important input parameter for the magnitude of all the
components of the compliance function. This is
consistent with other studies and agrees with the creep
mechanisms considered in the micro-prestress solid-
ification theory [18]. The second most important is the
aggregate-cement ratio, which affects the non-aging
viscoelastic creep, the flow, and the drying creep terms
of the compliance function.
The individual influencing parameters were iden-
tified by a step-by-step procedure using various
statistical approaches. At first, the potential influenc-
ing parameters were selected as those reported by most
experimenters. The objective was to identify the
relations of these parameters to the basic parameters
q1; . . .q5 (see [2]) of the B4 compliance function, as
well as to the scaling factors for temperature, various
admixtures and the cement type. For each unknown
relation, for example, the effect of water-cement ratio
on the scaling factor of the non-aging viscoelastic
creep term, one could identify on the creep curve the
time range of maximum sensitivity (one or a few
decades in the logarithmic time scale).
Subsequently, the relations of model parameters [2]
to input material parameters affecting this time range
were optimized, so as to minimize the C.o.V. of the
differences between the predicted curve and the data
points in this time range (relative to the mean of data,
not of the differences) [3]. The optimization also
yielded an R2 error measure, a full Jacobian matrix for
sensitivity analysis, and the fit of each curve for visual
shape analysis. The evaluation of the Jacobian matrix
revealed correlations between the model parameters
and the input properties, as well as between both
groups. This process allowed adjusting the formula-
tion and a converged selection of input material
parameters of the creep model (for normal concrete
under standard conditions). Further scaling parameters
were introduced to capture the effects of temperature,
admixtures and cement type. The general optimization
algorithm, strategy, and process used to develop the
full model B4 are described in a preceding paper [3].
The exponents p1 and p2 of the scaling factors in basic
creep, and p5 in drying creep [2], showed the strongest
dependence on the cement type. The effects of
admixtures were best described by modifying the
exponents p2; p3; and p4 for basic creep and p5 for
drying creep [2].
The changes in functional form of the B4 creep
formula are sketched in Fig. 6. For standard conditions,
an increase in w=c increases the creep rate as well as the
vertical scaling factor of the creep curve. A decrease in
the relative humidity of the environment increases the
vertical scaling factor but has no significant effect on
the halftime of the creep function, which gives the
horizontal scaling in a linear time plot (or a horizontal
shift in log-time plot). An increase of temperature
generally engenders in the database concretes an
increased rate and magnitude of creep (except possibly
for very young concretes for which the hydration
acceleration, which reduces creep, may prevail). The
last diagram in the figure shows the change in the creep
curve shape due to a change of cement type.
1.6 Verification of the shape of predicted
individual curves
As described in the previous paper of this series for
shrinkage [40], a separate statistical analysis aimed at
824 Materials and Structures (2015) 48:815–833

verifying the shape of model B4 creep and shrinkage
curves was performed at the outset. If the shape of the
individual curves of some model is not realistic, it
makes no sense to optimize that model by the
database. However, by comparisons to the entire
database it is impossible to check whether or not the
shape of the creep or shrinkage curves is correct
because the database scatter due to concrete type,
composition and admixtures dwarfs and obscures any
strange features in the curve shape.
Figure 7 shows such comparisons of the model B4
curves with individual measured curves, using only
the data from the tests whose duration range was long
enough for the comparison to be meaningful. Figure 8
shows similar individual comparisons for the curves of
the ACI92 model. To examine the capability of the
general form of the models, the composition depen-
dent horizontal and vertical scaling parameters have
been optimized, consistently for all the curves of each
concrete batch.
These graphical comparisons are followed by
statistical comparisons in terms of bar charts docu-
menting the capability of the form of each model to
capture the shape of the individual creep curves (Fig.
9) as a function of load duration t � t0 and their
dependence on the age t0 at loading. Bar charts are also
used to compare the optimum fits of the full database
(Fig. 10). A detailed study of the development of
residuals gives insight into the model calibration.
Furthermore, an uncertainty quantification of the main
parameters of model B4 is presented.
Example fits in the top row of Fig. 7 show the
capability of model B4 to fit tests of long durations or a
broad range of ages at loading, selected from the NU
database. The bottom row shows that test series with
broad variations of environmental conditions (tem-
perature and humidity) and specimen size can also be
fitted well. The trends in the experiments on the same
concrete could be recreated with a C.o.V. of less than
10 % even though only the free scaling parameters
were adapted, consistently, of course, for all curves of
the same series (and thus the same concrete). None of
the parameters influencing the dependence on t0, T ,
V=S, h were changed. Depending on the particular
form of each model, the number of free parameters
varied between two (i.e, the initial deformation plus
the multiplier of the creep part of compliance) for ACI
and other models, and five for model B4. The
dependence on the investigated parameter was not
changed in any case.
10-2 100 102 1040
50
100
150
200
10-2 100 102 1040
50
100
150
200
10-2 100 102 1040
50
100
150
200
10-2 100 102 1040
50
100
150
200
J[10
-6/M
pa]
J[10
-6/M
pa]
t-t’ t]syad[ -t’ [days]
Effect of w/cT = 20°Ch = 65%D = 6 ina/c = 4c = 400Type Rf28 = 40 MPa
t’ = 14 dayst0 = 7 days
w/c = 0.4
0.3
0.2
Effect of ambient humidityT = 20°Cw/c = 0.35Type R
h = 55%65%
75%
Effect of ambient temperatureh = 65%w/c = 0.35Type R
T = 60°C
40°C20°C
Effect of cement typeh = 65%w/c = 0.35T = 20°C
Cement type = SL
R
RS
Fig. 6 Trends of variables
associated with the B4 creep
curve
Materials and Structures (2015) 48:815–833 825

Table 1 defines the creep time function, the number
of intrinsic parameters (as a gauge of function
flexibility), and the number of fitted parameters used
for each model. Intrinsic parameters are herein defined
as those parameters that describe the concrete com-
position, such as w=c; a=c; c, but also the strength and
elastic modulus. In addition to a visual evaluation of
the capability of the model to capture the shape of the
creep curves, shape statistics are also calculated using
a selection of curves with sufficient data in the initial
and final range. The resulting comparisons based on
the laboratory data are presented in Fig. 9. A number
of inferences can be made from this comparison.
If only the data sets with the influence of drying are
analyzed, see Fig. 9 (top left), model B4 based on
concrete composition outperforms the other models,
followed by B4s. The reason is that it can separate the
drying shrinkage from the autogenous shrinkage and
thus realistically describes the influence of drying
creep in the presence of admixtures. Models without
this split in autogenous and drying shrinkage (GL00
and ACI92) perform worst for total creep, even though
the quality of fit for basic creep (no influence of
drying) is only slightly inferior. It is interesting to note
that the now replaced MC99 outperforms all other
models except B4 and B4s with regard to short-term
basic creep. The combined set of comparisons is
presented in the lower row and follows the ranking
governed by the influence of drying creep.
After evaluating for various models the functional
form of compliance, i.e., the shape of the time curve, the
next step is to investigate and compare their capability to
predict the dependence on the age at loading. This step is
omitted here for the sake of brevity as the findings are
already detailed in the preceding paper [3].
The third step is to investigate and compare the
overall prediction quality, considering the full NU
database. To distinguish the quality of fit in early and
later stages of creep, we first separately consider the
laboratory data (mostly \6 year in duration) and the
Fig. 7 B4 example fits of select creep test curves
826 Materials and Structures (2015) 48:815–833

multi-decade bridge data. Figure 10a, b show the
quality of fit of different models for the laboratory data
only, and Fig. 10c shows the same for the multi-decade
relative bridge deflections. The combination of long-
term laboratory data (longer than 1,000 days) and
relative bridge deflections is given in Fig. 10d.
The C.o.V. of residuals for short-term laboratory
creep test data is found to be the lowest for the B4 and
GL models. Their near equivalence may be due to the
similar flexibility of the time function used and the fact
that the GL model was empirically based on a carefully
handpicked selection of creep tests that showed a clear
trend in time rather than the complete data set, as has
been done with the B3 and B4 models. In terms of
global statistics MC10 outperforms its predecessor
MC99 for short-term creep and reaches a close tie for
long-term lab data even though the individual shape
statistics of Fig. 9 show the opposite trend. The reason
likely lies in a better overall calibration of the model
(note that Fig. 9 illustrates the potential of the
formulation, not its calibration). Model B3 suffers
from the missing split in autogenous and drying
shrinkage. This compromises the long-term prediction,
due to the distortion of the drying creep component, in
spite of its correct functional form as revealed in Fig.
10c. A wrong functional form (horizontal asymptote)
as formulated for MC99, and ACI92 is clearly revealed
in the statistics of multi-decade structural evidence as
plotted in Fig. 10c. The GL00 model is an exception as
its functional form corresponds to MC99 but is
calibrated in such a way that it approaches a horizontal
asymptote only far beyond the longest measurement
times and thus mimics a terminal slope of the creep
compliance in logarithmic time.
This fact underscores the need for a separate
investigation of the functional form, and in particular
its asymptotics, see Fig. 10c. Clearly all the models
that can capture the correct asymptotics (B3, B4,
MC10) or that approach it (GL00) outperform models
that do not (ACI92, MC99).
Fig. 8 ACI92 example fits of select creep test curves
Materials and Structures (2015) 48:815–833 827

If the long-term laboratory creep test data are
combined with the bridge deflection information, a
more balanced perspective of the long-term prediction
quality is obtained. As expected, models B4 and B4s
show the lowest C.o.V., followed by B3, MC10,
GL00. The MC99 model cannot catch up with the
competitors but still exceeds the prediction quality of
ACI92 by far.
In future studies, in which not only the relative but
also actual deflections of bridges should be used for
calibration, it will be important to use a realistic model
for steel relaxation as affected by temperature and
strain variation; see [41].
To give a more detailed insight into the develop-
ment of the prediction quality, Fig. 11 shows the
residuals, J � J, of all models plotted against
logðt � t0Þ. Model B4, and also the simplified
strength-based model B4s, consistently show a very
small mean value deviation. The scatter band given by
the 5 and 95 % percentiles is largely symmetric, which
confirms no bias towards over- or under-estimation.
The ACI92 and GL00, on the other hand, tend to
underestimate creep for long times, as seen in the
mean value trend and especially the scatter band. The
scatter of MC10, interestingly, is symmetric. But it
exceeds the scatter of all the other models in the range
between 10 and 1,000 days while decreasing for long
times.
To reduce the scatter for long times, information on
the concrete composition must accompany future
structural measurements. So must the information on
the bridge dimensions, prestress and environment.
1.7 Uncertainty quantification
A quantification of model parameter uncertainty is
obtained by individually refitting all the creep curves,
with scaling of the mean fit, and then analyzing the
(a)
(c)
(b)
Fig. 9 Quality of fit for subsets of a total creep, b basic creep only, and c combined set, based on absolute values
828 Materials and Structures (2015) 48:815–833
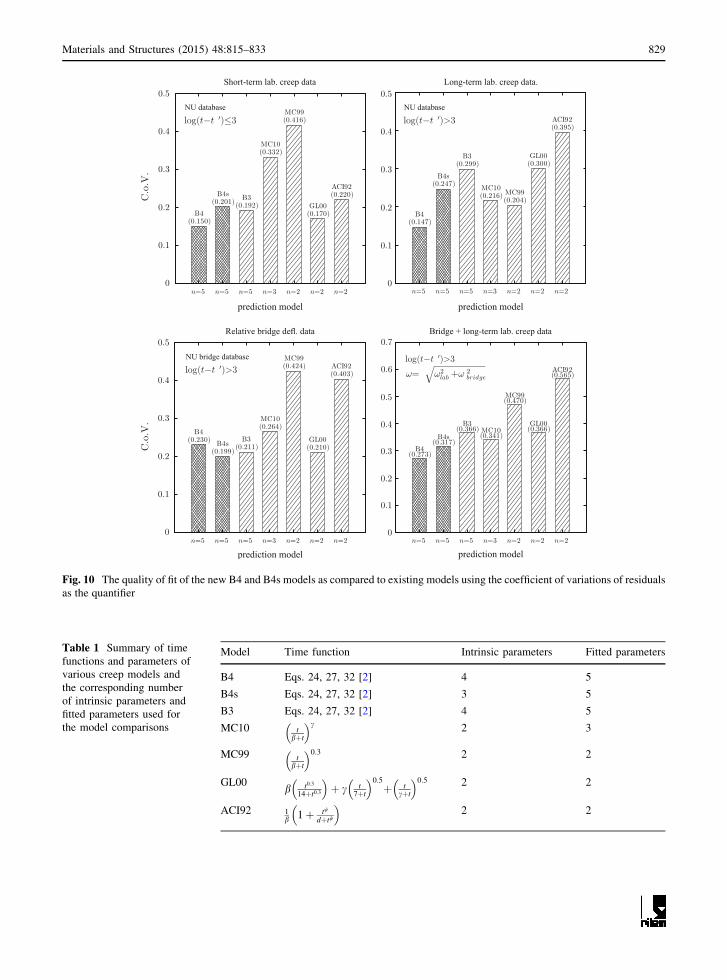
Fig. 10 The quality of fit of the new B4 and B4s models as compared to existing models using the coefficient of variations of residuals
as the quantifier
Table 1 Summary of time
functions and parameters of
various creep models and
the corresponding number
of intrinsic parameters and
fitted parameters used for
the model comparisons
Model Time function Intrinsic parameters Fitted parameters
B4 Eqs. 24, 27, 32 [2] 4 5
B4s Eqs. 24, 27, 32 [2] 3 5
B3 Eqs. 24, 27, 32 [2] 4 5
MC10 tbþt
� �c 2 3
MC99 tbþt
� �0:3 2 2
GL00b t0:3
14þt0:3
� �þ c t
7þt
� �0:5
þ tcþt
� �0:5 2 2
ACI92 1b 1þ tw
dþtw
� �2 2
Materials and Structures (2015) 48:815–833 829

distribution of scaling factors as discussed in [3] and
shown in Fig. 12. The resulting distributions can be
approximated by lognormal distributions. These dis-
tributions may serve as input for long-term perfor-
mance predictions and life-time analyses [42–44]. The
5 and 95 % confidence limits based on the fitted
distributions of uncertainty factors w are: wq1 2½0:6; 1:8�, wq2 ¼ wq3 2 ½0:4; 3:3�, wq4 2 ½0:4; 2:7�,and wq5 2 ½0:4; 3:1�.
1.8 Local constitutive law for three-dimensional
structural analysis
Analysis of mass structures such as dams or nuclear
containments, as well as a realistic analysis of beams,
plates, shells and box girders, requires a constitutive
law for three-dimensional continuum modeling. The
B4 compliance function for basic creep, combined
with the principle of superposition and (assumed)
constancy of Poisson’s ratio, provides a constitutive
law in the form of a matrix history integral—a matrix
Volterra integral equation with non-convolution ker-
nel. This constitutive law can be converted to a rate-
type form; for further details and its application to
bridges see, e.g., [45].
Even for basic creep there are limitations to the use
of the superposition-based hereditary integrals. One is
the temperature rise due to hydration heat, which is
neglected here. This is approximately correct only for
thin members at constant thermal environment, with
moisture sealing but no thermal insulation. Another
limitation applies to high-strength concrete, in which
the self-desiccation can decrease pore relative humid-
ity to as low as 80 % (compared to about 97 or 98 % in
normal concretes).
If the local specific moisture content of concrete
and local temperature inside concrete vary, then the
present compliance function must first be converted to
a rate-type constitutive law based on the Kelvin chain,
and then the viscosities of Kelvin units must be
replaced by functions of current water content and
temperature. Cracking damage, which is the source of
Fig. 11 Development of residuals with logðt � t0Þ according to prediction model
830 Materials and Structures (2015) 48:815–833

nonlinearity of concrete creep, must also be modeled.
This approach is the same as already approximately
demonstrated for Model B3 and its predecessors (see
Eq. E1 in [4] or Eq. 1.43 in [7]).
1.9 Concluding comments
1. Overall, model B4 provides the best prediction of
creep, as revealed by fitting the collection of over
1500 creep test curves in the NU database and the
data on relative multi-decade deflections of 69
bridges. Model B3 comes overall as the second
best, with a big gap from B4, and is closely
followed by MC10 and GL00.
2. Practically most important is the prediction of
creep magnitudes after many decades, and in that
regard B4 or B4s is clearly the best, B3 as distant
second, and MC10 and GL00 close behind.
3. The ACI92 model, which is almost the same as the
original 1971 ACI-209 model [19], is overall the
worst. This conclusion is a warning that too much
inertia in the codes or standard recommendations
harms the engineering practice.
4. It comes as a surprise that model B4s, based
solely on concrete strength, performs on aver-
age almost as well as the full model B4.
Nevertheless, B4s misses the full model’s
predictive capabilities regarding the influence
of composition, aggregate type and admixtures.
It is distinctly poorer than B4 in individual fits
and predictions (note the scatter plots in the
preceding paper, showing how much variation
there is even in a narrow band of composition
variation). While B4s is a valid design model,
B4 should be used for detailed analysis and
structural assessment if the composition is
known.
Fig. 12 Development of
residuals with logðt � t0Þaccording to prediction
model
Materials and Structures (2015) 48:815–833 831
5. Even after this extensive optimization effort, there
is still too much uncertainty in creep prediction.
The main cause of uncertainty is the intrinsic
scatter due to small variations in composition.
6. The basic parameters q1; . . .q5 of model B4 can be
updated in the same way as shown for Model B3,
either by Bayesian probabilistic inference [3, 46,
47] or by linear regression in which only scaling
factors for the initial value and one common factor
for all of the subsequent creep terms are deter-
mined [4]. However, based on the experience
from the work on model B4, the latter update
should be regarded with caution since short-term
data used in the update do not provide enough
information for the long-term functional form,
especially for the drying part of the compliance
function. To maintain the correct multi-decade
shape of the compliance function and ensure that
the term corresponding to the correct mechanisms
be assigned to each parameter, only the entire
compliance may be scaled. A selective update of
parameters associated with a certain time range is
possible but may be undertaken only with great
care.
7. Future adjustments of model B4 should be made
when significant new data become available. The
greatest progress could be achieved by new multi-
decade data from bridges and other structures,
provided that their documentation would suffice
for inverse analysis.
Acknowledgments Generous financial support from the U.S.
Department of Transportation, provided through Grant 20778
from the Infrastructure Technology Institute of Northwestern
University, is gratefully appreciated. So is an additional support
under the U.S. National Science Foundation Grants CMMI-
1129449 and CMMI-1153494 to Northwestern University.
Thanks are also due for additional financial support by the
Austrian Federal Ministry of Economy, Family and Youth and
the National Foundation for Research, Technology and
Development and from the Austrian Science Fund (FWF) in
the form of Erwin Schrodinger Scholarship J3619-N13 granted
to the first author.
References
1. Hubler MH, Wendner R, Bazant Z P (2014) Comprehensive
database for concrete creep and shrinkage: analysis and
recommendations for testing and recording. ACI Mater J
2. Bazant ZP, Hubler MH, Wendner R (2014) Model B4 for
creep, drying shrinkage and autogenous shrinkage of normal
and high-strength concretes with multi-decade applicability.
TC-242-MDC multidecade creep and shrinkage of concrete:
material model and structural analysis. RILEM Mater Struct
3. Wendner R, Hubler MH, Bazant ZP (2014) Optimization
method, choice of form and uncertainty quantification of
model B4 using laboratory and multi-decade bridge dat-
abases. RILEM Mater Struct
4. Bazant ZP, Baweja S (1995) Creep and shrinkage prediction
model for analysis and design of concrete structures: model
B3 (RILEM recommendation). Mater Struct 28(6):357–365
Errata, 29, p. 126
5. Bazant ZP, Baweja S (1995) Justification and refinement of
Model B3 for concrete creep and shrinkage. 1. Statistics
andsensitivity. Mater Struct (RILEM, Paris) 28(7):415–430
6. Bazant ZP, Baweja S (1995) Justification and refinement of
Model B3 for concrete creep and shrinkage. 2. Updating and
theoretical basis. Mater Struct (RILEM, Paris) 28(8):
488–495
7. Bazant ZP, Baweja S (2000) Creep and shrinkage prediction
model for analysis and design of concrete structures: model
B3. In: Al-Manaseer A (ed) Adam Neville symposium:
creep and shrinkage-structural design effects, ACI SP-194.
American Concrete Institute, Farmington Hills, pp 1–83
8. Bazant ZP, Hubler MH, Yu Q (2011) Pervasiveness of
excessive segmental bridge deflections: wake-up call for
creep. ACI Struct J 108(6):766–774
9. Bazant ZP, Prasannan S (1989) Solidification theory for
concrete creep: I. Formulation. J Eng Mech ASCE 115(8):
1691–1703
10. Bazant ZP, Osman E, Thonguthai W (1976) Practical for-
mulation of shrinkage and creep in concrete. Mater Struct
(RILEM, Parisi) 9(54):395–406
11. Wittmann F (1971) Kriechverformung des Betons unter
statischer und unter dynamischer Belastung. Rheol Acta
10:422–428
12. Cinlar E, Bazant ZP, Osman E (1977) Stochastic process for
extrapolating concrete creep. J Eng Mech Div ASCE
103:1069–1088
13. Bazant ZP, Panula L (1978) Practical prediction of time-
dependent deformations of concrete. Mater Struct (RILEM,
Paris) 11:307–316, 317–328, 415–424
14. Bazant ZP, Carreira D, Walser A (1975) Creep and
shrinkage in reactor containment shells. J Struct Div Am
Soc Civ Eng 101:2117–2131
15. Bazant ZP, Osman E (1976) Double power law for basic
creep of concrete. Mater Struct (RILEM, Parisi) 9(49):3–11
16. Bazant ZP, Osman E (1975) On the choice of creep function
for standard recommendations on practical analysis of
structures. Cem Concr Res 5:129–138, 631–641; 6:149–
153; 7:119–130
17. Committee RILEM, TC-69 (1988) State of the art in
mathematical modeling of creep and shrinkage of concrete.
Mathematical modeling of creep and shrinkage of concrete.
Wiley, New York, pp 57–215
18. Bazant ZP, Hauggaard AB, Baweja S, Ulm F-J (1997)
Microprestress-solidification theory for concrete creep.
I. Aging and drying effects and II. Algorithm and verification,
ASCE. J Eng Mech ASCE 123 (11):1188–1194, 1195–1201
19. Committee ACI 209 (1971) Prediction of concrete creep,
shrinkage and temperature effectson concrete structures. In:
Designing for effects of concrete creep, shrinkage and
832 Materials and Structures (2015) 48:815–833

temperature ACI-SP27. American Concrete Institute,
Detroit, pp 51–93
20. ACI Committee 209 (1992) Prediction of creep, shrinkage
and temperature effects in concrete structures, ACI 209
R-92, American Concrete Institute, Detroit 1992 (minor
update of original 1971 version)
21. ACI Committee 209 (2008) Guide for modeling and cal-
culating shrinkage and creep in hardened concrete. ACI
Report 209.2R-08, Farmington Hills
22. FIB (1999) Structural concrete: textbook on behaviour,
design and performance, updated knowledge of the CEB/
FIP model Code 1990. Bulletin No. 2. Federation interna-
tionale du beton (FIB), Lausanne 1:35–52
23. Gardner NJ (2000) Design provisions of shrinkage and
creep of concrete. In: Al-Manaseer A (ed) Adam Neville
symposium: creep and shrinkage-structural design effect.
American Concrete Institute, Farmington Hills, pp 101–104
24. Gardner NJ, Lockman MJ (2001) Design provisions of
shrinkage and creep of normal-strength concrete. ACI Mater
J 98:159–167
25. FIB (2010) Model code 2010, Fe de ration internationale de
beton, Lausanne
26. Jirasek M, Bazant ZP (2002) Inelastic analysis of structures.
Wiley, London
27. Bazant ZP (1972) Prediction of concrete creep effects using
age-adjusted effective modulus method. Am Concr Inst J
69:212–217
28. Bazant ZP (1975) Theory of creep and shrinkage in concrete
structures: a precis of recent developments. In: Nemat-
Nasser S (ed) Mechanics today (American Academy of
Mechanical). Pergamon Press, Bazant
29. Trost H (1967) Auswirkungen des sauperpositionsprinzip auf
kriech- und relaxations-probleme bei beton und spannbeton.
Beton- und Stahlbetonbau 62(230–238):261–269
30. Wang J, Yan P, Yu H (2007) Apparent activiation energy of
concrete in early age determined by adiabatic test. J Wuhan
Univ Technol 22(3):537–541
31. Poole JL et al (2007) Methods for calculating activation
energy Portland Cement. ACI Mater J 104(1):303–311
32. Mindess S, Young JF, Darwin D (2003) Concrete, 2nd edn.
Prentice Hall, Englewood Cliffs
33. Rodway LE, Fedirko WM (1989) Superplasticized high
volume fly ash concrete. In: Proceedings of the 3rd inter-
national conference fly ash, silica fume, slag and natural
pozzolans. Trondheim, Norway, pp 98–112
34. Al-Omaishi N, Tadros MK, Seguirant SJ (2009) Elasticity
modulus, shrinkage, and creep of high-strength concrete as
adopted by ASSHTO. PCI J 54:44–63
35. Persson B (2001) A comparison between mechanical
properties of self-compacting concrete and teh corre-
sponding properties of normal concrete. Cem Concr Res
31:193–198
36. Alexander MG (1996) Aggregates and the deformation
properties of concrete. ACI Mater J 93(6):569–577
37. Bazant ZP, Yu Q, Li G-H (2012) Excessive long-term
deflections of prestressed box girder. Part I: record-span
bridge in Palau and other paradigms and Part II: numerical
analysis and lessons learned. ASCE J Struct Eng 138(6):
676–686, 687–696
38. Muller HS (1993) Considerations on the development of a
database on creep and shrinkage tests. In: Bazant ZP, Carol I
(eds) Proceedings of 5th international RILEM symposium
on creep and shrinkage of concrete (ConCreep 5), U.P.C.,
Barcelona, E & FN Spon, London, pp 859–872
39. Vandamme M, Zhang Q, Carrier B, Ulm F-J, Pellenq R, van
Damme H, Le Roy R, Zuber B, Gartner E, Termkhajornkit P
(2013) Creep properties of cementitious materials from
indentation testing: signification, influence of relative
humidity, and analogy between C-S-H and clays, keynote
presentation, CONCREEP 9, Boston
40. Hubler MH, Wendner R, Bazant ZP (2014) Statistical jus-
tification of model B4 for drying and autogenous shrinkage
of concrete and comparisons to other models. RILEM Mater
Struct
41. Bazant ZP, Yu Q (2013) Relaxation of prestressing steel at
varying strain and temperature: viscoplastic constitutive
relation. ASCE J Eng Mech 139(7):814–823
42. Strauss A, Hoffmann S, Wendner R, Bergmeister K (2009)
Structural assessment and reliability analysis for existing
engineering structures, applications for real structures.
Struct Infrastruct Eng 5(4):277–286
43. Wendner R, Strauss A, Guggenberger T, Bergmeister K,
Teply B (2010) Approach for the assessment of concrete
structures subjected to chloride induced deterioration.
Beton- und Stahlbetonbau, 105. Heft 12:778–786
44. Strauss A, Wendner R, Bergmeister K, Costa C (2013)
Numerically and experimentally based reliability assess-
ment of a concrete bridge subjected to chloride induced
deterioration. J Infrastruct Syst 19(2):166–175
45. Yu Q, Bazant ZP, Wendner R (2012) Improved algorithm
for efficient and realistic creep: analysis of large creep-
sensitive concrete structures. ACI Struct J 109(5):665–676
46. Bazant ZP, Chern J-C (1984) Bayesian statistical prediction
of concrete creep and shrinkage. Am Concr Inst J 81:319–330
47. Bazant ZP, Kim Jenn-Keun (1987) Statistical extrapolation
of shrinkage data—Part II: Bayesian updating. ACI Mater J
84:83–91
48. Bazant ZP (1975) Theory of creep and shrinkage in concrete
structures: a precis of recent developments. Mech Today
2:1–93
49. Bazant ZP (1982) Mathematical models of nonlinear
behavior and fracture of concrete. In: Schwer LE (ed) Non-
linear numerical analysis of reinforced concrete. American
Society of Mechanical Engineers, New York, pp 1–25
50. Bazant ZP, Yu Q, Li Q, Klein G-H, Krıstek V (2010)
Excessive deflections of record- span prestressed box gir-
der: lessons learned from the collapse of the Koror–Bab-
eldaob bridge in Palau. ACI Concr Int 32(6):44–52
51. Dilger WH, Wang C (2000) Creep and shrinkage of high-
performance concrete. In: Adam Nevillle Symposium:
creep and shrinkage-structural design effects. ACI interna-
tional, Farmington Hills
52. Bazant ZP, Xi Y, Baweja S (1993) Improved prediction
model for time-dependent deformations of concrete: Part
7—short form of BP-KX model, statistics and extrapolation
of short-term data. Mater Struct 26:567–574
53. RILEM Committee TC-69 (1987) Conclusions for struc-
tural analysis and formulation of standard design recom-
mendations, Mater Struct (RILEM, Paris) 20: 395–398;
reprinted in ACI Mater J 84:578–581
Materials and Structures (2015) 48:815–833 833